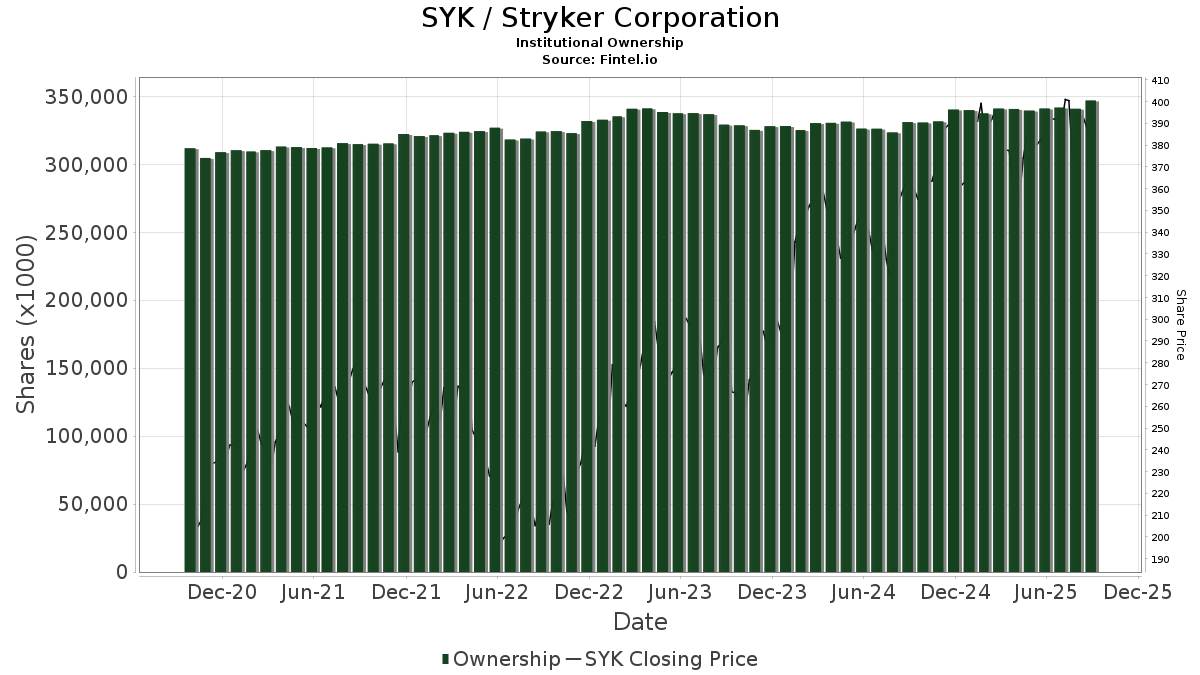
Grundlæggende statistik
| Institutionelle aktier (lange) | 301.755.995 - 78,79% (ex 13D/G) - change of -38,11MM shares -11,21% MRQ |
| Institutionel værdi (lang) | $ 99.936.135 USD ($1000) |
Institutionelt ejerskab og aktionærer
Stryker Corporation (US:SYK) har 2339 institutionelle ejere og aktionærer, der har indsendt 13D/G- eller 13F-formularer til Securities Exchange Commission (SEC). Disse institutioner har i alt 301,755,995 aktier. Største aktionærer omfatter Vanguard Group Inc, BlackRock, Inc., Greenleaf Trust, State Street Corp, Jpmorgan Chase & Co, Price T Rowe Associates Inc /md/, Geode Capital Management, Llc, Wellington Management Group Llp, Alliancebernstein L.p., and Morgan Stanley .
Stryker Corporation (NYSE:SYK) institutionel ejerskabsstruktur viser aktuelle positioner i virksomheden efter institutioner og fonde, samt seneste ændringer i positionsstørrelse. Større aktionærer kan omfatte individuelle investorer, investeringsforeninger, hedgefonde eller institutioner. Skema 13D angiver, at investoren besidder (eller besidder) mere end 5 % af virksomheden og har til hensigt (eller har til hensigt at) aktivt at forfølge en ændring i forretningsstrategi. Skema 13G indikerer en passiv investering på over 5%.
The share price as of April 2, 2026 is 331,54 / share. Previously, on April 4, 2025, the share price was 345,80 / share. This represents a decline of 4,12% over that period.
Fondens stemningsscore
Fund Sentiment Score (fka Ownership Accumulation Score) finder de aktier, der bliver mest købt af fonde. Det er resultatet af en sofistikeret, multi-faktor kvantitativ model, der identificerer virksomheder med de højeste niveauer af institutionel akkumulering. Scoringsmodellen bruger en kombination af den samlede stigning i oplyste ejere, ændringerne i porteføljeallokeringer i disse ejere og andre målinger. Tallet går fra 0 til 100, hvor højere tal indikerer et højere niveau af akkumulering for sine jævnaldrende, og 50 er gennemsnittet.
Opdateringsfrekvens: Dagligt
Se Ownership Explorer, som giver en liste over højest rangerende virksomheder.
AI+ Ask Fintel’s AI assistant about Stryker Corporation.
Select a question to share a public post with an AI-crafted answer.
Thinking of good questions…
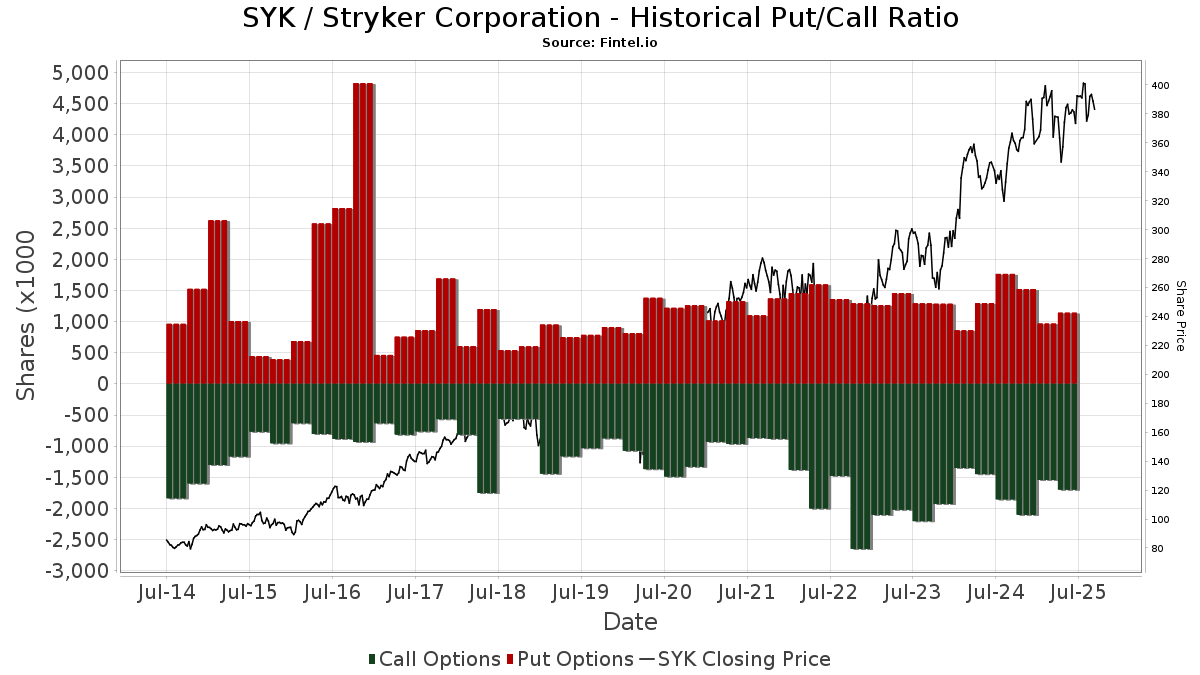
Institutionel Put/Call-forhold
Ud over at indberette standardaktie- og gældsudstedelser skal institutter med mere end 100 mill. aktiver under forvaltning også oplyse deres put- og call-optionsbeholdninger. Da salgsoptioner generelt indikerer negativ stemning, og købsoptioner indikerer positiv stemning, kan vi få en fornemmelse af den overordnede institutionelle stemning ved at plotte forholdet mellem put og kald. Diagrammet til højre viser det historiske put/call-forhold for dette instrument.
Brug af Put/Call Ratio som en indikator for investorernes stemning overvinder en af de vigtigste mangler ved at bruge totalt institutionelt ejerskab, som er, at en betydelig mængde af aktiver under forvaltning investeres passivt for at spore indekser. Passivt forvaltede fonde køber typisk ikke optioner, så indikatoren for put/call-forholdet følger mere nøje følelsen af aktivt forvaltede fonde.
13D/G-arkivering
Vi præsenterer 13D/G ansøgninger separat fra 13F ansøgninger på grund af den forskellige behandling af SEC. 13D/G-ansøgninger kan indgives af grupper af investorer (med én ledende), hvorimod 13F-ansøgninger ikke kan. Dette resulterer i situationer, hvor en investor kan indsende en 13D/G, der rapporterer én værdi for de samlede aktier (der repræsenterer alle de aktier, der ejes af investorgruppen), men derefter indsender en 13F, der rapporterer en anden værdi for de samlede aktier (der udelukkende repræsenterer deres egne) ejendomsret). Det betyder, at aktieejerskab af 13D/G-arkiver og 13F-arkiveringer ofte ikke er direkte sammenlignelige, så vi præsenterer dem separat.
Bemærk: Fra den 16. maj 2021 viser vi ikke længere ejere, der ikke har indsendt en 13D/G inden for det seneste år. Tidligere viste vi den fulde historie af 13D/G-arkiver. Generelt skal enheder, der er forpligtet til at indgive 13D/G-ansøgninger, indgive mindst årligt, før de indsender en afsluttende ansøgning. Dog forlader fonde nogle gange positioner uden at indsende en afsluttende ansøgning (dvs. de afvikler), så visning af den fulde historie resulterede nogle gange i forvirring om det nuværende ejerskab. For at undgå forvirring viser vi nu kun 'aktuelle' ejere - det vil sige - ejere, der har anmeldt inden for det seneste år.
Upgrade to unlock premium data.
| Fil dato | Form | Investor | Forrige Aktier |
Seneste Aktier |
Δ Aktier (Procent) |
Ejendomsret (Procent) |
Δ Ejerskab (Procent) |
|
|---|---|---|---|---|---|---|---|---|
| 2026-02-11 | GREENLEAF TRUST | 17,981,458 | 16,801,654 | -6.56 | 4.40 | -6.38 |
13F og NPORT arkivering
Detaljer om 13F-arkivering er gratis. Detaljer om NP-ansøgninger kræver et premium-medlemskab. Grønne rækker angiver nye positioner. Røde rækker angiver lukkede positioner. Klik på linket ikon for at se den fulde transaktionshistorik.
Opgrader
for at låse premium-data op og eksportere til Excel ![]() .
.
Important Note
In an effort to reduce load times for our mobile users, we are testing some ways to deliver lighter pages.
In this first test, we will deliver only the most recent 750 transactions (out of 2687 for this stock). If you are interested in loading *all* the transactions for this company, click the "load all" button below. This is just a test and if you don't like it, please let us know by submitting some gentle feedback via the link at the bottom of this page.
Load All| Fil dato | Kilde | Investor | Type | Gennemsnitlig pris (Øst) |
Aktier | Δ Aktier (%) |
Rapporteret Værdi ($1000) |
Δ Værdi (%) |
Port Alloc (%) |
|
|---|---|---|---|---|---|---|---|---|---|---|
| 2026-02-12 | 13F | M&G Plc | 30.424 | 21,28 | 10.679 | 15,05 | ||||
| 2026-02-09 | 13F | Todd Asset Management Llc | 0 | -100,00 | 0 | |||||
| 2026-02-13 | 13F | Blueshift Asset Management, LLC | 2.089 | 734 | ||||||
| 2026-02-17 | 13F | MIRAE ASSET GLOBAL ETFS HOLDINGS Ltd. | 50.583 | -8,17 | 17.778 | -12,69 | ||||
| 2025-11-13 | 13F | Glenmede Investment Management, LP | 66.674 | -1,57 | 24.647 | -8,03 | ||||
| 2026-01-29 | 13F | Dunhill Financial, LLC | 89 | 2,30 | 31 | -3,12 | ||||
| 2026-02-17 | 13F | Lombard Odier Asset Management (Europe) Ltd | 10.000 | 0,00 | 3.515 | -4,92 | ||||
| 2026-02-20 | 13F | Kovitz Investment Group Partners, LLC | 37.445 | -2,52 | 13.161 | -7,34 | ||||
| 2026-01-20 | 13F | Thurston, Springer, Miller, Herd & Titak, Inc. | 3.742 | 255,03 | 1.315 | 238,05 | ||||
| 2026-02-17 | 13F | Coppell Advisory Solutions LLC | 2.358 | 22,37 | 835 | 17,28 | ||||
| 2026-02-04 | 13F | Liberty Wealth Management Llc | 639 | 0,16 | 225 | -4,68 | ||||
| 2026-02-04 | 13F | Valeo Financial Advisors, LLC | 8.123 | 1,33 | 2.855 | -3,68 | ||||
| 2026-01-07 | 13F | IMPACTfolio, LLC | 1.754 | 0,00 | 616 | -4,94 | ||||
| 2026-02-06 | 13F | Mach-1 Financial Group, Inc. | 0 | -100,00 | 0 | -100,00 | ||||
| 2026-02-17 | 13F | one8zero8, LLC | 9.420 | -0,53 | 3.311 | -5,43 | ||||
| 2026-03-17 | 13F | Stance Capital Llc | 12.517 | 4,76 | 4.399 | -0,38 | ||||
| 2026-01-22 | 13F | Investment Advisory Services Inc /tx /adv | 9.786 | 0,03 | 3.439 | -4,89 | ||||
| 2026-01-07 | 13F | New England Research & Management, Inc. | 4.300 | 1.511 | ||||||
| 2026-02-17 | 13F | Private Harbour Investment Management & Counsel, LLC | 3.908 | -0,51 | 1.374 | -5,44 | ||||
| 2026-01-30 | 13F | Turning Point Benefit Group, Inc. | 17 | 325,00 | 6 | 400,00 | ||||
| 2026-02-09 | 13F | Nia Impact Advisors, Llc | 8.307 | -2,79 | 2.920 | -7,57 | ||||
| 2026-02-12 | 13F | SWAN Capital LLC | 2 | 0,00 | 1 | |||||
| 2026-01-09 | 13F | Cultivar Capital, Inc. | 600 | 0,00 | 211 | -4,98 | ||||
| 2026-02-12 | 13F | Miller Financial Services LLC | 0 | -100,00 | 0 | |||||
| 2026-01-26 | 13F | Whittier Trust Co | 4.901 | 5,92 | 1.796 | 4,73 | ||||
| 2025-11-17 | 13F | IMS Capital Management | 815 | 0,00 | 301 | -6,52 | ||||
| 2026-02-17 | 13F | Per Stirling Capital Management, LLC. | 0 | -100,00 | 0 | |||||
| 2026-01-28 | 13F | Old National Bancorp /in/ | 9.132 | -4,97 | 3.210 | -9,66 | ||||
| 2026-01-30 | 13F | American Capital Advisory, LLC | 5 | -16,67 | 2 | -50,00 | ||||
| 2026-01-06 | 13F | Farmers Trust Co | 2.223 | -0,54 | 781 | -5,45 | ||||
| 2026-02-09 | 13F | Hartline Investment Corp/ | 6.138 | -2,39 | 2.157 | -7,19 | ||||
| 2026-02-12 | 13F | Founders Financial Alliance, LLC | 1.076 | -0,09 | 378 | -4,79 | ||||
| 2026-02-12 | 13F | Raiffeisen Bank International AG | 101.593 | 15,08 | 35.976 | 10,18 | ||||
| 2026-01-14 | 13F | Verum Partners LLC | 731 | -0,41 | 257 | -5,54 | ||||
| 2026-01-16 | 13F | First Community Trust Na | 125 | 0,00 | 44 | -6,52 | ||||
| 2026-02-10 | 13F | Pinnacle West Asset Management, Inc. | 1.035 | 5,61 | 0 | |||||
| 2026-02-13 | 13F | SYM FINANCIAL Corp | 1.397 | -0,99 | 491 | -5,76 | ||||
| 2026-02-06 | 13F | Payden & Rygel | 31.100 | -3,72 | 11 | -9,09 | ||||
| 2026-02-17 | 13F | Aquatic Capital Management LLC | 33.250 | 113,46 | 11.686 | 102,95 | ||||
| 2026-02-17 | 13F | Oxford Asset Management Llp | 3.238 | 1.138 | ||||||
| 2025-10-24 | 13F | ORG Wealth Partners, LLC | 0 | -100,00 | 0 | |||||
| 2026-02-03 | 13F | Gateway Investment Advisers Llc | 1.380 | -17,07 | 485 | -21,14 | ||||
| 2026-01-13 | 13F | Guerra Pan Advisors, Llc | 1.119 | 0,00 | 393 | -4,84 | ||||
| 2026-01-27 | 13F | Berger Financial Group, Inc | 4.205 | -3,40 | 1.478 | -8,20 | ||||
| 2026-02-10 | 13F | Mitchell Capital Management Co | 0 | -100,00 | 0 | |||||
| 2026-01-15 | 13F | Ironwood Financial, llc | 939 | 0,00 | 339 | -2,31 | ||||
| 2026-01-29 | 13F | Camelot Portfolios, LLC | 881 | 0,00 | 310 | -4,92 | ||||
| 2026-01-23 | 13F | Rede Wealth, LLC | 0 | -100,00 | 0 | |||||
| 2025-10-30 | 13F | CBOE Vest Financial, LLC | 0 | -100,00 | 0 | |||||
| 2026-02-06 | 13F | Twin Capital Management Inc | 4.869 | -1,10 | 1.711 | -5,94 | ||||
| 2026-02-12 | 13F | Federation des caisses Desjardins du Quebec | 104.160 | -37,81 | 36.609 | -40,87 | ||||
| 2026-02-13 | 13F | First Trust Advisors Lp | 45.238 | -35,66 | 15.900 | -38,83 | ||||
| 2026-02-17 | 13F | CHICAGO TRUST Co NA | 0 | -100,00 | 0 | |||||
| 2026-01-29 | 13F | Northern Oak Wealth Management Inc | 2.175 | -1,72 | 764 | -6,60 | ||||
| 2026-01-15 | 13F | Nikulski Financial, Inc. | 7.113 | 112,77 | 2.500 | 102,27 | ||||
| 2026-02-06 | 13F | Principle Wealth Partners Llc | 2.376 | 0,42 | 835 | -4,46 | ||||
| 2026-01-15 | 13F | Nisa Investment Advisors, Llc | 101.631 | -2,64 | 35.810 | -7,41 | ||||
| 2026-02-04 | 13F | Wsfs Capital Management, Llc | 3.680 | 7,26 | 1.293 | 1,97 | ||||
| 2026-02-03 | 13F | Patten & Patten Inc/tn | 723 | -72,19 | 254 | 19,81 | ||||
| 2026-02-04 | 13F | Pacer Advisors, Inc. | 0 | -100,00 | 0 | |||||
| 2026-02-09 | 13F | Allen Capital Group, LLC | 1.898 | 4,69 | 667 | -0,45 | ||||
| 2026-01-27 | 13F | Financial Management Professionals, Inc. | 536 | -2,37 | 189 | -7,39 | ||||
| 2026-02-13 | 13F | Truvestments Capital Llc | 55 | 0,00 | 19 | -5,00 | ||||
| 2026-01-26 | 13F | Merit Financial Group, LLC | 20.268 | -5,90 | 7.124 | -10,54 | ||||
| 2026-01-23 | 13F | Armbruster Capital Management, Inc. | 600 | 0,00 | 211 | -4,98 | ||||
| 2026-02-17 | 13F | Sherbrooke Park Advisers Llc | 0 | -100,00 | 0 | |||||
| 2026-01-27 | 13F | Ninety One UK Ltd | 57.619 | -2,85 | 20.251 | -7,63 | ||||
| 2026-02-02 | 13F | Strs Ohio | 102.199 | -0,14 | 35.920 | -5,06 | ||||
| 2026-02-05 | 13F | Conning Inc. | 1.865 | -17,44 | 655 | -21,56 | ||||
| 2026-01-26 | 13F | Old Point Trust & Financial Services N A | 182 | 0,00 | 64 | -5,97 | ||||
| 2025-11-06 | 13F | Claudia M.p. Batlle, Crp (r) Llc | 0 | -100,00 | 0 | |||||
| 2026-02-17 | 13F | Perbak Capital Partners LLP | 0 | -100,00 | 0 | |||||
| 2025-10-09 | 13F | Pacifica Partners Inc. | 0 | -100,00 | 0 | -100,00 | ||||
| 2026-02-10 | 13F | Holderness Investments Co | 3.329 | -0,75 | 1.170 | -5,57 | ||||
| 2026-01-21 | 13F | Oak Thistle LLC | 0 | -100,00 | 0 | |||||
| 2026-02-09 | 13F | MQS Management LLC | 2.405 | 17,89 | 845 | 12,07 | ||||
| 2026-02-13 | 13F | Alchemi Wealth, LLC | 723 | 254 | ||||||
| 2026-01-07 | 13F | Harbour Capital Advisors, LLC | 0 | -100,00 | 0 | |||||
| 2026-02-03 | 13F | RB Capital Management, LLC | 901 | -4,25 | 317 | -8,93 | ||||
| 2026-02-09 | 13F | William Mack & Associates, Inc. | 1.583 | -0,38 | 556 | -5,28 | ||||
| 2026-02-17 | 13F | XTX Topco Ltd | 10.208 | 3.588 | ||||||
| 2026-01-20 | 13F | Oakmont Corp | 100 | 0,00 | 35 | -2,78 | ||||
| 2026-02-17 | 13F | Riverview Capital Advisers, LLC | 1.370 | -68,28 | 482 | -69,86 | ||||
| 2026-02-12 | 13F | Strive Asset Management, LLC | 0 | -100,00 | 0 | |||||
| 2026-01-05 | 13F | Park National Corp /oh/ | 45.802 | -1,23 | 16.098 | -6,09 | ||||
| 2026-02-13 | 13F | Vivaldi Capital Management, LLC | 665 | -2,49 | 234 | -7,54 | ||||
| 2025-10-08 | 13F | Country Club Bank /gfn | 5.994 | -1,79 | 2.217 | -7,66 | ||||
| 2026-01-08 | 13F | Signet Financial Management, Llc | 652 | -0,31 | 229 | -4,98 | ||||
| 2026-02-10 | 13F | Anchor Capital Advisors Llc | 3.120 | -0,16 | 1.097 | -5,11 | ||||
| 2026-02-12 | 13F | Wealthspire Advisors, LLC | 9.989 | -11,91 | 3.511 | -16,25 | ||||
| 2026-02-10 | 13F | Sivia Capital Partners, LLC | 2.688 | 119,25 | 945 | 108,39 | ||||
| 2026-02-11 | 13F | Waddell & Associates, Llc | 891 | 2,77 | 313 | -2,19 | ||||
| 2026-02-13 | 13F | Korea Investment CORP | 165.891 | -26,35 | 58.306 | -29,98 | ||||
| 2026-03-06 | 13F | Brighton Securities Corp. | 615 | -49,47 | 216 | -50,68 | ||||
| 2026-02-17 | 13F | Balyasny Asset Management Llc | 6.105 | 12,91 | 2.146 | 7,36 | ||||
| 2026-02-17 | 13F | Balyasny Asset Management Llc | Call | 1.000 | -60,00 | 351 | -62,01 | |||
| 2026-01-29 | 13F | Copeland Capital Management, LLC | 17 | 0,00 | 6 | -16,67 | ||||
| 2026-02-17 | 13F | Balyasny Asset Management Llc | Put | 1.300 | -84,15 | 457 | -84,96 | |||
| 2026-02-11 | 13F | Clearbridge Investments, LLC | 1.701.362 | -5,86 | 597.978 | -10,49 | ||||
| 2026-02-13 | 13F | Treasurer of the State of North Carolina | 144.217 | -6,81 | 51 | -12,28 | ||||
| 2026-01-12 | 13F | Certified Advisory Corp | 592 | 0,17 | 208 | -4,59 | ||||
| 2026-01-30 | 13F | R Squared Ltd | 4.314 | 7,10 | 1.516 | 1,81 | ||||
| 2026-02-05 | 13F | Beese Fulmer Investment Management, Inc. | 45.705 | 3,36 | 16.104 | -1,49 | ||||
| 2026-01-21 | 13F | Country Trust Bank | 40 | 0,00 | 14 | 0,00 | ||||
| 2026-02-11 | 13F | MidWestOne Financial Group, Inc. | 1.920 | 126,15 | 675 | 115,34 | ||||
| 2026-02-09 | 13F | Severin Investments, LLC | 1.554 | 3,67 | 546 | -1,44 | ||||
| 2026-02-13 | 13F | Platform Technology Partners | 769 | -5,53 | 270 | -10,00 | ||||
| 2026-02-13 | 13F | 71 West Capital Partners | 1.651 | 580 | ||||||
| 2026-01-26 | 13F | AE Wealth Management LLC | 5.706 | 30,66 | 2.006 | 24,23 | ||||
| 2026-01-05 | 13F | GAMMA Investing LLC | 5.224 | -13,52 | 1.836 | -17,78 | ||||
| 2026-01-23 | 13F | Watershed Private Wealth Llc | 744 | 0,00 | 261 | -5,09 | ||||
| 2026-02-17 | 13F/A | Beverly Hills Private Wealth, LLC | 1.035 | 0,00 | 364 | -4,97 | ||||
| 2026-02-13 | 13F | OpenArc Corporate Advisory, LLC | 14.128 | 4.966 | ||||||
| 2026-02-13 | 13F | Southeast Asset Advisors Inc. | 0 | -100,00 | 0 | |||||
| 2026-02-14 | 13F | Elefante Mark B | 855 | 0,00 | 301 | -5,06 | ||||
| 2026-01-28 | 13F | West Michigan Advisors, Llc | 7.468 | 0,40 | 2.631 | -4,50 | ||||
| 2026-02-11 | 13F | Capital Wealth Planning, LLC | 15.536 | 2,37 | 5.460 | -2,67 | ||||
| 2026-02-10 | 13F | Daiwa Securities Group Inc. | 62.831 | 2,71 | 22 | 0,00 | ||||
| 2026-02-09 | 13F | Mediolanum International Funds Ltd | 8.155 | 0,00 | 2.888 | -4,28 | ||||
| 2026-02-12 | 13F | Ardent Capital Management, Inc. | 32.266 | -0,62 | 11.341 | -5,52 | ||||
| 2026-01-27 | 13F | BankPlus Trust Department | 2.013 | 0,00 | 708 | -4,97 | ||||
| 2026-01-22 | 13F | Roffman Miller Associates Inc /pa/ | 128.226 | -1,02 | 45.068 | -5,89 | ||||
| 2026-02-11 | 13F | Manchester Capital Management LLC | 3.727 | 1.310 | ||||||
| 2026-02-11 | 13F | XML Financial, LLC | 3.058 | -7,67 | 1.075 | -12,25 | ||||
| 2026-02-11 | 13F | Clifford Swan Investment Counsel Llc | 79.208 | -1,38 | 27.839 | -6,24 | ||||
| 2026-01-05 | 13F | Park Avenue Securities Llc | 15.459 | 9,90 | 5 | 0,00 | ||||
| 2026-01-15 | 13F | Independent Investors Inc | 3.000 | 0,00 | 1.054 | -4,96 | ||||
| 2026-01-29 | 13F | Sanctuary Advisors, LLC | 61.657 | -4,13 | 21.671 | -8,85 | ||||
| 2026-02-04 | 13F | Community Bank, N.A. | 6.749 | 2,90 | 2.372 | -2,19 | ||||
| 2026-02-13 | 13F | GM Advisory Group, Inc. | 1.575 | 46,24 | 553 | 38,94 | ||||
| 2026-02-18 | 13F | NFP Retirement, Inc. | 0 | -100,00 | 0 | -100,00 | ||||
| 2026-01-27 | 13F | Old Second National Bank Of Aurora | 7.367 | 1,08 | 2.589 | -3,90 | ||||
| 2026-02-10 | 13F | Nelson Capital Management, LLC | 16.029 | -1,78 | 5.634 | -6,63 | ||||
| 2026-02-17 | 13F | Capstone Investment Advisors, Llc | 0 | -100,00 | 0 | -100,00 | ||||
| 2026-02-17 | 13F | Capstone Investment Advisors, Llc | Call | 0 | -100,00 | 0 | -100,00 | |||
| 2026-02-17 | 13F | Capstone Investment Advisors, Llc | Put | 0 | -100,00 | 0 | -100,00 | |||
| 2026-02-11 | 13F | OneAscent Financial Services LLC | 1.016 | 4,21 | 357 | -0,83 | ||||
| 2026-02-17 | 13F | ISAM Funds (UK) Ltd | 0 | -100,00 | 0 | |||||
| 2026-02-17 | 13F | Prosperity Bancshares Inc | 158 | 56 | ||||||
| 2026-02-05 | 13F | 1620 Investment Advisors, Inc. | 4 | -20,00 | 2 | 0,00 | ||||
| 2026-02-10 | 13F | Calton & Associates, Inc. | 665 | 10,83 | 234 | 5,43 | ||||
| 2026-02-20 | 13F | Ruggaard & Associates LLC | 579 | 204 | ||||||
| 2026-01-12 | 13F | World Equity Group, Inc. | 1.438 | -27,34 | 505 | -30,92 | ||||
| 2026-01-13 | 13F | Argentarii, LLC | 729 | 2,24 | 256 | -2,66 | ||||
| 2026-02-13 | 13F | Lord, Abbett & Co. Llc | 436.533 | -0,08 | 153 | -4,97 | ||||
| 2026-02-17 | 13F | Aqr Capital Management Llc | 275.843 | 102,44 | 96.951 | 92,48 | ||||
| 2026-01-28 | 13F | Campbell Capital Management Inc | 1.300 | 0,00 | 457 | -5,00 | ||||
| 2026-02-17 | 13F | Silvercrest Asset Management Group Llc | 212.003 | -2,43 | 74.513 | -7,23 | ||||
| 2026-01-20 | 13F | Moseley Investment Management Inc | 818 | 8,20 | 288 | 2,87 | ||||
| 2026-02-13 | 13F | Towarzystwo Funduszy Inwestycyjnych Pzu Sa | 0 | -100,00 | 0 | |||||
| 2026-01-20 | 13F | Steel Peak Wealth Management LLC | 0 | -100,00 | 0 | |||||
| 2026-02-06 | 13F | Redmont Wealth Advisors Llc | 30 | 0,00 | 11 | -9,09 | ||||
| 2026-01-20 | 13F | Hall Laurie J Trustee | 27.677 | 0,36 | 9.728 | -4,58 | ||||
| 2026-01-09 | 13F | SG Americas Securities, LLC | 566.524 | 676,79 | 199 | 665,38 | ||||
| 2026-02-09 | 13F | TrustBank | 2.009 | 706 | ||||||
| 2026-02-17 | 13F | Gladstone Institutional Advisory LLC | 2.452 | 1,74 | 862 | -3,26 | ||||
| 2026-02-17 | 13F | Hancock Whitney Corp | 1.695 | -2,59 | 596 | -7,47 | ||||
| 2026-01-21 | 13F | Stone House Investment Management, LLC | 13 | 8,33 | 5 | 0,00 | ||||
| 2026-01-21 | 13F | Cooke Wealth Management, LLC | 13.200 | 4.744 | ||||||
| 2026-01-30 | 13F | Bogart Wealth, LLC | 18.918 | 3,10 | 6.649 | -1,98 | ||||
| 2026-01-22 | 13F | Monte Financial Group, LLC | 4.239 | 8,19 | 1.490 | 2,83 | ||||
| 2026-02-06 | 13F | Nixon Peabody Trust Co | 42.794 | -2,36 | 15.041 | -7,17 | ||||
| 2026-02-09 | 13F | Onefund, Llc | 990 | 6,34 | 348 | 0,87 | ||||
| 2026-02-13 | 13F | Boston Partners | 810 | -5,70 | 285 | -10,41 | ||||
| 2026-02-10 | 13F | Linscomb & Williams, Inc. | 16.797 | 1,94 | 5.904 | -3,09 | ||||
| 2026-02-02 | 13F | Greenfield Savings Bank | 1.298 | 0,00 | 456 | -4,80 | ||||
| 2026-02-13 | 13F | Change Path, LLC | 5.162 | -1,58 | 1.814 | -6,40 | ||||
| 2025-11-04 | 13F | Gitterman Wealth Management, LLC | 0 | -100,00 | 0 | |||||
| 2026-02-09 | 13F | Smithfield Trust Co | 1.556 | -19,42 | 1 | |||||
| 2026-01-21 | 13F | Talbot Financial, LLC | 55.619 | -0,21 | 19.548 | -5,13 | ||||
| 2026-01-26 | 13F | Dakota Community Bank & Trust NA | 0 | -100,00 | 0 | |||||
| 2026-02-17 | 13F | LMR Partners LLP | Call | 9.800 | -23,44 | 3.444 | -27,20 | |||
| 2026-02-12 | 13F | Ci Investments Inc. | 131.267 | -55,87 | 46.136 | 42.226,61 | ||||
| 2026-01-23 | 13F | U.S. Capital Wealth Advisors, LLC | 2.254 | -1,27 | 792 | -6,05 | ||||
| 2026-03-12 | 13F | Nalls Sherbakoff Group, Llc | 0 | -100,00 | 0 | -100,00 | ||||
| 2026-01-30 | 13F | Torren Management, LLC | 244 | 86 | ||||||
| 2026-02-12 | 13F | William Allan, Llc | 3.550 | -6,06 | 1.248 | -10,74 | ||||
| 2025-10-29 | 13F | JCIC Asset Management Inc. | 0 | -100,00 | 0 | |||||
| 2026-02-02 | 13F | Advisors Preferred, LLC | 4.300 | 0,00 | 1.497 | -4,35 | ||||
| 2026-02-12 | 13F | Principal Securities, Inc. | 8.111 | 0,10 | 2.851 | -4,84 | ||||
| 2026-01-23 | 13F | Avion Wealth | 52 | 1,96 | 0 | |||||
| 2026-01-28 | 13F | CAPROCK Group, Inc. | 10.016 | -0,54 | 3.529 | -10,45 | ||||
| 2025-11-05 | 13F | Lokken Investment Group LLC | 4.414 | 4,55 | 1.632 | -2,34 | ||||
| 2026-01-22 | 13F | Addenda Capital Inc. | 30.728 | -1,54 | 10.823 | -6,37 | ||||
| 2026-02-11 | 13F | Strategy Asset Managers Llc | 1.972 | -5,06 | 693 | -9,65 | ||||
| 2026-01-06 | 13F | Advance Capital Management, Inc. | 1.131 | -4,96 | 398 | -9,57 | ||||
| 2026-01-27 | 13F | Wealth Enhancement Trust Services, Inc. | 7.754 | 2.725 | ||||||
| 2026-02-17 | 13F | LMR Partners LLP | Put | 2.800 | -74,07 | 984 | -75,35 | |||
| 2026-02-17 | 13F | LMR Partners LLP | 1.510 | -45,37 | 531 | -48,09 | ||||
| 2026-02-03 | 13F | Oak Family Advisors, Llc | 2.928 | 1.029 | ||||||
| 2026-02-18 | 13F | Caitlin John, LLC | 30 | 500,00 | 11 | 900,00 | ||||
| 2026-02-02 | 13F | Oppenheimer Asset Management Inc. | 23.641 | -26,89 | 8.309 | -30,49 | ||||
| 2026-02-11 | 13F | MCF Advisors LLC | 1.174 | 3,80 | 413 | -1,20 | ||||
| 2026-01-29 | 13F | Obermeyer Wood Investment Counsel, Lllp | 641 | -78,20 | 225 | -79,30 | ||||
| 2026-02-10 | 13F | KERR FINANCIAL PLANNING Corp | 0 | -100,00 | 0 | |||||
| 2026-01-21 | 13F | Clayton Financial Group LLC | 76 | 10,14 | 27 | 4,00 | ||||
| 2026-02-06 | 13F | Lazard Freres Gestion S.A.S. | 2.000 | 0,00 | 1 | |||||
| 2026-02-03 | 13F | Cheviot Value Management, LLC | 20 | 0,00 | 7 | 0,00 | ||||
| 2026-02-10 | 13F | Phillips Wealth Planners LLC | 691 | -12,31 | 251 | -13,19 | ||||
| 2026-02-17 | 13F | Rtw Investments, Lp | 245.000 | -50,00 | 86.110 | -52,46 | ||||
| 2026-02-10 | 13F | Eurizon Capital SGR S.p.A. | 97.632 | 34.333 | ||||||
| 2026-02-12 | 13F | TopTier Wealth Management, LLC | 1.053 | 370 | ||||||
| 2026-02-17 | 13F | Parkman Healthcare Partners LLC | 105.472 | 64,52 | 37.070 | 56,43 | ||||
| 2026-02-05 | 13F | Requisite Capital Management, LLC | 1.165 | 67,14 | 410 | 59,53 | ||||
| 2026-02-13 | 13F | Brown Advisory Inc | 46.366 | -2,14 | 16.296 | -6,95 | ||||
| 2025-11-14 | 13F | Wetherby Asset Management Inc | 11.312 | 2,64 | 4.182 | -4,11 | ||||
| 2025-11-14 | 13F | ICONIQ Capital, LLC | 0 | -100,00 | 0 | -100,00 | ||||
| 2026-01-27 | 13F | Regions Financial Corp | 320.940 | 6,37 | 112.801 | 1,13 | ||||
| 2026-02-10 | 13F | Wormser Freres Gestion | 28.298 | 4,09 | 9.949 | -1,64 | ||||
| 2026-02-14 | 13F | Rockefeller Capital Management L.P. | 85.581 | 13,29 | 30.084 | 7,73 | ||||
| 2026-01-28 | 13F | Fishman Jay A Ltd/mi | 75.342 | -1,11 | 26.480 | -5,98 | ||||
| 2026-02-03 | 13F | Hemenway Trust Co LLC | 2.325 | -0,64 | 817 | -5,55 | ||||
| 2026-01-29 | 13F | Mattern Capital Management, Llc | 26.439 | 3,41 | 9.293 | -1,68 | ||||
| 2026-02-12 | 13F | Rossby Financial, LCC | 451 | 6,62 | 159 | 2,60 | ||||
| 2026-02-04 | 13F | HighPoint Advisor Group LLC | 5.583 | 3,24 | 1.962 | -1,85 | ||||
| 2026-02-13 | 13F | Sofos Investments, Inc. | 7.940 | 7,63 | 2.791 | 2,31 | ||||
| 2026-01-28 | 13F | Cadinha & Co Llc | 871 | 0,00 | 306 | -4,67 | ||||
| 2026-02-09 | 13F | Fisher Asset Management, LLC | 3.117.283 | -5,83 | 1.095.632 | -10,46 | ||||
| 2026-02-10 | 13F | IFG Advisory, LLC | 3.032 | 1.066 | ||||||
| 2026-02-12 | 13F | Summit Financial, LLC | 15.371 | -9,39 | 5.416 | -13,65 | ||||
| 2026-02-12 | 13F | CIBC Private Wealth Group, LLC | 853.873 | -3,28 | 300.111 | -8,04 | ||||
| 2026-01-14 | 13F | Goelzer Investment Management, Inc. | 1.415 | 14,11 | 497 | 8,52 | ||||
| 2026-02-03 | 13F | NewEdge Wealth, LLC | 11.257 | 44,60 | 3.957 | 42,10 | ||||
| 2026-02-13 | 13F | Pitti Group Wealth Management, LLC | 0 | -100,00 | 0 | |||||
| 2026-02-11 | 13F | Boston Research & Management Inc | 4.354 | 0,00 | 2 | 0,00 | ||||
| 2026-01-28 | 13F | Cornerstone Advisory, LLC | 5.268 | 1,33 | 1.852 | -3,69 | ||||
| 2025-10-20 | 13F | Masso Torrence Wealth Management Inc. | 1.992 | -13,43 | 737 | -19,12 | ||||
| 2026-02-17 | 13F | Tcw Group Inc | 5.687 | 1.999 | ||||||
| 2026-01-28 | 13F | Marietta Wealth Management, LLC | 13.756 | 1,54 | 4.835 | -3,46 | ||||
| 2026-02-06 | 13F | Eqis Capital Management, Inc. | 0 | -100,00 | 0 | |||||
| 2026-02-04 | 13F | Kepler Cheuvreux (Suisse) SA | 3.201 | -95,77 | 1.125 | -95,98 | ||||
| 2026-02-12 | 13F | Bank Of Montreal /can/ | 500.801 | 4,68 | 176.017 | -0,47 | ||||
| 2026-02-06 | 13F | Verde Capital Management | 1.142 | 0,18 | 401 | -4,75 | ||||
| 2025-11-07 | 13F | Synovus Financial Corp | 12.041 | -2,68 | 4.455 | -9,06 | ||||
| 2026-01-14 | 13F | Tradewinds Capital Management, LLC | 187 | 0,00 | 66 | -5,80 | ||||
| 2026-01-26 | 13F | Chicago Capital, LLC | 196.271 | 0,33 | 68.983 | -4,61 | ||||
| 2026-01-27 | 13F | Hobart Private Capital, LLC | 1.313 | 35,92 | 461 | 29,13 | ||||
| 2026-01-21 | 13F | Runnymede Capital Advisors, Inc. | 9.255 | 3.253 | ||||||
| 2026-01-23 | 13F | Tectonic Advisors Llc | 1.976 | 1,65 | 694 | -3,34 | ||||
| 2026-02-06 | 13F | Fischer Financial Services, Inc. | 4.973 | -2,11 | 1.748 | -6,93 | ||||
| 2026-02-13 | 13F | State Street Corp | 15.254.407 | 2,08 | 5.374.731 | -2,92 | ||||
| 2025-10-16 | 13F | Townsend Asset Management Corp /nc/ /adv | 0 | -100,00 | 0 | |||||
| 2026-01-14 | 13F | Nova Wealth Management, Inc. | 6 | 0,00 | 2 | 0,00 | ||||
| 2026-02-26 | 13F | Anchor Investment Management, LLC | 9.405 | -0,16 | 3.306 | -5,08 | ||||
| 2025-10-16 | 13F | Lincoln Capital Corp | 0 | -100,00 | 0 | |||||
| 2026-01-29 | 13F | Quest 10 Wealth Builders, Inc. | 15 | 0,00 | 5 | 0,00 | ||||
| 2026-02-17 | 13F | EFG International AG | 11.363 | 3.993 | ||||||
| 2026-02-03 | 13F | Baker Boyer National Bank | 876 | 0,00 | 308 | -4,95 | ||||
| 2026-01-20 | 13F | Perpetual Ltd | 1.981 | 32,51 | 696 | 26,09 | ||||
| 2026-01-27 | 13F | Retirement Income Solutions, Inc | 794 | 2,45 | 279 | -2,45 | ||||
| 2026-01-12 | 13F | Shira Ridge Wealth Management | 913 | -3,59 | 321 | -8,57 | ||||
| 2026-01-07 | 13F | Sagespring Wealth Partners, Llc | 4.331 | 22,83 | 1.522 | 16,81 | ||||
| 2026-01-26 | 13F | PFG Investments, LLC | 5.046 | 0,50 | 1.774 | -4,42 | ||||
| 2026-01-16 | 13F | Catalina Capital Group, LLC | 896 | -0,55 | 315 | -5,71 | ||||
| 2026-02-12 | 13F | Oak Associates Ltd /oh/ | 4.221 | -1,93 | 1.484 | 148.200,00 | ||||
| 2026-01-29 | 13F | China Universal Asset Management Co., Ltd. | 3.600 | 80,00 | 1.268 | 71,35 | ||||
| 2026-01-26 | 13F | Provenance Wealth Advisors, LLC | 51 | 0,00 | 18 | -5,56 | ||||
| 2026-02-09 | 13F | Wellington Shields Capital Management, LLC | 1.450 | 0,00 | 510 | -5,04 | ||||
| 2026-02-18 | 13F | Beacon Pointe Advisors, LLC | 20.503 | 53,22 | 7.206 | 45,69 | ||||
| 2026-02-17 | 13F | Modern Wealth Management, LLC | 3.246 | 0,84 | 1.141 | -4,20 | ||||
| 2026-02-13 | 13F | AlTi Global, Inc. | 927 | -2,52 | 327 | -7,39 | ||||
| 2026-02-04 | 13F | Oregon Public Employees Retirement Fund | 39.395 | 0,32 | 13.846 | -4,62 | ||||
| 2026-02-13 | 13F | Ridge Creek Global, Inc | 4.003 | 1.407 | ||||||
| 2026-01-30 | 13F | Strategic Blueprint, LLC | 777 | -67,84 | 273 | -69,43 | ||||
| 2026-02-09 | 13F | Shufro Rose & Co Llc | 816 | -33,66 | 287 | -37,42 | ||||
| 2026-02-17 | 13F | Campion Asset Management LLC | 1.511 | -0,92 | 531 | -5,68 | ||||
| 2026-01-22 | 13F | City Holding Co | 120 | 757,14 | 42 | 740,00 | ||||
| 2026-01-21 | 13F | Fulton Breakefield Broenniman Llc | 50.123 | 41,26 | 17.617 | 34,31 | ||||
| 2026-01-27 | 13F | WealthCollab, LLC | 18 | 0,00 | 6 | 0,00 | ||||
| 2026-02-11 | 13F | Fjarde Ap-fonden /fourth Swedish National Pension Fund | 49.623 | 17.441 | ||||||
| 2026-01-08 | 13F | Versant Capital Management, Inc | 1.425 | 37,81 | 501 | 30,89 | ||||
| 2026-02-06 | 13F | Legacy Financial Group, Inc. | 573 | 0,00 | 201 | -4,74 | ||||
| 2026-02-03 | 13F | SBI Securities Co., Ltd. | 953 | 37,92 | 335 | 30,98 | ||||
| 2026-01-13 | 13F | Parsons Capital Management Inc/ri | 8.663 | -1,42 | 3.045 | -6,28 | ||||
| 2026-02-10 | 13F | Rational Advisors Llc | 125 | 13,64 | 44 | 7,50 | ||||
| 2026-01-28 | 13F | Mowery & Schoenfeld Wealth Management, LLC | 235 | 0,00 | 83 | -4,65 | ||||
| 2026-02-02 | 13F | Ellis Investment Partners, LLC | 1.855 | 0,11 | 652 | -4,82 | ||||
| 2026-02-13 | 13F | Rafferty Asset Management, LLC | 37.056 | -2,96 | 13.024 | -7,73 | ||||
| 2026-01-14 | 13F | A. D. Beadell Investment Counsel, Inc. | 3.820 | 0,00 | 1 | 0,00 | ||||
| 2025-11-14 | 13F | Cubist Systematic Strategies, LLC | Put | 4.100 | 24,24 | 1.516 | 16,09 | |||
| 2026-02-12 | 13F | Hamilton Point Investment Advisors, LLC | 817 | 0,00 | 288 | -4,97 | ||||
| 2026-02-17 | 13F | Bank Of America Corp /de/ | Put | 0 | -100,00 | 0 | ||||
| 2026-02-17 | 13F | Bank Of America Corp /de/ | Call | 0 | -100,00 | 0 | ||||
| 2025-11-14 | 13F | Cubist Systematic Strategies, LLC | Call | 3.500 | 25,00 | 1.294 | 16,80 | |||
| 2026-01-06 | 13F | Unique Wealth, Llc | 6.587 | -24,22 | 2.315 | -27,95 | ||||
| 2026-01-14 | 13F | Bourne Lent Asset Management Inc | 884 | 0,00 | 311 | -4,91 | ||||
| 2026-02-13 | 13F | Delos Wealth Advisors, LLC | 119 | 0,00 | 42 | -4,65 | ||||
| 2026-01-30 | 13F | Oakworth Capital, Inc. | 6.012 | 0,00 | 2.113 | -4,91 | ||||
| 2025-11-14 | 13F | Cubist Systematic Strategies, LLC | 35.270 | 13.038 | ||||||
| 2026-01-09 | 13F | Diversified Trust Co | 19.704 | 58,33 | 6.925 | 50,54 | ||||
| 2026-02-17 | 13F | Point72 Asset Management, L.P. | 0 | -100,00 | 0 | |||||
| 2025-11-07 | 13F | Beacon Capital Management, LLC | 0 | -100,00 | 0 | |||||
| 2026-01-30 | 13F | North Star Investment Management Corp. | 8.922 | 0,06 | 3.136 | -4,88 | ||||
| 2026-01-29 | 13F | Quent Capital, LLC | 2.067 | -2,96 | 727 | -7,75 | ||||
| 2026-02-12 | 13F | Nuveen, LLC | 1.567.440 | 2,95 | 550.908 | -2,12 | ||||
| 2026-02-11 | 13F | Saturna Capital CORP | 317.184 | 111.481 | ||||||
| 2026-01-21 | 13F | Yousif Capital Management, Llc | 49.193 | -2,25 | 17.690 | -4,91 | ||||
| 2026-02-04 | 13F | Dogwood Wealth Management LLC | 33 | 50,00 | 12 | 37,50 | ||||
| 2026-02-13 | 13F | Panagora Asset Management Inc | 8.994 | -95,19 | 3.161 | -95,42 | ||||
| 2026-02-13 | 13F | American Century Companies Inc | 1.014.226 | 10,26 | 356.470 | 4,83 | ||||
| 2026-02-13 | 13F | Squarepoint Ops LLC | Put | 3.000 | -9,09 | 1.054 | -13,54 | |||
| 2026-04-01 | 13F | Bangor Savings Bank | 5.213 | -1,53 | 1.713 | -7,96 | ||||
| 2026-02-13 | 13F | Squarepoint Ops LLC | 299.127 | -61,51 | 105.134 | -63,40 | ||||
| 2026-02-02 | 13F | Qrg Capital Management, Inc. | 60.548 | 7,43 | 21.281 | 2,14 | ||||
| 2026-02-09 | 13F | Knights of Columbus Asset Advisors LLC | 17.612 | -27,25 | 6.190 | -30,83 | ||||
| 2026-02-09 | 13F | Integrity Alliance, Llc. | 4.566 | -3,83 | 1.605 | -8,60 | ||||
| 2026-01-12 | 13F | Aurdan Capital Management, LLC | 784 | 0,00 | 276 | -4,84 | ||||
| 2026-02-09 | 13F | Cary Street Partner Investment Advisory Llc | 2.435 | 4,64 | 856 | -0,47 | ||||
| 2026-01-12 | 13F | Schaper Benz & Wise Investment Counsel Inc/wi | 108.809 | 0,64 | 38.243 | -4,31 | ||||
| 2026-02-13 | 13F | Squarepoint Ops LLC | Call | 12.700 | 958,33 | 4.464 | 907,45 | |||
| 2026-02-17 | 13F | Lighthouse Investment Partners, LLC | Put | 1.000 | 351 | |||||
| 2026-03-09 | 13F/A | Auto-Owners Insurance Co | 8.293 | 0,00 | 2.915 | -4,93 | ||||
| 2026-02-10 | 13F | Ellevest, Inc. | 2.201 | 1,95 | 774 | -3,13 | ||||
| 2026-01-20 | 13F | Global Trust Asset Management, LLC | 0 | -100,00 | 0 | -100,00 | ||||
| 2026-02-06 | 13F | Addison Advisors LLC | 4.179 | 0,00 | 1.469 | -4,92 | ||||
| 2025-10-30 | 13F | Ridgewood Investments LLC | 0 | -100,00 | 0 | |||||
| 2026-01-20 | 13F | Savvy Advisors, Inc. | 5.630 | 81,20 | 1.979 | 72,30 | ||||
| 2026-01-28 | 13F | Proathlete Wealth Management Llc | 1.026 | 0,69 | 361 | -4,24 | ||||
| 2026-01-14 | 13F | Ami Investment Management Inc | 11.274 | 1,88 | 3.962 | -3,13 | ||||
| 2026-02-13 | 13F | Sienna Gestion | 4.963 | 1.749 | ||||||
| 2026-04-02 | 13F | Byrne Asset Management LLC | 12 | 0,00 | 4 | -25,00 | ||||
| 2026-02-17 | 13F | Public Employees Retirement System Of Ohio | 140.008 | 0,08 | 49.209 | -4,84 | ||||
| 2026-01-16 | 13F | Kendall Capital Management | 817 | 5,69 | 287 | 0,70 | ||||
| 2026-01-29 | 13F | Concurrent Investment Advisors, LLC | 20.960 | 36,71 | 7.367 | 29,98 | ||||
| 2026-02-17 | 13F | Voloridge Investment Management, Llc | 290.130 | 101.972 | ||||||
| 2026-03-04 | 13F | Rehmann Capital Advisory Group | 63.737 | -0,00 | 22.403 | -4,93 | ||||
| 2026-02-10 | 13F | Westpac Banking Corp | 12.269 | -10,38 | 4.312 | -14,78 | ||||
| 2026-01-27 | 13F | Deroy & Devereaux Private Investment Counsel Inc | 2.350 | 0,00 | 1 | |||||
| 2026-02-19 | 13F | Atomi Financial Group, Inc. | 6.443 | 69,24 | 2.264 | 60,91 | ||||
| 2026-02-17 | 13F | Asset One Wealth Management LLC | 934 | 344 | ||||||
| 2026-01-28 | 13F | Consolidated Planning Corp | 2.531 | 890 | ||||||
| 2026-02-05 | 13F | RiverFront Investment Group, LLC | 8.719 | -35,40 | 3.065 | -38,58 | ||||
| 2026-02-13 | 13F | NLB Skladi, upravljanje premozenja, d.o.o. | 3.100 | 1.090 | ||||||
| 2026-01-27 | 13F/A | GraniteShares Advisors LLC | 3.710 | 10,68 | 1.304 | 5,17 | ||||
| 2026-01-29 | 13F | Pictet Asset Management Holding SA | 466.256 | 190,29 | 163.878 | 176,01 | ||||
| 2025-11-05 | 13F | Cherry Creek Investment Advisors, Inc. | 0 | -100,00 | 0 | |||||
| 2026-01-12 | 13F | CVA Family Office, LLC | 1.309 | -3,47 | 460 | -8,18 | ||||
| 2026-02-03 | 13F | Ballast Advisors Llc | 4.081 | 1,77 | 1.434 | -3,24 | ||||
| 2026-02-05 | 13F | Stephens Inc /ar/ | 12.937 | -0,85 | 4.547 | -5,72 | ||||
| 2026-02-10 | 13F | Western Reserve Capital Management, LLC | 2.182 | 767 | ||||||
| 2026-02-10 | 13F | Arcadia Investment Management Corp/mi | 66.029 | -2,40 | 23.207 | -7,21 | ||||
| 2026-02-19 | 13F | CI Private Wealth, LLC | 811.526 | -14,58 | 275.370 | -21,59 | ||||
| 2026-01-12 | 13F | Asset Allocation & Management Company, LLC | 1.200 | 0,00 | 0 | |||||
| 2026-02-13 | 13F | Resources Management Corp /ct/ /adv | 21.424 | 15,20 | 8 | 16,67 | ||||
| 2026-01-22 | 13F | Ifrah Financial Services, Inc. | 3.610 | -1,77 | 1.269 | -6,63 | ||||
| 2026-02-06 | 13F | Americana Partners, LLC | 2.982 | -39,54 | 1.048 | -42,51 | ||||
| 2026-02-13 | 13F | Financial Network Wealth Advisors LLC | 322 | 2,22 | 113 | -2,59 | ||||
| 2026-02-17 | 13F | Wiley Bros.-aintree Capital, Llc | 48.414 | 14,13 | 17.024 | 8,68 | ||||
| 2026-02-27 | 13F | Strategic Investment Solutions, Inc. /IL | 21 | 0,00 | 7 | 0,00 | ||||
| 2026-02-13 | 13F | Bollard Group LLC | 1.697 | 0,24 | 1 | |||||
| 2026-01-15 | 13F | Fifth Third Wealth Advisors LLC | 7.161 | 3,93 | 2.517 | -1,18 | ||||
| 2026-02-11 | 13F | Dearborn Partners Llc | 80.912 | -3,77 | 28.438 | -8,51 | ||||
| 2026-01-21 | 13F | MBL Wealth, LLC | 1.701 | 64,03 | 598 | 55,87 | ||||
| 2026-02-03 | 13F | Crossmark Global Holdings, Inc. | 26.820 | 31,13 | 9.426 | 24,68 | ||||
| 2026-02-09 | 13F | Frazier Financial Advisors, LLC | 74 | 0,00 | 26 | -3,70 | ||||
| 2026-01-21 | 13F | Newbridge Financial Services Group, Inc. | 146 | -20,22 | 51 | -23,88 | ||||
| 2026-02-13 | 13F | Dynamic Technology Lab Private Ltd | 3.287 | 44,99 | 1.155 | 37,83 | ||||
| 2026-02-05 | 13F | Northwestern Mutual Investment Management Company, Llc | 10.998 | 0,29 | 3.865 | -4,64 | ||||
| 2026-01-08 | 13F | Occidental Asset Management, LLC | 2.234 | -4,33 | 785 | -9,04 | ||||
| 2025-11-14 | 13F | Mbb Public Markets I Llc | 0 | -100,00 | 0 | |||||
| 2026-02-24 | 13F | Bell Investment Advisors, Inc | 608 | -1,30 | 214 | -6,17 | ||||
| 2026-02-05 | 13F | High Note Wealth, LLC | 133 | 14,66 | 47 | 9,52 | ||||
| 2026-01-07 | 13F | Brady Family Wealth, Llc | 21.947 | -0,63 | 7.714 | -5,52 | ||||
| 2025-10-16 | 13F | Krs Capital Management, Llc | 0 | -100,00 | 0 | -100,00 | ||||
| 2026-01-16 | 13F | Linden Thomas Advisory Services, LLC | 10.804 | -1,74 | 3.797 | -6,57 | ||||
| 2026-02-13 | 13F | Prudential Financial Inc | 170.119 | -12,36 | 59.792 | -16,67 | ||||
| 2026-02-17 | 13F | Integrated Advisors Network LLC | 3.811 | 2,28 | 1.340 | -2,76 | ||||
| 2026-01-13 | 13F | Stephens Consulting, LLC | 1.141 | 9,61 | 401 | 4,43 | ||||
| 2026-01-23 | 13F | Diversify Advisory Services, LLC | 2.695 | -24,91 | 981 | -23,74 | ||||
| 2026-02-17 | 13F | Keebeck Wealth Management, LLC | 11.317 | -29,85 | 3.988 | -33,29 | ||||
| 2026-02-09 | 13F | Green Square Capital Advisors Llc | 633 | 222 | ||||||
| 2026-02-17 | 13F | Fwl Investment Management, Llc | 261 | 45,00 | 92 | 37,88 | ||||
| 2025-11-17 | 13F/A | Proficio Capital Partners LLC | 0 | -100,00 | 0 | -100,00 | ||||
| 2026-01-26 | 13F | Greenwood Capital Associates Llc | 17.001 | -5,88 | 5.975 | -10,51 | ||||
| 2026-01-29 | 13F | Farmers & Merchants Trust Co of Long Beach | 0 | -100,00 | 0 | |||||
| 2026-02-17 | 13F | Woodline Partners LP | 20.221 | -84,51 | 7.107 | -85,27 | ||||
| 2026-01-08 | 13F | NorthCrest Asset Manangement, LLC | 51.342 | 1,35 | 17.908 | -4,27 | ||||
| 2026-02-10 | 13F | Argent Trust Co | 6.284 | -1,47 | 2.209 | -6,32 | ||||
| 2026-02-13 | 13F | SHUTTLEWORTH & Co | 3.922 | -21,64 | 1.378 | -25,51 | ||||
| 2026-01-27 | 13F | MASTERINVEST Kapitalanlage GmbH | 7.234 | 37,71 | 2.562 | 31,94 | ||||
| 2026-02-10 | 13F | Ark & Tlk Investments, Llc | 1.421 | 0,00 | 499 | -4,95 | ||||
| 2026-02-02 | 13F | Citizens Business Bank | 836 | 0,00 | 294 | -5,18 | ||||
| 2026-02-14 | 13F | Frec Markets, Inc. | 1.249 | 439 | ||||||
| 2026-02-17 | 13F | Nomura Holdings Inc | 7.961 | -40,87 | 2.798 | -43,78 | ||||
| 2026-01-30 | 13F | Interchange Capital Partners, LLC | 789 | 14,85 | 277 | 9,49 | ||||
| 2026-02-05 | 13F | Amalgamated Bank | 66.404 | -4,60 | 23 | -8,00 | ||||
| 2026-02-04 | 13F | Paradigm Asset Management Co Llc | 2.500 | -3,85 | 879 | -8,64 | ||||
| 2026-02-12 | 13F | Xxi Wealth, Llc | 653 | 230 | ||||||
| 2026-02-13 | 13F | Banco Santander, S.A. | 3.914 | -4,98 | 1.376 | -9,66 | ||||
| 2025-10-30 | 13F | Wbh Advisory Inc | 0 | -100,00 | 0 | -100,00 | ||||
| 2026-02-04 | 13F | Swiss Life Asset Management Ltd | 40.438 | 6,46 | 14.213 | 1,22 | ||||
| 2026-02-10 | 13F | Nomura Asset Management Co Ltd | 186.652 | -2,37 | 65.603 | -7,18 | ||||
| 2026-01-26 | 13F | Paradigm Financial Partners, Llc | 3.907 | 8,92 | 1.373 | 3,62 | ||||
| 2026-01-23 | 13F | Private Wealth Management Group, LLC | 135 | 0,00 | 47 | -4,08 | ||||
| 2026-02-02 | 13F | Advanced Asset Management Advisors Inc | 675 | 0,00 | 237 | -4,82 | ||||
| 2026-02-13 | 13F | Level Four Advisory Services, Llc | 3.732 | 33,33 | 1.312 | 26,79 | ||||
| 2026-01-21 | 13F | William Howard & Co Financial Advisors Inc | 5.490 | 0,00 | 1.930 | -4,93 | ||||
| 2026-02-03 | 13F | International Assets Investment Management, Llc | 1.719 | -6,88 | 604 | -17,49 | ||||
| 2026-02-17 | 13F | Mangrove Partners | 2.797 | 983 | ||||||
| 2026-02-06 | 13F | Envestnet Portfolio Solutions, Inc. | 10.608 | -3,19 | 3.728 | -7,95 | ||||
| 2026-02-13 | 13F | Wbi Investments, Inc. | 0 | -100,00 | 0 | |||||
| 2026-02-10 | 13F | Axq Capital, Lp | 7.106 | 984,89 | 2.498 | 931,82 | ||||
| 2025-10-27 | 13F | Gwn Securities Inc. | 0 | -100,00 | 0 | |||||
| 2026-01-21 | 13F | Brown Shipley& Co Ltd | 125 | 0,00 | 44 | -6,52 | ||||
| 2025-11-14 | 13F | Royal Bank Of Canada | Call | 0 | -100,00 | 0 | -100,00 | |||
| 2026-02-06 | 13F | McKinley Carter Wealth Services, Inc. | 575 | -1,54 | 202 | -6,05 | ||||
| 2026-02-11 | 13F | Illinois Municipal Retirement Fund | 39.157 | 7,12 | 13.763 | 1,85 | ||||
| 2026-01-06 | 13F | Nelson, Van Denburg & Campbell Wealth Management Group, LLC | 9.085 | -4,25 | 3.193 | -8,98 | ||||
| 2026-01-26 | 13F | Taylor Frigon Capital Management LLC | 4.086 | -2,99 | 1.436 | -7,77 | ||||
| 2026-01-27 | 13F | Journey Advisory Group, LLC | 3.883 | -14,60 | 1.365 | -18,81 | ||||
| 2026-02-10 | 13F | Peapack Gladstone Financial Corp | 89.751 | 1,71 | 32 | -3,12 | ||||
| 2026-02-13 | 13F | Burton Enright Welch | 1.726 | 0,58 | 607 | -4,42 | ||||
| 2026-02-03 | 13F | Violich Capital Management, Inc. | 5.100 | -3,32 | 1.792 | -8,10 | ||||
| 2026-02-06 | 13F | Bare Financial Services, Inc | 24 | -11,11 | 8 | -11,11 | ||||
| 2026-01-26 | 13F | Milestones Private Investment Advisors LLC | 1.544 | 0,00 | 543 | -4,91 | ||||
| 2025-11-14 | 13F | Binnacle Investments Inc | 182 | 1,68 | 67 | -4,29 | ||||
| 2026-02-05 | 13F | Hendley & Co Inc | 14.288 | -12,53 | 5 | -16,67 | ||||
| 2026-02-17 | 13F | Magnetar Financial LLC | 11.084 | -48,21 | 3.896 | -50,76 | ||||
| 2026-02-05 | 13F | Mesirow Financial Investment Management, Inc. | 58.844 | -0,44 | 20.683 | -5,36 | ||||
| 2026-01-13 | 13F | Sharkey, Howes & Javer | 0 | -100,00 | 0 | |||||
| 2026-01-09 | 13F | Affinity Capital Advisors, LLC | 802 | 0,12 | 282 | -4,10 | ||||
| 2026-02-02 | 13F | Ashton Thomas Securities, Llc | 1.185 | -9,54 | 416 | -13,51 | ||||
| 2026-02-11 | 13F | PBU - The Pension Fund of Early Childhood & Youth Educators | 41.644 | 14.637 | ||||||
| 2026-02-03 | 13F | Jlb & Associates Inc | 26.779 | -0,17 | 9.412 | -5,08 | ||||
| 2026-02-10 | 13F | Fiduciary Family Office, Llc | 1.149 | -9,03 | 404 | -13,52 | ||||
| 2026-01-20 | 13F | Toth Financial Advisory Corp | 51.848 | 1,06 | 18.223 | -3,92 | ||||
| 2026-01-23 | 13F | Norris Perne & French Llp/mi | 45.860 | 1,57 | 16.118 | -3,43 | ||||
| 2026-01-16 | 13F | Tema Etfs Llc | 5.535 | -0,29 | 1.945 | -5,21 | ||||
| 2026-01-23 | 13F | BSW Wealth Partners | 1.615 | -2,94 | 568 | -7,80 | ||||
| 2026-02-13 | 13F | Kempen Capital Management N.v. | 21.676 | -3,51 | 7.618 | -8,26 | ||||
| 2026-02-12 | 13F | StoneX Group Inc. | 3.873 | 3,89 | 1.364 | -1,23 | ||||
| 2026-02-17 | 13F | Ibex Wealth Advisors | 0 | -100,00 | 0 | |||||
| 2026-02-13 | 13F | Resources Investment Advisors, LLC. | 5.773 | -0,59 | 2.029 | -5,45 | ||||
| 2026-01-23 | 13F | FSM Wealth Advisors, LLC | 1.429 | -38,98 | 502 | -41,97 | ||||
| 2026-02-10 | 13F | Principia Wealth Advisory, LLC | 14 | -6,67 | 5 | -20,00 | ||||
| 2026-01-21 | 13F | Raleigh Capital Management Inc. | 514 | 52,98 | 181 | 45,16 | ||||
| 2026-03-16 | 13F | Bank of New Hampshire | 15.227 | -1,83 | 5.352 | -6,66 | ||||
| 2026-01-15 | 13F | Jamison Private Wealth Management, Inc. | 2.241 | -1,23 | 788 | -6,09 | ||||
| 2026-02-05 | 13F | Aspire Growth Partners LLC | 0 | -100,00 | 0 | |||||
| 2026-02-17 | 13F | Berkshire Bank | 7.998 | -2,18 | 2.811 | -6,98 | ||||
| 2026-01-21 | 13F | Prime Capital Investment Advisors, LLC | Call | 0 | -100,00 | 0 | ||||
| 2026-02-17 | 13F | Fairview Capital Investment Management, Llc | 600 | 0,00 | 211 | -4,98 | ||||
| 2026-01-30 | 13F | Sigma Planning Corp | 8.173 | 1,93 | 2.873 | -3,07 | ||||
| 2026-02-13 | 13F | Ames National Corp | 0 | -100,00 | 0 | |||||
| 2025-11-20 | 13F | Maven Securities LTD | Put | 0 | -100,00 | 0 | -100,00 | |||
| 2025-11-20 | 13F | Maven Securities LTD | Call | 0 | -100,00 | 0 | -100,00 | |||
| 2026-02-12 | 13F | Lansforsakringar Fondforvaltning AB (publ) | 32.015 | 1.564,85 | 11.252 | 1.484,79 | ||||
| 2026-01-23 | 13F | Oxler Private Wealth LLC | 4.802 | 0,19 | 1.688 | -4,74 | ||||
| 2026-01-26 | 13F | JNBA Financial Advisors | 160 | 0,00 | 56 | -5,08 | ||||
| 2026-01-28 | 13F | Members Wealth Llc | 2.937 | -1,14 | 1.048 | -3,05 | ||||
| 2026-02-10 | 13F | Act Two Investors Llc | 12.053 | -15,01 | 4.236 | -19,19 | ||||
| 2026-02-17 | 13F | Warren Averett Asset Management, LLC | 44.201 | 5,12 | 15.536 | -0,06 | ||||
| 2026-02-05 | 13F | Navalign, LLC | 590 | 0,00 | 207 | -5,05 | ||||
| 2026-02-05 | 13F | Tucker Asset Management Llc | 115 | 40 | ||||||
| 2026-02-05 | 13F | Roberts Glore & Co Inc /il/ | 14.085 | -1,07 | 4.950 | -5,95 | ||||
| 2026-02-13 | 13F | Voya Financial Advisors, Inc. | 0 | -100,00 | 0 | |||||
| 2026-02-10 | 13F | Basepoint Wealth LLC | 44 | 15 | ||||||
| 2026-02-11 | 13F | West Family Investments, Inc. | 1.249 | -28,01 | 439 | -31,67 | ||||
| 2026-02-12 | 13F | WealthSpring Partners, LLC | 1.222 | -34,44 | 430 | -15,72 | ||||
| 2026-01-26 | 13F | Quadrant Private Wealth Management, LLC | 682 | 20,28 | 240 | 14,29 | ||||
| 2026-02-06 | 13F | Great Diamond Partners, LLC | 2.801 | -2,23 | 984 | -7,08 | ||||
| 2026-02-13 | 13F | Clarkston Capital Partners, LLC | 4.272 | 0,00 | 1.501 | -4,94 | ||||
| 2026-02-17 | 13F | DV Trading LLC | 280 | 98 | ||||||
| 2026-02-17 | 13F | BTG Pactual Asset Management US LLC | 7.802 | 0,27 | 2.904 | 0,28 | ||||
| 2026-02-02 | 13F | Bay Harbor Wealth Management, LLC | 18 | 28,57 | 6 | 20,00 | ||||
| 2026-02-11 | 13F | Fiera Capital Corp | 46.278 | 60,53 | 16.265 | 52,64 | ||||
| 2026-02-13 | 13F | Northwest Bancshares, Inc. | 0 | -100,00 | 0 | |||||
| 2026-01-23 | 13F | Monarch Capital Management Inc/ | 14.277 | -0,26 | 5.031 | -5,15 | ||||
| 2026-01-09 | 13F | SG Americas Securities, LLC | Call | 0 | -100,00 | 0 | ||||
| 2026-01-21 | 13F | Prime Capital Investment Advisors, LLC | Put | 0 | -100,00 | 0 | ||||
| 2026-01-26 | 13F | Phraction Management LLC | 1.313 | -7,08 | 461 | -11,69 | ||||
| 2026-01-21 | 13F | Baker Ellis Asset Management LLC | 20.827 | -0,44 | 7.320 | -5,34 | ||||
| 2026-02-06 | 13F | Cullen/frost Bankers, Inc. | 66.826 | 3,48 | 23.487 | -1,62 | ||||
| 2026-01-29 | 13F | State Of Michigan Retirement System | 90.099 | -3,22 | 31.667 | -7,98 | ||||
| 2026-02-13 | 13F | Polymer Capital Management (HK) LTD | 0 | -100,00 | 0 | |||||
| 2026-01-12 | 13F | Avanza Fonder AB | 42.319 | 7,95 | 14.874 | 2,64 | ||||
| 2026-02-09 | 13F | Keating Financial Advisory Services, Inc. | 991 | 348 | ||||||
| 2026-02-13 | 13F | Neo Ivy Capital Management | 0 | -100,00 | 0 | -100,00 | ||||
| 2026-02-13 | 13F/A | Ontario Teachers Pension Plan Board | 0 | -100,00 | 0 | |||||
| 2026-01-12 | 13F | Kozak & Associates, Inc. | 13 | 0,00 | 5 | 0,00 | ||||
| 2026-02-11 | 13F | Commonwealth Retirement Investments LLC | 44 | 15 | ||||||
| 2026-02-13 | 13F | Whalerock Point Partners, Llc | 743 | 0,00 | 261 | -4,74 | ||||
| 2026-02-13 | 13F | Ieq Capital, Llc | 27.123 | 13,30 | 9.533 | 7,72 | ||||
| 2026-01-14 | 13F | Eastern Bank | 3.476 | -8,72 | 1.222 | -13,22 | ||||
| 2026-01-28 | 13F | Accretive Wealth Partners, LLC | 2.716 | 10,77 | 955 | 5,30 | ||||
| 2026-02-17 | 13F | Lighthouse Investment Partners, LLC | 0 | -100,00 | 0 | |||||
| 2026-02-09 | 13F | Quest Partners LLC | 132 | -91,91 | 46 | -92,36 | ||||
| 2026-01-27 | 13F | Antonelli Financial Advisors, LLC | 2.187 | 0,00 | 769 | -4,83 | ||||
| 2026-01-14 | 13F | Clarius Group, LLC | 1.089 | -34,71 | 383 | -37,99 | ||||
| 2026-01-14 | 13F | Disciplined Equity Management, Inc. | 780 | 0,00 | 274 | -4,86 | ||||
| 2026-02-17 | 13F | Advisor Group Holdings, Inc. | 125.205 | -22,38 | 44.026 | -26,92 | ||||
| 2026-02-05 | 13F | Thrivent Financial For Lutherans | 119.191 | 22,07 | 42 | 13,89 | ||||
| 2026-02-13 | 13F | PCM Encore, LLC | 1.697 | 597 | ||||||
| 2026-02-02 | 13F | SevenBridge Financial Group, LLC | 1.264 | 4,12 | 451 | 1,35 | ||||
| 2026-02-11 | 13F | Inceptionr Llc | 0 | -100,00 | 0 | |||||
| 2026-01-23 | 13F | Patton Fund Management, Inc. | 603 | 0,00 | 212 | -4,95 | ||||
| 2026-02-17 | 13F | Captrust Financial Advisors | 63.877 | 3,81 | 22.451 | -1,30 | ||||
| 2026-02-13 | 13F | Tradewinds, LLC. | 636 | 0,00 | 224 | -5,11 | ||||
| 2026-02-17 | 13F | Lazard Asset Management Llc | 54.809 | -1,29 | 19.264 | -6,15 | ||||
| 2026-01-15 | 13F | Orrstown Financial Services Inc | 0 | -100,00 | 0 | |||||
| 2026-01-29 | 13F | Lee Danner & Bass Inc | 14.318 | 1,54 | 5.032 | -3,45 | ||||
| 2026-02-05 | 13F | Avantax Planning Partners, Inc. | 2.092 | 0,72 | 735 | -4,17 | ||||
| 2026-02-13 | 13F | Headlands Technologies LLC | 0 | -100,00 | 0 | |||||
| 2026-01-30 | 13F | Simplicity Wealth,LLC | 746 | -4,85 | 262 | -9,34 | ||||
| 2026-02-10 | 13F | Nvest Financial, LLC | 5.087 | 49,09 | 1.788 | 41,79 | ||||
| 2026-02-04 | 13F | AGH Wealth Advisors, LLC | 835 | -16,92 | 293 | -21,02 | ||||
| 2026-02-02 | 13F | PKS Advisory Services, LLC | 1.685 | 0,00 | 592 | -4,82 | ||||
| 2026-02-05 | 13F | Rossmore Private Capital | 19.561 | 12,17 | 6.892 | 6,92 | ||||
| 2026-01-15 | 13F | Lodestone Wealth Management LLC | 187 | 66 | ||||||
| 2026-02-13 | 13F | Ausdal Financial Partners, Inc. | 1.555 | -2,75 | 547 | -7,61 | ||||
| 2026-01-28 | 13F | Davidson Capital Management Inc. | 9.114 | 4,28 | 3.203 | -0,84 | ||||
| 2025-11-03 | 13F | EFG Asset Management (North America) Corp. | 3.968 | -9,39 | 1.467 | -15,31 | ||||
| 2025-12-15 | 13F/A | Hudson Bay Capital Management LP | Call | 0 | -100,00 | 0 | -100,00 | |||
| 2026-02-18 | 13F | State of Tennessee, Treasury Department | 102.682 | -3,09 | 37.947 | -3,12 | ||||
| 2026-02-10 | 13F | CFS Investment Advisory Services, LLC | 1.114 | 75,43 | 392 | 61,57 | ||||
| 2026-02-04 | 13F | Advisor OS, LLC | 1.794 | 95,64 | 630 | 86,39 | ||||
| 2026-01-14 | 13F | Mb, Levis & Associates, Llc | 35 | 0,00 | 12 | 0,00 | ||||
| 2026-01-21 | 13F | Pacific Point Advisors, LLC | 3.348 | 1.177 | ||||||
| 2026-02-11 | 13F | Schwallier Wealth Management LLC | 1.138 | 420 | ||||||
| 2026-02-03 | 13F | Generali Asset Management SPA SGR | 19.047 | -0,99 | 6.694 | -5,86 | ||||
| 2026-02-06 | 13F | Copia Wealth Management | 107 | 0,00 | 38 | -5,13 | ||||
| 2026-02-10 | 13F | Acorn Wealth Advisors, LLC | 972 | 0,52 | 342 | -4,48 | ||||
| 2026-02-04 | 13F | Boston Private Wealth Llc | 8.941 | -19,06 | 3.143 | -23,05 | ||||
| 2026-02-06 | 13F | Profund Advisors Llc | 5.766 | 24,16 | 2.027 | 18,07 | ||||
| 2026-01-26 | 13F | Nicholson Wealth Management Group, LLC | 5.056 | 6,29 | 1.777 | 1,08 | ||||
| 2026-02-04 | 13F | Tsfg, Llc | 126 | 0,00 | 0 | |||||
| 2026-01-09 | 13F | Bdf-gestion | 7.778 | -6,26 | 2.734 | -10,89 | ||||
| 2026-01-28 | 13F | Grant Street Asset Management, Inc. | 807 | 8,61 | 284 | 3,28 | ||||
| 2026-02-02 | 13F | Robertson Stephens Wealth Management, LLC | 610 | 215 | ||||||
| 2026-02-03 | 13F | D.B. Root & Company, LLC | 3.163 | -11,47 | 1.112 | -15,83 | ||||
| 2026-02-03 | 13F | Broadwater Capital Management Llc | 6.465 | 0,00 | 2.272 | -4,90 | ||||
| 2026-02-06 | 13F | CWS Financial Advisors, LLC | 252.176 | -0,78 | 88.632 | -5,66 | ||||
| 2026-02-03 | 13F | Alpha Cubed Investments, LLC | 2.179 | 13,02 | 766 | 7,44 | ||||
| 2026-02-10 | 13F | MainStreet Investment Advisors LLC | 6.160 | -8,65 | 2.165 | -13,12 | ||||
| 2025-10-16 | 13F | Richwood Investment Advisors, LLC | 0 | -100,00 | 0 | |||||
| 2026-02-13 | 13F | Seneschal Advisors, LLC | 3 | 0,00 | 1 | 0,00 | ||||
| 2026-02-17 | 13F | Hall Capital Management Co Inc | 1.934 | 1,10 | 680 | -3,96 | ||||
| 2026-01-29 | 13F | Broadway Wealth Solutions, Inc. | 748 | 0,94 | 263 | -4,03 | ||||
| 2026-02-11 | 13F | Cypress Capital Group | 4.136 | -3,34 | 1.454 | -8,10 | ||||
| 2026-02-04 | 13F | Long Road Investment Counsel, LLC | 42.556 | 0,24 | 14.957 | -4,70 | ||||
| 2026-02-10 | 13F | DT Investment Partners, LLC | 326 | 141,48 | 115 | 132,65 | ||||
| 2026-02-10 | 13F | GKV Capital Management Co., Inc. | 1.150 | 0,00 | 404 | -4,94 | ||||
| 2026-02-17 | 13F | Main Street Financial Solutions, LLC | 0 | -100,00 | 0 | |||||
| 2026-02-12 | 13F | Keel Point, LLC | 15.634 | -3,40 | 5.495 | -8,17 | ||||
| 2026-02-13 | 13F | Chevy Chase Trust Holdings, Inc. | 187.162 | 0,14 | 65.782 | -4,79 | ||||
| 2026-01-23 | 13F | Steigerwald, Gordon & Koch Inc. | 68.528 | 0,20 | 24.085 | -4,73 | ||||
| 2026-02-06 | 13F | Resona Asset Management Co.,Ltd. | 102.593 | -3,57 | 36.077 | -8,28 | ||||
| 2026-02-13 | 13F | 1 North Wealth Services Llc | 20 | -50,00 | 7 | -50,00 | ||||
| 2025-10-08 | 13F | Beacon Financial Group | 0 | -100,00 | 0 | |||||
| 2026-02-06 | 13F | Planning Alternatives Ltd /adv | 592 | 208 | ||||||
| 2026-02-12 | 13F | Insigneo Advisory Services, Llc | 2.573 | 82,61 | 904 | 73,85 | ||||
| 2026-02-12 | 13F | Renaissance Technologies Llc | 406.160 | 293,57 | 142.753 | 274,20 | ||||
| 2026-01-27 | 13F | Meritage Portfolio Management | 1.740 | 0,00 | 612 | -4,98 | ||||
| 2026-02-02 | 13F | CENTRAL TRUST Co | 16.812 | -2,85 | 5.909 | -7,63 | ||||
| 2026-02-12 | 13F | Great Lakes Retirement, Inc. | 5.831 | 8,36 | 2.054 | 3,27 | ||||
| 2026-02-14 | 13F | American Trust | 9.805 | 1,45 | 3.446 | -3,53 | ||||
| 2026-02-11 | 13F | EULAV Asset Management | 101.813 | -16,42 | 35.784 | -20,53 | ||||
| 2026-02-17 | 13F | Snowden Capital Advisors LLC | 3.041 | -13,36 | 1.071 | -17,62 | ||||
| 2026-02-12 | 13F | Logan Capital Management Inc | 3.006 | 0,00 | 1.057 | -4,95 | ||||
| 2026-01-14 | 13F | Cypress Wealth Services, LLC | 933 | 328 | ||||||
| 2026-02-11 | 13F | Parallel Advisors, LLC | 21.603 | -1,62 | 7.598 | -6,39 | ||||
| 2026-01-28 | 13F | Columbia Asset Management | 14.562 | -4,71 | 5.118 | -9,40 | ||||
| 2026-01-29 | 13F | Impax Asset Management Group plc | 5.984 | 0,00 | 2.103 | -4,93 | ||||
| 2026-02-05 | 13F | 1st Source Bank | 5.531 | -1,69 | 1.944 | -6,54 | ||||
| 2025-11-13 | 13F | Texas Capital Bancshares Inc/tx | 453 | -28,89 | 167 | -33,73 | ||||
| 2026-02-10 | 13F | Norges Bank | 5.184.716 | 1.822.272 | ||||||
| 2026-01-13 | 13F | Harrington Investments, INC | 8.351 | -1,07 | 2.935 | -5,93 | ||||
| 2026-01-28 | 13F | Turtle Creek Wealth Advisors, LLC | 23.376 | 15,65 | 8.216 | 9,96 | ||||
| 2026-02-13 | 13F | Citigroup Inc | 430.246 | -12,54 | 151.218 | -16,84 | ||||
| 2026-02-14 | 13F | Howe & Rusling Inc | 31.197 | -0,19 | 10.965 | -5,11 | ||||
| 2026-01-09 | 13F | Montecito Bank & Trust | 1.963 | -0,91 | 690 | -5,87 | ||||
| 2026-01-15 | 13F | Moody Lynn & Lieberson, Llc | 83.991 | -6,75 | 29.520 | -11,34 | ||||
| 2026-02-17 | 13F | Maryland State Retirement & Pension System | 17.163 | 0,00 | 6.032 | -4,92 | ||||
| 2026-02-17 | 13F | Brevan Howard Capital Management LP | 6.781 | -1,25 | 2.383 | -6,11 | ||||
| 2026-02-12 | 13F | Grey Fox Wealth Advisors, LLC | 1.296 | -16,60 | 457 | -20,70 | ||||
| 2026-02-13 | 13F | Kcm Investment Advisors Llc | 1.857 | 1,53 | 653 | -3,55 | ||||
| 2026-02-13 | 13F | Sei Investments Co | 514.790 | 20,38 | 180.927 | 14,44 | ||||
| 2026-01-15 | 13F | Elser Financial Planning, Inc | 1.249 | -0,56 | 439 | -4,78 | ||||
| 2026-02-13 | 13F | Ostrum Asset Management | 1.039 | -24,93 | 365 | -28,57 | ||||
| 2026-01-21 | 13F | Crux Wealth Advisors | 3.361 | -0,68 | 1.181 | -5,52 | ||||
| 2026-01-27 | 13F | ZEGA Investments, LLC | 3.215 | 0,06 | 1.130 | -4,89 | ||||
| 2026-01-23 | 13F | Sage Mountain Advisors LLC | 1.651 | -18,87 | 580 | -22,87 | ||||
| 2026-02-13 | 13F | Missouri Trust & Investment Co | 1.734 | -1,98 | 609 | -6,74 | ||||
| 2026-02-17 | 13F | Hurlow Wealth Management Group, Inc. | 1.034 | -8,17 | 363 | -12,74 | ||||
| 2026-01-21 | 13F | M. Kraus & Co | 0 | -100,00 | 0 | |||||
| 2026-02-02 | 13F | Avidian Wealth Solutions, LLC | 2.839 | -0,18 | 998 | -5,14 | ||||
| 2026-02-10 | 13F | Bnp Paribas Arbitrage, Sa | Call | 165 | 0,00 | 5.799 | -4,92 | |||
| 2026-02-10 | 13F | Bnp Paribas Arbitrage, Sa | 913.154 | 25,88 | 320.946 | 19,68 | ||||
| 2026-02-10 | 13F | Quantbot Technologies LP | 25.530 | 56,22 | 8.973 | 48,54 | ||||
| 2026-01-14 | 13F | Woodstock Corp | 14.140 | -1,38 | 4.970 | -6,25 | ||||
| 2026-02-10 | 13F | Bnp Paribas Arbitrage, Sa | Put | 30 | 1.054 | |||||
| 2026-02-11 | 13F | Peachtree Investment Partners, LLC | 4.388 | 1,36 | 1.542 | -3,62 | ||||
| 2026-01-07 | 13F | Lynch & Associates/in | 17.783 | -1,71 | 6.250 | -6,55 | ||||
| 2026-01-27 | 13F | Warm Springs Advisors Inc. | 2.762 | -10,18 | 971 | -14,61 | ||||
| 2026-02-13 | 13F | Fortitude Advisory Group L.L.C. | 937 | 0,43 | 329 | -4,36 | ||||
| 2026-01-27 | 13F | TD Waterhouse Canada Inc. | 171.354 | -1,47 | 60.217 | -4,91 | ||||
| 2026-01-08 | 13F | Wealth Enhancement Advisory Services, Llc | 155.263 | 1,39 | 57.790 | 2,21 | ||||
| 2026-02-03 | 13F | Sigma Investment Counselors Inc | 40.690 | -0,49 | 14.301 | -5,39 | ||||
| 2025-10-14 | 13F | Flywheel Private Wealth LLC | 0 | -100,00 | 0 | -100,00 | ||||
| 2026-02-12 | 13F | IFC & Insurance Marketing, Inc. | 7 | 0 | ||||||
| 2025-11-06 | 13F | Camden National Bank | 0 | -100,00 | 0 | |||||
| 2026-01-22 | 13F | Lee Financial Co | 0 | -100,00 | 0 | |||||
| 2026-02-12 | 13F | Federated Hermes, Inc. | 161.126 | 0,27 | 56.631 | -4,67 | ||||
| 2026-04-01 | 13F | Burkett Financial Services, Llc | 94 | 0,00 | 31 | -6,06 | ||||
| 2026-02-11 | 13F | DB&C Advisors, LLC | 741 | 261 | ||||||
| 2026-02-11 | 13F | CenterBook Partners LP | 2.122 | 746 | ||||||
| 2025-11-10 | 13F | Siligmueller & Norvid Wealth Advisors LLC | 1.278 | 472 | ||||||
| 2026-02-12 | 13F | BlackRock, Inc. | 27.449.327 | 2,70 | 9.647.615 | -2,36 | ||||
| 2026-01-27 | 13F | Benedict Financial Advisors Inc | 5.690 | -0,73 | 2.000 | -5,62 | ||||
| 2026-02-12 | 13F | Investment Counsel Co Of Nevada | 500 | 0,00 | 176 | -4,89 | ||||
| 2026-02-12 | 13F | Voya Investment Management Llc | 137.261 | -71,53 | 48.076 | -73,00 | ||||
| 2026-01-12 | 13F | VisionPoint Advisory Group, LLC | 689 | -5,62 | 242 | -10,04 | ||||
| 2026-01-13 | 13F | Norden Group Llc | 1.162 | -13,22 | 408 | -17,58 | ||||
| 2026-02-03 | 13F | Cassaday & Co Wealth Management LLC | 2.795 | 1,97 | 982 | -3,06 | ||||
| 2026-02-12 | 13F | McMillan Office, Inc. | 4.945 | 1.738 | ||||||
| 2026-01-28 | 13F | Fiduciary Wealth Partners, LLC | 580 | -0,68 | 204 | -5,58 | ||||
| 2025-11-14 | 13F | PineBridge Investments, L.P. | 2.742 | 143,73 | 1.014 | 127,64 | ||||
| 2026-02-11 | 13F | LPL Financial LLC | 411.236 | 2,40 | 144.537 | -2,64 | ||||
| 2026-02-11 | 13F | LPL Financial LLC | Put | 700 | 0,00 | 246 | -4,65 | |||
| 2026-01-20 | 13F | Independence Bank of Kentucky | 7.406 | 3,02 | 2.603 | -2,07 | ||||
| 2026-02-06 | 13F | Associated Banc-corp | 23.496 | -0,17 | 8.258 | -5,08 | ||||
| 2025-11-13 | 13F | Promus Capital, LLC | 604 | 223 | ||||||
| 2026-02-12 | 13F | Marex Group plc | 2.065 | 181,72 | 726 | 168,52 | ||||
| 2026-02-04 | 13F | Nicholas Company, Inc. | 164.677 | 0,00 | 57.879 | -4,92 | ||||
| 2026-02-13 | 13F | Palisade Asset Management, LLC | 37.529 | -0,01 | 13.190 | -4,94 | ||||
| 2025-11-14 | 13F | Strategic Wealth Partners, Ltd. | 23.145 | -4,69 | 8.558 | -10,93 | ||||
| 2026-02-02 | 13F | Vawter Financial, Ltd. | 1.972 | 0,00 | 693 | -4,81 | ||||
| 2026-02-12 | 13F | New York State Common Retirement Fund | 397.237 | -6,61 | 139.617 | -11,20 | ||||
| 2026-01-16 | 13F | CRA Financial Services, LLC | 0 | -100,00 | 0 | |||||
| 2026-02-12 | 13F | BRYN MAWR TRUST Co | 37.223 | -1,52 | 13.083 | -6,38 | ||||
| 2026-01-23 | 13F | Tower View Investment Management & Research LLC | 536 | 0,19 | 188 | -4,57 | ||||
| 2026-02-12 | 13F | Advocate Investing Services LLC | 33 | 12 | ||||||
| 2026-01-21 | 13F | Buffalo Business & Estate Services Ltd | 2.032 | 714 | ||||||
| 2026-01-29 | 13F | Financial Life Planners | 0 | -100,00 | 0 | |||||
| 2026-01-20 | 13F | Trust Co Of Toledo Na /oh/ | 1.564 | -3,10 | 550 | -7,89 | ||||
| 2026-02-10 | 13F | Harold Davidson & Associates Inc. | 8.634 | -0,61 | 3.035 | -5,51 | ||||
| 2026-02-03 | 13F | Morse Asset Management, Inc | 10 | -75,61 | 4 | -80,00 | ||||
| 2025-11-14 | 13F | Point72 Hong Kong Ltd | 13.533 | 5.003 | ||||||
| 2026-01-12 | 13F | Moody National Bank Trust Division | 0 | -100,00 | 0 | |||||
| 2026-01-29 | 13F | Middleton & Co Inc/ma | 23.379 | 8,34 | 8.217 | 3,01 | ||||
| 2026-01-23 | 13F | Parthenon Llc | 37.235 | -0,79 | 13.087 | -5,68 | ||||
| 2026-01-26 | 13F | Consolidated Investment Group LLC | 13.110 | 24,74 | 4.608 | 18,58 | ||||
| 2026-02-03 | 13F | Sequoia Financial Advisors, LLC | 13.997 | 7,41 | 4.920 | 2,12 | ||||
| 2026-02-13 | 13F | 1248 Management, LLC | 543 | 0,00 | 191 | -4,98 | ||||
| 2026-01-21 | 13F | Canton Hathaway, LLC | 115 | 0,00 | 40 | -6,98 | ||||
| 2026-01-29 | 13F | Wealth Alliance Advisory Group, LLC | 3.855 | 0,00 | 1.355 | -4,98 | ||||
| 2026-02-17 | 13F | Evergreen Wealth Solutions, LLC | 1.597 | 8,34 | 561 | 3,13 | ||||
| 2026-01-05 | 13F | Legacy Wealth Management, LLC / MS | 8.703 | 15,81 | 3.059 | 10,08 | ||||
| 2026-02-03 | 13F | K.J. Harrison & Partners Inc | 13.485 | -0,74 | 4.740 | -4,78 | ||||
| 2026-02-17 | 13F | Fullerton Fund Management Co Ltd | 836 | -54,88 | 294 | -57,16 | ||||
| 2026-02-13 | 13F | Sterling Capital Management LLC | 4.195 | -9,82 | 1.474 | -14,25 | ||||
| 2026-01-30 | 13F | Rachor Investment Advisory Services, LLC | 201 | 71 | ||||||
| 2026-01-14 | 13F | Centennial Wealth Advisory LLC | 610 | 3,57 | 214 | -1,38 | ||||
| 2026-02-11 | 13F | Vestor Capital, Llc | 2.500 | 107,99 | 0 | |||||
| 2025-10-31 | 13F | Mendel Capital Management LLC | 4.939 | 1,48 | 1.826 | -5,19 | ||||
| 2026-02-13 | 13F | Quattro Advisors LLC | 26 | 9 | ||||||
| 2026-01-15 | 13F | Capital Advisors Inc/ok | 172.517 | 5,01 | 60.635 | -0,16 | ||||
| 2026-02-06 | 13F | Condor Capital Management | 10.712 | -1,21 | 3.765 | -6,06 | ||||
| 2026-02-12 | 13F | Financial Engines Advisors L.L.C. | 3.755 | -1,37 | 1.320 | -6,25 | ||||
| 2026-02-05 | 13F | LGT Fund Management Co Ltd. | 9.654 | 26,41 | 3.419 | 22,91 | ||||
| 2026-02-05 | 13F | Allworth Financial LP | 88.867 | 3,70 | 31.234 | -1,40 | ||||
| 2026-02-05 | 13F | Allworth Financial LP | Put | 422 | ||||||
| 2026-02-12 | 13F | Alps Advisors Inc | 3.022 | 0,33 | 1.062 | -4,58 | ||||
| 2026-02-20 | 13F | McLaughlin Asset Management, Inc. | 2.183 | 767 | ||||||
| 2026-01-28 | 13F | Villere St Denis J & Co Llc | 77.859 | -3,94 | 27.365 | -8,67 | ||||
| 2026-02-09 | 13F | Allstate Corp | 25.963 | 105,48 | 9.125 | 95,40 | ||||
| 2026-01-22 | 13F | Wealth Group, Ltd. | 695 | -9,86 | 0 | |||||
| 2026-01-27 | 13F | Stone Point Wealth LLC | 11.115 | 2,04 | 3.907 | -2,98 | ||||
| 2025-11-14 | 13F | AXA Investment Managers S.A. | 174.999 | 64.692 | ||||||
| 2026-01-30 | 13F | Dale Q Rice Investment Management Ltd | 815 | 0,00 | 286 | -4,98 | ||||
| 2026-01-13 | 13F | Trust Asset Management LLC | 3.805 | -3,50 | 1.337 | -8,24 | ||||
| 2026-02-13 | 13F | First National Bank Of Omaha | 5.119 | 1.813 | ||||||
| 2026-02-13 | 13F | Capula Management Ltd | Put | 1.500 | 25,00 | 527 | 18,96 | |||
| 2025-11-14 | 13F | 1858 Wealth Management, Llc | 622 | 7,61 | 230 | 0,44 | ||||
| 2026-01-23 | 13F | Evolution Advisers, Inc. | 300 | 0,00 | 0 | |||||
| 2026-02-04 | 13F | Concentrum Wealth Management | 822 | -0,60 | 289 | -5,57 | ||||
| 2026-02-13 | 13F | Capula Management Ltd | Call | 900 | 50,00 | 316 | 42,99 | |||
| 2026-02-13 | 13F | Capula Management Ltd | 939 | 123,04 | 330 | 112,90 | ||||
| 2026-01-21 | 13F | Figure 8 Investment Strategies Llc | 5.225 | -2,79 | 1.836 | -7,55 | ||||
| 2025-11-12 | 13F | Empirical Asset Management, LLC | 0 | -100,00 | 0 | |||||
| 2026-02-11 | 13F | Flagship Wealth Advisors, Llc | 130 | 0,00 | 46 | -6,25 | ||||
| 2026-02-09 | 13F | Bleakley Financial Group, LLC | 17.973 | 23,09 | 6.317 | 17,02 | ||||
| 2026-02-13 | 13F | Victory Capital Management Inc | 119.375 | 2,07 | 41.957 | -2,95 | ||||
| 2026-02-13 | 13F | University Of Texas/texas Am Investment Managment Co | 7 | -98,41 | 2 | -98,77 | ||||
| 2026-02-13 | 13F | Gen-Wealth Partners Inc | 1.538 | -3,51 | 540 | -8,32 | ||||
| 2026-01-21 | 13F | Woodmont Investment Counsel Llc | 3.319 | -2,50 | 1.167 | -7,31 | ||||
| 2026-02-11 | 13F | Ycg, Llc | 3.926 | 22,57 | 1.380 | 16,47 | ||||
| 2026-02-13 | 13F | 1832 Asset Management L.P. | 845.558 | 256,12 | 297.188 | 238,59 | ||||
| 2026-02-13 | 13F | Sargent Investment Group, LLC | 959 | 337 | ||||||
| 2026-02-24 | 13F | Astoria Portfolio Advisors LLC. | 2.425 | 2,62 | 933 | 5,30 | ||||
| 2026-02-13 | 13F | TRUE Private Wealth Advisors | 829 | 3,75 | 291 | -1,36 | ||||
| 2026-01-08 | 13F | Pine Haven Investment Counsel, Inc | 3.514 | -0,71 | 1.235 | -5,58 | ||||
| 2026-01-26 | 13F | Mirae Asset Global Investments Co., Ltd. | 60.717 | 18,96 | 21.340 | 13,11 | ||||
| 2026-02-13 | 13F | Jacobi Capital Management LLC | 3.671 | -1,74 | 1.290 | -6,59 | ||||
| 2026-02-05 | 13F | New York Life Investment Management Llc | 49.887 | -0,63 | 17.534 | -5,53 | ||||
| 2026-02-10 | 13F | National Pension Service | 706.367 | 3,29 | 248.267 | -1,80 | ||||
| 2026-01-21 | 13F | Elwood & Goetz Wealth Advisory Group, LLC | 713 | 0,14 | 251 | -4,94 | ||||
| 2026-02-11 | 13F | Erste Asset Management GmbH | 127.941 | 45.358 | ||||||
| 2026-01-21 | 13F | Modera Wealth Management, LLC | 43.187 | -1,85 | 15.179 | -6,68 | ||||
| 2026-01-21 | 13F | Jackson Square Capital, Llc | 3.423 | -57,92 | 1.203 | -59,99 | ||||
| 2026-01-23 | 13F | State of Alaska, Department of Revenue | 34.035 | -7,48 | 12 | -15,38 | ||||
| 2026-02-13 | 13F | Silvant Capital Management LLC | 5.200 | 0,00 | 1.828 | -4,94 | ||||
| 2026-02-12 | 13F | Granite Investment Partners, LLC | 55.992 | -3,66 | 19.680 | -8,40 | ||||
| 2026-02-17 | 13F | Fairscale Capital, LLC | 483 | 0,00 | 170 | -4,49 | ||||
| 2025-11-05 | 13F | SPC Financial, Inc. | 1.654 | 0,98 | 611 | -5,71 | ||||
| 2026-01-09 | 13F | First Heartland Consultants, Inc. | 947 | -2,07 | 333 | -7,00 | ||||
| 2025-10-30 | 13F | Covenant Asset Management, LLC | 0 | -100,00 | 0 | |||||
| 2026-01-16 | 13F | Ronald Blue Trust, Inc. | 7.628 | -0,68 | 2.681 | -5,60 | ||||
| 2026-02-11 | 13F | Victrix Investment Advisors | 1.275 | 0,00 | 448 | -4,88 | ||||
| 2026-02-17 | 13F | BlueSpruce Investments, LP | 943.647 | 7,14 | 331.664 | 1,86 | ||||
| 2026-02-10 | 13F | Texas Yale Capital Corp. | 9.163 | 0,88 | 3.221 | -4,08 | ||||
| 2026-02-04 | 13F | Northeast Investment Management | 583 | 0,00 | 205 | -5,12 | ||||
| 2026-01-13 | 13F | Well Done, LLC | 4.771 | 0,38 | 1.677 | -4,61 | ||||
| 2026-02-03 | 13F | Winch Advisory Services, LLC | 14.363 | -1,15 | 5.048 | -6,01 | ||||
| 2026-01-23 | 13F | Brown, Lisle/cummings, Inc. | 6.876 | 0,00 | 2.417 | -4,92 | ||||
| 2026-02-11 | 13F | O'shaughnessy Asset Management, Llc | 54.142 | 1,24 | 19.029 | -3,75 | ||||
| 2026-02-10 | 13F | WASHINGTON TRUST Co | 53.598 | -0,19 | 18.838 | -5,11 | ||||
| 2026-01-22 | 13F | Pinnacle Bancorp, Inc. | 670 | 0,00 | 235 | -4,86 | ||||
| 2026-02-10 | 13F | Lcnb Corp | 903 | 0,00 | 317 | -4,80 | ||||
| 2026-02-17 | 13F/A | Sentinus, LLC | 3.003 | 108,25 | 1.055 | 97,94 | ||||
| 2026-01-12 | 13F | JGP Wealth Management, LLC | 10.111 | 0,67 | 3.554 | -3,45 | ||||
| 2026-02-02 | 13F | PKO Investment Management Joint-Stock Co | 5.500 | 7,84 | 1.933 | 2,55 | ||||
| 2026-02-03 | 13F | Alecta Pensionsforsakring, Omsesidigt | 487.500 | 6,37 | 171.317 | 1,14 | ||||
| 2026-01-09 | 13F | McCollum Christoferson Group LLC | 780 | 0,00 | 274 | -4,86 | ||||
| 2026-02-10 | 13F | NS Partners Ltd | 111.263 | 1,69 | 39.106 | -3,32 | ||||
| 2026-01-15 | 13F | McGlone Suttner Wealth Management, Inc. | 821 | -7,02 | 288 | -11,66 | ||||
| 2026-02-17 | 13F | Canada Pension Plan Investment Board | 697.721 | 23,30 | 245.228 | 17,23 | ||||
| 2026-01-12 | 13F | Hummer Financial Advisory Services Inc | 1.150 | 0,00 | 405 | -4,93 | ||||
| 2026-02-03 | 13F | Brandywine Oak Private Wealth Llc | 1.469 | -29,00 | 516 | -32,46 | ||||
| 2026-02-10 | 13F | Kentucky Retirement Systems Insurance Trust Fund | 9.058 | 0,00 | 3.184 | -4,93 | ||||
| 2026-02-11 | 13F | Dorsey & Whitney Trust CO LLC | 4.262 | -4,72 | 1.498 | -9,44 | ||||
| 2026-02-05 | 13F | S&co Inc | 15.307 | -0,42 | 5 | 0,00 | ||||
| 2026-02-17 | 13F | Utah Retirement Systems | 56.869 | -0,02 | 19.988 | -4,94 | ||||
| 2026-01-27 | 13F | HCR Wealth Advisors | 8.523 | -2,10 | 2.996 | -6,11 | ||||
| 2026-01-28 | 13F | Atwood & Palmer Inc | 3 | -99,26 | 1 | -99,32 | ||||
| 2026-02-13 | 13F | McAdam, LLC | 769 | 1,05 | 270 | -3,91 | ||||
| 2026-02-09 | 13F | Kuhn & Co Investment Counsel | 1.481 | 2,85 | 521 | -2,26 | ||||
| 2025-11-05 | 13F | Moloney Securities Asset Management, LLC | 3.142 | 0,00 | 1.162 | -6,60 | ||||
| 2026-01-29 | 13F/A | Stockman Wealth Management, Inc. | 1.353 | -0,37 | 476 | -5,38 | ||||
| 2026-02-06 | 13F | Harvest Portfolios Group Inc. | 164.367 | 10,41 | 57.770 | 4,98 | ||||
| 2026-02-10 | 13F | Savant Capital, LLC | 6.260 | -4,15 | 2.200 | -8,86 | ||||
| 2026-02-17 | 13F | Orbimed Advisors Llc | 325.000 | -9,52 | 114.228 | -13,98 | ||||
| 2026-02-05 | 13F | Peak Asset Management, LLC | 49.224 | 0,72 | 17.301 | -4,25 | ||||
| 2026-02-06 | 13F | Tredje AP-fonden | 131.561 | 31,96 | 46.240 | 25,46 | ||||
| 2026-02-17 | 13F | Tudor Investment Corp Et Al | Put | 0 | -100,00 | 0 | -100,00 | |||
| 2026-02-17 | 13F | Quadrature Capital Ltd | 18.958 | 6.663 | ||||||
| 2026-01-27 | 13F | Stillwater Wealth Management Group | 7.728 | -3,48 | 2.716 | -8,21 | ||||
| 2026-02-17 | 13F | Spears Abacus Advisors LLC | 4.685 | 0,06 | 1.647 | -4,86 | ||||
| 2026-01-07 | 13F | Central Pacific Bank - Trust Division | 81 | -15,62 | 28 | -20,00 | ||||
| 2026-01-08 | 13F | Regent Peak Wealth Advisors LLC | 0 | -100,00 | 0 |