Grundlæggende statistik
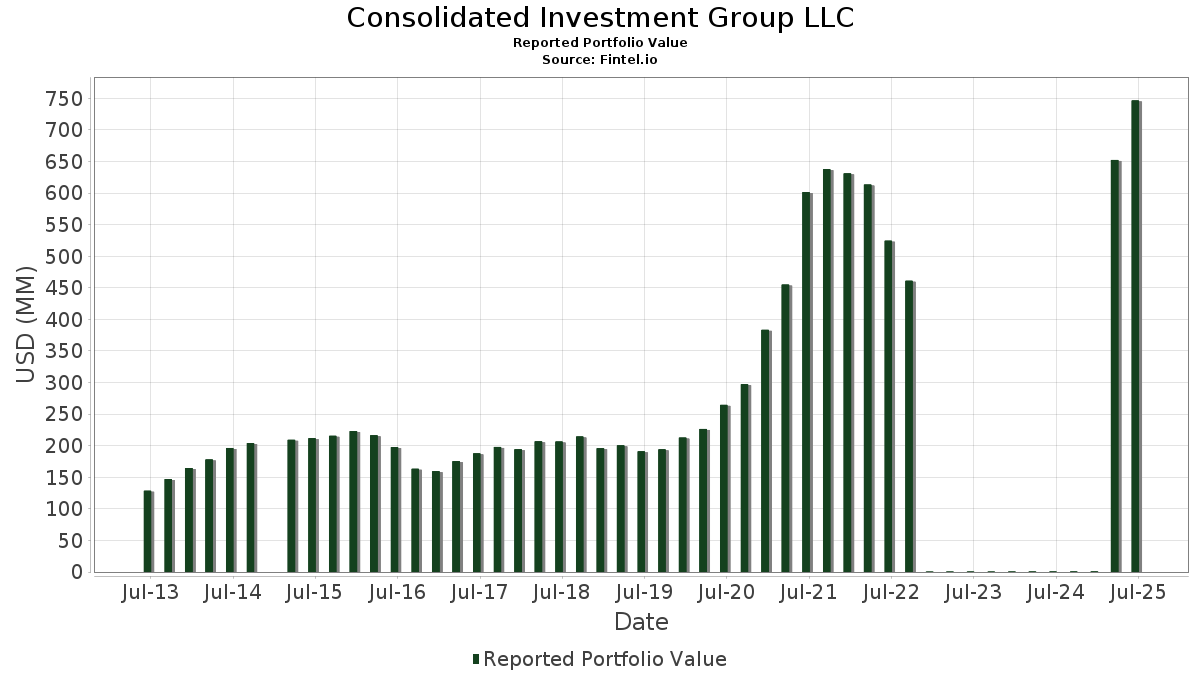
| Porteføljeværdi | $ 835.868.175 |
| Nuværende stillinger | 66 |
Seneste beholdninger, ydeevne, AUM (fra 13F, 13D)
Consolidated Investment Group LLC har afsløret 66 samlede besiddelser i deres seneste SEC-arkivering. Den seneste porteføljeværdi er beregnet til at være $ 835.868.175 USD. Faktiske aktiver under forvaltning (AUM) er denne værdi plus kontanter (som ikke er oplyst). Consolidated Investment Group LLCs største beholdninger er Invesco QQQ Trust, Series 1 (US:QQQ) , State Street SPDR S&P 500 ETF Trust (US:SPY) , Invesco Exchange-Traded Fund Trust - Invesco S&P 500 Equal Weight ETF (US:RSP) , Micron Technology, Inc. (US:MU) , and iShares Trust - iShares Russell Mid-Cap ETF (US:IWR) . Consolidated Investment Group LLCs nye stillinger omfatter Circle Internet Group, Inc. (US:CRCL) , .
Top øger dette kvartal
Vi bruger ændringen i porteføljeallokeringen, fordi dette er den mest meningsfulde metrik. Ændringer kan skyldes handler eller ændringer i aktiekurser.
| Sikkerhed | Aktier (MM) |
Værdi (MM$) |
Portefølje % | ΔPortefølje % |
|---|---|---|---|---|
| MU / Micron Technology, Inc. | 0,13 | 36,45 | 4,3607 | 1,4686 |
| GOOGL / Alphabet Inc. | 0,08 | 23,96 | 2,8665 | 0,5806 |
| SPY / State Street SPDR S&P 500 ETF Trust | 0,13 | 87,43 | 10,4601 | 0,2135 |
| META / Meta Platforms, Inc. | 0,01 | 5,21 | 0,6239 | 0,1818 |
| QQQ / Invesco QQQ Trust, Series 1 | 0,31 | 190,68 | 22,8124 | 0,1718 |
| CRCL / Circle Internet Group, Inc. | 0,02 | 1,21 | 0,1452 | 0,1452 |
| C / Citigroup Inc. | 0,09 | 10,08 | 1,2059 | 0,1289 |
| MAR / Marriott International, Inc. | 0,02 | 7,72 | 0,9233 | 0,1275 |
| EQR / Equity Residential | 0,05 | 2,96 | 0,3545 | 0,1159 |
| ACA / Arcosa, Inc. | 0,05 | 5,62 | 0,6729 | 0,0939 |
Top falder i dette kvartal
Vi bruger ændringen i porteføljeallokeringen, fordi dette er den mest meningsfulde metrik. Ændringer kan skyldes handler eller ændringer i aktiekurser.
| Sikkerhed | Aktier (MM) |
Værdi (MM$) |
Portefølje % | ΔPortefølje % |
|---|---|---|---|---|
| PANW / Palo Alto Networks, Inc. | 0,08 | 14,56 | 1,7417 | -0,4039 |
| AVGO / Broadcom Inc. | 0,08 | 26,55 | 3,1758 | -0,2972 |
| DKNG / DraftKings Inc. | 0,01 | 0,48 | 0,0577 | -0,2675 |
| NOW / ServiceNow, Inc. | 0,06 | 8,81 | 1,0538 | -0,2462 |
| BX / Blackstone Inc. | 0,08 | 12,84 | 1,5359 | -0,2121 |
| HD / The Home Depot, Inc. | 0,02 | 6,97 | 0,8345 | -0,1744 |
| MSFT / Microsoft Corporation | 0,03 | 13,16 | 1,5746 | -0,1569 |
| RSP / Invesco Exchange-Traded Fund Trust - Invesco S&P 500 Equal Weight ETF | 0,38 | 72,87 | 8,7177 | -0,1464 |
| WAB / Westinghouse Air Brake Technologies Corporation | 0,02 | 4,08 | 0,4877 | -0,1303 |
| ETN / Eaton Corporation plc | 0,02 | 5,22 | 0,6244 | -0,1289 |
13F og Fondsarkivering
Denne formular blev indsendt den 2026-01-26 for rapporteringsperioden 2025-12-31. Klik på linkikonet for at se den fulde transaktionshistorik.
Opgrader for at låse op for premium-data og eksportere til Excel ![]() .
.
| Sikkerhed | Type | Gennemsnitlig aktiekurs | Aktier (MM) |
Δ Aktier (%) |
Værdi ($MM) |
ΔVærdi (%) |
Portefølje (%) |
ΔPortefølje (%) |
|
|---|---|---|---|---|---|---|---|---|---|
| QQQ / Invesco QQQ Trust, Series 1 | 0,31 | 1,11 | 190,68 | 3,45 | 22,8124 | 0,1718 | |||
| SPY / State Street SPDR S&P 500 ETF Trust | 0,13 | 2,40 | 87,43 | 4,82 | 10,4601 | 0,2135 | |||
| RSP / Invesco Exchange-Traded Fund Trust - Invesco S&P 500 Equal Weight ETF | 0,38 | 0,00 | 72,87 | 0,98 | 8,7177 | -0,1464 | |||
| MU / Micron Technology, Inc. | 0,13 | -9,24 | 36,45 | 54,82 | 4,3607 | 1,4686 | |||
| IWR / iShares Trust - iShares Russell Mid-Cap ETF | 0,32 | 0,00 | 31,11 | -0,29 | 3,7217 | -0,1107 | |||
| IWM / iShares Trust - iShares Russell 2000 ETF | 0,12 | 0,00 | 29,46 | 1,73 | 3,5241 | -0,0326 | |||
| AVGO / Broadcom Inc. | 0,08 | -10,50 | 26,55 | -6,11 | 3,1758 | -0,2972 | |||
| NVDA / NVIDIA Corporation | 0,14 | 0,00 | 25,24 | -0,04 | 3,0201 | -0,0821 | |||
| GOOGL / Alphabet Inc. | 0,08 | 0,00 | 23,96 | 28,75 | 2,8665 | 0,5806 | |||
| AAPL / Apple Inc. | 0,06 | 0,00 | 17,33 | 6,77 | 2,0738 | 0,0795 | |||
| PANW / Palo Alto Networks, Inc. | 0,08 | -7,87 | 14,56 | -16,65 | 1,7417 | -0,4039 | |||
| MSFT / Microsoft Corporation | 0,03 | 0,00 | 13,16 | -6,63 | 1,5746 | -0,1569 | |||
| BX / Blackstone Inc. | 0,08 | 0,00 | 12,84 | -9,78 | 1,5359 | -0,2121 | |||
| AMZN / Amazon.com, Inc. | 0,05 | 0,00 | 12,65 | 5,12 | 1,5133 | 0,0352 | |||
| BAC / Bank of America Corporation | 0,20 | 0,00 | 10,73 | 6,61 | 1,2840 | 0,0474 | |||
| C / Citigroup Inc. | 0,09 | 0,00 | 10,08 | 14,97 | 1,2059 | 0,1289 | |||
| GSCE / GS Connect S&P GSCI Enhanced Commodity Total Return ETN | 0,01 | 0,00 | 9,69 | 10,38 | 1,1594 | 0,0809 | |||
| NOW / ServiceNow, Inc. | 0,06 | 400,00 | 8,81 | -16,77 | 1,0538 | -0,2462 | |||
| MS / Morgan Stanley | 0,05 | 0,00 | 8,74 | 11,68 | 1,0453 | 0,0843 | |||
| JPM / JPMorgan Chase & Co. | 0,03 | 0,00 | 8,60 | 2,15 | 1,0293 | -0,0053 | |||
| NFLX / Netflix, Inc. | 0,09 | 1.097,39 | 8,53 | -6,36 | 1,0206 | -0,0985 | |||
| V / Visa Inc. | 0,02 | 0,00 | 8,18 | 2,74 | 0,9785 | 0,0005 | |||
| WMB / The Williams Companies, Inc. | 0,13 | 0,00 | 7,82 | -5,11 | 0,9357 | -0,0768 | |||
| MAR / Marriott International, Inc. | 0,02 | 0,00 | 7,72 | 19,13 | 0,9233 | 0,1275 | |||
| MGM / MGM Resorts International | 0,21 | 0,00 | 7,54 | 5,28 | 0,9016 | 0,0223 | |||
| HD / The Home Depot, Inc. | 0,02 | 0,00 | 6,97 | -15,09 | 0,8345 | -0,1744 | |||
| GOOGL / Alphabet Inc. | 0,02 | -14,18 | 6,83 | 10,56 | 0,8177 | 0,0584 | |||
| TMO / Thermo Fisher Scientific Inc. | 0,01 | -21,85 | 6,22 | -6,64 | 0,7438 | -0,0742 | |||
| GLD / SPDR Gold Shares | 0,01 | 0,00 | 5,94 | 11,48 | 0,7112 | 0,0562 | |||
| ABBV / AbbVie Inc. | 0,03 | 0,00 | 5,90 | -1,30 | 0,7062 | -0,0286 | |||
| ACA / Arcosa, Inc. | 0,05 | 5,17 | 5,62 | 19,33 | 0,6729 | 0,0939 | |||
| UNH / UnitedHealth Group Incorporated | 0,02 | 0,00 | 5,53 | -4,39 | 0,6615 | -0,0490 | |||
| SOFI / SoFi Technologies, Inc. | 0,20 | 0,00 | 5,26 | -0,90 | 0,6298 | -0,0228 | |||
| ETN / Eaton Corporation plc | 0,02 | 0,00 | 5,22 | -14,91 | 0,6244 | -0,1289 | |||
| META / Meta Platforms, Inc. | 0,01 | 61,22 | 5,21 | 44,91 | 0,6239 | 0,1818 | |||
| CRM / Salesforce, Inc. | 0,02 | 0,00 | 5,12 | 11,77 | 0,6125 | 0,0499 | |||
| EQIX / Equinix, Inc. | 0,01 | 0,00 | 4,79 | -2,19 | 0,5729 | -0,0284 | |||
| HON / Honeywell International Inc. | 0,02 | 0,00 | 4,75 | -7,31 | 0,5686 | -0,0613 | |||
| URI / United Rentals, Inc. | 0,01 | 0,00 | 4,61 | -15,22 | 0,5519 | -0,1165 | |||
| SYK / Stryker Corporation | 0,01 | 24,74 | 4,61 | 18,58 | 0,5513 | 0,0740 | |||
| LIN / Linde plc | 0,01 | 8,52 | 4,34 | -2,60 | 0,5198 | -0,0281 | |||
| CVX / Chevron Corporation | 0,03 | 0,00 | 4,23 | -1,86 | 0,5062 | -0,0234 | |||
| WAB / Westinghouse Air Brake Technologies Corporation | 0,02 | -23,90 | 4,08 | -18,98 | 0,4877 | -0,1303 | |||
| UHS / Universal Health Services, Inc. | 0,02 | -19,58 | 4,03 | -14,24 | 0,4821 | -0,0951 | |||
| UBER / Uber Technologies, Inc. | 0,05 | 16,74 | 3,82 | -2,65 | 0,4568 | -0,0249 | |||
| XLU / The Select Sector SPDR Trust - State Street Utilities Select Sector SPDR ETF | 0,08 | 100,00 | 3,40 | -2,10 | 0,4073 | -0,0199 | |||
| PLD / Prologis, Inc. | 0,02 | 0,00 | 3,13 | 11,48 | 0,3742 | 0,0295 | |||
| EQR / Equity Residential | 0,05 | 56,67 | 2,96 | 52,60 | 0,3545 | 0,1159 | |||
| SCI / Service Corporation International | 0,04 | 0,00 | 2,92 | -6,32 | 0,3493 | -0,0335 | |||
| CPT / Camden Property Trust | 0,02 | 27,93 | 2,52 | 31,87 | 0,3016 | 0,0668 | |||
| GM / General Motors Company | 0,03 | 0,00 | 2,40 | 33,39 | 0,2873 | 0,0661 | |||
| PYPL / PayPal Holdings, Inc. | 0,04 | 0,00 | 2,40 | -12,96 | 0,2869 | -0,0515 | |||
| LNG / Cheniere Energy, Inc. | 0,01 | 58,44 | 2,37 | 31,07 | 0,2837 | 0,0615 | |||
| SNOW / Snowflake Inc. | 0,01 | 43,48 | 2,17 | 39,52 | 0,2598 | 0,0686 | |||
| VST / Vistra Corp. | 0,01 | 71,43 | 1,94 | 41,14 | 0,2316 | 0,0631 | |||
| INDA / iShares Trust - iShares MSCI India ETF | 0,03 | 0,00 | 1,79 | 3,84 | 0,2137 | 0,0024 | |||
| EOG / EOG Resources, Inc. | 0,02 | 0,00 | 1,74 | -6,34 | 0,2085 | -0,0201 | |||
| TSLA / Tesla, Inc. | 0,00 | 0,00 | 1,71 | 1,12 | 0,2045 | -0,0031 | |||
| APG / APi Group Corporation | 0,04 | 0,00 | 1,65 | 11,37 | 0,1968 | 0,0153 | |||
| IWP / iShares Trust - iShares Russell Mid-Cap Growth ETF | 0,01 | 0,00 | 1,60 | -3,84 | 0,1917 | -0,0130 | |||
| MAA / Mid-America Apartment Communities, Inc. | 0,01 | 0,00 | 1,56 | -0,58 | 0,1861 | -0,0061 | |||
| UDR / UDR, Inc. | 0,04 | 0,00 | 1,50 | -1,57 | 0,1799 | -0,0077 | |||
| LOW / Lowe's Companies, Inc. | 0,01 | 0,00 | 1,48 | -4,03 | 0,1767 | -0,0124 | |||
| CRCL / Circle Internet Group, Inc. | 0,02 | 1,21 | 0,1452 | 0,1452 | |||||
| SBUX / Starbucks Corporation | 0,01 | 0,00 | 1,10 | -0,54 | 0,1320 | -0,0042 | |||
| DKNG / DraftKings Inc. | 0,01 | -80,22 | 0,48 | -81,79 | 0,0577 | -0,2675 | |||
| GT / The Goodyear Tire & Rubber Company | 0,00 | -100,00 | 0,00 | 0,0000 | |||||
| DIS / The Walt Disney Company | 0,00 | -100,00 | 0,00 | 0,0000 | |||||
| KRE / SPDR Series Trust - State Street SPDR S&P Regional Banking ETF | 0,00 | -100,00 | 0,00 | 0,0000 | |||||
| ZTS / Zoetis Inc. | 0,00 | -100,00 | 0,00 | 0,0000 |