Grundlæggende statistik
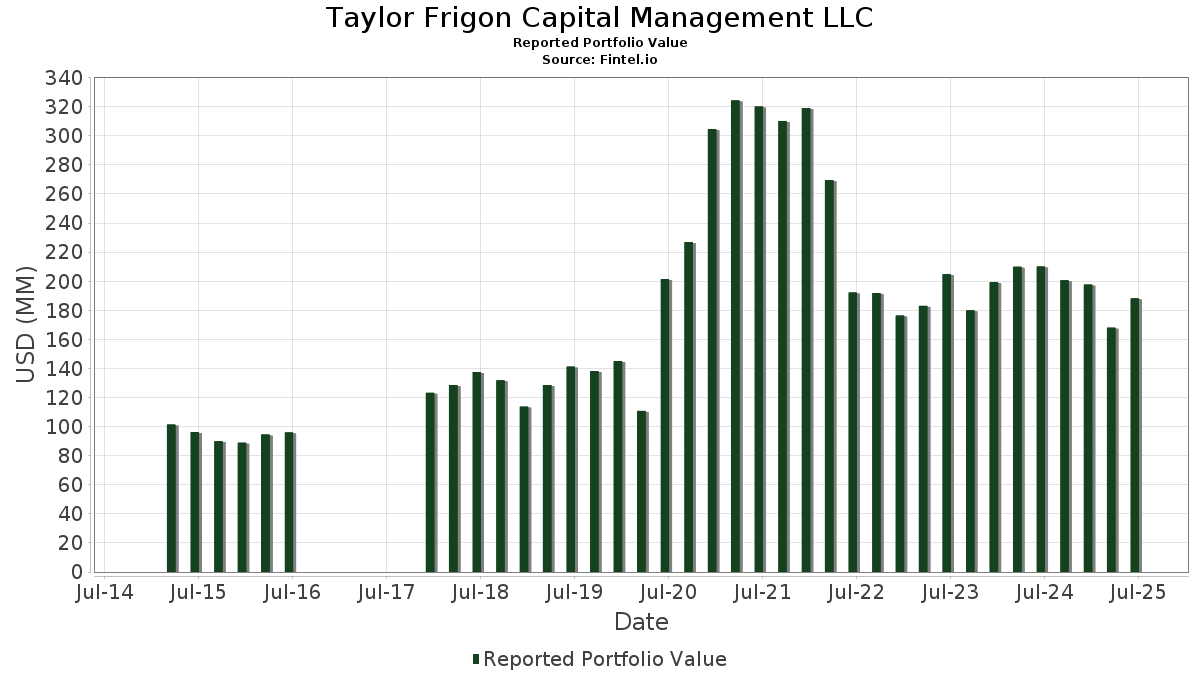
| Porteføljeværdi | $ 188.111.758 |
| Nuværende stillinger | 90 |
Seneste beholdninger, ydeevne, AUM (fra 13F, 13D)
Taylor Frigon Capital Management LLC har afsløret 90 samlede besiddelser i deres seneste SEC-arkivering. Den seneste porteføljeværdi er beregnet til at være $ 188.111.758 USD. Faktiske aktiver under forvaltning (AUM) er denne værdi plus kontanter (som ikke er oplyst). Taylor Frigon Capital Management LLCs største beholdninger er Credo Technology Group Holding Ltd (US:CRDO) , Monolithic Power Systems, Inc. (US:MPWR) , Carvana Co. (US:CVNA) , Cloudflare, Inc. (US:NET) , and Glaukos Corporation (US:GKOS) . Taylor Frigon Capital Management LLCs nye stillinger omfatter GitLab Inc. (US:GTLB) , .
Top øger dette kvartal
Vi bruger ændringen i porteføljeallokeringen, fordi dette er den mest meningsfulde metrik. Ændringer kan skyldes handler eller ændringer i aktiekurser.
| Sikkerhed | Aktier (MM) |
Værdi (MM$) |
Portefølje % | ΔPortefølje % |
|---|---|---|---|---|
| 0,05 | 2,14 | 1,1377 | 1,1377 | |
| 0,05 | 4,20 | 2,2323 | 1,0660 | |
| 0,08 | 2,98 | 1,5833 | 0,5965 | |
| 0,02 | 3,37 | 1,7936 | 0,5569 | |
| 0,03 | 2,75 | 1,4617 | 0,5015 | |
| 0,09 | 2,85 | 1,5138 | 0,4029 | |
| 0,03 | 3,22 | 1,7134 | 0,3908 | |
| 0,05 | 2,78 | 1,4786 | 0,3766 | |
| 0,02 | 2,36 | 1,2553 | 0,3532 | |
| 0,00 | 2,49 | 1,3228 | 0,3269 |
Top falder i dette kvartal
Vi bruger ændringen i porteføljeallokeringen, fordi dette er den mest meningsfulde metrik. Ændringer kan skyldes handler eller ændringer i aktiekurser.
| Sikkerhed | Aktier (MM) |
Værdi (MM$) |
Portefølje % | ΔPortefølje % |
|---|---|---|---|---|
| 0,02 | 2,30 | 1,2245 | -0,6169 | |
| 0,03 | 1,63 | 0,8679 | -0,3844 | |
| 0,02 | 2,10 | 1,1181 | -0,3624 | |
| 0,16 | 1,80 | 0,9556 | -0,3169 | |
| 0,05 | 2,80 | 1,4897 | -0,3165 | |
| 0,03 | 2,14 | 1,1363 | -0,3038 | |
| 0,00 | 1,68 | 0,8948 | -0,3014 | |
| 0,13 | 2,43 | 1,2915 | -0,2681 | |
| 0,08 | 1,37 | 0,7273 | -0,2614 | |
| 0,19 | 1,73 | 0,9204 | -0,2530 |
13F og Fondsarkivering
Denne formular blev indsendt den 2025-07-17 for rapporteringsperioden 2025-06-30. Klik på linkikonet for at se den fulde transaktionshistorik.
Opgrader for at låse op for premium-data og eksportere til Excel ![]() .
.
| Sikkerhed | Type | Gennemsnitlig aktiekurs | Aktier (MM) |
Δ Aktier (%) |
Δ Aktier (%) |
Værdi ($MM) |
Portefølje (%) |
ΔPortefølje (%) |
|
|---|---|---|---|---|---|---|---|---|---|
| CRDO / Credo Technology Group Holding Ltd | 0,05 | -7,03 | 4,20 | 114,34 | 2,2323 | 1,0660 | |||
| MPWR / Monolithic Power Systems, Inc. | 0,00 | -11,12 | 3,53 | 12,08 | 1,8740 | 0,0018 | |||
| CVNA / Carvana Co. | 0,01 | -29,75 | 3,39 | 13,93 | 1,8006 | 0,0304 | |||
| NET / Cloudflare, Inc. | 0,02 | -6,06 | 3,37 | 62,40 | 1,7936 | 0,5569 | |||
| GKOS / Glaukos Corporation | 0,03 | 39,40 | 3,22 | 45,11 | 1,7134 | 0,3908 | |||
| MAIN / Main Street Capital Corporation | 0,05 | 12,77 | 3,01 | 17,85 | 1,6010 | 0,0796 | |||
| SYM / Symbotic Inc. | 0,08 | -6,53 | 2,98 | 79,72 | 1,5833 | 0,5965 | |||
| ALKT / Alkami Technology, Inc. | 0,09 | 32,90 | 2,85 | 52,57 | 1,5138 | 0,4029 | |||
| CYBR / CyberArk Software Ltd. | 0,01 | -4,73 | 2,84 | 11,70 | 1,5078 | -0,0041 | |||
| PCOR / Procore Technologies, Inc. | 0,04 | -5,76 | 2,83 | -2,68 | 1,5069 | -0,2266 | |||
| TMDX / TransMedics Group, Inc. | 0,02 | -33,19 | 2,82 | 33,03 | 1,5011 | 0,2379 | |||
| PRCT / PROCEPT BioRobotics Corporation | 0,05 | -6,58 | 2,80 | -7,65 | 1,4897 | -0,3165 | |||
| MBLY / Mobileye Global Inc. | 0,16 | -5,22 | 2,80 | 18,39 | 1,4890 | 0,0806 | |||
| PSTG / Pure Storage, Inc. | 0,05 | 23,22 | 2,78 | 50,24 | 1,4786 | 0,3766 | |||
| ARCC / Ares Capital Corporation | 0,13 | 20,90 | 2,77 | 19,78 | 1,4752 | 0,0964 | |||
| HTGC / Hercules Capital, Inc. | 0,15 | 32,16 | 2,77 | 25,79 | 1,4726 | 0,1613 | |||
| CAMT / Camtek Ltd. | 0,03 | 18,19 | 2,75 | 70,43 | 1,4617 | 0,5015 | |||
| ALAB / Astera Labs, Inc. | 0,03 | -6,16 | 2,68 | 42,18 | 1,4266 | 0,3032 | |||
| MNDY / monday.com Ltd. | 0,01 | -5,55 | 2,67 | 22,13 | 1,4177 | 0,1181 | |||
| FVRR / Fiverr International Ltd. | 0,09 | -5,37 | 2,65 | 10,85 | 1,4072 | -0,0148 | |||
| PI / Impinj, Inc. | 0,02 | -6,34 | 2,63 | 14,70 | 1,3982 | 0,0331 | |||
| MRVL / Marvell Technology, Inc. | 0,03 | 16,45 | 2,60 | 46,45 | 1,3827 | 0,3251 | |||
| APH / Amphenol Corporation | 0,03 | -4,16 | 2,58 | 44,34 | 1,3705 | 0,3069 | |||
| TOST / Toast, Inc. | 0,06 | -5,99 | 2,53 | 25,56 | 1,3425 | 0,1448 | |||
| IDXX / IDEXX Laboratories, Inc. | 0,00 | -6,68 | 2,52 | 19,52 | 1,3378 | 0,0842 | |||
| KLAC / KLA Corporation | 0,00 | 12,88 | 2,49 | 48,80 | 1,3228 | 0,3269 | |||
| TSEM / Tower Semiconductor Ltd. | 0,06 | -5,15 | 2,47 | 15,31 | 1,3137 | 0,0379 | |||
| KRNT / Kornit Digital Ltd. | 0,13 | -9,44 | 2,43 | -7,25 | 1,2915 | -0,2681 | |||
| AXP / American Express Company | 0,01 | -3,73 | 2,37 | 14,12 | 1,2590 | 0,0236 | |||
| ONTO / Onto Innovation Inc. | 0,02 | 40,18 | 2,36 | 16,63 | 1,2567 | 0,0498 | |||
| CCI / Crown Castle Inc. | 0,02 | 58,09 | 2,36 | 55,84 | 1,2553 | 0,3532 | |||
| DLR / Digital Realty Trust, Inc. | 0,01 | -1,90 | 2,35 | 19,37 | 1,2517 | 0,0773 | |||
| ARE / Alexandria Real Estate Equities, Inc. | 0,03 | 74,40 | 2,35 | 36,95 | 1,2474 | 0,2272 | |||
| DXCM / DexCom, Inc. | 0,03 | -5,96 | 2,34 | 20,23 | 1,2422 | 0,0850 | |||
| TW / Tradeweb Markets Inc. | 0,02 | -24,49 | 2,30 | -25,54 | 1,2245 | -0,6169 | |||
| NICE / NICE Ltd. - Depositary Receipt (Common Stock) | 0,01 | 7,45 | 2,29 | 17,46 | 1,2159 | 0,0563 | |||
| BROS / Dutch Bros Inc. | 0,03 | 12,73 | 2,27 | 24,85 | 1,2075 | 0,1244 | |||
| GDYN / Grid Dynamics Holdings, Inc. | 0,20 | 37,63 | 2,26 | 1,57 | 1,2011 | -0,1231 | |||
| MDB / MongoDB, Inc. | 0,01 | -5,80 | 2,18 | 12,35 | 1,1566 | 0,0037 | |||
| BOOT / Boot Barn Holdings, Inc. | 0,01 | -23,08 | 2,17 | 9,45 | 1,1513 | -0,0267 | |||
| CLPT / ClearPoint Neuro, Inc. | 0,18 | -5,85 | 2,15 | -5,44 | 1,1454 | -0,2112 | |||
| NVCR / NovoCure Limited | 0,12 | -5,74 | 2,14 | -5,81 | 1,1377 | -0,2153 | |||
| GTLB / GitLab Inc. | 0,05 | 2,14 | 1,1377 | 1,1377 | |||||
| CBZ / CBIZ, Inc. | 0,03 | -6,53 | 2,14 | -11,66 | 1,1363 | -0,3038 | |||
| TTAN / ServiceTitan, Inc. | 0,02 | -24,95 | 2,10 | -15,44 | 1,1181 | -0,3624 | |||
| BILL / BILL Holdings, Inc. | 0,05 | 21,81 | 2,10 | 22,59 | 1,1168 | 0,0968 | |||
| COST / Costco Wholesale Corporation | 0,00 | -4,52 | 2,09 | -0,10 | 1,1104 | -0,1338 | |||
| EW / Edwards Lifesciences Corporation | 0,03 | 0,31 | 2,08 | 8,23 | 1,1052 | -0,0381 | |||
| WIX / Wix.com Ltd. | 0,01 | -5,08 | 2,08 | -7,93 | 1,1042 | -0,2388 | |||
| EPAM / EPAM Systems, Inc. | 0,01 | 2,86 | 2,04 | 6,36 | 1,0847 | -0,0572 | |||
| FHI / Federated Hermes, Inc. | 0,04 | -2,98 | 1,89 | 5,47 | 1,0050 | -0,0621 | |||
| NSSC / Napco Security Technologies, Inc. | 0,06 | -6,05 | 1,85 | 21,18 | 0,9858 | 0,0748 | |||
| OMF / OneMain Holdings, Inc. | 0,03 | -0,85 | 1,81 | 15,63 | 0,9601 | 0,0303 | |||
| ALL / The Allstate Corporation | 0,01 | -1,62 | 1,81 | -4,35 | 0,9596 | -0,1639 | |||
| TXN / Texas Instruments Incorporated | 0,01 | -1,53 | 1,80 | 13,76 | 0,9582 | 0,0151 | |||
| GCMG / GCM Grosvenor Inc. | 0,16 | -3,76 | 1,80 | -15,91 | 0,9556 | -0,3169 | |||
| EXR / Extra Space Storage Inc. | 0,01 | -1,33 | 1,78 | -2,04 | 0,9472 | -0,1354 | |||
| CGEN / Compugen Ltd. | 0,99 | -5,21 | 1,77 | 15,61 | 0,9412 | 0,0292 | |||
| EQIX / Equinix, Inc. | 0,00 | -1,48 | 1,75 | -3,84 | 0,9319 | -0,1537 | |||
| LUCK / Lucky Strike Entertainment Corporation | 0,19 | -6,10 | 1,73 | -12,18 | 0,9204 | -0,2530 | |||
| ROL / Rollins, Inc. | 0,03 | -2,28 | 1,73 | 2,01 | 0,9183 | -0,0895 | |||
| SYK / Stryker Corporation | 0,00 | -3,05 | 1,70 | 3,04 | 0,9026 | -0,0783 | |||
| WSO / Watsco, Inc. | 0,00 | -3,59 | 1,68 | -16,23 | 0,8948 | -0,3014 | |||
| ASML / ASML Holding N.V. - Depositary Receipt (Common Stock) | 0,00 | -2,11 | 1,64 | 18,44 | 0,8708 | 0,0472 | |||
| CCOI / Cogent Communications Holdings, Inc. | 0,03 | -1,30 | 1,63 | -22,40 | 0,8679 | -0,3844 | |||
| INMD / InMode Ltd. | 0,10 | 6,05 | 1,63 | -8,06 | 0,8677 | -0,1894 | |||
| QUIK / QuickLogic Corporation | 0,26 | -4,91 | 1,62 | 14,61 | 0,8596 | 0,0199 | |||
| HR / Healthcare Realty Trust Incorporated | 0,10 | -1,35 | 1,55 | -7,43 | 0,8222 | -0,1723 | |||
| GGG / Graco Inc. | 0,02 | -1,42 | 1,52 | 1,47 | 0,8072 | -0,0835 | |||
| QCOM / QUALCOMM Incorporated | 0,01 | -0,71 | 1,50 | 2,94 | 0,7997 | -0,0702 | |||
| SYY / Sysco Corporation | 0,02 | -1,19 | 1,50 | -0,27 | 0,7992 | -0,0982 | |||
| FDS / FactSet Research Systems Inc. | 0,00 | -1,54 | 1,49 | -3,12 | 0,7924 | -0,1236 | |||
| STE / STERIS plc | 0,01 | -1,48 | 1,49 | 4,43 | 0,7901 | -0,0572 | |||
| MKC / McCormick & Company, Incorporated | 0,02 | -1,66 | 1,46 | -9,45 | 0,7745 | -0,1829 | |||
| RHP / Ryman Hospitality Properties, Inc. | 0,01 | -1,33 | 1,45 | 6,45 | 0,7726 | -0,0399 | |||
| JKHY / Jack Henry & Associates, Inc. | 0,01 | -1,21 | 1,40 | -2,51 | 0,7445 | -0,1107 | |||
| FPI / Farmland Partners Inc. | 0,12 | -1,89 | 1,39 | 1,31 | 0,7380 | -0,0780 | |||
| TSCO / Tractor Supply Company | 0,03 | -2,14 | 1,38 | -6,27 | 0,7312 | -0,1424 | |||
| IRT / Independence Realty Trust, Inc. | 0,08 | -1,14 | 1,37 | -17,59 | 0,7273 | -0,2614 | |||
| AFG / American Financial Group, Inc. | 0,01 | -1,11 | 1,36 | -5,02 | 0,7249 | -0,1293 | |||
| FAST / Fastenal Company | 0,03 | 97,10 | 1,26 | 6,78 | 0,6702 | -0,0329 | |||
| HLI / Houlihan Lokey, Inc. | 0,01 | -1,43 | 1,20 | 9,88 | 0,6386 | -0,0125 | |||
| TJX / The TJX Companies, Inc. | 0,01 | -1,38 | 1,19 | 0,00 | 0,6329 | -0,0759 | |||
| AVY / Avery Dennison Corporation | 0,01 | -1,01 | 1,17 | -2,43 | 0,6204 | -0,0915 | |||
| POOL / Pool Corporation | 0,00 | -0,93 | 1,08 | -9,31 | 0,5751 | -0,1349 | |||
| APYX / Apyx Medical Corporation | 0,48 | -6,77 | 1,08 | 53,20 | 0,5728 | 0,1539 | |||
| HD / The Home Depot, Inc. | 0,00 | -1,37 | 1,06 | -1,31 | 0,5623 | -0,0758 | |||
| TTC / The Toro Company | 0,01 | -1,45 | 1,04 | -4,24 | 0,5520 | -0,0936 | |||
| FMC / FMC Corporation | 0,02 | -1,39 | 0,98 | -2,40 | 0,5185 | -0,0765 | |||
| VUZI / Vuzix Corporation | 0,33 | -5,99 | 0,97 | 34,58 | 0,5152 | 0,0865 | |||
| NVEE / NV5 Global, Inc. | 0,00 | -100,00 | 0,00 | 0,0000 |