Grundlæggende statistik
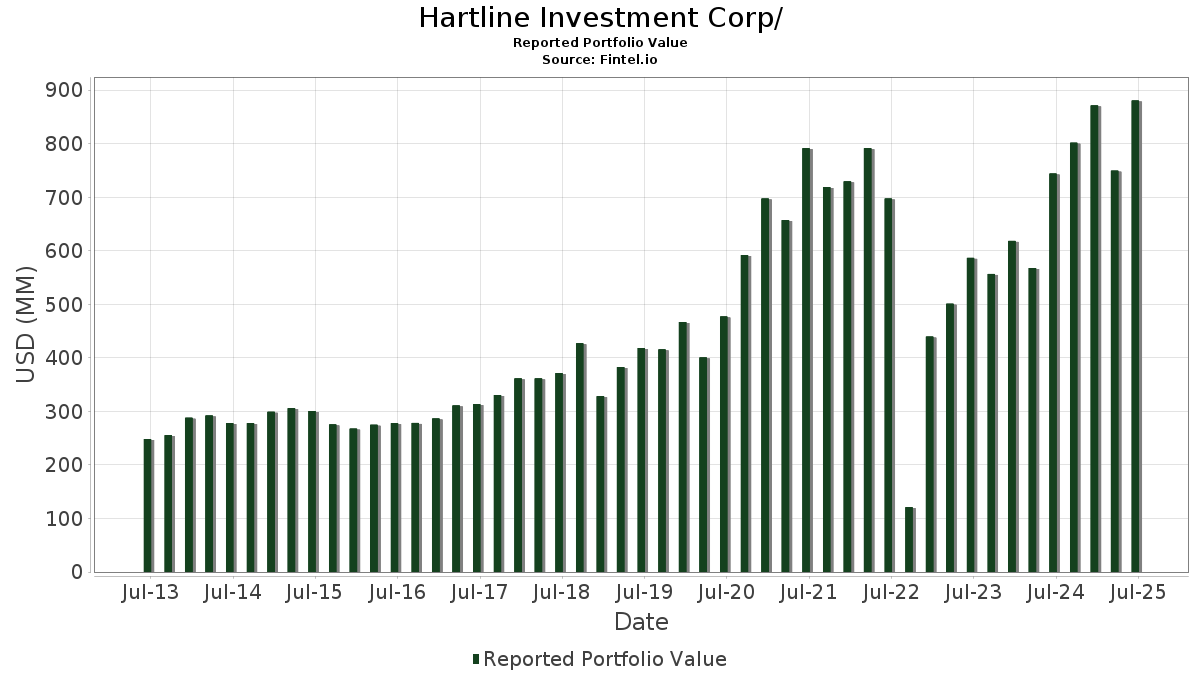
| Porteføljeværdi | $ 880.553.565 |
| Nuværende stillinger | 104 |
Seneste beholdninger, ydeevne, AUM (fra 13F, 13D)
Hartline Investment Corp/ har afsløret 104 samlede besiddelser i deres seneste SEC-arkivering. Den seneste porteføljeværdi er beregnet til at være $ 880.553.565 USD. Faktiske aktiver under forvaltning (AUM) er denne værdi plus kontanter (som ikke er oplyst). Hartline Investment Corp/s største beholdninger er NVIDIA Corporation (US:NVDA) , Berkshire Hathaway Inc. (US:BRK.A) , Apple Inc. (US:AAPL) , iShares Trust - iShares Floating Rate Bond ETF (US:FLOT) , and Microsoft Corporation (US:MSFT) . Hartline Investment Corp/s nye stillinger omfatter Uber Technologies, Inc. (US:UBER) , GE Vernova Inc. (US:GEV) , Corning Incorporated (US:GLW) , Robinhood Markets, Inc. (US:HOOD) , and Constellation Energy Corporation (US:CEG) .
Top øger dette kvartal
Vi bruger ændringen i porteføljeallokeringen, fordi dette er den mest meningsfulde metrik. Ændringer kan skyldes handler eller ændringer i aktiekurser.
| Sikkerhed | Aktier (MM) |
Værdi (MM$) |
Portefølje % | ΔPortefølje % |
|---|---|---|---|---|
| 0,76 | 120,74 | 13,7118 | 2,1120 | |
| 0,17 | 16,31 | 1,8517 | 1,8517 | |
| 0,01 | 11,36 | 1,2905 | 1,1712 | |
| 0,52 | 9,48 | 1,0769 | 1,0569 | |
| 0,01 | 7,49 | 0,8504 | 0,8504 | |
| 0,15 | 28,68 | 3,2571 | 0,8447 | |
| 0,07 | 8,42 | 0,9567 | 0,8383 | |
| 0,14 | 7,28 | 0,8273 | 0,8273 | |
| 0,06 | 5,80 | 0,6588 | 0,6588 | |
| 0,41 | 31,67 | 3,5961 | 0,5099 |
Top falder i dette kvartal
Vi bruger ændringen i porteføljeallokeringen, fordi dette er den mest meningsfulde metrik. Ændringer kan skyldes handler eller ændringer i aktiekurser.
| Sikkerhed | Aktier (MM) |
Værdi (MM$) |
Portefølje % | ΔPortefølje % |
|---|---|---|---|---|
| 0,00 | 91,83 | 10,4285 | -2,9934 | |
| 0,22 | 45,09 | 5,1211 | -2,3964 | |
| 0,14 | 23,81 | 2,7038 | -1,9667 | |
| 0,85 | 43,27 | 4,9134 | -1,4923 | |
| 0,00 | 0,26 | 0,0300 | -0,7553 | |
| 0,01 | 2,42 | 0,2745 | -0,5157 | |
| 0,42 | 21,35 | 2,4246 | -0,4027 | |
| 0,00 | 0,00 | -0,2092 | ||
| 0,03 | 6,33 | 0,7189 | -0,2029 | |
| 0,07 | 9,44 | 1,0720 | -0,1984 |
13F og Fondsarkivering
Denne formular blev indsendt den 2025-07-29 for rapporteringsperioden 2025-06-30. Klik på linkikonet for at se den fulde transaktionshistorik.
Opgrader for at låse op for premium-data og eksportere til Excel ![]() .
.
| Sikkerhed | Type | Gennemsnitlig aktiekurs | Aktier (MM) |
Δ Aktier (%) |
Δ Aktier (%) |
Værdi ($MM) |
Portefølje (%) |
ΔPortefølje (%) |
|
|---|---|---|---|---|---|---|---|---|---|
| NVDA / NVIDIA Corporation | 0,76 | -4,74 | 120,74 | 38,87 | 13,7118 | 2,1120 | |||
| BRK.A / Berkshire Hathaway Inc. | 0,00 | 0,00 | 91,83 | -8,72 | 10,4285 | -2,9934 | |||
| AAPL / Apple Inc. | 0,22 | -13,36 | 45,09 | -19,97 | 5,1211 | -2,3964 | |||
| FLOT / iShares Trust - iShares Floating Rate Bond ETF | 0,85 | -9,84 | 43,27 | -9,89 | 4,9134 | -1,4923 | |||
| MSFT / Microsoft Corporation | 0,07 | -7,60 | 33,90 | 22,43 | 3,8501 | 0,1558 | |||
| AMZN / Amazon.com, Inc. | 0,15 | -2,44 | 33,32 | 12,49 | 3,7842 | -0,1676 | |||
| MRVL / Marvell Technology, Inc. | 0,41 | 8,89 | 31,67 | 36,89 | 3,5961 | 0,5099 | |||
| NOW / ServiceNow, Inc. | 0,03 | -2,60 | 28,82 | 25,78 | 3,2733 | 0,2159 | |||
| NET / Cloudflare, Inc. | 0,15 | -8,73 | 28,68 | 58,62 | 3,2571 | 0,8447 | |||
| META / Meta Platforms, Inc. | 0,04 | -0,88 | 26,79 | 26,92 | 3,0426 | 0,2265 | |||
| VRT / Vertiv Holdings Co | 0,19 | -25,75 | 24,67 | 32,06 | 2,8020 | 0,3092 | |||
| GOOGL / Alphabet Inc. | 0,14 | -40,32 | 23,81 | -31,99 | 2,7038 | -1,9667 | |||
| AMD / Advanced Micro Devices, Inc. | 0,15 | -0,28 | 21,50 | 37,72 | 2,4422 | 0,3590 | |||
| TFLO / iShares Trust - iShares Treasury Floating Rate Bond ETF | 0,42 | 0,76 | 21,35 | 0,74 | 2,4246 | -0,4027 | |||
| PLTR / Palantir Technologies Inc. | 0,15 | -21,90 | 19,80 | 26,15 | 2,2488 | 0,1546 | |||
| WMT / Walmart Inc. | 0,18 | 0,00 | 17,98 | 11,38 | 2,0415 | -0,1118 | |||
| UBER / Uber Technologies, Inc. | 0,17 | 16,31 | 1,8517 | 1,8517 | |||||
| LLY / Eli Lilly and Company | 0,02 | 19,46 | 13,21 | 12,75 | 1,5004 | -0,0629 | |||
| BRK.B / Berkshire Hathaway Inc. | 0,02 | 12,18 | 11,63 | 2,32 | 1,3211 | -0,1957 | |||
| NFLX / Netflix, Inc. | 0,01 | 784,88 | 11,36 | 1.171,03 | 1,2905 | 1,1712 | |||
| PANW / Palo Alto Networks, Inc. | 0,05 | 2,83 | 9,80 | 23,33 | 1,1132 | 0,0528 | |||
| COST / Costco Wholesale Corporation | 0,01 | 0,00 | 9,62 | 4,67 | 1,0924 | -0,1337 | |||
| SOFI / SoFi Technologies, Inc. | 0,52 | 3.939,07 | 9,48 | 6.263,76 | 1,0769 | 1,0569 | |||
| MS / Morgan Stanley | 0,07 | -17,89 | 9,44 | -0,86 | 1,0720 | -0,1984 | |||
| V / Visa Inc. | 0,03 | 24,13 | 9,28 | 25,77 | 1,0542 | 0,0694 | |||
| STRK / Strategy Inc - Preferred Stock | 0,07 | 559,02 | 8,42 | 849,72 | 0,9567 | 0,8383 | |||
| MAR / Marriott International, Inc. | 0,03 | -8,54 | 8,23 | 4,89 | 0,9347 | -0,1121 | |||
| GEV / GE Vernova Inc. | 0,01 | 7,49 | 0,8504 | 0,8504 | |||||
| GLW / Corning Incorporated | 0,14 | 7,28 | 0,8273 | 0,8273 | |||||
| LOW / Lowe's Companies, Inc. | 0,03 | -3,69 | 6,33 | -8,38 | 0,7189 | -0,2029 | |||
| VEEV / Veeva Systems Inc. | 0,02 | -4,36 | 6,25 | 18,90 | 0,7094 | 0,0085 | |||
| CARR / Carrier Global Corporation | 0,08 | 182,06 | 6,15 | 225,70 | 0,6980 | 0,4462 | |||
| HOOD / Robinhood Markets, Inc. | 0,06 | 5,80 | 0,6588 | 0,6588 | |||||
| HD / The Home Depot, Inc. | 0,02 | 0,33 | 5,76 | 0,38 | 0,6536 | -0,1114 | |||
| CRM / Salesforce, Inc. | 0,02 | -7,96 | 5,13 | -6,48 | 0,5822 | -0,1491 | |||
| ETN / Eaton Corporation plc | 0,01 | 414,64 | 4,71 | 576,15 | 0,5345 | 0,4416 | |||
| ZG / Zillow Group, Inc. | 0,07 | -5,87 | 4,69 | -3,58 | 0,5323 | -0,1162 | |||
| NEE / NextEra Energy, Inc. | 0,07 | 93,13 | 4,62 | 89,19 | 0,5247 | 0,1988 | |||
| UNP / Union Pacific Corporation | 0,02 | -2,63 | 4,49 | -5,17 | 0,5104 | -0,1219 | |||
| AXP / American Express Company | 0,01 | -8,18 | 4,47 | 8,87 | 0,5073 | -0,0401 | |||
| JPM / JPMorgan Chase & Co. | 0,01 | -4,19 | 4,01 | 13,24 | 0,4556 | -0,0171 | |||
| MSTR / Strategy Inc | 0,01 | 353,70 | 3,30 | 536,87 | 0,3747 | 0,3055 | |||
| SHOP / Shopify Inc. | 0,03 | -32,26 | 2,90 | -18,17 | 0,3299 | -0,1437 | |||
| ITW / Illinois Tool Works Inc. | 0,01 | -1,58 | 2,82 | -1,88 | 0,3202 | -0,0632 | |||
| FAST / Fastenal Company | 0,06 | 100,00 | 2,72 | 8,30 | 0,3084 | -0,0261 | |||
| WM / Waste Management, Inc. | 0,01 | -12,08 | 2,68 | -13,11 | 0,3041 | -0,1070 | |||
| ACN / Accenture plc | 0,01 | -0,36 | 2,51 | -4,56 | 0,2850 | -0,0658 | |||
| SYK / Stryker Corporation | 0,01 | 0,00 | 2,49 | 6,28 | 0,2825 | -0,0298 | |||
| CEG / Constellation Energy Corporation | 0,01 | 2,43 | 0,2764 | 0,2764 | |||||
| ZBRA / Zebra Technologies Corporation | 0,01 | -62,60 | 2,42 | -59,19 | 0,2745 | -0,5157 | |||
| ORLY / O'Reilly Automotive, Inc. | 0,03 | 1.400,00 | 2,41 | -5,64 | 0,2734 | -0,0670 | |||
| CTAS / Cintas Corporation | 0,01 | 0,00 | 2,37 | 8,43 | 0,2688 | -0,0224 | |||
| LIN / Linde plc | 0,00 | 0,00 | 2,34 | 0,73 | 0,2663 | -0,0442 | |||
| BLK / BlackRock, Inc. | 0,00 | -16,48 | 2,22 | -7,42 | 0,2524 | -0,0679 | |||
| CSCO / Cisco Systems, Inc. | 0,03 | 0,00 | 1,89 | 12,44 | 0,2146 | -0,0096 | |||
| ABBV / AbbVie Inc. | 0,01 | 12,97 | 1,82 | 0,05 | 0,2071 | -0,0360 | |||
| MCHP / Microchip Technology Incorporated | 0,03 | -10,90 | 1,78 | 29,48 | 0,2026 | 0,0188 | |||
| EBGEF / Enbridge Inc. - Preferred Stock | 0,04 | 8,98 | 1,78 | 11,44 | 0,2025 | -0,0109 | |||
| CRWD / CrowdStrike Holdings, Inc. | 0,00 | -26,58 | 1,77 | 6,05 | 0,2011 | -0,0217 | |||
| AFL / Aflac Incorporated | 0,02 | 0,00 | 1,72 | -5,14 | 0,1948 | -0,0465 | |||
| MMC / Marsh & McLennan Companies, Inc. | 0,01 | -22,08 | 1,66 | -30,21 | 0,1885 | -0,1287 | |||
| AMAT / Applied Materials, Inc. | 0,01 | 0,00 | 1,54 | 26,23 | 0,1743 | 0,0120 | |||
| AVGO / Broadcom Inc. | 0,01 | -2,71 | 1,49 | 60,13 | 0,1689 | 0,0450 | |||
| GOOG / Alphabet Inc. | 0,01 | -9,85 | 1,45 | 2,34 | 0,1641 | -0,0242 | |||
| DIS / The Walt Disney Company | 0,01 | -0,78 | 1,20 | 24,58 | 0,1359 | 0,0078 | |||
| VBK / Vanguard Index Funds - Vanguard Small-Cap Growth ETF | 0,00 | 0,00 | 1,19 | 9,96 | 0,1354 | -0,0092 | |||
| SNOW / Snowflake Inc. | 0,01 | -3,93 | 1,16 | 47,16 | 0,1322 | 0,0266 | |||
| ABT / Abbott Laboratories | 0,01 | 0,00 | 1,11 | 2,49 | 0,1262 | -0,0184 | |||
| ZTS / Zoetis Inc. | 0,01 | -7,16 | 1,09 | -12,05 | 0,1236 | -0,0415 | |||
| MGK / Vanguard World Fund - Vanguard Mega Cap Growth ETF | 0,00 | -3,58 | 0,98 | 14,29 | 0,1119 | -0,0031 | |||
| IBM / International Business Machines Corporation | 0,00 | -32,21 | 0,91 | -19,68 | 0,1034 | -0,0478 | |||
| AON / Aon plc | 0,00 | 0,16 | 0,91 | -10,45 | 0,1032 | -0,0322 | |||
| SCHO / Schwab Strategic Trust - Schwab Short-Term U.S. Treasury ETF | 0,04 | 0,88 | 0,0998 | 0,0998 | |||||
| PSA / Public Storage | 0,00 | -0,38 | 0,85 | -2,29 | 0,0968 | -0,0196 | |||
| ORCL / Oracle Corporation | 0,00 | 1,34 | 0,84 | 58,49 | 0,0955 | 0,0247 | |||
| AMGN / Amgen Inc. | 0,00 | 0,00 | 0,83 | -10,37 | 0,0943 | -0,0293 | |||
| LH / Labcorp Holdings Inc. | 0,00 | 0,00 | 0,81 | 12,76 | 0,0924 | -0,0038 | |||
| EXR / Extra Space Storage Inc. | 0,01 | -4,02 | 0,75 | -4,73 | 0,0848 | -0,0197 | |||
| XOM / Exxon Mobil Corporation | 0,01 | -0,06 | 0,74 | -9,46 | 0,0838 | -0,0249 | |||
| AJG / Arthur J. Gallagher & Co. | 0,00 | 0,00 | 0,70 | -7,25 | 0,0800 | -0,0214 | |||
| TROW / T. Rowe Price Group, Inc. | 0,01 | 0,00 | 0,68 | 5,08 | 0,0775 | -0,0092 | |||
| SCHX / Schwab Strategic Trust - Schwab U.S. Large-Cap ETF | 0,03 | 0,00 | 0,63 | 10,68 | 0,0718 | -0,0044 | |||
| MDT / Medtronic plc | 0,01 | 0,00 | 0,63 | -3,08 | 0,0715 | -0,0151 | |||
| SO / The Southern Company | 0,01 | 0,00 | 0,48 | 0,00 | 0,0549 | -0,0097 | |||
| CVX / Chevron Corporation | 0,00 | 0,00 | 0,48 | -14,52 | 0,0543 | -0,0202 | |||
| WELL / Welltower Inc. | 0,00 | 0,00 | 0,41 | 0,25 | 0,0463 | -0,0079 | |||
| MCD / McDonald's Corporation | 0,00 | -6,85 | 0,40 | -12,94 | 0,0451 | -0,0157 | |||
| GS / The Goldman Sachs Group, Inc. | 0,00 | -15,13 | 0,40 | 9,97 | 0,0451 | -0,0031 | |||
| CNI / Canadian National Railway Company | 0,00 | -14,29 | 0,37 | -8,56 | 0,0425 | -0,0121 | |||
| KMB / Kimberly-Clark Corporation | 0,00 | 0,00 | 0,33 | -9,44 | 0,0371 | -0,0110 | |||
| EXC / Exelon Corporation | 0,01 | 0,00 | 0,30 | -5,70 | 0,0339 | -0,0084 | |||
| SCHF / Schwab Strategic Trust - Schwab International Equity ETF | 0,01 | 0,44 | 0,27 | 12,30 | 0,0312 | -0,0015 | |||
| XYZ / Block, Inc. | 0,00 | -96,41 | 0,26 | -95,51 | 0,0300 | -0,7553 | |||
| PINS / Pinterest, Inc. | 0,01 | 0,26 | 0,0298 | 0,0298 | |||||
| FSLR / First Solar, Inc. | 0,00 | -4,28 | 0,26 | 25,73 | 0,0295 | 0,0018 | |||
| DTE / DTE Energy Company | 0,00 | 0,00 | 0,26 | -4,09 | 0,0293 | -0,0066 | |||
| STRL / Sterling Infrastructure, Inc. | 0,00 | 0,25 | 0,0288 | 0,0288 | |||||
| BE / Bloom Energy Corporation | 0,01 | 0,29 | 0,25 | 22,06 | 0,0283 | 0,0011 | |||
| IREN / IREN Limited | 0,02 | 0,23 | 0,0259 | 0,0259 | |||||
| TSLA / Tesla, Inc. | 0,00 | 0,23 | 0,0258 | 0,0258 | |||||
| CL / Colgate-Palmolive Company | 0,00 | 0,00 | 0,23 | -2,99 | 0,0258 | -0,0054 | |||
| SCHG / Schwab Strategic Trust - Schwab U.S. Large-Cap Growth ETF | 0,01 | -15,62 | 0,23 | -1,32 | 0,0256 | -0,0049 | |||
| PACB / Pacific Biosciences of California, Inc. | 0,03 | 0,00 | 0,04 | 5,56 | 0,0044 | -0,0005 | |||
| BFLY / Butterfly Network, Inc. | 0,01 | 0,00 | 0,02 | -11,54 | 0,0026 | -0,0009 | |||
| OKE / ONEOK, Inc. | 0,00 | -100,00 | 0,00 | 0,0000 | |||||
| JAAA / Janus Detroit Street Trust - Janus Henderson AAA CLO ETF | 0,00 | -100,00 | 0,00 | 0,0000 | |||||
| MSTU / ETF Opportunities Trust - T-Rex 2X Long MSTR Daily Target ETF | 0,00 | -100,00 | 0,00 | 0,0000 | |||||
| ENPH / Enphase Energy, Inc. | 0,00 | -100,00 | 0,00 | 0,0000 | |||||
| SCHB / Schwab Strategic Trust - Schwab U.S. Broad Market ETF | 0,00 | -100,00 | 0,00 | -100,00 | -0,0426 | ||||
| UNH / UnitedHealth Group Incorporated | 0,00 | -100,00 | 0,00 | -100,00 | -0,2092 | ||||
| FLTR / VanEck ETF Trust - VanEck IG Floating Rate ETF | 0,00 | -100,00 | 0,00 | 0,0000 |