Grundlæggende statistik
| Institutionelle aktier (lange) | 302.406.076 - 78,96% (ex 13D/G) - change of -35,32MM shares -10,46% MRQ |
| Institutionel værdi (lang) | $ 99.650.923 USD ($1000) |
Institutionelt ejerskab og aktionærer
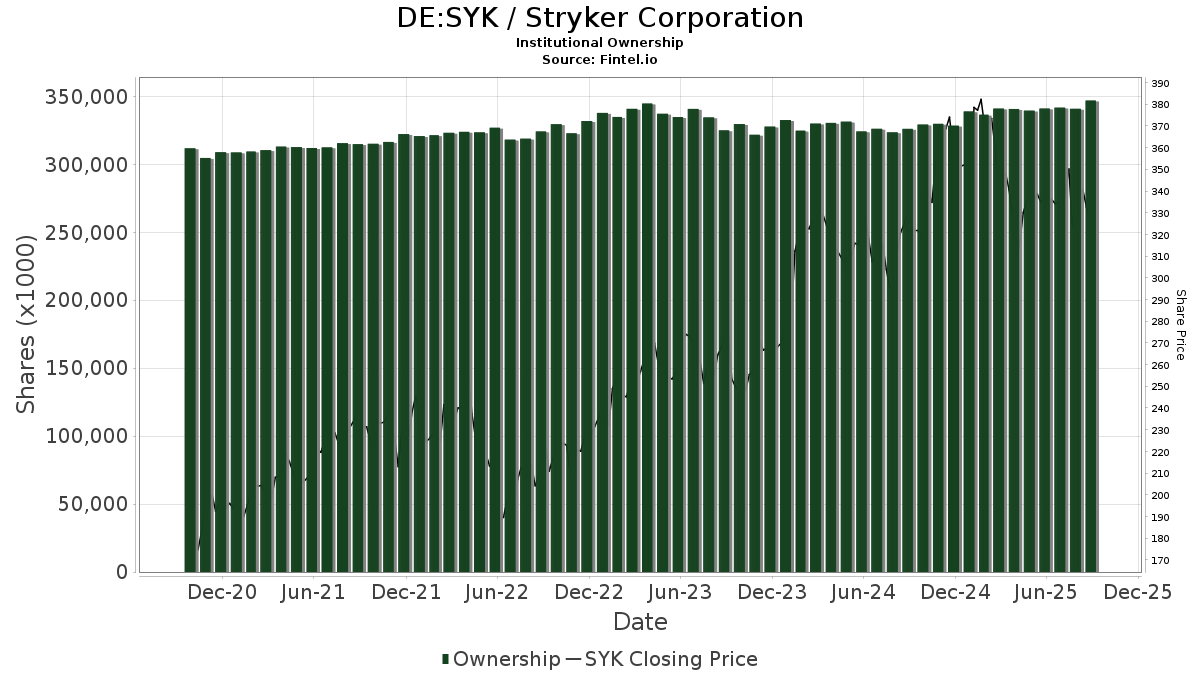
Stryker Corporation (DE:SYK) har 2330 institutionelle ejere og aktionærer, der har indsendt 13D/G- eller 13F-formularer til Securities Exchange Commission (SEC). Disse institutioner har i alt 302,406,076 aktier. Største aktionærer omfatter Vanguard Group Inc, BlackRock, Inc., Greenleaf Trust, State Street Corp, Jpmorgan Chase & Co, Price T Rowe Associates Inc /md/, Geode Capital Management, Llc, Wellington Management Group Llp, Alliancebernstein L.p., and Morgan Stanley .
Stryker Corporation (XTRA:SYK) institutionel ejerskabsstruktur viser aktuelle positioner i virksomheden efter institutioner og fonde, samt seneste ændringer i positionsstørrelse. Større aktionærer kan omfatte individuelle investorer, investeringsforeninger, hedgefonde eller institutioner. Skema 13D angiver, at investoren besidder (eller besidder) mere end 5 % af virksomheden og har til hensigt (eller har til hensigt at) aktivt at forfølge en ændring i forretningsstrategi. Skema 13G indikerer en passiv investering på over 5%.
The share price as of April 23, 2026 is 280,80 / share. Previously, on April 28, 2025, the share price was 320,00 / share. This represents a decline of 12,25% over that period.
Fondens stemningsscore
Fund Sentiment Score (fka Ownership Accumulation Score) finder de aktier, der bliver mest købt af fonde. Det er resultatet af en sofistikeret, multi-faktor kvantitativ model, der identificerer virksomheder med de højeste niveauer af institutionel akkumulering. Scoringsmodellen bruger en kombination af den samlede stigning i oplyste ejere, ændringerne i porteføljeallokeringer i disse ejere og andre målinger. Tallet går fra 0 til 100, hvor højere tal indikerer et højere niveau af akkumulering for sine jævnaldrende, og 50 er gennemsnittet.
Opdateringsfrekvens: Dagligt
Se Ownership Explorer, som giver en liste over højest rangerende virksomheder.
AI+ Ask Fintel’s AI assistant about Stryker Corporation.
Select a question to share a public post with an AI-crafted answer.
Thinking of good questions…
13F og NPORT arkivering
Detaljer om 13F-arkivering er gratis. Detaljer om NP-ansøgninger kræver et premium-medlemskab. Grønne rækker angiver nye positioner. Røde rækker angiver lukkede positioner. Klik på linket ikon for at se den fulde transaktionshistorik.
Opgrader
for at låse premium-data op og eksportere til Excel ![]() .
.
Important Note
In an effort to reduce load times for our mobile users, we are testing some ways to deliver lighter pages.
In this first test, we will deliver only the most recent 750 transactions (out of 2690 for this stock). If you are interested in loading *all* the transactions for this company, click the "load all" button below. This is just a test and if you don't like it, please let us know by submitting some gentle feedback via the link at the bottom of this page.
Load All| Fil dato | Kilde | Investor | Type | Gennemsnitlig pris (Øst) |
Aktier | Δ Aktier (%) |
Rapporteret Værdi ($1000) |
Δ Værdi (%) |
Port Alloc (%) |
|
|---|---|---|---|---|---|---|---|---|---|---|
| 2026-02-12 | 13F | M&G Plc | 30.424 | 21,28 | 10.679 | 15,05 | ||||
| 2026-04-15 | 13F | Nations Financial Group Inc, /ia/ /adv | 4.024 | 13,10 | 1.322 | 5,76 | ||||
| 2026-02-09 | 13F | Todd Asset Management Llc | 0 | -100,00 | 0 | |||||
| 2026-02-13 | 13F | Blueshift Asset Management, LLC | 2.089 | 734 | ||||||
| 2026-02-17 | 13F | MIRAE ASSET GLOBAL ETFS HOLDINGS Ltd. | 50.583 | -8,17 | 17.778 | -12,69 | ||||
| 2025-11-13 | 13F | Glenmede Investment Management, LP | 66.674 | -1,57 | 24.647 | -8,03 | ||||
| 2026-04-17 | 13F | Brown, Lisle/cummings, Inc. | 7.110 | 3,40 | 2.336 | -3,31 | ||||
| 2026-01-29 | 13F | Dunhill Financial, LLC | 89 | 2,30 | 31 | -3,12 | ||||
| 2026-02-17 | 13F | Lombard Odier Asset Management (Europe) Ltd | 10.000 | 0,00 | 3.515 | -4,92 | ||||
| 2026-02-20 | 13F | Kovitz Investment Group Partners, LLC | 37.445 | -2,52 | 13.161 | -7,34 | ||||
| 2026-02-17 | 13F | Coppell Advisory Solutions LLC | 2.358 | 22,37 | 835 | 17,28 | ||||
| 2026-04-07 | 13F | Heartwood Wealth Advisors LLC | 803 | 0,00 | 264 | -6,74 | ||||
| 2026-02-04 | 13F | Liberty Wealth Management Llc | 639 | 0,16 | 225 | -4,68 | ||||
| 2026-02-04 | 13F | Valeo Financial Advisors, LLC | 8.123 | 1,33 | 2.855 | -3,68 | ||||
| 2026-01-07 | 13F | IMPACTfolio, LLC | 1.754 | 0,00 | 616 | -4,94 | ||||
| 2026-02-06 | 13F | Mach-1 Financial Group, Inc. | 0 | -100,00 | 0 | -100,00 | ||||
| 2026-02-17 | 13F | one8zero8, LLC | 9.420 | -0,53 | 3.311 | -5,43 | ||||
| 2026-03-17 | 13F | Stance Capital Llc | 12.517 | 4,76 | 4.399 | -0,38 | ||||
| 2026-01-07 | 13F | New England Research & Management, Inc. | 4.300 | 1.511 | ||||||
| 2026-04-15 | 13F | Radnor Capital Management, LLC | 12.005 | 0,48 | 3.945 | -6,07 | ||||
| 2026-02-17 | 13F | Private Harbour Investment Management & Counsel, LLC | 3.908 | -0,51 | 1.374 | -5,44 | ||||
| 2026-01-30 | 13F | Turning Point Benefit Group, Inc. | 17 | 325,00 | 6 | 400,00 | ||||
| 2026-04-16 | 13F | Sterling Investment Counsel, LLC | 2.535 | 5,45 | 833 | -1,42 | ||||
| 2026-02-09 | 13F | Nia Impact Advisors, Llc | 8.307 | -2,79 | 2.920 | -7,57 | ||||
| 2026-02-12 | 13F | SWAN Capital LLC | 2 | 0,00 | 1 | |||||
| 2026-02-12 | 13F | Miller Financial Services LLC | 0 | -100,00 | 0 | |||||
| 2026-01-26 | 13F | Whittier Trust Co | 4.901 | 5,92 | 1.796 | 4,73 | ||||
| 2025-11-17 | 13F | IMS Capital Management | 815 | 0,00 | 301 | -6,52 | ||||
| 2026-02-17 | 13F | Per Stirling Capital Management, LLC. | 0 | -100,00 | 0 | |||||
| 2026-01-30 | 13F | American Capital Advisory, LLC | 5 | -16,67 | 2 | -50,00 | ||||
| 2026-02-09 | 13F | Hartline Investment Corp/ | 6.138 | -2,39 | 2.157 | -7,19 | ||||
| 2026-02-12 | 13F | Founders Financial Alliance, LLC | 1.076 | -0,09 | 378 | -4,79 | ||||
| 2026-02-10 | 13F | Pinnacle West Asset Management, Inc. | 1.035 | 5,61 | 0 | |||||
| 2026-02-13 | 13F | SYM FINANCIAL Corp | 1.397 | -0,99 | 491 | -5,76 | ||||
| 2026-02-06 | 13F | Payden & Rygel | 31.100 | -3,72 | 11 | -9,09 | ||||
| 2026-02-17 | 13F | Aquatic Capital Management LLC | 33.250 | 113,46 | 11.686 | 102,95 | ||||
| 2026-02-17 | 13F | Oxford Asset Management Llp | 3.238 | 1.138 | ||||||
| 2026-04-21 | 13F | Fruth Investment Management | 4.550 | -7,14 | 1 | 0,00 | ||||
| 2026-01-13 | 13F | Guerra Pan Advisors, Llc | 1.119 | 0,00 | 393 | -4,84 | ||||
| 2026-01-27 | 13F | Berger Financial Group, Inc | 4.205 | -3,40 | 1.478 | -8,20 | ||||
| 2026-04-07 | 13F | Hobart Private Capital, LLC | 0 | -100,00 | 0 | |||||
| 2026-04-07 | 13F | Abner Herrman & Brock Llc | 34.159 | 2,48 | 11 | 0,00 | ||||
| 2026-02-10 | 13F | Mitchell Capital Management Co | 0 | -100,00 | 0 | |||||
| 2026-01-29 | 13F | Camelot Portfolios, LLC | 881 | 0,00 | 310 | -4,92 | ||||
| 2026-01-23 | 13F | Rede Wealth, LLC | 0 | -100,00 | 0 | |||||
| 2026-04-20 | 13F | Centennial Wealth Advisory LLC | 1.186 | 94,43 | 390 | 81,78 | ||||
| 2025-10-30 | 13F | CBOE Vest Financial, LLC | 0 | -100,00 | 0 | |||||
| 2026-04-14 | 13F | Drive Wealth Management, Llc | 0 | -100,00 | 0 | |||||
| 2026-02-06 | 13F | Twin Capital Management Inc | 4.869 | -1,10 | 1.711 | -5,94 | ||||
| 2026-02-12 | 13F | Federation des caisses Desjardins du Quebec | 104.160 | -37,81 | 36.609 | -40,87 | ||||
| 2026-04-06 | 13F | CX Institutional | 12.560 | -3,81 | 4 | 0,00 | ||||
| 2026-02-13 | 13F | First Trust Advisors Lp | 45.238 | -35,66 | 15.900 | -38,83 | ||||
| 2026-01-29 | 13F | Northern Oak Wealth Management Inc | 2.175 | -1,72 | 764 | -6,60 | ||||
| 2026-01-15 | 13F | Nikulski Financial, Inc. | 7.113 | 112,77 | 2.500 | 102,27 | ||||
| 2026-02-06 | 13F | Principle Wealth Partners Llc | 2.376 | 0,42 | 835 | -4,46 | ||||
| 2026-01-15 | 13F | Nisa Investment Advisors, Llc | 101.631 | -2,64 | 35.810 | -7,41 | ||||
| 2026-02-04 | 13F | Wsfs Capital Management, Llc | 3.680 | 7,26 | 1.293 | 1,97 | ||||
| 2026-02-03 | 13F | Patten & Patten Inc/tn | 723 | -72,19 | 254 | 19,81 | ||||
| 2026-02-04 | 13F | Pacer Advisors, Inc. | 0 | -100,00 | 0 | |||||
| 2026-02-09 | 13F | Allen Capital Group, LLC | 1.898 | 4,69 | 667 | -0,45 | ||||
| 2026-02-13 | 13F | Truvestments Capital Llc | 55 | 0,00 | 19 | -5,00 | ||||
| 2026-04-17 | 13F | Anchyra Partners Llc | 1.009 | -2,61 | 332 | -9,07 | ||||
| 2026-04-23 | 13F | SevenBridge Financial Group, LLC | 7.272 | 475,32 | 2.395 | 431,04 | ||||
| 2026-02-17 | 13F | Sherbrooke Park Advisers Llc | 0 | -100,00 | 0 | |||||
| 2026-04-14 | 13F | West Branch Capital LLC | 1 | 0,00 | 0 | |||||
| 2026-04-08 | 13F | AAFMAA Wealth Management & Trust LLC | 5.564 | 8,57 | 1.828 | 1,50 | ||||
| 2026-02-05 | 13F | Conning Inc. | 1.865 | -17,44 | 655 | -21,56 | ||||
| 2026-04-24 | 13F | Advanced Asset Management Advisors Inc | 675 | 0,00 | 222 | -6,75 | ||||
| 2025-11-06 | 13F | Claudia M.p. Batlle, Crp (r) Llc | 0 | -100,00 | 0 | |||||
| 2026-02-17 | 13F | Perbak Capital Partners LLP | 0 | -100,00 | 0 | |||||
| 2026-02-10 | 13F | Holderness Investments Co | 3.329 | -0,75 | 1.170 | -5,57 | ||||
| 2026-02-13 | 13F | Alchemi Wealth, LLC | 723 | 254 | ||||||
| 2026-01-07 | 13F | Harbour Capital Advisors, LLC | 0 | -100,00 | 0 | |||||
| 2026-02-03 | 13F | RB Capital Management, LLC | 901 | -4,25 | 317 | -8,93 | ||||
| 2026-02-17 | 13F | XTX Topco Ltd | 10.208 | 3.588 | ||||||
| 2026-01-20 | 13F | Oakmont Corp | 100 | 0,00 | 35 | -2,78 | ||||
| 2026-02-17 | 13F | Riverview Capital Advisers, LLC | 1.370 | -68,28 | 482 | -69,86 | ||||
| 2026-02-12 | 13F | Strive Asset Management, LLC | 0 | -100,00 | 0 | |||||
| 2026-02-13 | 13F | Vivaldi Capital Management, LLC | 665 | -2,49 | 234 | -7,54 | ||||
| 2026-01-08 | 13F | Signet Financial Management, Llc | 652 | -0,31 | 229 | -4,98 | ||||
| 2026-02-10 | 13F | Anchor Capital Advisors Llc | 3.120 | -0,16 | 1.097 | -5,11 | ||||
| 2026-02-12 | 13F | Wealthspire Advisors, LLC | 9.989 | -11,91 | 3.511 | -16,25 | ||||
| 2026-02-10 | 13F | Sivia Capital Partners, LLC | 2.688 | 119,25 | 945 | 108,39 | ||||
| 2026-02-11 | 13F | Waddell & Associates, Llc | 891 | 2,77 | 313 | -2,19 | ||||
| 2026-04-21 | 13F | Sbe Llc Dba Cedar Cove Wealth Partners | 850 | -1,96 | 279 | -8,22 | ||||
| 2026-02-13 | 13F | Korea Investment CORP | 165.891 | -26,35 | 58.306 | -29,98 | ||||
| 2026-03-06 | 13F | Brighton Securities Corp. | 615 | -49,47 | 216 | -50,68 | ||||
| 2026-02-17 | 13F | Balyasny Asset Management Llc | 6.105 | 12,91 | 2.146 | 7,36 | ||||
| 2026-02-17 | 13F | Balyasny Asset Management Llc | Call | 1.000 | -60,00 | 351 | -62,01 | |||
| 2026-04-13 | 13F | Bank of New Hampshire | 15.034 | -1,27 | 4.940 | -7,68 | ||||
| 2026-01-29 | 13F | Copeland Capital Management, LLC | 17 | 0,00 | 6 | -16,67 | ||||
| 2026-02-17 | 13F | Balyasny Asset Management Llc | Put | 1.300 | -84,15 | 457 | -84,96 | |||
| 2026-02-11 | 13F | Clearbridge Investments, LLC | 1.701.362 | -5,86 | 597.978 | -10,49 | ||||
| 2026-02-13 | 13F | Treasurer of the State of North Carolina | 144.217 | -6,81 | 51 | -12,28 | ||||
| 2026-01-30 | 13F | R Squared Ltd | 4.314 | 7,10 | 1.516 | 1,81 | ||||
| 2026-02-11 | 13F | MidWestOne Financial Group, Inc. | 1.920 | 126,15 | 675 | 115,34 | ||||
| 2026-02-13 | 13F | Platform Technology Partners | 769 | -5,53 | 270 | -10,00 | ||||
| 2026-02-13 | 13F | 71 West Capital Partners | 1.651 | 580 | ||||||
| 2026-01-26 | 13F | AE Wealth Management LLC | 5.706 | 30,66 | 2.006 | 24,23 | ||||
| 2026-02-17 | 13F/A | Beverly Hills Private Wealth, LLC | 1.035 | 0,00 | 364 | -4,97 | ||||
| 2026-02-13 | 13F | OpenArc Corporate Advisory, LLC | 14.128 | 4.966 | ||||||
| 2026-02-13 | 13F | Southeast Asset Advisors Inc. | 0 | -100,00 | 0 | |||||
| 2026-02-14 | 13F | Elefante Mark B | 855 | 0,00 | 301 | -5,06 | ||||
| 2026-01-28 | 13F | West Michigan Advisors, Llc | 7.468 | 0,40 | 2.631 | -4,50 | ||||
| 2026-02-11 | 13F | Capital Wealth Planning, LLC | 15.536 | 2,37 | 5.460 | -2,67 | ||||
| 2026-02-10 | 13F | Daiwa Securities Group Inc. | 62.831 | 2,71 | 22 | 0,00 | ||||
| 2026-02-09 | 13F | Mediolanum International Funds Ltd | 8.155 | 0,00 | 2.888 | -4,28 | ||||
| 2026-02-12 | 13F | Ardent Capital Management, Inc. | 32.266 | -0,62 | 11.341 | -5,52 | ||||
| 2026-04-14 | 13F | Papp L Roy & Associates | 65.547 | 1,34 | 21.538 | -5,26 | ||||
| 2026-01-27 | 13F | BankPlus Trust Department | 2.013 | 0,00 | 708 | -4,97 | ||||
| 2026-04-15 | 13F | Douglas Lane & Associates, LLC | 945 | 3,05 | 311 | -3,73 | ||||
| 2026-04-08 | 13F | Miracle Mile Advisors, LLC | 1.781 | -24,85 | 585 | -29,77 | ||||
| 2026-02-11 | 13F | Manchester Capital Management LLC | 3.727 | 1.310 | ||||||
| 2026-02-11 | 13F | Clifford Swan Investment Counsel Llc | 79.208 | -1,38 | 27.839 | -6,24 | ||||
| 2026-04-13 | 13F | Augustine Asset Management Inc | 693 | 15,89 | 228 | 8,10 | ||||
| 2026-01-29 | 13F | Sanctuary Advisors, LLC | 61.657 | -4,13 | 21.671 | -8,85 | ||||
| 2026-02-04 | 13F | Community Bank, N.A. | 6.749 | 2,90 | 2.372 | -2,19 | ||||
| 2026-02-13 | 13F | GM Advisory Group, Inc. | 1.575 | 46,24 | 553 | 38,94 | ||||
| 2026-02-18 | 13F | NFP Retirement, Inc. | 0 | -100,00 | 0 | -100,00 | ||||
| 2026-02-10 | 13F | Nelson Capital Management, LLC | 16.029 | -1,78 | 5.634 | -6,63 | ||||
| 2026-02-17 | 13F | Capstone Investment Advisors, Llc | 0 | -100,00 | 0 | -100,00 | ||||
| 2026-02-17 | 13F | Capstone Investment Advisors, Llc | Call | 0 | -100,00 | 0 | -100,00 | |||
| 2026-02-17 | 13F | Capstone Investment Advisors, Llc | Put | 0 | -100,00 | 0 | -100,00 | |||
| 2026-02-17 | 13F | ISAM Funds (UK) Ltd | 0 | -100,00 | 0 | |||||
| 2026-02-17 | 13F | Prosperity Bancshares Inc | 158 | 56 | ||||||
| 2026-02-05 | 13F | 1620 Investment Advisors, Inc. | 4 | -20,00 | 2 | 0,00 | ||||
| 2026-02-10 | 13F | Calton & Associates, Inc. | 665 | 10,83 | 234 | 5,43 | ||||
| 2026-02-20 | 13F | Ruggaard & Associates LLC | 579 | 204 | ||||||
| 2026-01-12 | 13F | World Equity Group, Inc. | 1.438 | -27,34 | 505 | -30,92 | ||||
| 2026-01-13 | 13F | Argentarii, LLC | 729 | 2,24 | 256 | -2,66 | ||||
| 2026-02-13 | 13F | Lord, Abbett & Co. Llc | 436.533 | -0,08 | 153 | -4,97 | ||||
| 2026-02-17 | 13F | Aqr Capital Management Llc | 275.843 | 102,44 | 96.951 | 92,48 | ||||
| 2026-04-06 | 13F | Hall Laurie J Trustee | 27.058 | -2,24 | 8.891 | -8,60 | ||||
| 2026-01-28 | 13F | Campbell Capital Management Inc | 1.300 | 0,00 | 457 | -5,00 | ||||
| 2026-02-17 | 13F | Silvercrest Asset Management Group Llc | 212.003 | -2,43 | 74.513 | -7,23 | ||||
| 2026-04-15 | 13F | Cypress Wealth Services, LLC | 1.265 | 35,58 | 416 | 26,91 | ||||
| 2026-02-13 | 13F | Towarzystwo Funduszy Inwestycyjnych Pzu Sa | 0 | -100,00 | 0 | |||||
| 2026-01-20 | 13F | Steel Peak Wealth Management LLC | 0 | -100,00 | 0 | |||||
| 2026-02-06 | 13F | Redmont Wealth Advisors Llc | 30 | 0,00 | 11 | -9,09 | ||||
| 2026-02-09 | 13F | TrustBank | 2.009 | 706 | ||||||
| 2026-04-13 | 13F | Fiduciary Financial Group, Llc | 0 | -100,00 | 0 | |||||
| 2026-02-17 | 13F | Gladstone Institutional Advisory LLC | 2.452 | 1,74 | 862 | -3,26 | ||||
| 2026-02-17 | 13F | Hancock Whitney Corp | 1.695 | -2,59 | 596 | -7,47 | ||||
| 2026-04-24 | 13F | KC Investment Advisors, LLC | 809 | 15,57 | 266 | 7,72 | ||||
| 2026-01-30 | 13F | Bogart Wealth, LLC | 18.918 | 3,10 | 6.649 | -1,98 | ||||
| 2026-04-16 | 13F | Rockland Trust Co | 3.383 | -5,61 | 1.112 | -11,76 | ||||
| 2026-01-22 | 13F | Monte Financial Group, LLC | 4.239 | 8,19 | 1.490 | 2,83 | ||||
| 2026-04-22 | 13F | Sterling Capital Management LLC | 2.701 | -35,61 | 888 | -39,82 | ||||
| 2026-02-06 | 13F | Nixon Peabody Trust Co | 42.794 | -2,36 | 15.041 | -7,17 | ||||
| 2026-02-09 | 13F | Onefund, Llc | 990 | 6,34 | 348 | 0,87 | ||||
| 2026-02-13 | 13F | Boston Partners | 810 | -5,70 | 285 | -10,41 | ||||
| 2026-02-10 | 13F | Linscomb & Williams, Inc. | 16.797 | 1,94 | 5.904 | -3,09 | ||||
| 2026-02-13 | 13F | Change Path, LLC | 5.162 | -1,58 | 1.814 | -6,40 | ||||
| 2025-11-04 | 13F | Gitterman Wealth Management, LLC | 0 | -100,00 | 0 | |||||
| 2026-02-09 | 13F | Smithfield Trust Co | 1.556 | -19,42 | 1 | |||||
| 2026-01-26 | 13F | Dakota Community Bank & Trust NA | 0 | -100,00 | 0 | |||||
| 2026-02-17 | 13F | LMR Partners LLP | Call | 9.800 | -23,44 | 3.444 | -27,20 | |||
| 2026-04-22 | 13F | Traphagen Investment Advisors Llc | 830 | 2,47 | 273 | -4,23 | ||||
| 2026-04-08 | 13F | Thompson Investment Management, Inc. | 4 | -42,86 | 1 | -50,00 | ||||
| 2026-02-12 | 13F | Ci Investments Inc. | 131.267 | -55,87 | 46.136 | 42.226,61 | ||||
| 2026-03-12 | 13F | Nalls Sherbakoff Group, Llc | 0 | -100,00 | 0 | -100,00 | ||||
| 2026-04-15 | 13F | Atwood & Palmer Inc | 3 | 0,00 | 1 | -100,00 | ||||
| 2026-01-30 | 13F | Torren Management, LLC | 244 | 86 | ||||||
| 2026-02-12 | 13F | William Allan, Llc | 3.550 | -6,06 | 1.248 | -10,74 | ||||
| 2025-10-29 | 13F | JCIC Asset Management Inc. | 0 | -100,00 | 0 | |||||
| 2026-02-02 | 13F | Advisors Preferred, LLC | 4.300 | 0,00 | 1.497 | -4,35 | ||||
| 2026-02-12 | 13F | Principal Securities, Inc. | 8.111 | 0,10 | 2.851 | -4,84 | ||||
| 2026-01-23 | 13F | Avion Wealth | 52 | 1,96 | 0 | |||||
| 2026-04-22 | 13F | Figure 8 Investment Strategies Llc | 5.103 | -2,33 | 1.677 | -8,71 | ||||
| 2026-01-28 | 13F | CAPROCK Group, Inc. | 10.016 | -0,54 | 3.529 | -10,45 | ||||
| 2026-04-08 | 13F | DiNuzzo Private Wealth, Inc. | 17 | -5,56 | 6 | -16,67 | ||||
| 2026-04-09 | 13F | Tompkins Financial Corp | 17.084 | -0,23 | 5.614 | -6,73 | ||||
| 2026-04-24 | 13F | Deltec Asset Management Llc | 0 | -100,00 | 0 | |||||
| 2025-11-05 | 13F | Lokken Investment Group LLC | 4.414 | 4,55 | 1.632 | -2,34 | ||||
| 2026-02-11 | 13F | Strategy Asset Managers Llc | 1.972 | -5,06 | 693 | -9,65 | ||||
| 2026-04-24 | 13F | Lederer & Associates Investment Counsel/ca | 4.956 | -0,20 | 2 | 0,00 | ||||
| 2026-01-06 | 13F | Advance Capital Management, Inc. | 1.131 | -4,96 | 398 | -9,57 | ||||
| 2026-02-17 | 13F | LMR Partners LLP | Put | 2.800 | -74,07 | 984 | -75,35 | |||
| 2026-02-17 | 13F | LMR Partners LLP | 1.510 | -45,37 | 531 | -48,09 | ||||
| 2026-04-17 | 13F | Murphy & Mullick Capital Management Corp | 309 | 0,00 | 102 | -6,48 | ||||
| 2026-02-18 | 13F | Caitlin John, LLC | 30 | 500,00 | 11 | 900,00 | ||||
| 2026-04-17 | 13F | Essex Savings Bank | 5.530 | -2,62 | 1.817 | -8,92 | ||||
| 2026-02-11 | 13F | MCF Advisors LLC | 1.174 | 3,80 | 413 | -1,20 | ||||
| 2026-04-23 | 13F | Members Wealth Llc | 2.935 | -0,07 | 967 | -7,82 | ||||
| 2026-02-10 | 13F | KERR FINANCIAL PLANNING Corp | 0 | -100,00 | 0 | |||||
| 2026-04-23 | 13F | SJS Investment Consulting Inc. | 762 | 8,70 | 250 | 1,63 | ||||
| 2026-02-06 | 13F | Lazard Freres Gestion S.A.S. | 2.000 | 0,00 | 1 | |||||
| 2026-04-23 | 13F | Kohmann Bosshard Financial Services, LLC | 66 | 0,00 | 22 | -8,70 | ||||
| 2026-04-24 | 13F | CHICAGO TRUST Co NA | 9.318 | 15,22 | 3.062 | 7,71 | ||||
| 2026-02-03 | 13F | Cheviot Value Management, LLC | 20 | 0,00 | 7 | 0,00 | ||||
| 2026-02-10 | 13F | Phillips Wealth Planners LLC | 691 | -12,31 | 251 | -13,19 | ||||
| 2026-02-17 | 13F | Rtw Investments, Lp | 245.000 | -50,00 | 86.110 | -52,46 | ||||
| 2026-04-21 | 13F | Quad-Cities Investment Group, LLC | 1.000 | 0,00 | 329 | -6,55 | ||||
| 2026-02-10 | 13F | Eurizon Capital SGR S.p.A. | 97.632 | 34.333 | ||||||
| 2026-04-07 | 13F | Investment Partners Asset Management, Inc. | 933 | 4,13 | 307 | -2,55 | ||||
| 2026-04-13 | 13F | Stonebridge Capital Management Inc | 17.900 | -27,91 | 5.882 | 65.244,44 | ||||
| 2026-02-12 | 13F | TopTier Wealth Management, LLC | 1.053 | 370 | ||||||
| 2026-02-17 | 13F | Parkman Healthcare Partners LLC | 105.472 | 64,52 | 37.070 | 56,43 | ||||
| 2026-02-05 | 13F | Requisite Capital Management, LLC | 1.165 | 67,14 | 410 | 59,53 | ||||
| 2026-02-13 | 13F | Brown Advisory Inc | 46.366 | -2,14 | 16.296 | -6,95 | ||||
| 2026-04-15 | 13F | Avanza Fonder AB | 40.937 | -3,27 | 13.451 | -9,56 | ||||
| 2025-11-14 | 13F | Wetherby Asset Management Inc | 11.312 | 2,64 | 4.182 | -4,11 | ||||
| 2025-11-14 | 13F | ICONIQ Capital, LLC | 0 | -100,00 | 0 | -100,00 | ||||
| 2026-01-27 | 13F | Regions Financial Corp | 320.940 | 6,37 | 112.801 | 1,13 | ||||
| 2026-02-14 | 13F | Rockefeller Capital Management L.P. | 85.581 | 13,29 | 30.084 | 7,73 | ||||
| 2026-01-28 | 13F | Fishman Jay A Ltd/mi | 75.342 | -1,11 | 26.480 | -5,98 | ||||
| 2026-02-03 | 13F | Hemenway Trust Co LLC | 2.325 | -0,64 | 817 | -5,55 | ||||
| 2026-04-15 | 13F | Exchange Traded Concepts, Llc | 11.672 | -31,16 | 3.835 | -35,64 | ||||
| 2026-01-29 | 13F | Mattern Capital Management, Llc | 26.439 | 3,41 | 9.293 | -1,68 | ||||
| 2026-02-12 | 13F | Rossby Financial, LCC | 451 | 6,62 | 159 | 2,60 | ||||
| 2026-03-12 | 13F/A | Peak6 Llc | Call | 5.800 | -26,58 | 2.039 | -30,21 | |||
| 2026-04-21 | 13F | Trueblood Wealth Management, LLC | 4.399 | -4,20 | 1.445 | -10,42 | ||||
| 2026-02-04 | 13F | HighPoint Advisor Group LLC | 5.583 | 3,24 | 1.962 | -1,85 | ||||
| 2026-02-13 | 13F | Sofos Investments, Inc. | 7.940 | 7,63 | 2.791 | 2,31 | ||||
| 2026-03-12 | 13F/A | Peak6 Llc | Put | 6.200 | 2.179 | |||||
| 2026-04-08 | 13F | Seed Wealth Management, Inc. | 970 | 0,00 | 319 | -6,47 | ||||
| 2026-01-28 | 13F | Cadinha & Co Llc | 871 | 0,00 | 306 | -4,67 | ||||
| 2026-02-09 | 13F | Fisher Asset Management, LLC | 3.117.283 | -5,83 | 1.095.632 | -10,46 | ||||
| 2026-04-24 | 13F | Ledyard National Bank | 1.867 | -2,40 | 613 | -8,78 | ||||
| 2026-02-10 | 13F | IFG Advisory, LLC | 3.032 | 1.066 | ||||||
| 2026-02-12 | 13F | Summit Financial, LLC | 15.371 | -9,39 | 5.416 | -13,65 | ||||
| 2026-02-12 | 13F | CIBC Private Wealth Group, LLC | 853.873 | -3,28 | 300.111 | -8,04 | ||||
| 2026-02-03 | 13F | NewEdge Wealth, LLC | 11.257 | 44,60 | 3.957 | 42,10 | ||||
| 2026-02-13 | 13F | Pitti Group Wealth Management, LLC | 0 | -100,00 | 0 | |||||
| 2026-01-28 | 13F | Cornerstone Advisory, LLC | 5.268 | 1,33 | 1.852 | -3,69 | ||||
| 2026-02-17 | 13F | Tcw Group Inc | 5.687 | 1.999 | ||||||
| 2026-04-07 | 13F | Signaturefd, Llc | 9.863 | 4,60 | 3.241 | -2,23 | ||||
| 2026-02-06 | 13F | Eqis Capital Management, Inc. | 0 | -100,00 | 0 | |||||
| 2026-04-22 | 13F | Pictet Asset Management Holding SA | 396.204 | -15,02 | 130.186 | -20,56 | ||||
| 2026-02-04 | 13F | Kepler Cheuvreux (Suisse) SA | 3.201 | -95,77 | 1.125 | -95,98 | ||||
| 2026-04-09 | 13F | Victrix Investment Advisors | 1.275 | 0,00 | 419 | -6,70 | ||||
| 2026-02-12 | 13F | Bank Of Montreal /can/ | 500.801 | 4,68 | 176.017 | -0,47 | ||||
| 2025-11-07 | 13F | Synovus Financial Corp | 12.041 | -2,68 | 4.455 | -9,06 | ||||
| 2026-04-24 | 13F | Mitchell Mcleod Pugh & Williams Inc | 2.678 | 1,17 | 880 | -7,28 | ||||
| 2026-04-17 | 13F | Hanson & Doremus Investment Management | 145 | -42,00 | 0 | |||||
| 2026-02-06 | 13F | Fischer Financial Services, Inc. | 4.973 | -2,11 | 1.748 | -6,93 | ||||
| 2026-02-13 | 13F | State Street Corp | 15.254.407 | 2,08 | 5.374.731 | -2,92 | ||||
| 2026-04-22 | 13F | JNBA Financial Advisors | 165 | 3,12 | 54 | -3,57 | ||||
| 2026-02-26 | 13F | Anchor Investment Management, LLC | 9.405 | -0,16 | 3.306 | -5,08 | ||||
| 2026-01-29 | 13F | Quest 10 Wealth Builders, Inc. | 15 | 0,00 | 5 | 0,00 | ||||
| 2026-02-17 | 13F | EFG International AG | 11.363 | 3.993 | ||||||
| 2026-04-22 | 13F | Monument Group Wealth Advisors, LLC | 782 | -34,83 | 257 | -39,19 | ||||
| 2026-02-03 | 13F | Baker Boyer National Bank | 876 | 0,00 | 308 | -4,95 | ||||
| 2026-04-14 | 13F | Prospera Financial Services Inc | 21.248 | 4,29 | 6.984 | -2,50 | ||||
| 2026-01-27 | 13F | Retirement Income Solutions, Inc | 794 | 2,45 | 279 | -2,45 | ||||
| 2026-04-14 | 13F | Legacy Trust | 30.452 | 36,18 | 10.006 | 27,32 | ||||
| 2026-01-07 | 13F | Sagespring Wealth Partners, Llc | 4.331 | 22,83 | 1.522 | 16,81 | ||||
| 2026-01-26 | 13F | PFG Investments, LLC | 5.046 | 0,50 | 1.774 | -4,42 | ||||
| 2026-02-12 | 13F | Oak Associates Ltd /oh/ | 4.221 | -1,93 | 1.484 | 148.200,00 | ||||
| 2026-04-17 | 13F | Stephenson National Bank & Trust | 13 | 0,00 | 4 | 0,00 | ||||
| 2026-01-29 | 13F | China Universal Asset Management Co., Ltd. | 3.600 | 80,00 | 1.268 | 71,35 | ||||
| 2026-02-09 | 13F | Wellington Shields Capital Management, LLC | 1.450 | 0,00 | 510 | -5,04 | ||||
| 2026-04-09 | 13F | Goelzer Investment Management, Inc. | 1.891 | 33,64 | 621 | 24,95 | ||||
| 2026-02-18 | 13F | Beacon Pointe Advisors, LLC | 20.503 | 53,22 | 7.206 | 45,69 | ||||
| 2026-02-17 | 13F | Modern Wealth Management, LLC | 3.246 | 0,84 | 1.141 | -4,20 | ||||
| 2026-02-13 | 13F | AlTi Global, Inc. | 927 | -2,52 | 327 | -7,39 | ||||
| 2026-04-15 | 13F | Occidental Asset Management, LLC | 2.276 | 1,88 | 748 | -4,84 | ||||
| 2026-02-04 | 13F | Oregon Public Employees Retirement Fund | 39.395 | 0,32 | 13.846 | -4,62 | ||||
| 2026-02-13 | 13F | Ridge Creek Global, Inc | 4.003 | 1.407 | ||||||
| 2026-04-17 | 13F | Krilogy Financial LLC | 2.481 | 112,78 | 839 | 101,68 | ||||
| 2026-01-30 | 13F | Strategic Blueprint, LLC | 777 | -67,84 | 273 | -69,43 | ||||
| 2026-02-09 | 13F | Shufro Rose & Co Llc | 816 | -33,66 | 287 | -37,42 | ||||
| 2026-02-17 | 13F | Campion Asset Management LLC | 1.511 | -0,92 | 531 | -5,68 | ||||
| 2026-01-21 | 13F | Fulton Breakefield Broenniman Llc | 50.123 | 41,26 | 17.617 | 34,31 | ||||
| 2026-01-27 | 13F | WealthCollab, LLC | 18 | 0,00 | 6 | 0,00 | ||||
| 2026-02-11 | 13F | Fjarde Ap-fonden /fourth Swedish National Pension Fund | 49.623 | 17.441 | ||||||
| 2026-02-06 | 13F | Legacy Financial Group, Inc. | 573 | 0,00 | 201 | -4,74 | ||||
| 2026-04-16 | 13F | Sunbeam Capital Management, LLC | 767 | 0,26 | 252 | -6,34 | ||||
| 2026-02-03 | 13F | SBI Securities Co., Ltd. | 953 | 37,92 | 335 | 30,98 | ||||
| 2026-02-10 | 13F | Rational Advisors Llc | 125 | 13,64 | 44 | 7,50 | ||||
| 2026-04-24 | 13F | Boston Trust Walden Corp | 280.004 | -0,64 | 92.007 | -7,11 | ||||
| 2026-01-28 | 13F | Mowery & Schoenfeld Wealth Management, LLC | 235 | 0,00 | 83 | -4,65 | ||||
| 2026-02-02 | 13F | Ellis Investment Partners, LLC | 1.855 | 0,11 | 652 | -4,82 | ||||
| 2026-02-13 | 13F | Rafferty Asset Management, LLC | 37.056 | -2,96 | 13.024 | -7,73 | ||||
| 2025-11-14 | 13F | Cubist Systematic Strategies, LLC | Put | 4.100 | 24,24 | 1.516 | 16,09 | |||
| 2026-04-17 | 13F | Verde Capital Management | 1.114 | -2,45 | 366 | -8,73 | ||||
| 2026-02-12 | 13F | Hamilton Point Investment Advisors, LLC | 817 | 0,00 | 288 | -4,97 | ||||
| 2026-02-17 | 13F | Bank Of America Corp /de/ | Put | 0 | -100,00 | 0 | ||||
| 2026-04-14 | 13F | Congress Asset Management Co /ma | 57.847 | -0,63 | 19.008 | -7,10 | ||||
| 2026-02-17 | 13F | Bank Of America Corp /de/ | Call | 0 | -100,00 | 0 | ||||
| 2026-04-08 | 13F | Shore Point Advisors, LLC | 878 | 0,00 | 289 | -6,49 | ||||
| 2026-04-10 | 13F | Impact Capital Partners LLC | 1.773 | -0,34 | 583 | -6,88 | ||||
| 2025-11-14 | 13F | Cubist Systematic Strategies, LLC | Call | 3.500 | 25,00 | 1.294 | 16,80 | |||
| 2026-02-13 | 13F | Delos Wealth Advisors, LLC | 119 | 0,00 | 42 | -4,65 | ||||
| 2025-11-14 | 13F | Cubist Systematic Strategies, LLC | 35.270 | 13.038 | ||||||
| 2026-02-17 | 13F | Point72 Asset Management, L.P. | 0 | -100,00 | 0 | |||||
| 2025-11-07 | 13F | Beacon Capital Management, LLC | 0 | -100,00 | 0 | |||||
| 2026-01-29 | 13F | Quent Capital, LLC | 2.067 | -2,96 | 727 | -7,75 | ||||
| 2026-04-07 | 13F | CoreCap Advisors, LLC | 10.497 | 0,22 | 3.449 | -6,30 | ||||
| 2026-02-12 | 13F | Nuveen, LLC | 1.567.440 | 2,95 | 550.908 | -2,12 | ||||
| 2026-04-08 | 13F | Wealth Enhancement Advisory Services, Llc | 137.419 | -11,49 | 32.739 | -43,35 | ||||
| 2026-04-23 | 13F | Sawyer & Company, Inc | 13 | 0,00 | 4 | 0,00 | ||||
| 2026-02-11 | 13F | Saturna Capital CORP | 317.184 | 111.481 | ||||||
| 2026-04-21 | 13F | Huntleigh Advisors, Inc. | 10.271 | 10,76 | 3.375 | 3,53 | ||||
| 2026-04-22 | 13F | Romano Brothers And Company | 1.172 | 0,00 | 385 | -6,33 | ||||
| 2026-04-17 | 13F/A | Founders Financial Securities Llc | 3.629 | -12,00 | 1.231 | -15,11 | ||||
| 2026-02-04 | 13F | Dogwood Wealth Management LLC | 33 | 50,00 | 12 | 37,50 | ||||
| 2026-02-13 | 13F | Panagora Asset Management Inc | 8.994 | -95,19 | 3.161 | -95,42 | ||||
| 2026-02-13 | 13F | American Century Companies Inc | 1.014.226 | 10,26 | 356.470 | 4,83 | ||||
| 2026-04-21 | 13F | GHP Investment Advisors, Inc. | 44.190 | 9,22 | 14.520 | 2,11 | ||||
| 2026-04-09 | 13F | Generali Investments, Management Co LLC | 11.616 | 19,67 | 3.817 | 11,87 | ||||
| 2026-02-13 | 13F | Squarepoint Ops LLC | Put | 3.000 | -9,09 | 1.054 | -13,54 | |||
| 2026-04-01 | 13F | Bangor Savings Bank | 5.213 | -1,53 | 1.713 | -7,96 | ||||
| 2026-02-13 | 13F | Squarepoint Ops LLC | 299.127 | -61,51 | 105.134 | -63,40 | ||||
| 2026-02-02 | 13F | Qrg Capital Management, Inc. | 60.548 | 7,43 | 21.281 | 2,14 | ||||
| 2026-04-17 | 13F | CENTRAL TRUST Co | 16.960 | 0,88 | 5.573 | -5,70 | ||||
| 2026-04-20 | 13F | White Pine Investment CO | 660 | 0,00 | 0 | |||||
| 2026-02-09 | 13F | Knights of Columbus Asset Advisors LLC | 17.612 | -27,25 | 6.190 | -30,83 | ||||
| 2026-02-09 | 13F | Integrity Alliance, Llc. | 4.566 | -3,83 | 1.605 | -8,60 | ||||
| 2026-02-09 | 13F | Cary Street Partner Investment Advisory Llc | 2.435 | 4,64 | 856 | -0,47 | ||||
| 2026-04-16 | 13F | Blue Zone Wealth Advisors, LLC | 18.560 | -6,45 | 6.099 | -12,54 | ||||
| 2026-04-24 | 13F | Financial Life Planners | 15 | 5 | ||||||
| 2026-01-12 | 13F | Schaper Benz & Wise Investment Counsel Inc/wi | 108.809 | 0,64 | 38.243 | -4,31 | ||||
| 2026-02-13 | 13F | Squarepoint Ops LLC | Call | 12.700 | 958,33 | 4.464 | 907,45 | |||
| 2026-02-17 | 13F | Lighthouse Investment Partners, LLC | Put | 1.000 | 351 | |||||
| 2026-02-10 | 13F | Ellevest, Inc. | 2.201 | 1,95 | 774 | -3,13 | ||||
| 2026-01-20 | 13F | Global Trust Asset Management, LLC | 0 | -100,00 | 0 | -100,00 | ||||
| 2026-04-10 | 13F | Quaker Wealth Management, LLC | 9 | -10,00 | 3 | -33,33 | ||||
| 2026-02-06 | 13F | Addison Advisors LLC | 4.179 | 0,00 | 1.469 | -4,92 | ||||
| 2025-10-30 | 13F | Ridgewood Investments LLC | 0 | -100,00 | 0 | |||||
| 2026-04-16 | 13F | Baron Wealth Management LLC | 1.407 | 12,56 | 462 | 5,24 | ||||
| 2026-01-20 | 13F | Savvy Advisors, Inc. | 5.630 | 81,20 | 1.979 | 72,30 | ||||
| 2026-01-28 | 13F | Proathlete Wealth Management Llc | 1.026 | 0,69 | 361 | -4,24 | ||||
| 2026-02-13 | 13F | Sienna Gestion | 4.963 | 1.749 | ||||||
| 2026-04-02 | 13F | Byrne Asset Management LLC | 12 | 0,00 | 4 | -25,00 | ||||
| 2026-02-17 | 13F | Public Employees Retirement System Of Ohio | 140.008 | 0,08 | 49.209 | -4,84 | ||||
| 2026-04-20 | 13F | CWA Asset Management Group, LLC | 4.641 | -5,31 | 1.525 | -11,50 | ||||
| 2026-04-17 | 13F | Bourne Lent Asset Management Inc | 684 | -22,62 | 225 | -27,74 | ||||
| 2026-04-21 | 13F | North Forty Two & Co. | 1.062 | -2,75 | 349 | -9,14 | ||||
| 2026-02-17 | 13F | Voloridge Investment Management, Llc | 290.130 | 101.972 | ||||||
| 2026-03-04 | 13F | Rehmann Capital Advisory Group | 63.737 | -0,00 | 22.403 | -4,93 | ||||
| 2026-02-10 | 13F | Westpac Banking Corp | 12.269 | -10,38 | 4.312 | -14,78 | ||||
| 2026-01-27 | 13F | Deroy & Devereaux Private Investment Counsel Inc | 2.350 | 0,00 | 1 | |||||
| 2026-02-19 | 13F | Atomi Financial Group, Inc. | 6.443 | 69,24 | 2.264 | 60,91 | ||||
| 2026-04-16 | 13F | Henrickson Nauta Wealth Advisors, Inc. | 1.544 | -41,47 | 507 | -47,52 | ||||
| 2026-02-17 | 13F | Asset One Wealth Management LLC | 934 | 344 | ||||||
| 2026-02-05 | 13F | RiverFront Investment Group, LLC | 8.719 | -35,40 | 3.065 | -38,58 | ||||
| 2026-02-13 | 13F | NLB Skladi, upravljanje premozenja, d.o.o. | 3.100 | 1.090 | ||||||
| 2026-04-23 | 13F | J.w. Cole Advisors, Inc. | 0 | -100,00 | 0 | |||||
| 2025-11-05 | 13F | Cherry Creek Investment Advisors, Inc. | 0 | -100,00 | 0 | |||||
| 2026-01-12 | 13F | CVA Family Office, LLC | 1.309 | -3,47 | 460 | -8,18 | ||||
| 2026-02-03 | 13F | Ballast Advisors Llc | 4.081 | 1,77 | 1.434 | -3,24 | ||||
| 2026-04-20 | 13F | Louisiana State Employees Retirement System | 17.600 | 0,00 | 5.783 | -6,50 | ||||
| 2026-02-05 | 13F | Stephens Inc /ar/ | 12.937 | -0,85 | 4.547 | -5,72 | ||||
| 2026-02-10 | 13F | Western Reserve Capital Management, LLC | 2.182 | 767 | ||||||
| 2026-02-19 | 13F | CI Private Wealth, LLC | 811.526 | -14,58 | 275.370 | -21,59 | ||||
| 2026-02-13 | 13F | Resources Management Corp /ct/ /adv | 21.424 | 15,20 | 8 | 16,67 | ||||
| 2026-02-06 | 13F | Americana Partners, LLC | 2.982 | -39,54 | 1.048 | -42,51 | ||||
| 2026-02-13 | 13F | Financial Network Wealth Advisors LLC | 322 | 2,22 | 113 | -2,59 | ||||
| 2026-02-17 | 13F | Wiley Bros.-aintree Capital, Llc | 48.414 | 14,13 | 17.024 | 8,68 | ||||
| 2026-02-27 | 13F | Strategic Investment Solutions, Inc. /IL | 21 | 0,00 | 7 | 0,00 | ||||
| 2026-02-13 | 13F | Bollard Group LLC | 1.697 | 0,24 | 1 | |||||
| 2026-04-10 | 13F | Armstrong Advisory Group, Inc | 217 | 0,00 | 71 | -6,58 | ||||
| 2026-02-11 | 13F | Dearborn Partners Llc | 80.912 | -3,77 | 28.438 | -8,51 | ||||
| 2026-01-21 | 13F | MBL Wealth, LLC | 1.701 | 64,03 | 598 | 55,87 | ||||
| 2026-02-03 | 13F | Crossmark Global Holdings, Inc. | 26.820 | 31,13 | 9.426 | 24,68 | ||||
| 2026-02-09 | 13F | Frazier Financial Advisors, LLC | 74 | 0,00 | 26 | -3,70 | ||||
| 2026-04-16 | 13F | Aegon Asset Management Uk Plc | 33.441 | 0,00 | 10.986 | -6,51 | ||||
| 2026-01-21 | 13F | Newbridge Financial Services Group, Inc. | 146 | -20,22 | 51 | -23,88 | ||||
| 2026-02-13 | 13F | Dynamic Technology Lab Private Ltd | 3.287 | 44,99 | 1.155 | 37,83 | ||||
| 2026-02-05 | 13F | Northwestern Mutual Investment Management Company, Llc | 10.998 | 0,29 | 3.865 | -4,64 | ||||
| 2026-04-21 | 13F | Financial Consulate, Inc | 189 | 329,55 | 62 | 313,33 | ||||
| 2026-04-15 | 13F | Financial Management Professionals, Inc. | 540 | 0,75 | 178 | -5,85 | ||||
| 2025-11-14 | 13F | Mbb Public Markets I Llc | 0 | -100,00 | 0 | |||||
| 2026-02-05 | 13F | High Note Wealth, LLC | 133 | 14,66 | 47 | 9,52 | ||||
| 2026-02-13 | 13F | Prudential Financial Inc | 170.119 | -12,36 | 59.792 | -16,67 | ||||
| 2026-02-17 | 13F | Integrated Advisors Network LLC | 3.811 | 2,28 | 1.340 | -2,76 | ||||
| 2026-04-16 | 13F | Southern Capital Advisors, Llc | 6.422 | 2.110 | ||||||
| 2026-04-20 | 13F | Leeward Financial Partners, LLC | 785 | 0,26 | 258 | -6,18 | ||||
| 2026-01-13 | 13F | Stephens Consulting, LLC | 1.141 | 9,61 | 401 | 4,43 | ||||
| 2026-04-22 | 13F | apricus wealth, LLC | 2.250 | 1,17 | 739 | -5,38 | ||||
| 2026-01-23 | 13F | Diversify Advisory Services, LLC | 2.695 | -24,91 | 981 | -23,74 | ||||
| 2026-02-17 | 13F | Keebeck Wealth Management, LLC | 11.317 | -29,85 | 3.988 | -33,29 | ||||
| 2026-02-09 | 13F | Green Square Capital Advisors Llc | 633 | 222 | ||||||
| 2026-02-17 | 13F | Fwl Investment Management, Llc | 261 | 45,00 | 92 | 37,88 | ||||
| 2025-11-17 | 13F/A | Proficio Capital Partners LLC | 0 | -100,00 | 0 | -100,00 | ||||
| 2026-04-22 | 13F | Richard Bernstein Advisors LLC | 3.678 | 0,00 | 1.209 | -6,50 | ||||
| 2026-01-26 | 13F | Greenwood Capital Associates Llc | 17.001 | -5,88 | 5.975 | -10,51 | ||||
| 2026-04-13 | 13F | Hm Payson & Co | 12.192 | -2,04 | 4.006 | -8,41 | ||||
| 2026-01-29 | 13F | Farmers & Merchants Trust Co of Long Beach | 0 | -100,00 | 0 | |||||
| 2026-02-17 | 13F | Woodline Partners LP | 20.221 | -84,51 | 7.107 | -85,27 | ||||
| 2026-02-10 | 13F | Argent Trust Co | 6.284 | -1,47 | 2.209 | -6,32 | ||||
| 2026-02-13 | 13F | SHUTTLEWORTH & Co | 3.922 | -21,64 | 1.378 | -25,51 | ||||
| 2026-01-27 | 13F | MASTERINVEST Kapitalanlage GmbH | 7.234 | 37,71 | 2.562 | 31,94 | ||||
| 2026-02-10 | 13F | Ark & Tlk Investments, Llc | 1.421 | 0,00 | 499 | -4,95 | ||||
| 2026-02-02 | 13F | Citizens Business Bank | 836 | 0,00 | 294 | -5,18 | ||||
| 2026-02-14 | 13F | Frec Markets, Inc. | 1.249 | 439 | ||||||
| 2026-04-13 | 13F | Arwa Llc | 3.791 | -0,03 | 1.286 | -3,53 | ||||
| 2026-02-17 | 13F | Nomura Holdings Inc | 7.961 | -40,87 | 2.798 | -43,78 | ||||
| 2026-02-05 | 13F | Amalgamated Bank | 66.404 | -4,60 | 23 | -8,00 | ||||
| 2026-04-23 | 13F | Harbour Investment Management Llc | 7.962 | -14,74 | 2.623 | -20,27 | ||||
| 2026-02-04 | 13F | Paradigm Asset Management Co Llc | 2.500 | -3,85 | 879 | -8,64 | ||||
| 2026-04-21 | 13F | Trust Co Of Virginia /va | 4.682 | -0,70 | 1.538 | -7,18 | ||||
| 2026-04-21 | 13F | Instrumental Wealth, Llc | 1.720 | 3,24 | 565 | -12,13 | ||||
| 2026-02-12 | 13F | Xxi Wealth, Llc | 653 | 230 | ||||||
| 2026-02-13 | 13F | Banco Santander, S.A. | 3.914 | -4,98 | 1.376 | -9,66 | ||||
| 2025-10-30 | 13F | Wbh Advisory Inc | 0 | -100,00 | 0 | -100,00 | ||||
| 2026-02-04 | 13F | Swiss Life Asset Management Ltd | 40.438 | 6,46 | 14.213 | 1,22 | ||||
| 2026-02-10 | 13F | Nomura Asset Management Co Ltd | 186.652 | -2,37 | 65.603 | -7,18 | ||||
| 2026-02-13 | 13F | Level Four Advisory Services, Llc | 3.732 | 33,33 | 1.312 | 26,79 | ||||
| 2026-01-21 | 13F | William Howard & Co Financial Advisors Inc | 5.490 | 0,00 | 1.930 | -4,93 | ||||
| 2026-02-03 | 13F | International Assets Investment Management, Llc | 1.719 | -6,88 | 604 | -17,49 | ||||
| 2026-02-17 | 13F | Mangrove Partners | 2.797 | 983 | ||||||
| 2026-02-06 | 13F | Envestnet Portfolio Solutions, Inc. | 10.608 | -3,19 | 3.728 | -7,95 | ||||
| 2026-02-13 | 13F | Wbi Investments, Inc. | 0 | -100,00 | 0 | |||||
| 2026-02-10 | 13F | Axq Capital, Lp | 7.106 | 984,89 | 2.498 | 931,82 | ||||
| 2026-04-21 | 13F | Founders Capital Management | 50 | 0,00 | 17 | -5,88 | ||||
| 2025-10-27 | 13F | Gwn Securities Inc. | 0 | -100,00 | 0 | |||||
| 2026-01-21 | 13F | Brown Shipley& Co Ltd | 125 | 0,00 | 44 | -6,52 | ||||
| 2025-11-14 | 13F | Royal Bank Of Canada | Call | 0 | -100,00 | 0 | -100,00 | |||
| 2026-02-11 | 13F | Illinois Municipal Retirement Fund | 39.157 | 7,12 | 13.763 | 1,85 | ||||
| 2026-01-26 | 13F | Taylor Frigon Capital Management LLC | 4.086 | -2,99 | 1.436 | -7,77 | ||||
| 2026-01-27 | 13F | Journey Advisory Group, LLC | 3.883 | -14,60 | 1.365 | -18,81 | ||||
| 2026-02-10 | 13F | Peapack Gladstone Financial Corp | 89.751 | 1,71 | 32 | -3,12 | ||||
| 2026-02-13 | 13F | Burton Enright Welch | 1.726 | 0,58 | 607 | -4,42 | ||||
| 2026-04-13 | 13F | Foster Group, Inc. | 772 | 25,53 | 254 | 17,13 | ||||
| 2026-02-06 | 13F | Bare Financial Services, Inc | 24 | -11,11 | 8 | -11,11 | ||||
| 2026-01-26 | 13F | Milestones Private Investment Advisors LLC | 1.544 | 0,00 | 543 | -4,91 | ||||
| 2025-11-14 | 13F | Binnacle Investments Inc | 182 | 1,68 | 67 | -4,29 | ||||
| 2026-02-17 | 13F | Magnetar Financial LLC | 11.084 | -48,21 | 3.896 | -50,76 | ||||
| 2026-01-13 | 13F | Sharkey, Howes & Javer | 0 | -100,00 | 0 | |||||
| 2026-02-02 | 13F | Ashton Thomas Securities, Llc | 1.185 | -9,54 | 416 | -13,51 | ||||
| 2026-02-03 | 13F | Jlb & Associates Inc | 26.779 | -0,17 | 9.412 | -5,08 | ||||
| 2026-02-10 | 13F | Fiduciary Family Office, Llc | 1.149 | -9,03 | 404 | -13,52 | ||||
| 2026-04-15 | 13F | Gf Fund Management Co. Ltd. | 9.309 | 0,00 | 3.059 | -6,51 | ||||
| 2026-02-13 | 13F | Kempen Capital Management N.v. | 21.676 | -3,51 | 7.618 | -8,26 | ||||
| 2026-02-12 | 13F | StoneX Group Inc. | 3.873 | 3,89 | 1.364 | -1,23 | ||||
| 2026-04-24 | 13F | Crux Wealth Advisors | 4.592 | 36,63 | 1.509 | 27,69 | ||||
| 2026-02-17 | 13F | Ibex Wealth Advisors | 0 | -100,00 | 0 | |||||
| 2026-02-13 | 13F | Resources Investment Advisors, LLC. | 5.773 | -0,59 | 2.029 | -5,45 | ||||
| 2026-01-23 | 13F | FSM Wealth Advisors, LLC | 1.429 | -38,98 | 502 | -41,97 | ||||
| 2026-04-15 | 13F | BDFS Capital LLC | 1.588 | 7,08 | 522 | -0,19 | ||||
| 2026-02-10 | 13F | Principia Wealth Advisory, LLC | 14 | -6,67 | 5 | -20,00 | ||||
| 2026-01-21 | 13F | Raleigh Capital Management Inc. | 514 | 52,98 | 181 | 45,16 | ||||
| 2026-01-15 | 13F | Jamison Private Wealth Management, Inc. | 2.241 | -1,23 | 788 | -6,09 | ||||
| 2026-02-05 | 13F | Aspire Growth Partners LLC | 0 | -100,00 | 0 | |||||
| 2026-02-17 | 13F | Berkshire Bank | 7.998 | -2,18 | 2.811 | -6,98 | ||||
| 2026-01-21 | 13F | Prime Capital Investment Advisors, LLC | Call | 0 | -100,00 | 0 | ||||
| 2026-02-17 | 13F | Fairview Capital Investment Management, Llc | 600 | 0,00 | 211 | -4,98 | ||||
| 2026-04-20 | 13F | Focused Wealth Management, Inc | 975 | 37,71 | 320 | 29,03 | ||||
| 2026-04-09 | 13F | Nelson, Van Denburg & Campbell Wealth Management Group, LLC | 7.255 | -20,14 | 2.384 | -25,34 | ||||
| 2026-01-30 | 13F | Sigma Planning Corp | 8.173 | 1,93 | 2.873 | -3,07 | ||||
| 2026-04-15 | 13F | Cranbrook Wealth Management, LLC | 5.594 | -0,18 | 1.838 | -6,65 | ||||
| 2026-04-21 | 13F | Wesbanco Bank Inc | 34.026 | 1,51 | 11.181 | -5,10 | ||||
| 2026-04-13 | 13F | CMH Wealth Management LLC | 16.887 | 5.564 | ||||||
| 2026-02-13 | 13F | Ames National Corp | 0 | -100,00 | 0 | |||||
| 2026-04-20 | 13F | Benedict Financial Advisors Inc | 5.690 | 0,00 | 1.870 | -6,55 | ||||
| 2025-11-20 | 13F | Maven Securities LTD | Put | 0 | -100,00 | 0 | -100,00 | |||
| 2025-11-20 | 13F | Maven Securities LTD | Call | 0 | -100,00 | 0 | -100,00 | |||
| 2026-04-15 | 13F | Purus Wealth Management, LLC | 965 | 12,60 | 317 | 5,32 | ||||
| 2026-01-23 | 13F | Oxler Private Wealth LLC | 4.802 | 0,19 | 1.688 | -4,74 | ||||
| 2026-02-10 | 13F | Act Two Investors Llc | 12.053 | -15,01 | 4.236 | -19,19 | ||||
| 2026-02-17 | 13F | Warren Averett Asset Management, LLC | 44.201 | 5,12 | 15.536 | -0,06 | ||||
| 2026-02-05 | 13F | Navalign, LLC | 590 | 0,00 | 207 | -5,05 | ||||
| 2026-02-05 | 13F | Tucker Asset Management Llc | 115 | 40 | ||||||
| 2026-02-05 | 13F | Roberts Glore & Co Inc /il/ | 14.085 | -1,07 | 4.950 | -5,95 | ||||
| 2026-04-16 | 13F | Capital Advisors, Ltd. LLC | 921 | 2,22 | 0 | |||||
| 2026-02-13 | 13F | Voya Financial Advisors, Inc. | 0 | -100,00 | 0 | |||||
| 2026-02-10 | 13F | Basepoint Wealth LLC | 44 | 15 | ||||||
| 2026-02-11 | 13F | West Family Investments, Inc. | 1.249 | -28,01 | 439 | -31,67 | ||||
| 2026-01-26 | 13F | Quadrant Private Wealth Management, LLC | 682 | 20,28 | 240 | 14,29 | ||||
| 2026-02-06 | 13F | Great Diamond Partners, LLC | 2.801 | -2,23 | 984 | -7,08 | ||||
| 2026-04-13 | 13F | Jackson Square Capital, Llc | 3.205 | -6,37 | 1.053 | -12,47 | ||||
| 2026-02-13 | 13F | Clarkston Capital Partners, LLC | 4.272 | 0,00 | 1.501 | -4,94 | ||||
| 2026-02-17 | 13F | DV Trading LLC | 280 | 98 | ||||||
| 2026-04-10 | 13F | Country Trust Bank | 40 | 0,00 | 13 | -7,14 | ||||
| 2026-02-17 | 13F | BTG Pactual Asset Management US LLC | 7.802 | 0,27 | 2.904 | 0,28 | ||||
| 2026-02-11 | 13F | Fiera Capital Corp | 46.278 | 60,53 | 16.265 | 52,64 | ||||
| 2026-02-13 | 13F | Northwest Bancshares, Inc. | 0 | -100,00 | 0 | |||||
| 2026-01-09 | 13F | SG Americas Securities, LLC | Call | 0 | -100,00 | 0 | ||||
| 2026-01-21 | 13F | Prime Capital Investment Advisors, LLC | Put | 0 | -100,00 | 0 | ||||
| 2026-04-07 | 13F | Cultivar Capital, Inc. | 0 | -100,00 | 0 | |||||
| 2026-04-06 | 13F | Miller Global Investments, LLC | 42 | 14 | ||||||
| 2026-04-22 | 13F | Patriot Financial Group Insurance Agency, LLC | 2.360 | 106,47 | 776 | 93,27 | ||||
| 2026-02-06 | 13F | Cullen/frost Bankers, Inc. | 66.826 | 3,48 | 23.487 | -1,62 | ||||
| 2026-01-29 | 13F | State Of Michigan Retirement System | 90.099 | -3,22 | 31.667 | -7,98 | ||||
| 2026-02-13 | 13F | Polymer Capital Management (HK) LTD | 0 | -100,00 | 0 | |||||
| 2026-02-09 | 13F | Keating Financial Advisory Services, Inc. | 991 | 348 | ||||||
| 2026-02-13 | 13F | Neo Ivy Capital Management | 0 | -100,00 | 0 | -100,00 | ||||
| 2026-04-13 | 13F | Allen Mooney & Barnes Investment Advisors LLC | 1.613 | -0,06 | 530 | -6,53 | ||||
| 2026-04-16 | 13F | Consolidated Planning Corp | 0 | -100,00 | 0 | |||||
| 2026-02-13 | 13F/A | Ontario Teachers Pension Plan Board | 0 | -100,00 | 0 | |||||
| 2026-04-21 | 13F | Decker Retirement Planning Inc. | 10 | 3 | ||||||
| 2026-02-11 | 13F | Commonwealth Retirement Investments LLC | 44 | 15 | ||||||
| 2026-02-13 | 13F | Whalerock Point Partners, Llc | 743 | 0,00 | 261 | -4,74 | ||||
| 2026-02-13 | 13F | Ieq Capital, Llc | 27.123 | 13,30 | 9.533 | 7,72 | ||||
| 2026-04-08 | 13F | Heritage Family Offices, LLP | 2.326 | -28,98 | 764 | -33,62 | ||||
| 2026-02-17 | 13F | Lighthouse Investment Partners, LLC | 0 | -100,00 | 0 | |||||
| 2026-04-14 | 13F | Zrc Wealth Management, Llc | 35 | 52,17 | 12 | 37,50 | ||||
| 2026-04-21 | 13F | Moseley Investment Management Inc | 742 | -9,29 | 244 | -15,33 | ||||
| 2026-02-09 | 13F | Quest Partners LLC | 132 | -91,91 | 46 | -92,36 | ||||
| 2026-01-27 | 13F | Antonelli Financial Advisors, LLC | 2.187 | 0,00 | 769 | -4,83 | ||||
| 2026-01-14 | 13F | Clarius Group, LLC | 1.089 | -34,71 | 383 | -37,99 | ||||
| 2026-01-14 | 13F | Disciplined Equity Management, Inc. | 780 | 0,00 | 274 | -4,86 | ||||
| 2026-04-20 | 13F | Naples Global Advisors, Llc | 2.024 | -15,14 | 667 | -20,71 | ||||
| 2026-04-21 | 13F | Sunpointe, LLC | 965 | -0,72 | 317 | -7,31 | ||||
| 2026-02-17 | 13F | Advisor Group Holdings, Inc. | 125.205 | -22,38 | 44.026 | -26,92 | ||||
| 2026-02-05 | 13F | Thrivent Financial For Lutherans | 119.191 | 22,07 | 42 | 13,89 | ||||
| 2026-02-13 | 13F | PCM Encore, LLC | 1.697 | 597 | ||||||
| 2026-04-21 | 13F | Paradigm Financial Partners, Llc | 3.618 | -7,40 | 1.189 | -13,47 | ||||
| 2026-04-15 | 13F | Tema Etfs Llc | 5.563 | 0,51 | 1.828 | -6,07 | ||||
| 2026-02-11 | 13F | Inceptionr Llc | 0 | -100,00 | 0 | |||||
| 2026-04-20 | 13F | Provenance Wealth Advisors, LLC | 51 | 0,00 | 17 | -5,88 | ||||
| 2026-04-08 | 13F | Bill Few Associates, Inc. | 2.489 | 0,04 | 818 | -6,52 | ||||
| 2026-02-17 | 13F | Captrust Financial Advisors | 63.877 | 3,81 | 22.451 | -1,30 | ||||
| 2026-04-22 | 13F | Union Bancaire Privee, UBP SA | 4.592 | 0,00 | 1.504 | -7,11 | ||||
| 2026-04-23 | 13F | Interchange Capital Partners, LLC | 0 | -100,00 | 0 | |||||
| 2026-02-13 | 13F | Tradewinds, LLC. | 636 | 0,00 | 224 | -5,11 | ||||
| 2026-04-16 | 13F | Annex Advisory Services, LLC | 1.664 | -25,88 | 547 | -30,71 | ||||
| 2026-02-17 | 13F | Lazard Asset Management Llc | 54.809 | -1,29 | 19.264 | -6,15 | ||||
| 2026-01-15 | 13F | Orrstown Financial Services Inc | 0 | -100,00 | 0 | |||||
| 2026-01-29 | 13F | Lee Danner & Bass Inc | 14.318 | 1,54 | 5.032 | -3,45 | ||||
| 2026-02-05 | 13F | Avantax Planning Partners, Inc. | 2.092 | 0,72 | 735 | -4,17 | ||||
| 2026-02-13 | 13F | Headlands Technologies LLC | 0 | -100,00 | 0 | |||||
| 2026-04-14 | 13F | Thurston, Springer, Miller, Herd & Titak, Inc. | 3.029 | -19,05 | 995 | -24,33 | ||||
| 2026-04-20 | 13F | Ronald Blue Trust, Inc. | 6.342 | -16,86 | 2.084 | -22,28 | ||||
| 2026-04-15 | 13F | Wormser Freres Gestion | 28.922 | 2,21 | 9.716 | -2,35 | ||||
| 2026-04-20 | 13F | Heritage Wealth Management, Inc. | 0 | -100,00 | 0 | |||||
| 2026-01-30 | 13F | Simplicity Wealth,LLC | 746 | -4,85 | 262 | -9,34 | ||||
| 2026-02-10 | 13F | Nvest Financial, LLC | 5.087 | 49,09 | 1.788 | 41,79 | ||||
| 2026-02-02 | 13F | PKS Advisory Services, LLC | 1.685 | 0,00 | 592 | -4,82 | ||||
| 2026-02-05 | 13F | Rossmore Private Capital | 19.561 | 12,17 | 6.892 | 6,92 | ||||
| 2026-04-15 | 13F | Sivik Global Healthcare LLC | 10.000 | -23,08 | 3 | -25,00 | ||||
| 2026-04-08 | 13F | First Heartland Consultants, Inc. | 947 | 0,00 | 311 | -6,33 | ||||
| 2026-04-23 | 13F | PayPay Securities Corp | 7 | -22,22 | 2 | -33,33 | ||||
| 2026-01-15 | 13F | Lodestone Wealth Management LLC | 187 | 66 | ||||||
| 2026-02-13 | 13F | Ausdal Financial Partners, Inc. | 1.555 | -2,75 | 547 | -7,61 | ||||
| 2025-11-03 | 13F | EFG Asset Management (North America) Corp. | 3.968 | -9,39 | 1.467 | -15,31 | ||||
| 2026-04-23 | 13F | Farmers & Merchants Investments Inc | 40.356 | 0,08 | 13.261 | -6,44 | ||||
| 2026-04-06 | 13F | GAMMA Investing LLC | 5.317 | 1,78 | 1.747 | -4,85 | ||||
| 2025-12-15 | 13F/A | Hudson Bay Capital Management LP | Call | 0 | -100,00 | 0 | -100,00 | |||
| 2026-02-18 | 13F | State of Tennessee, Treasury Department | 102.682 | -3,09 | 37.947 | -3,12 | ||||
| 2026-02-10 | 13F | CFS Investment Advisory Services, LLC | 1.114 | 75,43 | 392 | 61,57 | ||||
| 2026-02-04 | 13F | Advisor OS, LLC | 1.794 | 95,64 | 630 | 86,39 | ||||
| 2026-01-21 | 13F | Pacific Point Advisors, LLC | 3.348 | 1.177 | ||||||
| 2026-02-11 | 13F | Schwallier Wealth Management LLC | 1.138 | 420 | ||||||
| 2026-02-03 | 13F | Generali Asset Management SPA SGR | 19.047 | -0,99 | 6.694 | -5,86 | ||||
| 2026-02-06 | 13F | Copia Wealth Management | 107 | 0,00 | 38 | -5,13 | ||||
| 2026-02-10 | 13F | Acorn Wealth Advisors, LLC | 972 | 0,52 | 342 | -4,48 | ||||
| 2026-04-23 | 13F | Wendell David Associates Inc | 111.497 | -0,28 | 37 | -7,69 | ||||
| 2026-02-06 | 13F | Profund Advisors Llc | 5.766 | 24,16 | 2.027 | 18,07 | ||||
| 2026-01-26 | 13F | Nicholson Wealth Management Group, LLC | 5.056 | 6,29 | 1.777 | 1,08 | ||||
| 2026-02-04 | 13F | Tsfg, Llc | 126 | 0,00 | 0 | |||||
| 2026-01-28 | 13F | Grant Street Asset Management, Inc. | 807 | 8,61 | 284 | 3,28 | ||||
| 2026-02-02 | 13F | Robertson Stephens Wealth Management, LLC | 610 | 215 | ||||||
| 2026-02-03 | 13F | D.B. Root & Company, LLC | 3.163 | -11,47 | 1.112 | -15,83 | ||||
| 2026-02-03 | 13F | Broadwater Capital Management Llc | 6.465 | 0,00 | 2.272 | -4,90 | ||||
| 2026-02-06 | 13F | CWS Financial Advisors, LLC | 252.176 | -0,78 | 88.632 | -5,66 | ||||
| 2026-02-03 | 13F | Alpha Cubed Investments, LLC | 2.179 | 13,02 | 766 | 7,44 | ||||
| 2026-02-10 | 13F | MainStreet Investment Advisors LLC | 6.160 | -8,65 | 2.165 | -13,12 | ||||
| 2026-04-22 | 13F | Wiser Advisor Group LLC | 166 | 0,00 | 55 | -6,90 | ||||
| 2026-02-13 | 13F | Seneschal Advisors, LLC | 3 | 0,00 | 1 | 0,00 | ||||
| 2026-02-17 | 13F | Hall Capital Management Co Inc | 1.934 | 1,10 | 680 | -3,96 | ||||
| 2026-04-20 | 13F | Jfs Wealth Advisors, Llc | 736 | -12,28 | 242 | -18,31 | ||||
| 2026-04-08 | 13F | Sax Wealth Advisors, Llc | 2.604 | -3,16 | 915 | -3,07 | ||||
| 2026-02-11 | 13F | Cypress Capital Group | 4.136 | -3,34 | 1.454 | -8,10 | ||||
| 2026-02-04 | 13F | Long Road Investment Counsel, LLC | 42.556 | 0,24 | 14.957 | -4,70 | ||||
| 2026-02-10 | 13F | DT Investment Partners, LLC | 326 | 141,48 | 115 | 132,65 | ||||
| 2026-02-10 | 13F | GKV Capital Management Co., Inc. | 1.150 | 0,00 | 404 | -4,94 | ||||
| 2026-02-17 | 13F | Main Street Financial Solutions, LLC | 0 | -100,00 | 0 | |||||
| 2026-02-12 | 13F | Keel Point, LLC | 15.634 | -3,40 | 5.495 | -8,17 | ||||
| 2026-04-22 | 13F | Joel Isaacson & Co., LLC | 1.272 | 1,03 | 418 | -5,66 | ||||
| 2026-04-06 | 13F | Versant Capital Management, Inc | 1.631 | 14,46 | 536 | 7,00 | ||||
| 2026-04-17 | 13F | Community Bank & Trust, Waco, Texas | 1.364 | 6,40 | 0 | |||||
| 2026-02-13 | 13F | Chevy Chase Trust Holdings, Inc. | 187.162 | 0,14 | 65.782 | -4,79 | ||||
| 2026-04-14 | 13F | Beacon Investment Advisory Services, Inc. | 55.674 | -7,51 | 18.294 | -13,53 | ||||
| 2026-01-23 | 13F | Steigerwald, Gordon & Koch Inc. | 68.528 | 0,20 | 24.085 | -4,73 | ||||
| 2026-02-06 | 13F | Resona Asset Management Co.,Ltd. | 102.593 | -3,57 | 36.077 | -8,28 | ||||
| 2026-02-13 | 13F | 1 North Wealth Services Llc | 20 | -50,00 | 7 | -50,00 | ||||
| 2026-02-06 | 13F | Planning Alternatives Ltd /adv | 592 | 208 | ||||||
| 2026-02-12 | 13F | Insigneo Advisory Services, Llc | 2.573 | 82,61 | 904 | 73,85 | ||||
| 2026-02-12 | 13F | Renaissance Technologies Llc | 406.160 | 293,57 | 142.753 | 274,20 | ||||
| 2026-01-27 | 13F | Meritage Portfolio Management | 1.740 | 0,00 | 612 | -4,98 | ||||
| 2026-02-12 | 13F | Great Lakes Retirement, Inc. | 5.831 | 8,36 | 2.054 | 3,27 | ||||
| 2026-02-14 | 13F | American Trust | 9.805 | 1,45 | 3.446 | -3,53 | ||||
| 2026-02-11 | 13F | EULAV Asset Management | 101.813 | -16,42 | 35.784 | -20,53 | ||||
| 2026-04-10 | 13F | YHB Investment Advisors, Inc. | 47.879 | 0,22 | 15.733 | -6,30 | ||||
| 2026-02-17 | 13F | Snowden Capital Advisors LLC | 3.041 | -13,36 | 1.071 | -17,62 | ||||
| 2026-02-12 | 13F | Logan Capital Management Inc | 3.006 | 0,00 | 1.057 | -4,95 | ||||
| 2026-02-11 | 13F | Parallel Advisors, LLC | 21.603 | -1,62 | 7.598 | -6,39 | ||||
| 2026-03-12 | 13F/A | Peak6 Llc | 0 | -100,00 | 0 | -100,00 | ||||
| 2026-01-29 | 13F | Impax Asset Management Group plc | 5.984 | 0,00 | 2.103 | -4,93 | ||||
| 2026-04-06 | 13F | Old Port Advisors | 873 | 0,34 | 287 | -6,23 | ||||
| 2026-02-05 | 13F | 1st Source Bank | 5.531 | -1,69 | 1.944 | -6,54 | ||||
| 2025-11-13 | 13F | Texas Capital Bancshares Inc/tx | 453 | -28,89 | 167 | -33,73 | ||||
| 2026-04-21 | 13F | S Harris Financial Group, LLC | 734 | 241 | ||||||
| 2026-02-10 | 13F | Norges Bank | 5.184.716 | 1.822.272 | ||||||
| 2026-01-28 | 13F | Turtle Creek Wealth Advisors, LLC | 23.376 | 15,65 | 8.216 | 9,96 | ||||
| 2026-02-13 | 13F | Citigroup Inc | 430.246 | -12,54 | 151.218 | -16,84 | ||||
| 2026-02-14 | 13F | Howe & Rusling Inc | 31.197 | -0,19 | 10.965 | -5,11 | ||||
| 2026-04-21 | 13F | Pflug Koory, LLC | 900 | -1,64 | 296 | -8,10 | ||||
| 2026-02-17 | 13F | Maryland State Retirement & Pension System | 17.163 | 0,00 | 6.032 | -4,92 | ||||
| 2026-02-17 | 13F | Brevan Howard Capital Management LP | 6.781 | -1,25 | 2.383 | -6,11 | ||||
| 2026-02-13 | 13F | Kcm Investment Advisors Llc | 1.857 | 1,53 | 653 | -3,55 | ||||
| 2026-04-24 | 13F | Greenfield Seitz Capital Management, LLC | 3.149 | 6,17 | 1.035 | -0,77 | ||||
| 2026-02-13 | 13F | Sei Investments Co | 514.790 | 20,38 | 180.927 | 14,44 | ||||
| 2026-02-13 | 13F | Ostrum Asset Management | 1.039 | -24,93 | 365 | -28,57 | ||||
| 2026-04-09 | 13F | Kwmg, Llc | 1.432 | 0,21 | 471 | -6,37 | ||||
| 2026-01-27 | 13F | ZEGA Investments, LLC | 3.215 | 0,06 | 1.130 | -4,89 | ||||
| 2026-01-23 | 13F | Sage Mountain Advisors LLC | 1.651 | -18,87 | 580 | -22,87 | ||||
| 2026-02-13 | 13F | Missouri Trust & Investment Co | 1.734 | -1,98 | 609 | -6,74 | ||||
| 2026-04-22 | 13F | Portus Wealth Advisors, LLC | 8 | 3 | ||||||
| 2026-01-21 | 13F | M. Kraus & Co | 0 | -100,00 | 0 | |||||
| 2026-02-02 | 13F | Avidian Wealth Solutions, LLC | 2.839 | -0,18 | 998 | -5,14 | ||||
| 2026-02-10 | 13F | Bnp Paribas Arbitrage, Sa | Call | 165 | 0,00 | 5.799 | -4,92 | |||
| 2026-02-10 | 13F | Bnp Paribas Arbitrage, Sa | 913.154 | 25,88 | 320.946 | 19,68 | ||||
| 2026-02-10 | 13F | Quantbot Technologies LP | 25.530 | 56,22 | 8.973 | 48,54 | ||||
| 2026-02-10 | 13F | Bnp Paribas Arbitrage, Sa | Put | 30 | 1.054 | |||||
| 2026-04-21 | 13F | Cambient Family Office, Llc | 7.812 | -46,43 | 2.574 | -49,92 | ||||
| 2026-02-11 | 13F | Peachtree Investment Partners, LLC | 4.388 | 1,36 | 1.542 | -3,62 | ||||
| 2026-01-27 | 13F | Warm Springs Advisors Inc. | 2.762 | -10,18 | 971 | -14,61 | ||||
| 2026-02-13 | 13F | Fortitude Advisory Group L.L.C. | 937 | 0,43 | 329 | -4,36 | ||||
| 2026-01-27 | 13F | TD Waterhouse Canada Inc. | 171.354 | -1,47 | 60.217 | -4,91 | ||||
| 2026-04-20 | 13F | Brandywine Oak Private Wealth Llc | 1.159 | -21,10 | 381 | -26,36 | ||||
| 2026-02-03 | 13F | Sigma Investment Counselors Inc | 40.690 | -0,49 | 14.301 | -5,39 | ||||
| 2025-11-06 | 13F | Camden National Bank | 0 | -100,00 | 0 | |||||
| 2026-01-22 | 13F | Lee Financial Co | 0 | -100,00 | 0 | |||||
| 2026-04-09 | 13F | Wealth Alliance Advisory Group, LLC | 3.855 | 0,00 | 1.267 | -6,50 | ||||
| 2026-02-12 | 13F | Federated Hermes, Inc. | 161.126 | 0,27 | 56.631 | -4,67 | ||||
| 2026-04-01 | 13F | Burkett Financial Services, Llc | 94 | 0,00 | 31 | -6,06 | ||||
| 2026-04-20 | 13F | Courier Capital Llc | 2.961 | 0,07 | 973 | -6,54 | ||||
| 2026-02-11 | 13F | CenterBook Partners LP | 2.122 | 746 | ||||||
| 2026-04-24 | 13F | Canton Hathaway, LLC | 115 | 0,00 | 38 | -7,50 | ||||
| 2026-04-13 | 13F | CGC Financial Services, LLC | 0 | -100,00 | 0 | |||||
| 2025-11-10 | 13F | Siligmueller & Norvid Wealth Advisors LLC | 1.278 | 472 | ||||||
| 2026-04-16 | 13F | Generate Investment Management Ltd | 13.917 | -54,99 | 4.573 | -57,93 | ||||
| 2026-04-20 | 13F | Independent Wealth Network Inc. | 734 | -0,81 | 241 | -7,31 | ||||
| 2026-02-12 | 13F | BlackRock, Inc. | 27.449.327 | 2,70 | 9.647.615 | -2,36 | ||||
| 2026-04-15 | 13F | Elser Financial Planning, Inc | 1.242 | -0,56 | 408 | -7,08 | ||||
| 2026-02-12 | 13F | Investment Counsel Co Of Nevada | 500 | 0,00 | 176 | -4,89 | ||||
| 2026-02-12 | 13F | Voya Investment Management Llc | 137.261 | -71,53 | 48.076 | -73,00 | ||||
| 2026-01-12 | 13F | VisionPoint Advisory Group, LLC | 689 | -5,62 | 242 | -10,04 | ||||
| 2026-02-03 | 13F | Cassaday & Co Wealth Management LLC | 2.795 | 1,97 | 982 | -3,06 | ||||
| 2026-01-28 | 13F | Fiduciary Wealth Partners, LLC | 580 | -0,68 | 204 | -5,58 | ||||
| 2025-11-14 | 13F | PineBridge Investments, L.P. | 2.742 | 143,73 | 1.014 | 127,64 | ||||
| 2026-02-11 | 13F | LPL Financial LLC | 411.236 | 2,40 | 144.537 | -2,64 | ||||
| 2026-02-11 | 13F | LPL Financial LLC | Put | 700 | 0,00 | 246 | -4,65 | |||
| 2026-04-24 | 13F | Reliant Investment Management, LLC | 15.602 | -0,35 | 5.127 | -6,83 | ||||
| 2026-01-20 | 13F | Independence Bank of Kentucky | 7.406 | 3,02 | 2.603 | -2,07 | ||||
| 2026-02-06 | 13F | Associated Banc-corp | 23.496 | -0,17 | 8.258 | -5,08 | ||||
| 2025-11-13 | 13F | Promus Capital, LLC | 604 | 223 | ||||||
| 2026-04-13 | 13F | CJM Wealth Advisers, Ltd. | 873 | 7,78 | 287 | 0,70 | ||||
| 2026-04-21 | 13F | Lewis Asset Management, LLC | 1.219 | 0,00 | 401 | -6,54 | ||||
| 2026-02-12 | 13F | Marex Group plc | 2.065 | 181,72 | 726 | 168,52 | ||||
| 2026-02-04 | 13F | Nicholas Company, Inc. | 164.677 | 0,00 | 57.879 | -4,92 | ||||
| 2025-11-14 | 13F | Strategic Wealth Partners, Ltd. | 23.145 | -4,69 | 8.558 | -10,93 | ||||
| 2026-04-07 | 13F | Farther Finance Advisors, LLC | 17.084 | 15,49 | 5.627 | 8,23 | ||||
| 2026-02-02 | 13F | Vawter Financial, Ltd. | 1.972 | 0,00 | 693 | -4,81 | ||||
| 2026-02-12 | 13F | New York State Common Retirement Fund | 397.237 | -6,61 | 139.617 | -11,20 | ||||
| 2026-01-16 | 13F | CRA Financial Services, LLC | 0 | -100,00 | 0 | |||||
| 2026-02-12 | 13F | BRYN MAWR TRUST Co | 37.223 | -1,52 | 13.083 | -6,38 | ||||
| 2026-04-13 | 13F | Compass Ion Advisors, LLC | 5.402 | 5,04 | 1.775 | -1,83 | ||||
| 2026-04-15 | 13F | Perkins Coie Trust Co | 9.948 | -3,03 | 3.269 | -9,35 | ||||
| 2026-04-17 | 13F | 55 North Private Wealth, LLC | 788 | -37,90 | 259 | -42,15 | ||||
| 2026-02-10 | 13F | Harold Davidson & Associates Inc. | 8.634 | -0,61 | 3.035 | -5,51 | ||||
| 2026-02-03 | 13F | Morse Asset Management, Inc | 10 | -75,61 | 4 | -80,00 | ||||
| 2026-04-23 | 13F | 626 Financial, LLC | 74.212 | 0,14 | 24.385 | -6,38 | ||||
| 2025-11-14 | 13F | Point72 Hong Kong Ltd | 13.533 | 5.003 | ||||||
| 2026-01-12 | 13F | Moody National Bank Trust Division | 0 | -100,00 | 0 | |||||
| 2026-01-29 | 13F | Middleton & Co Inc/ma | 23.379 | 8,34 | 8.217 | 3,01 | ||||
| 2026-01-23 | 13F | Parthenon Llc | 37.235 | -0,79 | 13.087 | -5,68 | ||||
| 2026-01-26 | 13F | Consolidated Investment Group LLC | 13.110 | 24,74 | 4.608 | 18,58 | ||||
| 2026-02-03 | 13F | Sequoia Financial Advisors, LLC | 13.997 | 7,41 | 4.920 | 2,12 | ||||
| 2026-02-13 | 13F | 1248 Management, LLC | 543 | 0,00 | 191 | -4,98 | ||||
| 2026-04-14 | 13F | Roffman Miller Associates Inc /pa/ | 126.022 | -1,72 | 41.410 | -8,12 | ||||
| 2026-02-17 | 13F | Evergreen Wealth Solutions, LLC | 1.597 | 8,34 | 561 | 3,13 | ||||
| 2026-04-24 | 13F | Cane Capital Partners, LLC | 688 | 226 | ||||||
| 2026-04-21 | 13F | Barlow Wealth Partners, Inc. | 2.556 | 0,00 | 878 | -6,60 | ||||
| 2026-02-03 | 13F | K.J. Harrison & Partners Inc | 13.485 | -0,74 | 4.740 | -4,78 | ||||
| 2026-02-17 | 13F | Fullerton Fund Management Co Ltd | 836 | -54,88 | 294 | -57,16 | ||||
| 2026-01-30 | 13F | Rachor Investment Advisory Services, LLC | 201 | 71 | ||||||
| 2026-02-11 | 13F | Vestor Capital, Llc | 2.500 | 107,99 | 0 | |||||
| 2026-02-13 | 13F | Quattro Advisors LLC | 26 | 9 | ||||||
| 2026-01-15 | 13F | Capital Advisors Inc/ok | 172.517 | 5,01 | 60.635 | -0,16 | ||||
| 2026-04-15 | 13F | Fortitude Family Office, LLC | 115 | 33,72 | 38 | 23,33 | ||||
| 2026-02-06 | 13F | Condor Capital Management | 10.712 | -1,21 | 3.765 | -6,06 | ||||
| 2026-02-12 | 13F | Financial Engines Advisors L.L.C. | 3.755 | -1,37 | 1.320 | -6,25 | ||||
| 2026-04-24 | 13F | hemming& Wealth Management, Inc. | 2.206 | 0,00 | 727 | -6,56 | ||||
| 2026-02-05 | 13F | LGT Fund Management Co Ltd. | 9.654 | 26,41 | 3.419 | 22,91 | ||||
| 2026-04-20 | 13F | Tower View Investment Management & Research LLC | 537 | 0,19 | 177 | -6,38 | ||||
| 2026-02-05 | 13F | Allworth Financial LP | 88.867 | 3,70 | 31.234 | -1,40 | ||||
| 2026-04-23 | 13F | Marquette Asset Management, LLC | 0 | -100,00 | 0 | |||||
| 2026-02-05 | 13F | Allworth Financial LP | Put | 422 | ||||||
| 2026-02-12 | 13F | Alps Advisors Inc | 3.022 | 0,33 | 1.062 | -4,58 | ||||
| 2026-02-20 | 13F | McLaughlin Asset Management, Inc. | 2.183 | 767 | ||||||
| 2026-04-17 | 13F | Tectonic Advisors Llc | 2.028 | 2,63 | 666 | -4,03 | ||||
| 2026-01-28 | 13F | Villere St Denis J & Co Llc | 77.859 | -3,94 | 27.365 | -8,67 | ||||
| 2026-02-09 | 13F | Allstate Corp | 25.963 | 105,48 | 9.125 | 95,40 | ||||
| 2026-04-23 | 13F | iA Global Asset Management Inc. | 6.329 | 15.336,59 | 2 | |||||
| 2025-11-14 | 13F | AXA Investment Managers S.A. | 174.999 | 64.692 | ||||||
| 2026-01-30 | 13F | Dale Q Rice Investment Management Ltd | 815 | 0,00 | 286 | -4,98 | ||||
| 2026-02-13 | 13F | First National Bank Of Omaha | 5.119 | 1.813 | ||||||
| 2026-02-13 | 13F | Capula Management Ltd | Put | 1.500 | 25,00 | 527 | 18,96 | |||
| 2025-11-14 | 13F | 1858 Wealth Management, Llc | 622 | 7,61 | 230 | 0,44 | ||||
| 2026-01-23 | 13F | Evolution Advisers, Inc. | 300 | 0,00 | 0 | |||||
| 2026-02-04 | 13F | Concentrum Wealth Management | 822 | -0,60 | 289 | -5,57 | ||||
| 2026-02-13 | 13F | Capula Management Ltd | Call | 900 | 50,00 | 316 | 42,99 | |||
| 2026-02-13 | 13F | Capula Management Ltd | 939 | 123,04 | 330 | 112,90 | ||||
| 2025-11-12 | 13F | Empirical Asset Management, LLC | 0 | -100,00 | 0 | |||||
| 2026-02-11 | 13F | Flagship Wealth Advisors, Llc | 130 | 0,00 | 46 | -6,25 | ||||
| 2026-04-06 | 13F | WASHINGTON TRUST Co | 53.744 | 0,27 | 17.660 | -6,25 | ||||
| 2026-04-09 | 13F | TruWealth Advisors, LLC | 0 | -100,00 | 0 | |||||
| 2026-02-09 | 13F | Bleakley Financial Group, LLC | 17.973 | 23,09 | 6.317 | 17,02 | ||||
| 2026-02-13 | 13F | Victory Capital Management Inc | 119.375 | 2,07 | 41.957 | -2,95 | ||||
| 2026-02-13 | 13F | University Of Texas/texas Am Investment Managment Co | 7 | -98,41 | 2 | -98,77 | ||||
| 2026-02-13 | 13F | Gen-Wealth Partners Inc | 1.538 | -3,51 | 540 | -8,32 | ||||
| 2026-04-14 | 13F | Foresight Capital Management Advisors, Inc. | 3.967 | 31,79 | 1.303 | 23,27 | ||||
| 2026-04-24 | 13F | Swmg, Llc | 2.326 | -9,84 | 764 | -17,32 | ||||
| 2026-01-21 | 13F | Woodmont Investment Counsel Llc | 3.319 | -2,50 | 1.167 | -7,31 | ||||
| 2026-02-11 | 13F | Ycg, Llc | 3.926 | 22,57 | 1.380 | 16,47 | ||||
| 2026-02-13 | 13F | 1832 Asset Management L.P. | 845.558 | 256,12 | 297.188 | 238,59 | ||||
| 2026-02-13 | 13F | Sargent Investment Group, LLC | 959 | 337 | ||||||
| 2026-02-24 | 13F | Astoria Portfolio Advisors LLC. | 2.425 | 2,62 | 933 | 5,30 | ||||
| 2026-02-13 | 13F | TRUE Private Wealth Advisors | 829 | 3,75 | 291 | -1,36 | ||||
| 2026-04-07 | 13F | U.S. Capital Wealth Advisors, LLC | 2.283 | 1,29 | 750 | -5,30 | ||||
| 2026-01-26 | 13F | Mirae Asset Global Investments Co., Ltd. | 60.717 | 18,96 | 21.340 | 13,11 | ||||
| 2026-02-13 | 13F | Jacobi Capital Management LLC | 3.671 | -1,74 | 1.290 | -6,59 | ||||
| 2026-04-21 | 13F | Meridian Financial, LLC | 996 | 0,00 | 327 | -6,57 | ||||
| 2026-02-05 | 13F | New York Life Investment Management Llc | 49.887 | -0,63 | 17.534 | -5,53 | ||||
| 2026-02-10 | 13F | National Pension Service | 706.367 | 3,29 | 248.267 | -1,80 | ||||
| 2026-04-15 | 13F | Mogy Joel R Investment Counsel Inc | 99.955 | -0,48 | 32.844 | -6,96 | ||||
| 2026-01-21 | 13F | Elwood & Goetz Wealth Advisory Group, LLC | 713 | 0,14 | 251 | -4,94 | ||||
| 2026-02-11 | 13F | Erste Asset Management GmbH | 127.941 | 45.358 | ||||||
| 2026-04-15 | 13F | Badgley Phelps Wealth Managers, LLC | 62.543 | -21,06 | 20.591 | -26,20 | ||||
| 2026-01-21 | 13F | Modera Wealth Management, LLC | 43.187 | -1,85 | 15.179 | -6,68 | ||||
| 2026-02-13 | 13F | Silvant Capital Management LLC | 5.200 | 0,00 | 1.828 | -4,94 | ||||
| 2026-02-12 | 13F | Granite Investment Partners, LLC | 55.992 | -3,66 | 19.680 | -8,40 | ||||
| 2026-02-17 | 13F | Fairscale Capital, LLC | 483 | 0,00 | 170 | -4,49 | ||||
| 2025-11-05 | 13F | SPC Financial, Inc. | 1.654 | 0,98 | 611 | -5,71 | ||||
| 2025-10-30 | 13F | Covenant Asset Management, LLC | 0 | -100,00 | 0 | |||||
| 2026-02-17 | 13F | BlueSpruce Investments, LP | 943.647 | 7,14 | 331.664 | 1,86 | ||||
| 2026-04-08 | 13F | Hummer Financial Advisory Services Inc | 1.150 | 0,00 | 379 | -6,67 | ||||
| 2026-02-10 | 13F | Texas Yale Capital Corp. | 9.163 | 0,88 | 3.221 | -4,08 | ||||
| 2026-04-13 | 13F | Wolff Wiese Magana Llc | 1.362 | -1,30 | 448 | -7,84 | ||||
| 2026-04-20 | 13F | State of Alaska, Department of Revenue | 34.320 | 0,84 | 11 | 0,00 | ||||
| 2026-04-15 | 13F | Curbstone Financial Management Corp | 2.068 | 0,00 | 680 | -6,47 | ||||
| 2026-02-03 | 13F | Winch Advisory Services, LLC | 14.363 | -1,15 | 5.048 | -6,01 | ||||
| 2026-02-11 | 13F | O'shaughnessy Asset Management, Llc | 54.142 | 1,24 | 19.029 | -3,75 | ||||
| 2026-02-10 | 13F | Lcnb Corp | 903 | 0,00 | 317 | -4,80 | ||||
| 2026-02-17 | 13F/A | Sentinus, LLC | 3.003 | 108,25 | 1.055 | 97,94 | ||||
| 2026-04-15 | 13F | QTR Family Wealth, LLC | 1.933 | 101,35 | 669 | 93,06 | ||||
| 2026-02-03 | 13F | Alecta Pensionsforsakring, Omsesidigt | 487.500 | 6,37 | 171.317 | 1,14 | ||||
| 2026-02-10 | 13F | NS Partners Ltd | 111.263 | 1,69 | 39.106 | -3,32 | ||||
| 2026-04-08 | 13F | Wealth Enhancement Trust Services, Inc. | 8.466 | 9,18 | 2.782 | 2,06 | ||||
| 2026-02-17 | 13F | Canada Pension Plan Investment Board | 697.721 | 23,30 | 245.228 | 17,23 | ||||
| 2026-02-10 | 13F | Kentucky Retirement Systems Insurance Trust Fund | 9.058 | 0,00 | 3.184 | -4,93 | ||||
| 2026-04-16 | 13F | Pine Haven Investment Counsel, Inc | 3.514 | 0,00 | 1.155 | -6,56 | ||||
| 2026-02-11 | 13F | Dorsey & Whitney Trust CO LLC | 4.262 | -4,72 | 1.498 | -9,44 | ||||
| 2026-02-05 | 13F | S&co Inc | 15.307 | -0,42 | 5 | 0,00 | ||||
| 2026-04-09 | 13F | Secure Asset Management, LLC | 1.834 | 1,16 | 603 | -5,49 |