Grundlæggende statistik
| Institutionelle ejere | 342 total, 336 long only, 2 short only, 4 long/short - change of -16,79% MRQ |
| Del pris | 107,85 |
| Gennemsnitlig porteføljeallokering | 0.4722 % - change of -11,20% MRQ |
| Institutionelle aktier (lange) | 77.558.977 (ex 13D/G) - change of -9,35MM shares -10,76% MRQ |
| Institutionel værdi (lang) | $ 7.599.877 USD ($1000) |
Institutionelt ejerskab og aktionærer
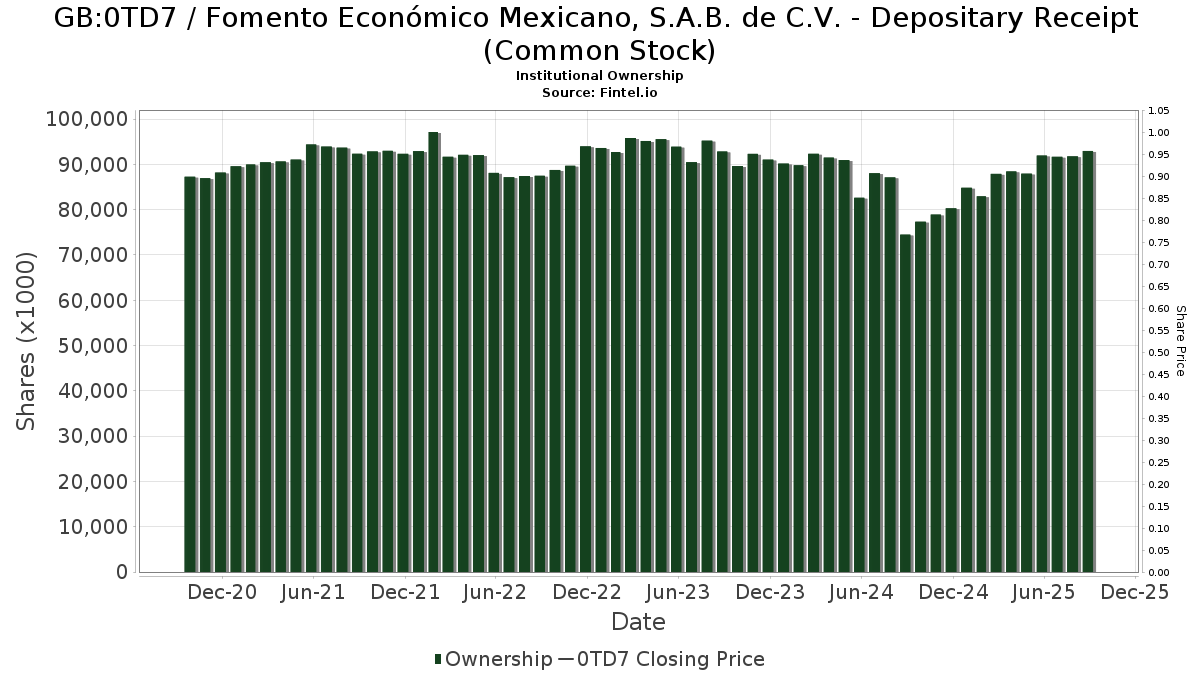
Fomento Económico Mexicano, S.A.B. de C.V. - Depositary Receipt (Common Stock) (GB:0TD7) har 342 institutionelle ejere og aktionærer, der har indsendt 13D/G- eller 13F-formularer til Securities Exchange Commission (SEC). Disse institutioner har i alt 77,558,977 aktier. Største aktionærer omfatter First Eagle Investment Management, LLC, SGENX - First Eagle Global Fund Class A, Royal Bank Of Canada, Harding Loevner Lp, Nuveen, LLC, Fmr Llc, Baillie Gifford & Co, Schroder Investment Management Group, Harris Associates L P, and SGOVX - First Eagle Overseas Fund Class A .
Fomento Económico Mexicano, S.A.B. de C.V. - Depositary Receipt (Common Stock) (LSE:0TD7) institutionel ejerskabsstruktur viser aktuelle positioner i virksomheden efter institutioner og fonde, samt seneste ændringer i positionsstørrelse. Større aktionærer kan omfatte individuelle investorer, investeringsforeninger, hedgefonde eller institutioner. Skema 13D angiver, at investoren besidder (eller besidder) mere end 5 % af virksomheden og har til hensigt (eller har til hensigt at) aktivt at forfølge en ændring i forretningsstrategi. Skema 13G indikerer en passiv investering på over 5%.
The share price as of March 9, 2026 is 107,85 / share. Previously, on March 10, 2025, the share price was 97,35 / share. This represents an increase of 10,79% over that period.
Fondens stemningsscore
Fund Sentiment Score (fka Ownership Accumulation Score) finder de aktier, der bliver mest købt af fonde. Det er resultatet af en sofistikeret, multi-faktor kvantitativ model, der identificerer virksomheder med de højeste niveauer af institutionel akkumulering. Scoringsmodellen bruger en kombination af den samlede stigning i oplyste ejere, ændringerne i porteføljeallokeringer i disse ejere og andre målinger. Tallet går fra 0 til 100, hvor højere tal indikerer et højere niveau af akkumulering for sine jævnaldrende, og 50 er gennemsnittet.
Opdateringsfrekvens: Dagligt
Se Ownership Explorer, som giver en liste over højest rangerende virksomheder.
AI+ Ask Fintel’s AI assistant about Fomento Económico Mexicano, S.A.B. de C.V. - Depositary Receipt (Common Stock).
Select a question to share a public post with an AI-crafted answer.
Thinking of good questions…
13F og NPORT arkivering
Detaljer om 13F-arkivering er gratis. Detaljer om NP-ansøgninger kræver et premium-medlemskab. Grønne rækker angiver nye positioner. Røde rækker angiver lukkede positioner. Klik på linket ikon for at se den fulde transaktionshistorik.
Opgrader
for at låse premium-data op og eksportere til Excel ![]() .
.
| Fil dato | Kilde | Investor | Type | Gennemsnitlig pris (Øst) |
Aktier | Δ Aktier (%) |
Rapporteret Værdi ($1000) |
Δ Værdi (%) |
Port Alloc (%) |
|
|---|---|---|---|---|---|---|---|---|---|---|
| 2026-02-12 | 13F | BRYN MAWR TRUST Co | 0 | -100,00 | 0 | -100,00 | ||||
| 2026-02-13 | 13F | Atlas Capital Advisors Llc | 499 | -16,97 | 50 | -18,03 | ||||
| 2026-02-17 | 13F | PharVision Advisers, LLC | 0 | -100,00 | 0 | |||||
| 2026-02-17 | 13F | Bank Of America Corp /de/ | 415.043 | -45,26 | 41.948 | -43,90 | ||||
| 2025-11-14 | 13F | XTX Topco Ltd | 0 | -100,00 | 0 | -100,00 | ||||
| 2026-02-17 | 13F | Talaria Asset Management Pty Ltd | 0 | -100,00 | 0 | |||||
| 2026-02-09 | 13F | Mondrian Investment Partners LTD | 1.245 | 28,62 | 126 | 31,58 | ||||
| 2026-02-17 | 13F | Northern Trust Corp | 455.404 | 5,87 | 46.028 | 8,49 | ||||
| 2025-10-30 | 13F | Twin Peaks Wealth Advisors, LLC | 0 | -100,00 | 0 | |||||
| 2025-11-12 | 13F | CIBC Bancorp USA Inc. | 510.425 | 50.343 | ||||||
| 2026-02-17 | 13F | Guggenheim Capital Llc | 3.930 | -21,38 | 397 | -19,47 | ||||
| 2026-02-04 | 13F | INCA Investments LLC | 395.261 | 6,91 | 39.949 | 9,55 | ||||
| 2026-02-11 | 13F | Jpmorgan Chase & Co | 1.286.601 | -10,41 | 130.037 | -8,20 | ||||
| 2026-02-04 | 13F | First Eagle Investment Management, LLC | 12.507.215 | -0,01 | 1.264.104 | 2,46 | ||||
| 2026-02-17 | 13F | Man Group plc | 18.536 | -61,08 | 1.873 | -60,12 | ||||
| 2026-01-20 | 13F | Perpetual Ltd | 85.067 | 100,22 | 8.598 | 105,18 | ||||
| 2026-02-13 | 13F | Cornerstone Financial Management LLC | 12 | 1 | ||||||
| 2025-09-25 | NP | VMMSX - Vanguard Emerging Markets Select Stock Fund Investor Shares | 27.794 | -3,12 | 2.514 | -16,78 | ||||
| 2026-02-13 | 13F | Wells Fargo & Company/mn | 59.283 | 19,46 | 5.992 | 22,42 | ||||
| 2026-02-23 | 13F | Virtu Financial LLC | 11.247 | 1 | ||||||
| 2025-09-26 | NP | BLACKROCK FUNDS - BlackRock Advantage ESG Emerging Markets Equity Fund Institutional This fund is a listed as child fund of BlackRock, Inc. and if that institution has disclosed ownership in this security, then these positions will not be double counted when calculating total shares and total value | 684 | -8,06 | 62 | -21,79 | ||||
| 2026-02-10 | 13F | Bnp Paribas Arbitrage, Sa | 17.508 | -0,82 | 1.770 | 1,61 | ||||
| 2026-02-03 | 13F | Manning & Napier Advisors Llc | 24.121 | -1,49 | 2.438 | 0,21 | ||||
| 2026-02-12 | 13F | Jane Street Group, Llc | Call | 0 | -100,00 | 0 | -100,00 | |||
| 2026-02-11 | 13F | Empowered Funds, LLC | 21.817 | 2.205 | ||||||
| 2026-02-12 | 13F | Fortress Private Ledger, Llc | 5.879 | 22,20 | 594 | 25,32 | ||||
| 2025-09-26 | NP | TIOIX - TIAA-CREF International Opportunities Fund Institutional Class | 397.314 | -1,28 | 35.941 | -15,20 | ||||
| 2026-02-02 | 13F | CENTRAL TRUST Co | 5 | 1 | ||||||
| 2026-02-12 | 13F | Comgest Global Investors S.a.s. | 0 | -100,00 | 0 | |||||
| 2026-01-05 | 13F | Chesapeake Asset Management Llc | Put | 0 | -100,00 | 0 | ||||
| 2026-02-12 | 13F | Pitcairn Co | 0 | -100,00 | 0 | |||||
| 2026-01-05 | 13F | Chesapeake Asset Management Llc | 0 | -100,00 | 0 | |||||
| 2026-02-03 | 13F | Crossmark Global Holdings, Inc. | 33.251 | 20,44 | 3.361 | 23,44 | ||||
| 2026-02-12 | 13F | Brinker Capital Investments, LLC | 9.778 | 52,45 | 988 | 56,33 | ||||
| 2026-02-13 | 13F | SRS Capital Advisors, Inc. | 812 | 20,12 | 82 | 24,24 | ||||
| 2025-11-14 | 13F | Gluskin Sheff & Assoc Inc | 0 | -100,00 | 0 | |||||
| 2026-02-17 | 13F | Jones Financial Companies Lllp | 264 | -6,71 | 27 | -3,70 | ||||
| 2026-02-11 | 13F | Parallel Advisors, LLC | 680 | 0,59 | 69 | 3,03 | ||||
| 2026-01-14 | 13F | Exchange Traded Concepts, Llc | 203.498 | 41,45 | 20.568 | 44,95 | ||||
| 2026-02-13 | 13F | Morgan Stanley | 417.717 | -39,55 | 42.219 | -38,06 | ||||
| 2026-02-17 | 13F | Amundi | 558.967 | -1,10 | 56.495 | 5,08 | ||||
| 2026-02-13 | 13F | BNP Paribas Asset Management Holding S.A. | 2.020 | 0,00 | 0 | |||||
| 2026-02-17 | 13F | DV Trading LLC | 2 | 0 | ||||||
| 2026-03-06 | 13F | Hsbc Holdings Plc | 14.433 | 5,35 | 1.459 | 7,92 | ||||
| 2025-09-24 | NP | BLACKROCK FUNDS - BlackRock Defensive Advantage Emerging Markets Fund Institutional This fund is a listed as child fund of BlackRock, Inc. and if that institution has disclosed ownership in this security, then these positions will not be double counted when calculating total shares and total value | 517 | -61,22 | 47 | -57,80 | ||||
| 2026-02-17 | 13F | Caption Management, LLC | 20.000 | 2.021 | ||||||
| 2026-02-12 | 13F | Skopos Labs, Inc. | 6.579 | 191,88 | 677 | 195,20 | ||||
| 2026-02-10 | 13F | Future Fund LLC | 6.476 | -11,99 | 655 | -9,79 | ||||
| 2026-02-10 | 13F | Bruce G. Allen Investments, LLC | 16 | -40,74 | 2 | -50,00 | ||||
| 2026-02-10 | 13F | Portland Global Advisors LLC | 40.002 | 2,10 | 4.043 | 4,63 | ||||
| 2025-09-26 | NP | SGENX - First Eagle Global Fund Class A | 6.677.092 | 0,00 | 604.010 | -14,10 | ||||
| 2025-10-15 | 13F | Vontobel Holding Ltd. | 0 | -100,00 | 0 | |||||
| 2026-02-11 | 13F | Capital Analysts, Inc. | 64 | -14,67 | 0 | |||||
| 2025-09-25 | NP | DFSE - Dimensional Emerging Markets Sustainability Core 1 ETF | 2.642 | 0,00 | 239 | -14,39 | ||||
| 2026-02-12 | 13F | BlackRock, Inc. | 427.004 | -9,14 | 43.157 | -6,89 | ||||
| 2026-02-09 | 13F | Hantz Financial Services, Inc. | 4.572 | 93,16 | 0 | |||||
| 2026-02-10 | 13F | Sustainable Growth Advisers, LP | 155.439 | -22,77 | 15.710 | -20,86 | ||||
| 2026-02-17 | 13F | Caption Management, LLC | Put | 75.900 | 7.671 | |||||
| 2026-02-10 | 13F | CIBC Asset Management Inc | 4.211 | 17,92 | 426 | 20,74 | ||||
| 2025-09-26 | NP | TIIEX - TIAA-CREF International Equity Fund Institutional Class | 264.195 | -5,02 | 23.899 | -18,41 | ||||
| 2025-11-03 | 13F | New York State Common Retirement Fund | 0 | -100,00 | 0 | |||||
| 2025-11-03 | 13F | Annis Gardner Whiting Capital Advisors, LLC | 0 | -100,00 | 0 | |||||
| 2026-02-19 | 13F | Invesco Ltd. | 1.244.820 | 18,90 | 125.814 | 21,85 | ||||
| 2026-02-13 | 13F | Citigroup Inc | 107.673 | -6,11 | 10.883 | -3,78 | ||||
| 2026-02-17 | 13F | SageView Advisory Group, LLC | 215 | 22 | ||||||
| 2026-02-14 | 13F | Rockefeller Capital Management L.P. | 1.302 | 10.750,00 | 132 | 13.000,00 | ||||
| 2026-02-17 | 13F | Lazard Asset Management Llc | 667.269 | -1,26 | 67.441 | 1,18 | ||||
| 2025-09-23 | NP | VVIFX - Voya VACS Series EME Fund | 32.723 | -22,05 | 2.960 | -33,03 | ||||
| 2026-02-12 | 13F | Callan Family Office, LLC | 26.131 | 63,45 | 2.641 | 67,58 | ||||
| 2026-01-13 | 13F | Mather Group, Llc. | 0 | -100,00 | 0 | |||||
| 2026-01-23 | 13F | Robeco Institutional Asset Management B.V. | 771.027 | -3,63 | 77.928 | -1,25 | ||||
| 2026-02-13 | 13F | USS Investment Management Ltd | 319.194 | 0,00 | 32.251 | 2,43 | ||||
| 2026-02-09 | 13F | Councilmark Asset Management, LLC | 8.755 | -0,96 | 885 | 1,49 | ||||
| 2026-02-17 | 13F | Engineers Gate Manager LP | 4.049 | 409 | ||||||
| 2026-02-13 | 13F | Barclays Plc | 253.350 | 67,87 | 25.606 | 72,03 | ||||
| 2026-01-27 | 13F | Regions Financial Corp | 9.979 | 8,87 | 1.009 | 11,50 | ||||
| 2026-01-08 | 13F | Wealth Enhancement Advisory Services, Llc | 2.418 | 1,17 | 244 | 8,00 | ||||
| 2026-02-11 | 13F | Capital Wealth Planning, LLC | 33.904 | -24,84 | 3.422 | -23,08 | ||||
| 2026-02-03 | 13F | Ballentine Partners, LLC | 2.155 | -8,61 | 218 | -6,47 | ||||
| 2026-02-24 | 13F | MidFirst Bank | 1.211 | 122 | ||||||
| 2026-02-12 | 13F | Jane Street Group, Llc | Put | 9.400 | 950 | |||||
| 2026-02-09 | 13F | Smithfield Trust Co | 82 | 0,00 | 0 | |||||
| 2026-01-23 | 13F | Factory Mutual Insurance Co | 29.151 | 0,00 | 2.946 | 2,47 | ||||
| 2026-02-17 | 13F | Harding Loevner Lp | 5.934.259 | 3,51 | 599.790 | 6,08 | ||||
| 2026-02-13 | 13F | Medina Singh Partners, LLC | 0 | -100,00 | 0 | |||||
| 2026-02-13 | 13F | Itau Unibanco Holding S.A. | 409.557 | 41.408 | ||||||
| 2026-01-26 | 13F | Private Trust Co Na | 39 | 4 | ||||||
| 2026-02-11 | 13F | Vise Technologies, Inc. | 4.660 | 13,24 | 471 | 16,30 | ||||
| 2026-01-27 | 13F | First Horizon Corp | 3.544 | 64,07 | 358 | 68,08 | ||||
| 2026-02-11 | 13F | Janney Montgomery Scott LLC | 2.387 | 0 | ||||||
| 2026-02-12 | 13F | Hm Payson & Co | 21 | 2 | ||||||
| 2025-09-25 | NP | ABEMX - Aberdeen Emerging Markets Fund Institutional Class | 108.725 | 0,00 | 9.835 | -14,10 | ||||
| 2025-11-13 | 13F | Deutsche Bank Ag\ | 0 | -100,00 | 0 | |||||
| 2026-02-04 | 13F | LRI Investments, LLC | 148 | 24,37 | 15 | 27,27 | ||||
| 2026-02-06 | 13F | EverSource Wealth Advisors, LLC | 1.330 | 7,78 | 134 | 10,74 | ||||
| 2026-01-30 | 13F | Keybank National Association/oh | 20.578 | 17,93 | 2.080 | 20,80 | ||||
| 2025-09-25 | NP | GLLAX - Aberdeen Global Equity Fund Class A | 11.393 | 0,00 | 1.031 | -14,10 | ||||
| 2026-02-13 | 13F | JustInvest LLC | 6.743 | 3,45 | 682 | 6,07 | ||||
| 2026-02-12 | 13F | Steward Partners Investment Advisory, Llc | 390 | 0,78 | 39 | 2,63 | ||||
| 2026-01-28 | 13F | CAPROCK Group, Inc. | 5.902 | 12,35 | 597 | 30,99 | ||||
| 2026-01-23 | 13F | Transcend Wealth Collective, Llc | 4.977 | 43,22 | 503 | 47,08 | ||||
| 2026-02-13 | 13F | Macquarie Group Ltd | 0 | -100,00 | 0 | |||||
| 2025-11-13 | 13F | GQG Partners LLC | 0 | -100,00 | 0 | |||||
| 2026-01-30 | 13F | Mitsubishi UFJ Trust & Banking Corp | 33.163 | 6,75 | 3.347 | 9,24 | ||||
| 2025-09-25 | NP | ROAM - Hartford Multifactor Emerging Markets ETF | 1.290 | 21,24 | 117 | 12,62 | ||||
| 2026-01-26 | 13F | Cwm, Llc | 433 | 20,28 | 0 | |||||
| 2026-01-15 | 13F | Frank, Rimerman Advisors LLC | 2.776 | 281 | ||||||
| 2026-02-13 | 13F | Pinnacle Wealth Planning Services, Inc. | 1.246 | 126 | ||||||
| 2026-02-02 | 13F | Fifth Third Bancorp | 30.189 | 20,26 | 3.051 | 23,27 | ||||
| 2026-02-09 | 13F | Summitry Llc | 6.398 | 32,90 | 647 | 36,29 | ||||
| 2025-09-25 | NP | JEMSX - JPMorgan Emerging Markets Equity Fund Class I | 0 | -100,00 | 0 | -100,00 | ||||
| 2026-01-28 | 13F | HB Wealth Management, LLC | 2.355 | -17,46 | 238 | -15,30 | ||||
| 2026-01-26 | 13F | La Banque Postale Asset Management SA | 529.380 | 2,09 | 53.504 | 4,62 | ||||
| 2025-11-14 | 13F | Jain Global LLC | 0 | -100,00 | 0 | |||||
| 2025-09-29 | NP | AWWIX - CIBC ATLAS INTERNATIONAL GROWTH FUND Institutional Class Shares | 104.529 | 4,24 | 9.456 | -10,46 | ||||
| 2026-02-12 | 13F | Banco BTG Pactual S.A. | 0 | -100,00 | 0 | |||||
| 2025-11-05 | 13F | Renaissance Group Llc | 0 | -100,00 | 0 | -100,00 | ||||
| 2025-09-25 | NP | DFEM - Dimensional Emerging Markets Core Equity 2 ETF | 11.338 | 0,00 | 1.026 | -14,15 | ||||
| 2026-02-09 | 13F | Atlantic Trust, LLC | 0 | -100,00 | 0 | |||||
| 2026-02-17 | 13F | Susquehanna International Group, Llp | Put | 100.200 | 88,35 | 10.127 | 93,01 | |||
| 2026-02-17 | 13F | Susquehanna International Group, Llp | Call | 17.300 | -90,54 | 1.749 | -90,30 | |||
| 2026-02-12 | 13F | Wealthspire Advisors, LLC | 0 | -100,00 | 0 | |||||
| 2026-02-12 | 13F | Hrt Financial Lp | 0 | -100,00 | 0 | |||||
| 2026-02-12 | 13F | Provida Pension Fund Administrator | 0 | -100,00 | 0 | |||||
| 2026-02-17 | 13F | Advisor Group Holdings, Inc. | 1.560 | -48,02 | 158 | -46,78 | ||||
| 2026-01-05 | 13F | GAMMA Investing LLC | 155 | -6,06 | 16 | -6,25 | ||||
| 2026-02-13 | 13F | Schroder Investment Management Group | 2.956.155 | -10,16 | 297.507 | -8,97 | ||||
| 2026-02-12 | 13F | Advisors Asset Management, Inc. | 5.975 | 62,98 | 604 | 67,04 | ||||
| 2026-01-30 | 13F | State of New Jersey Common Pension Fund D | 181.075 | -4,54 | 18.301 | -2,18 | ||||
| 2026-01-26 | 13F | Phraction Management LLC | 3.955 | 0,53 | 400 | 2,84 | ||||
| 2026-02-04 | 13F | Madison Asset Management, LLC | 15.822 | -3,59 | 1.599 | -1,17 | ||||
| 2026-02-17 | 13F | Creative Planning | 22.427 | 13,73 | 2.267 | 16,56 | ||||
| 2026-02-17 | 13F | AREX Capital Management, LP | 6.584 | 93,65 | 665 | 98,51 | ||||
| 2025-09-26 | NP | HLXCX - Emerging Markets ex China Portfolio Institutional Class | 661 | 0,00 | 60 | -14,49 | ||||
| 2026-02-11 | 13F | Fox Run Management, L.l.c. | 7.569 | 765 | ||||||
| 2025-09-25 | NP | DFCEX - Emerging Markets Core Equity Portfolio - Institutional Class This fund is a listed as child fund of Dimensional Fund Advisors Lp and if that institution has disclosed ownership in this security, then these positions will not be double counted when calculating total shares and total value | 66.202 | 0,00 | 5.989 | -14,10 | ||||
| 2026-02-17 | 13F | Jump Financial, LLC | 38.700 | -77,17 | 3.911 | -76,61 | ||||
| 2026-01-23 | 13F | Assetmark, Inc | 25.592 | 61,34 | 2.587 | 65,35 | ||||
| 2026-01-30 | 13F | Arlington Trust Co LLC | 0 | -100,00 | 0 | |||||
| 2026-02-02 | 13F | Oppenheimer Asset Management Inc. | 46.894 | 7,68 | 4.740 | 10,34 | ||||
| 2026-01-26 | 13F | Mirae Asset Global Investments Co., Ltd. | 3.388 | 0,68 | 338 | 2,11 | ||||
| 2026-02-13 | 13F | Van Eck Associates Corp | 883 | 6,51 | 0 | |||||
| 2026-01-29 | 13F | Matthews International Capital Management Llc | 31.291 | 0,77 | 3.163 | 3,27 | ||||
| 2025-11-05 | 13F | Prime Capital Investment Advisors, LLC | 0 | -100,00 | 0 | -100,00 | ||||
| 2025-11-07 | 13F | Cumberland Partners Ltd | 0 | -100,00 | 0 | |||||
| 2025-09-24 | NP | DAEMX - Dunham Emerging Markets Stock Fund Class A | 0 | -100,00 | 0 | -100,00 | ||||
| 2026-01-08 | 13F | Tompkins Financial Corp | 13 | -99,61 | 1 | -99,50 | ||||
| 2026-01-21 | 13F | Baker Ellis Asset Management LLC | 36.592 | -4,51 | 3.698 | -2,14 | ||||
| 2025-09-23 | NP | IEMGX - Voya Multi-Manager Emerging Markets Equity Fund Class I | 24.321 | -16,53 | 2.200 | -28,29 | ||||
| 2026-02-10 | 13F | State of Wyoming | 2.763 | 90,16 | 279 | 95,10 | ||||
| 2026-01-07 | 13F | Northside Capital Management, LLC | 5.150 | 0,00 | 521 | 2,56 | ||||
| 2025-09-26 | NP | MSTFX - Morningstar International Equity Fund | 51.144 | 0,05 | 4.626 | -14,06 | ||||
| 2026-01-29 | 13F | Deltec Asset Management Llc | 5.500 | 0,00 | 556 | 2,40 | ||||
| 2026-01-29 | 13F | Rakuten Securities, Inc. | 7 | 600,00 | 1 | |||||
| 2026-02-18 | 13F | Vident Advisory, LLC | 8.937 | -18,03 | 903 | -16,00 | ||||
| 2026-02-10 | 13F | Peapack Gladstone Financial Corp | 0 | -100,00 | 0 | |||||
| 2025-09-24 | NP | EMFIX - Ashmore Emerging Markets Equity Fund INSTITUTIONAL CLASS | 0 | -100,00 | 0 | -100,00 | ||||
| 2025-09-26 | NP | FAMKX - Fidelity Advisor Emerging Markets Fund Class A This fund is a listed as child fund of Fmr Llc and if that institution has disclosed ownership in this security, then these positions will not be double counted when calculating total shares and total value | 1.082.926 | 0,60 | 97.961 | -13,58 | ||||
| 2026-01-27 | 13F | Bayforest Capital Ltd | 1.796 | -44,29 | 182 | -42,90 | ||||
| 2026-02-06 | 13F | Cullen/frost Bankers, Inc. | 1.200 | 0,00 | 121 | 2,54 | ||||
| 2026-02-13 | 13F | Arrowstreet Capital, Limited Partnership | 177.725 | -69,23 | 17.963 | -68,47 | ||||
| 2026-01-12 | 13F | DAVENPORT & Co LLC | 28.406 | 23,60 | 2.871 | 26,65 | ||||
| 2026-02-13 | 13F | State Street Corp | 6.960 | -10,31 | 703 | -8,10 | ||||
| 2026-01-15 | 13F | Highline Wealth Partners Llc | 61 | -29,89 | 6 | -25,00 | ||||
| 2026-02-13 | 13F | Caitong International Asset Management Co., Ltd | 0 | -100,00 | 0 | |||||
| 2026-02-17 | 13F | Cetera Investment Advisers | 2.449 | 248 | ||||||
| 2026-02-12 | 13F | Barings Llc | 79.217 | 9,09 | 8.006 | 11,78 | ||||
| 2026-02-17 | 13F | Cook & Bynum Capital Management, LLC | 233.445 | 0,00 | 23.594 | 2,48 | ||||
| 2026-02-09 | 13F | Morningstar Investment Management LLC | 0 | -100,00 | 0 | |||||
| 2026-02-10 | 13F | Savant Capital, LLC | 2.274 | 230 | ||||||
| 2025-09-25 | NP | JETIX - abrdn Global Equity Impact Fund Institutional Class | 6.673 | -5,44 | 604 | -18,84 | ||||
| 2026-01-28 | 13F | B. Metzler seel. Sohn & Co. AG | 73.753 | 0,27 | 7.454 | 2,76 | ||||
| 2026-02-13 | 13F | Hudson Bay Capital Management LP | Call | 0 | -100,00 | 0 | ||||
| 2025-10-31 | 13F | Whittier Trust Co | 0 | -100,00 | 0 | -100,00 | ||||
| 2025-09-23 | NP | SLANX - DWS Latin America Equity Fund Class A | 8.208 | -80,93 | 742 | -83,63 | ||||
| 2026-01-30 | 13F | Us Bancorp \de\ | 53.283 | 9,18 | 5.385 | 11,88 | ||||
| 2026-01-15 | 13F | Nisa Investment Advisors, Llc | 100 | 0,00 | 10 | 11,11 | ||||
| 2026-02-02 | 13F | One Wealth Advisors, LLC | 8.484 | 20,63 | 857 | 23,67 | ||||
| 2026-01-29 | 13F | Vanguard Group Inc | 51.423 | -7,36 | 5.197 | -5,06 | ||||
| 2026-02-13 | 13F | Toroso Investments, LLC | 4.485 | 6,36 | 453 | 9,16 | ||||
| 2026-02-10 | 13F | Envestnet Asset Management Inc | 272.685 | -0,83 | 27.560 | 1,63 | ||||
| 2026-02-11 | 13F | Brandes Investment Partners, Lp | 21.222 | 1,96 | 2.145 | 4,48 | ||||
| 2026-02-06 | 13F | Global Retirement Partners, LLC | 247 | 0,82 | 25 | 0,00 | ||||
| 2025-09-25 | NP | EMGAX - Wells Fargo Emerging Markets Equity Fund Class A | 327.412 | -2,39 | 29.618 | -16,15 | ||||
| 2026-02-12 | 13F | JPL Wealth Management, LLC | 0 | -100,00 | 0 | |||||
| 2026-02-13 | 13F | Neuberger Berman Group LLC | 30.727 | 15,96 | 3.106 | 18,83 | ||||
| 2026-01-09 | 13F | SG Americas Securities, LLC | 7.038 | 42,01 | 1 | |||||
| 2026-02-05 | 13F | Gabelli Funds Llc | 201.200 | -0,64 | 20.335 | 1,82 | ||||
| 2026-02-03 | 13F | Ethic Inc. | 14.679 | 16,33 | 1.484 | 19,21 | ||||
| 2026-02-09 | 13F | Coldstream Capital Management Inc | 0 | -100,00 | 0 | |||||
| 2026-02-13 | 13F | Mariner, LLC | 27.600 | 25,23 | 2.789 | 28,35 | ||||
| 2026-02-17 | 13F | Aqr Capital Management Llc | 11.877 | -90,64 | 1.198 | -90,44 | ||||
| 2025-11-14 | 13F | Centiva Capital, LP | 0 | -100,00 | 0 | |||||
| 2026-01-20 | 13F | Signaturefd, Llc | 2.986 | 5,07 | 302 | 7,50 | ||||
| 2026-02-18 | 13F | Mackenzie Financial Corp | 14.599 | -75,90 | 1.466 | -75,46 | ||||
| 2026-02-17 | 13F | Advisory Services Network, LLC | 0 | -100,00 | 0 | |||||
| 2025-09-25 | NP | SEMVX - Hartford Schroders Emerging Markets Equity Fund Class A | 607.819 | -6,18 | 54.983 | -19,41 | ||||
| 2026-02-17 | 13F | Altrinsic Global Advisors Llc | 908.649 | -0,46 | 91.837 | 2,00 | ||||
| 2026-01-29 | 13F | Sava Infond d.o.o. | 7.640 | 0,00 | 772 | 2,52 | ||||
| 2026-02-13 | 13F | Banque Transatlantique SA | 399 | -8,49 | 40 | -4,76 | ||||
| 2025-11-14 | 13F | Aquatic Capital Management LLC | 0 | -100,00 | 0 | |||||
| 2026-02-09 | 13F | Employees Retirement System of Texas | 493.602 | -3,99 | 50 | -2,00 | ||||
| 2026-01-29 | 13F | UMA Financial Services, Inc. | 192 | -1,54 | 19 | 0,00 | ||||
| 2025-11-14 | 13F | Susquehanna International Group, Llp | 0 | -100,00 | 0 | -100,00 | ||||
| 2026-02-13 | 13F | Stifel Financial Corp | 21.072 | 22,21 | 2.130 | 25,24 | ||||
| 2026-02-09 | 13F | Cary Street Partner Investment Advisory Llc | 60 | 11,11 | 6 | 20,00 | ||||
| 2025-11-14 | 13F | Squarepoint Ops LLC | 0 | -100,00 | 0 | |||||
| 2025-11-19 | 13F | Sunbelt Securities, Inc. | 0 | -100,00 | 0 | -100,00 | ||||
| 2026-01-09 | 13F | Park Place Capital Corp | 62 | 0,00 | 6 | 0,00 | ||||
| 2026-02-17 | 13F | Balyasny Asset Management Llc | 7.711 | 779 | ||||||
| 2025-09-25 | NP | PRLAX - T. Rowe Price Latin America Fund This fund is a listed as child fund of Price T Rowe Associates Inc /md/ and if that institution has disclosed ownership in this security, then these positions will not be double counted when calculating total shares and total value | 81.000 | -15,36 | 7.327 | -27,30 | ||||
| 2026-02-13 | 13F | MAI Capital Management | 341 | 0,00 | 34 | 3,03 | ||||
| 2025-09-26 | NP | SGOVX - First Eagle Overseas Fund Class A | 2.467.172 | 0,00 | 223.180 | -14,10 | ||||
| 2025-09-25 | NP | DFA INVESTMENT DIMENSIONS GROUP INC - Emerging Markets Sustainability Core 1 Portfolio Institutional Class This fund is a listed as child fund of Dimensional Fund Advisors Lp and if that institution has disclosed ownership in this security, then these positions will not be double counted when calculating total shares and total value | 0 | -100,00 | 0 | -100,00 | ||||
| 2026-02-05 | 13F | Allworth Financial LP | 355 | -9,90 | 36 | -7,89 | ||||
| 2026-02-09 | 13F | Huntington National Bank | 1 | 0,00 | 0 | |||||
| 2025-09-26 | NP | UBPIX - Ultralatin America Profund Investor Class | 3.443 | -0,17 | 311 | -14,33 | ||||
| 2026-01-29 | 13F | Nbc Securities, Inc. | 47 | 23,68 | 5 | 33,33 | ||||
| 2026-02-13 | 13F | Black Creek Investment Management Inc. | 717.562 | -6,17 | 72.524 | -3,85 | ||||
| 2026-02-13 | 13F | Natixis | 10.700 | 37,18 | 1.081 | 40,57 | ||||
| 2026-02-17 | 13F | Ameriprise Financial Inc | 118.455 | 5,31 | 11.972 | 7,91 | ||||
| 2026-02-17 | 13F | CWM Advisors, LLC | 824 | 83 | ||||||
| 2025-09-26 | NP | HLMEX - Harding Loevner Institutional Emerging Markets Portfolio Institutional | 39.797 | -36,29 | 3.600 | -45,27 | ||||
| 2026-01-12 | 13F | Abound Wealth Management | 3 | 0,00 | 0 | |||||
| 2026-02-17 | 13F | Millennium Management Llc | 175.618 | 31,03 | 17.750 | 34,28 | ||||
| 2026-02-17 | 13F | Royal Bank Of Canada | 6.025.277 | -0,30 | 608.975 | 2,17 | ||||
| 2026-01-29 | 13F | UBS Group AG | Call | 24.691 | -48,60 | 2.496 | -47,33 | |||
| 2026-01-08 | 13F | Sarasin & Partners LLP | 15.000 | -18,92 | 1.516 | -17,47 | ||||
| 2026-01-29 | 13F | UBS Group AG | 223.963 | -22,35 | 22.636 | -20,43 | ||||
| 2026-01-22 | 13F | Pinnacle Bancorp, Inc. | 429 | 0,00 | 43 | 2,38 | ||||
| 2026-02-11 | 13F | TCTC Holdings, LLC | 9.026 | 912 | ||||||
| 2026-02-19 | 13F | Atomi Financial Group, Inc. | 4.311 | 13,30 | 436 | 16,00 | ||||
| 2026-02-13 | 13F | Victory Capital Management Inc | 647.410 | 7,90 | 65.434 | 10,57 | ||||
| 2026-01-29 | 13F | IMC-Chicago, LLC | Put | 15.600 | 1.577 | |||||
| 2026-02-17 | 13F | Laird Norton Trust Company, Llc | 5.212 | 527 | ||||||
| 2026-02-13 | 13F | Ubs Asset Management Americas Inc | 27 | 3 | ||||||
| 2026-02-05 | 13F | Atria Investments Llc | 16.981 | 18,02 | 1.716 | 20,93 | ||||
| 2026-02-12 | 13F | Triumph Capital Management | 100 | 10 | ||||||
| 2026-02-06 | 13F | HighTower Advisors, LLC | 4.139 | 7,01 | 418 | 9,71 | ||||
| 2026-02-27 | 13F | Groupama Asset Managment | 4.433 | 1,67 | 448 | 4,19 | ||||
| 2025-09-26 | NP | HLMIX - Harding Loevner International Equity Portfolio Institutional | 2.240.501 | -4,30 | 202.676 | -17,79 | ||||
| 2026-01-21 | 13F | Naviter Wealth, LLC | 2.510 | -14,80 | 254 | -12,76 | ||||
| 2026-02-13 | 13F | Rhumbline Advisers | 2.338 | 44,68 | 236 | 48,43 | ||||
| 2026-02-17 | 13F | Grantham, Mayo, Van Otterloo & Co. LLC | 47.538 | 216,94 | 4.805 | 224,81 | ||||
| 2025-09-29 | NP | GTDDX - INVESCO Developing Markets Fund Class A | 249.058 | 10,01 | 22.530 | 10,36 | ||||
| 2026-02-10 | 13F/A | Northwestern Mutual Wealth Management Co | 394 | 22,74 | 40 | 25,81 | ||||
| 2025-09-26 | NP | BLACKROCK FUNDS - BlackRock Emerging Markets ex-China Fund Investor A This fund is a listed as child fund of BlackRock, Inc. and if that institution has disclosed ownership in this security, then these positions will not be double counted when calculating total shares and total value | 390 | 16,07 | 35 | 0,00 | ||||
| 2026-02-17 | 13F | Summit Global Investments | 0 | -100,00 | 0 | |||||
| 2026-02-11 | 13F | Marks Group Wealth Management, Inc | 4.052 | 18,62 | 410 | 21,73 | ||||
| 2026-01-05 | 13F | Park Avenue Securities Llc | 3.387 | 20,53 | 0 | |||||
| 2026-01-21 | 13F | Yousif Capital Management, Llc | 3.437 | 0,00 | 355 | 4,73 | ||||
| 2026-02-13 | 13F | Y-Intercept (Hong Kong) Ltd | 16.721 | 1.690 | ||||||
| 2026-02-13 | 13F | National Bank Of Canada /fi/ | 465 | 185,28 | 47 | 187,50 | ||||
| 2026-01-08 | 13F | True Wealth Design, LLC | 45 | 2,27 | 5 | 0,00 | ||||
| 2026-02-09 | 13F | Legal & General Group Plc | 1.575 | 0,00 | 159 | 2,58 | ||||
| 2026-02-03 | 13F | RFG Advisory, LLC | 2.528 | -1,13 | 256 | 1,19 | ||||
| 2026-02-11 | 13F | Simplex Trading, Llc | Call | 0 | -100,00 | 0 | ||||
| 2026-02-11 | 13F | Simplex Trading, Llc | Put | 0 | -100,00 | 0 | ||||
| 2026-02-05 | 13F | Stephens Inc /ar/ | 6.876 | 1,10 | 695 | 3,58 | ||||
| 2026-02-03 | 13F | Washington Trust Advisors, Inc. | 152 | 27,73 | 15 | 36,36 | ||||
| 2026-01-14 | 13F | Jfs Wealth Advisors, Llc | 54 | 0,00 | 5 | 0,00 | ||||
| 2026-02-13 | 13F | Fayez Sarofim & Co | 12.733 | -8,61 | 1.287 | -6,40 | ||||
| 2025-09-26 | NP | TEMRX - TIAA-CREF Emerging Markets Equity Fund Retail Class | 524.102 | 21,40 | 47.410 | 4,28 | ||||
| 2026-01-14 | 13F | Klein Pavlis & Peasley Financial, Inc. | 40.982 | -5,26 | 4.142 | -2,91 | ||||
| 2026-01-27 | 13F | Fundamenta Capital S.A. | 133.841 | 13.527 | ||||||
| 2026-02-13 | 13F | Ieq Capital, Llc | 2.635 | 266 | ||||||
| 2025-10-21 | 13F | Ninety One North America, Inc. | 0 | -100,00 | 0 | |||||
| 2026-02-12 | 13F | Bank Of Montreal /can/ | 30.606 | 21,02 | 3.093 | 24,02 | ||||
| 2025-11-14 | 13F | Holocene Advisors, LP | 0 | -100,00 | 0 | |||||
| 2025-09-25 | NP | Dimensional Emerging Markets Value Fund - Dimensional Emerging Markets Value Fund This fund is a listed as child fund of Dimensional Fund Advisors Lp and if that institution has disclosed ownership in this security, then these positions will not be double counted when calculating total shares and total value | 62.092 | 7,66 | 5.617 | -7,53 | ||||
| 2026-02-06 | 13F | Larson Financial Group LLC | 22 | 340,00 | 2 | |||||
| 2026-02-13 | 13F | Mml Investors Services, Llc | 8.800 | 25,16 | 889 | 28,28 | ||||
| 2025-09-29 | NP | EMWLX - Lord Abbett Emerging Markets Equity Fund Class R6 | 517 | -1,52 | 47 | -16,36 | ||||
| 2026-01-15 | 13F | Hara Capital LLC | 50 | -44,44 | 5 | -37,50 | ||||
| 2026-01-30 | 13F | North Star Investment Management Corp. | 30 | 0,00 | 3 | 50,00 | ||||
| 2026-02-12 | 13F | Gardner Russo & Quinn Llc | 0 | -100,00 | 0 | |||||
| 2025-09-25 | NP | DFAX - Dimensional World ex U.S. Core Equity 2 ETF | 1.523 | 0,00 | 138 | -14,37 | ||||
| 2026-02-12 | 13F | APG Asset Management N.V. | 9.754 | 0,00 | 839 | 2,57 | ||||
| 2025-09-26 | NP | FHKFX - Fidelity Series Emerging Markets Fund This fund is a listed as child fund of Fmr Llc and if that institution has disclosed ownership in this security, then these positions will not be double counted when calculating total shares and total value | 78.738 | -6,04 | 7.123 | -19,29 | ||||
| 2026-01-16 | 13F | Ronald Blue Trust, Inc. | 7.980 | -14,73 | 807 | -12,58 | ||||
| 2026-02-06 | 13F | Profund Advisors Llc | 8.165 | 6,90 | 825 | 9,56 | ||||
| 2026-02-05 | 13F | Bessemer Group Inc | 312 | 27,35 | 0 | |||||
| 2026-02-17 | 13F | Tower Research Capital LLC (TRC) | 0 | -100,00 | 0 | |||||
| 2026-02-02 | 13F | Truist Financial Corp | 18.363 | 15,00 | 1.856 | 17,85 | ||||
| 2026-01-21 | 13F | Stone House Investment Management, LLC | 6 | 1 | ||||||
| 2026-02-02 | 13F | Strs Ohio | 295.582 | -7,43 | 29.874 | -5,14 | ||||
| 2026-02-10 | 13F | Quantbot Technologies LP | 468 | -98,29 | 47 | -98,26 | ||||
| 2026-02-17 | 13F | Cape Investment Advisory, Inc. | 192 | 26,32 | 19 | 35,71 | ||||
| 2026-02-06 | 13F | Fairtree Asset Management (Pty) Ltd | 3.194 | -27,23 | 323 | -25,46 | ||||
| 2026-02-17 | 13F | Captrust Financial Advisors | 32.973 | 83,79 | 3.333 | 88,36 | ||||
| 2026-02-06 | 13F | Vestmark Advisory Solutions, Inc. | 35.509 | 1.038,47 | 3.589 | 1.068,73 | ||||
| 2025-09-24 | NP | ESIGX - Ashmore Emerging Markets Equity ESG Fund Institutional Class | 0 | -100,00 | 0 | -100,00 | ||||
| 2026-02-11 | 13F | Franklin Resources Inc | 3.484 | 11,85 | 352 | 14,66 | ||||
| 2026-01-13 | 13F | Riverbridge Partners Llc | 2.321 | 235 | ||||||
| 2026-01-28 | 13F | Geneos Wealth Management Inc. | 46 | 253,85 | 5 | 300,00 | ||||
| 2025-11-14 | 13F/A | Massar Capital Management, LP | 0 | -100,00 | 0 | |||||
| 2026-01-28 | 13F | Financial Perspectives, Inc | 100 | 0,00 | 10 | 11,11 | ||||
| 2026-02-05 | 13F | HughesLittle Investment Management Ltd. | 0 | -100,00 | 0 | -100,00 | ||||
| 2026-01-23 | 13F | Halbert Hargrove Global Advisors, Llc | 0 | -100,00 | 0 | |||||
| 2026-01-27 | 13F | Proffitt & Goodson Inc | 0 | -100,00 | 0 | |||||
| 2025-10-21 | 13F | Jarislowsky, Fraser Ltd | 55.306 | -2,04 | 5.455 | -6,18 | ||||
| 2026-02-06 | 13F | Pnc Financial Services Group, Inc. | 8.190 | 2,71 | 828 | 5,22 | ||||
| 2026-01-07 | 13F | Aventura Private Wealth, LLC | 13 | 0,00 | 1 | 0,00 | ||||
| 2026-02-12 | 13F | Brown Brothers Harriman & Co | 271 | -62,62 | 27 | -61,97 | ||||
| 2026-02-17 | 13F | Russell Investments Group, Ltd. | 8.451 | -0,07 | 854 | 2,40 | ||||
| 2026-02-12 | 13F | Insigneo Advisory Services, Llc | 2.065 | 209 | ||||||
| 2026-02-11 | 13F | Janney Capital Management LLC | 77.656 | -0,99 | 8 | 0,00 | ||||
| 2026-01-05 | 13F | Confluence Investment Management Llc | 2.636 | 0,00 | 266 | 2,31 | ||||
| 2025-09-25 | NP | DFAE - Dimensional Emerging Core Equity Market ETF | 35.094 | 3,85 | 3.175 | -10,79 | ||||
| 2026-02-11 | 13F | Cerity Partners LLC | 12.081 | -10,40 | 1.221 | -8,20 | ||||
| 2026-02-13 | 13F | American Century Companies Inc | 196.697 | 7,37 | 19.880 | 10,03 | ||||
| 2026-02-13 | 13F | Bennbridge Ltd | 351.421 | -6,00 | 35.518 | 2,37 | ||||
| 2026-01-26 | 13F | Patriot Financial Group Insurance Agency, LLC | 3.661 | 4,42 | 370 | 7,25 | ||||
| 2025-09-26 | NP | UUPIX - Ultraemerging Markets Profund Investor Class | 841 | 16,16 | 76 | 0,00 | ||||
| 2026-02-03 | 13F | Coston, McIsaac & Partners | 21 | 0 | ||||||
| 2025-10-31 | 13F | Whittier Trust Co Of Nevada Inc | 0 | -100,00 | 0 | |||||
| 2025-09-26 | NP | HLEMX - Harding Loevner Emerging Markets Portfolio Advisor | 59.492 | -14,29 | 5.382 | -26,38 | ||||
| 2026-02-12 | 13F | Principal Securities, Inc. | 0 | -100,00 | 0 | |||||
| 2026-02-05 | 13F | O'Brien Greene & Co. Inc | 5.697 | 6,55 | 576 | 9,11 | ||||
| 2026-02-17 | 13F | Citadel Advisors Llc | 3.970 | -34,30 | 401 | -32,72 | ||||
| 2026-02-17 | 13F | Citadel Advisors Llc | Call | 35.400 | 10,62 | 3.578 | 13,34 | |||
| 2026-02-06 | 13F | Bare Financial Services, Inc | 16 | 0,00 | 2 | 0,00 | ||||
| 2026-02-17 | 13F | Citadel Advisors Llc | Put | 19.000 | 111,11 | 1.920 | 116,46 | |||
| 2026-02-13 | 13F | Wealth Alliance | 3.345 | -4,70 | 338 | -2,31 | ||||
| 2026-02-17 | 13F | Raymond James Financial Inc | 58.731 | 27,18 | 5.936 | 30,35 | ||||
| 2026-02-13 | 13F | Ubs Oconnor Llc | 0 | -100,00 | 0 | |||||
| 2026-01-28 | 13F | Ruffer LLP | 8.000 | 0,00 | 810 | 2,53 | ||||
| 2026-02-06 | 13F | Creative Financial Designs Inc /adv | 7 | 0,00 | 1 | |||||
| 2026-02-13 | 13F | Marshall Wace, Llp | 15.965 | 1.614 | ||||||
| 2026-02-09 | 13F | Hartland & Co., LLC | 143 | 14 | ||||||
| 2026-01-14 | 13F | Generali Investments CEE, investicni spolecnost, a.s. | 3.118 | 0,00 | 315 | 2,61 | ||||
| 2025-09-24 | NP | BLACKROCK FUNDS - BlackRock Advantage Emerging Markets Fund Investor A Shares | 0 | -100,00 | 0 | -100,00 | ||||
| 2026-02-02 | 13F | Benjamin Edwards Inc | 3.996 | 34,36 | 404 | 37,54 | ||||
| 2025-09-26 | NP | FTCEX - Fidelity Total International Equity Fund Fidelity Advisor Total International Equity Fund: Class C This fund is a listed as child fund of Fmr Llc and if that institution has disclosed ownership in this security, then these positions will not be double counted when calculating total shares and total value | 21.133 | 12,55 | 1.912 | -3,34 | ||||
| 2025-09-26 | NP | AEMGX - Acadian Emerging Markets Portfolio Investor Class Shares | 58.791 | 7,53 | 5.318 | -7,63 | ||||
| 2025-11-10 | 13F | Rossby Financial, LCC | 0 | -100,00 | 0 | |||||
| 2025-11-12 | 13F | Simplex Trading, Llc | 0 | -100,00 | 0 | |||||
| 2026-02-10 | 13F | Connor, Clark & Lunn Investment Management Ltd. | 78.346 | 0,00 | 7.918 | 2,47 | ||||
| 2026-02-03 | 13F | NewEdge Wealth, LLC | 6.698 | 7,25 | 677 | 15,16 | ||||
| 2026-02-13 | 13F | Umb Bank N A/mo | 733 | 15,07 | 74 | 19,35 | ||||
| 2025-09-25 | NP | EQIAX - Wells Fargo Emerging Markets Equity Income Fund Class A | 22.523 | 48,22 | 2.037 | 27,31 | ||||
| 2026-01-21 | 13F | Country Trust Bank | 36 | 0,00 | 4 | 0,00 | ||||
| 2026-02-17 | 13F | Harris Associates L P | 2.704.716 | -0,05 | 273.366 | 2,42 | ||||
| 2026-02-10 | 13F | Bank of New York Mellon Corp | 13.379 | 25,64 | 1.352 | 28,76 | ||||
| 2025-09-25 | NP | VTRIX - Vanguard International Value Fund Investor Shares This fund is a listed as child fund of Vanguard Group Inc and if that institution has disclosed ownership in this security, then these positions will not be double counted when calculating total shares and total value | 346.114 | 31.309 | ||||||
| 2026-02-11 | 13F | Ramirez Asset Management, Inc. | 25.915 | 2.619 | ||||||
| 2026-02-17 | 13F | Delaware Management Holdings, Inc. | 666.444 | 67.357 | ||||||
| 2026-01-21 | 13F | Greenleaf Trust | 2.420 | 0,17 | 245 | 2,52 | ||||
| 2026-02-05 | 13F | Td Private Client Wealth Llc | 2.253 | 18,83 | 228 | 21,39 | ||||
| 2026-02-19 | 13F | CI Private Wealth, LLC | 4.891 | 6,56 | 493 | 8,85 | ||||
| 2026-01-16 | 13F | Trust Co Of Vermont | 800 | 0,00 | 81 | 2,56 | ||||
| 2026-02-13 | 13F | Parkside Financial Bank & Trust | 9 | 0,00 | 1 | |||||
| 2025-11-14 | 13F | Wetherby Asset Management Inc | 2.553 | 1,51 | 252 | -2,71 | ||||
| 2026-02-13 | 13F | Sei Investments Co | 208.729 | -11,40 | 21.096 | -9,21 | ||||
| 2025-09-26 | NP | FEBAX - First Eagle Global Income Builder Fund Class A | 211.291 | 0,00 | 19.113 | -14,10 | ||||
| 2026-01-23 | 13F | Westside Investment Management, Inc. | 200 | 0,00 | 20 | 5,26 | ||||
| 2026-02-10 | 13F | Eurizon Capital SGR S.p.A. | 6.619 | 669 | ||||||
| 2025-09-25 | NP | DFEV - Dimensional Emerging Markets Value ETF | 708 | -55,78 | 64 | -61,90 | ||||
| 2026-02-13 | 13F | Walleye Trading LLC | Put | 43.100 | 4.356 | |||||
| 2026-02-13 | 13F | Walleye Trading LLC | Call | 200 | 20 | |||||
| 2026-01-23 | 13F | Lester Murray Antman dba SimplyRich | 5.467 | 2,88 | 1 | |||||
| 2026-02-13 | 13F | 1832 Asset Management L.P. | 52.696 | 5.326 | ||||||
| 2026-02-24 | 13F | Bell Investment Advisors, Inc | 30 | 0,00 | 3 | 50,00 | ||||
| 2026-02-10 | 13F | Acadian Asset Management Llc | 0 | -100,00 | 0 | |||||
| 2026-02-09 | 13F | Genus Capital Management Inc. | 3.663 | -5,18 | 370 | -3,90 | ||||
| 2026-02-17 | 13F | Ancora Advisors, LLC | 384 | 39 | ||||||
| 2026-02-03 | 13F | Sequoia Financial Advisors, LLC | 7.807 | 5,14 | 789 | 7,79 | ||||
| 2026-01-05 | 13F | Rosenberg Matthew Hamilton | 758 | 0,00 | 77 | 2,70 | ||||
| 2026-01-23 | 13F | Rsm Us Wealth Management Llc | 13.882 | -6,61 | 1.397 | -4,71 | ||||
| 2026-02-09 | 13F | Cary Street Partners Financial Llc | 31.894 | -0,54 | 3.224 | 1,93 | ||||
| 2026-02-02 | 13F | Cornerstone Planning Group LLC | 82 | 0,00 | 9 | 14,29 | ||||
| 2025-11-07 | 13F | Sierra Ocean, Llc | 0 | -100,00 | 0 | |||||
| 2026-02-18 | 13F | GWM Advisors LLC | 4.111 | -25,48 | 416 | -23,71 | ||||
| 2026-02-06 | 13F | Banque Cantonale Vaudoise | 457 | -3,79 | 46 | |||||
| 2026-02-13 | 13F | Solstein Capital, LLC | 27.490 | 0,00 | 2.778 | 2,47 | ||||
| 2026-02-10 | 13F | Nomura Asset Management Co Ltd | 0 | 0 | ||||||
| 2026-02-10 | 13F | Goldman Sachs Group Inc | 567.718 | 253,55 | 57.379 | 262,31 | ||||
| 2026-02-13 | 13F | Walleye Trading LLC | 8.883 | 898 | ||||||
| 2026-01-27 | 13F | TD Waterhouse Canada Inc. | 88 | 9 | ||||||
| 2026-01-08 | 13F | Value Partners Investments Inc. | 137.109 | 0,00 | 13.859 | 2,54 | ||||
| 2026-02-12 | 13F | Quadrant Capital Group Llc | 11.583 | -30,18 | 1.171 | -28,48 | ||||
| 2026-02-13 | 13F | Kestra Advisory Services, LLC | 0 | -100,00 | 0 | |||||
| 2026-02-17 | 13F | Nomura Holdings Inc | 27.949 | 15,43 | 2.825 | 18,26 | ||||
| 2026-02-17 | 13F | Price T Rowe Associates Inc /md/ | 73.946 | -5,37 | 7 | 0,00 | ||||
| 2026-01-21 | 13F | Northcape Capital Pty Ltd | 448.439 | 15,13 | 46.279 | 20,46 | ||||
| 2026-02-10 | 13F | Root Financial Partners, LLC | 3 | 0,00 | 0 | |||||
| 2026-02-10 | 13F | Natixis Advisors, L.p. | 131.775 | -1,03 | 13 | 0,00 | ||||
| 2026-01-23 | 13F | Baillie Gifford & Co | 3.496.366 | -6,83 | 353.378 | -4,53 | ||||
| 2026-02-12 | 13F | Federation des caisses Desjardins du Quebec | 151 | 0,00 | 15 | 7,14 | ||||
| 2026-02-11 | 13F | LPL Financial LLC | 36.865 | 17,54 | 3.726 | 20,43 | ||||
| 2025-09-26 | NP | HAOSX - Harbor Overseas Fund Institutional Class | 5.124 | 464 | ||||||
| 2025-11-04 | 13F | High Note Wealth, LLC | 0 | -100,00 | 0 | |||||
| 2026-02-13 | 13F | Pin Oak Investment Advisors Inc | 259 | 0,00 | 0 | -100,00 | ||||
| 2026-01-26 | 13F | Riverview Trust Co | 1.434 | 0,00 | 145 | 2,13 | ||||
| 2026-02-12 | 13F | Sit Investment Associates Inc | 0 | -100,00 | 0 | |||||
| 2025-09-26 | NP | FTLS - First Trust Long/Short Equity ETF This fund is a listed as child fund of First Trust Advisors Lp and if that institution has disclosed ownership in this security, then these positions will not be double counted when calculating total shares and total value | 0 | -100,00 | 0 | -100,00 | ||||
| 2026-02-13 | 13F | Pathstone Holdings, LLC | 3.817 | 3,30 | 386 | 5,77 | ||||
| 2026-02-13 | 13F | Smartleaf Asset Management LLC | 1.563 | 15,18 | 157 | 17,16 | ||||
| 2025-10-21 | 13F | Ninety One UK Ltd | 0 | -100,00 | 0 | |||||
| 2026-01-16 | 13F | Standard Life Aberdeen plc | 17.438 | -66,55 | 1.762 | -65,97 | ||||
| 2025-11-14 | 13F | Peak6 Llc | Put | 0 | -100,00 | 0 | ||||
| 2026-02-09 | 13F | Mmbg Investment Advisors Co. | 43.578 | 0,00 | 4.404 | 2,47 | ||||
| 2025-11-14 | 13F | Peak6 Llc | 0 | -100,00 | 0 | |||||
| 2026-02-12 | 13F | Nuveen, LLC | 3.850.882 | 2,36 | 389.209 | 4,89 | ||||
| 2025-11-12 | 13F | NewSquare Capital LLC | 0 | -100,00 | 0 | -100,00 | ||||
| 2026-02-12 | 13F | CIBC Private Wealth Group, LLC | 526.391 | 2,87 | 53.202 | 5,42 | ||||
| 2026-02-12 | 13F | Dimensional Fund Advisors Lp | 198.075 | -3,91 | 20.018 | -1,55 | ||||
| 2025-11-14 | 13F | Verition Fund Management LLC | 0 | -100,00 | 0 | |||||
| 2026-02-17 | 13F | Fmr Llc | 3.557.873 | 0,03 | 359.594 | 2,51 | ||||
| 2026-01-30 | 13F | Flossbach Von Storch Ag | 20.000 | 0,00 | 2.021 | 2,48 | ||||
| 2026-01-23 | 13F | Farther Finance Advisors, LLC | 884 | 162,31 | 89 | 169,70 | ||||
| 2026-02-17 | 13F | Driehaus Capital Management Llc | 672.848 | 68.005 | ||||||
| 2026-02-10 | 13F | Fielder Capital Group LLC | 3.168 | 0,00 | 320 | 2,56 | ||||
| 2025-09-25 | NP | VMNVX - Vanguard Global Minimum Volatility Fund Admiral Shares | 58.501 | 54,93 | 5.292 | 33,10 | ||||
| 2026-02-17 | 13F | Public Employees Retirement System Of Ohio | 179.751 | 0,00 | 18.167 | 2,48 | ||||
| 2025-09-24 | NP | EMXIX - Ashmore Emerging Markets Equity ex China Fund Institutional Class | 0 | -100,00 | 0 | -100,00 | ||||
| 2025-09-25 | NP | DEXC - Dimensional Emerging Markets ex China Core Equity ETF | 700 | 16,67 | 63 | 0,00 | ||||
| 2026-02-05 | 13F | ANTIPODES PARTNERS Ltd | 962.690 | -15,91 | 97.306 | -13,83 | ||||
| 2026-02-05 | 13F | Gamco Investors, Inc. Et Al | 82.232 | -3,50 | 8.311 | -1,11 | ||||
| 2026-02-13 | 13F | PCM Encore, LLC | 4.562 | 461 | ||||||
| 2026-01-29 | 13F | Sanctuary Advisors, LLC | 11.175 | 27,10 | 1.129 | 30,22 | ||||
| 2025-09-24 | NP | SNTKX - Steward International Enhanced Index Fund Class A | 23.606 | 257,61 | 2.135 | 207,19 | ||||
| 2026-02-17 | 13F | Quantinno Capital Management LP | 14.097 | 32,70 | 1.425 | 36,01 | ||||
| 2026-02-11 | 13F | O'shaughnessy Asset Management, Llc | 15.660 | 4,90 | 1.583 | 7,47 | ||||
| 2026-01-30 | 13F | ABS Direct Equity Fund LLC | 66.060 | -26,80 | 6.677 | -25,00 | ||||
| 2026-01-21 | 13F | Aaron Wealth Advisors LLC | 2.212 | 224 |