Grundlæggende statistik
| Institutionelle ejere | 730 total, 684 long only, 6 short only, 40 long/short - change of -20,20% MRQ |
| Del pris | 136,26 |
| Gennemsnitlig porteføljeallokering | 0.2084 % - change of -52,48% MRQ |
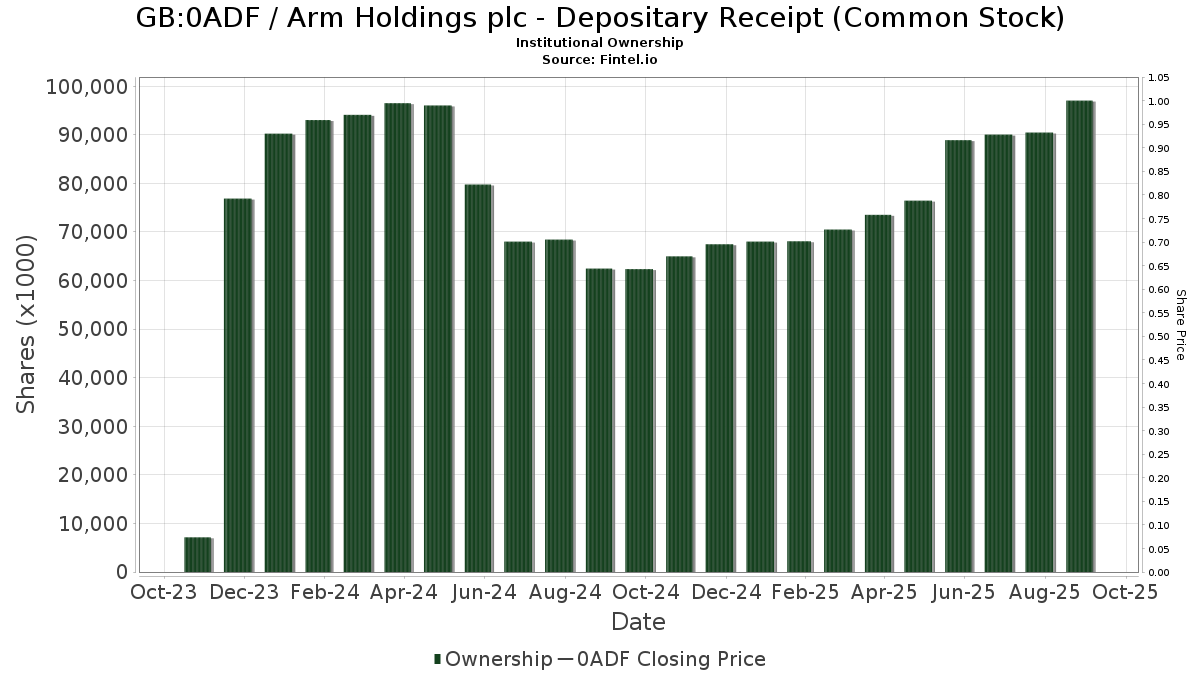
| Institutionelle aktier (lange) | 79.254.799 (ex 13D/G) - change of -7,94MM shares -9,09% MRQ |
| Institutionel værdi (lang) | $ 8.505.136 USD ($1000) |
Institutionelt ejerskab og aktionærer
Arm Holdings plc - Depositary Receipt (Common Stock) (GB:0ADF) har 730 institutionelle ejere og aktionærer, der har indsendt 13D/G- eller 13F-formularer til Securities Exchange Commission (SEC). Disse institutioner har i alt 79,502,108 aktier. Største aktionærer omfatter Susquehanna International Group, Llp, Jane Street Group, Llc, Susquehanna International Group, Llp, Jane Street Group, Llc, Barclays Plc, Goldman Sachs Group Inc, Morgan Stanley, Citadel Advisors Llc, Citadel Advisors Llc, and Peak6 Llc .
Arm Holdings plc - Depositary Receipt (Common Stock) (LSE:0ADF) institutionel ejerskabsstruktur viser aktuelle positioner i virksomheden efter institutioner og fonde, samt seneste ændringer i positionsstørrelse. Større aktionærer kan omfatte individuelle investorer, investeringsforeninger, hedgefonde eller institutioner. Skema 13D angiver, at investoren besidder (eller besidder) mere end 5 % af virksomheden og har til hensigt (eller har til hensigt at) aktivt at forfølge en ændring i forretningsstrategi. Skema 13G indikerer en passiv investering på over 5%.
The share price as of March 20, 2026 is 136,26 / share. Previously, on December 15, 2025, the share price was 125,94 / share. This represents an increase of 8,19% over that period.
Fondens stemningsscore
Fund Sentiment Score (fka Ownership Accumulation Score) finder de aktier, der bliver mest købt af fonde. Det er resultatet af en sofistikeret, multi-faktor kvantitativ model, der identificerer virksomheder med de højeste niveauer af institutionel akkumulering. Scoringsmodellen bruger en kombination af den samlede stigning i oplyste ejere, ændringerne i porteføljeallokeringer i disse ejere og andre målinger. Tallet går fra 0 til 100, hvor højere tal indikerer et højere niveau af akkumulering for sine jævnaldrende, og 50 er gennemsnittet.
Opdateringsfrekvens: Dagligt
Se Ownership Explorer, som giver en liste over højest rangerende virksomheder.
AI+ Ask Fintel’s AI assistant about Arm Holdings plc - Depositary Receipt (Common Stock).
Select a question to share a public post with an AI-crafted answer.
Thinking of good questions…
13F og NPORT arkivering
Detaljer om 13F-arkivering er gratis. Detaljer om NP-ansøgninger kræver et premium-medlemskab. Grønne rækker angiver nye positioner. Røde rækker angiver lukkede positioner. Klik på linket ikon for at se den fulde transaktionshistorik.
Opgrader
for at låse premium-data op og eksportere til Excel ![]() .
.
Important Note
In an effort to reduce load times for our mobile users, we are testing some ways to deliver lighter pages.
In this first test, we will deliver only the most recent 750 transactions (out of 1034 for this stock). If you are interested in loading *all* the transactions for this company, click the "load all" button below. This is just a test and if you don't like it, please let us know by submitting some gentle feedback via the link at the bottom of this page.
Load All| Fil dato | Kilde | Investor | Type | Gennemsnitlig pris (Øst) |
Aktier | Δ Aktier (%) |
Rapporteret Værdi ($1000) |
Δ Værdi (%) |
Port Alloc (%) |
|
|---|---|---|---|---|---|---|---|---|---|---|
| 2026-02-17 | 13F | Credit Agricole S A | 71.951 | 1,18 | 7.865 | -21,84 | ||||
| 2026-02-17 | 13F | Credit Agricole S A | Put | 445.000 | 229,63 | 48.643 | 154,66 | |||
| 2026-02-19 | 13F | CI Private Wealth, LLC | 7.119 | -22,68 | 778 | -40,25 | ||||
| 2026-02-13 | 13F | Y-Intercept (Hong Kong) Ltd | 82.778 | 798,49 | 9.048 | 594,40 | ||||
| 2026-02-17 | 13F | Capital Fund Management S.a. | Put | 954.600 | 3,69 | 104.347 | -19,89 | |||
| 2026-02-17 | 13F | Gladstone Capital Management LLP | 1.000 | 0,00 | 109 | -22,70 | ||||
| 2026-02-17 | 13F | Capital Fund Management S.a. | Call | 465.200 | 25,05 | 50.851 | -3,39 | |||
| 2025-11-13 | 13F | Eisler Capital Management Ltd. | 6.399 | 46,20 | 896 | 26,59 | ||||
| 2025-11-13 | 13F | Eisler Capital Management Ltd. | Put | 31.300 | 0,00 | 4.382 | -13,42 | |||
| 2026-02-02 | 13F | Oppenheimer Asset Management Inc. | 0 | -100,00 | 0 | |||||
| 2026-02-13 | 13F | Headlands Technologies LLC | 8.734 | 955 | ||||||
| 2026-02-13 | 13F | Baird Financial Group, Inc. | 4.125 | 4,48 | 451 | -19,35 | ||||
| 2026-01-22 | 13F | Financial Consulate, Inc | 320 | 0,00 | 35 | -24,44 | ||||
| 2026-02-11 | 13F | Jpmorgan Chase & Co | 979.737 | -12,07 | 107.095 | -32,07 | ||||
| 2026-01-14 | 13F | Nepsis, Inc. | 0 | -100,00 | 0 | |||||
| 2026-01-15 | 13F | Royal Fund Management, LLC | 14.850 | -65,51 | 1.623 | -73,36 | ||||
| 2026-02-17 | 13F | Ancora Advisors, LLC | 726 | 1,26 | 79 | -21,78 | ||||
| 2026-01-15 | 13F | Krs Capital Management, Llc | 0 | -100,00 | 0 | |||||
| 2026-02-13 | 13F | Broadleaf Partners, LLC | 39.809 | -44,18 | 4.352 | -56,88 | ||||
| 2026-01-16 | 13F | Louisiana State Employees Retirement System | 9.300 | -7,00 | 1.017 | -28,15 | ||||
| 2026-02-13 | 13F | Stifel Financial Corp | 61.941 | 23,49 | 6.771 | -4,61 | ||||
| 2026-02-17 | 13F | Cresset Asset Management, LLC | 6.427 | -45,84 | 703 | -58,16 | ||||
| 2026-01-30 | 13F | Mizuho Securities Co. Ltd. | 0 | -100,00 | 0 | |||||
| 2026-02-17 | 13F | Jones Financial Companies Lllp | 63.333 | 9,26 | 6.923 | -14,47 | ||||
| 2026-02-17 | 13F | Silvercrest Asset Management Group Llc | 0 | -100,00 | 0 | |||||
| 2025-11-14 | 13F | Main Management ETF Advisors, LLC | 0 | -100,00 | 0 | |||||
| 2026-02-17 | 13F | Susquehanna International Group, Llp | 1.880.816 | 750,84 | 205.592 | 557,34 | ||||
| 2026-02-17 | 13F | Susquehanna International Group, Llp | Put | 8.119.300 | 18,45 | 887.521 | -8,49 | |||
| 2026-01-29 | 13F | Renaissance Capital LLC | 69.843 | -32,90 | 7.635 | -48,16 | ||||
| 2026-02-20 | 13F | Sunbelt Securities, Inc. | 4.495 | 0,00 | 491 | -22,68 | ||||
| 2026-02-17 | 13F | Susquehanna International Group, Llp | Call | 6.743.800 | 9,88 | 737.165 | -15,11 | |||
| 2026-02-13 | 13F | Bridgefront Capital, LLC | 10.125 | 1.107 | ||||||
| 2025-11-06 | 13F | CloudAlpha Capital Management Limited/Hong Kong | Call | 0 | -100,00 | 0 | ||||
| 2026-02-13 | 13F | Pathstone Holdings, LLC | 2.422 | 28,49 | 265 | -0,75 | ||||
| 2026-01-26 | 13F | Chicago Capital, LLC | 17.050 | -12,16 | 1.864 | -32,16 | ||||
| 2025-11-06 | 13F | CloudAlpha Capital Management Limited/Hong Kong | 0 | -100,00 | 0 | |||||
| 2026-02-17 | 13F | Two Sigma Advisers, Lp | 712.100 | 361,20 | 77.840 | 256,31 | ||||
| 2026-02-13 | 13F | Healthcare Of Ontario Pension Plan Trust Fund | 317.369 | 0,99 | 34.692 | -21,98 | ||||
| 2026-01-29 | 13F | Nbc Securities, Inc. | 200 | 22 | ||||||
| 2026-02-13 | 13F | American Century Companies Inc | 544.498 | -4,52 | 59.520 | -26,24 | ||||
| 2025-09-26 | NP | USGLX - U.S. Global Leaders Growth Fund Class A | 269.231 | -28,48 | 38.063 | -11,34 | ||||
| 2026-02-10 | 13F | Mitsubishi UFJ Morgan Stanley Securities Co., Ltd. | 8.740 | 955 | ||||||
| 2025-10-07 | 13F/A | MUFG Securities EMEA plc | 0 | -100,00 | 0 | -100,00 | ||||
| 2026-01-09 | 13F | Diversified Trust Co | 0 | -100,00 | 0 | |||||
| 2026-02-06 | 13F | Vestmark Advisory Solutions, Inc. | 14.534 | 327,72 | 1.589 | 230,83 | ||||
| 2026-02-05 | 13F | Pinnacle Associates Ltd | 32.882 | -1,25 | 3.594 | -23,71 | ||||
| 2026-01-30 | 13F | Laurel Wealth Advisors LLC | 90 | 10 | ||||||
| 2025-10-24 | 13F | TFC Financial Management | 0 | -100,00 | 0 | |||||
| 2026-02-13 | 13F | Cladis Investment Advisory, LLC | 2.000 | -33,33 | 219 | -48,58 | ||||
| 2026-03-09 | 13F | EMC Capital Management | 3.250 | -16,67 | 0 | |||||
| 2025-09-24 | NP | SNTKX - Steward International Enhanced Index Fund Class A | 2.153 | -50,37 | 304 | -38,46 | ||||
| 2026-02-19 | 13F | Mcguire Capital Advisors Inc | 273 | 30 | ||||||
| 2026-02-13 | 13F | Schroder Investment Management Group | 1.891.310 | 10,97 | 206.739 | -14,26 | ||||
| 2026-02-10 | 13F | Axq Capital, Lp | 3.309 | 362 | ||||||
| 2026-02-10 | 13F | Godfrey Financial Associates, Inc. | 15 | 2 | ||||||
| 2026-02-11 | 13F | Fox Run Management, L.l.c. | 6.377 | 202,08 | 697 | 133,89 | ||||
| 2026-03-12 | 13F | Nalls Sherbakoff Group, Llc | 0 | -100,00 | 0 | |||||
| 2026-01-21 | 13F | TigerOak Management, L.L.C. | 0 | -100,00 | 0 | |||||
| 2026-01-26 | 13F | Slow Capital, Inc. | 26.624 | 8,27 | 2.910 | -16,36 | ||||
| 2026-02-17 | 13F | Point72 Asset Management, L.P. | Call | 411.800 | 749,07 | 45.014 | 555,97 | |||
| 2026-02-11 | 13F | Buckingham Strategic Partners | 2.775 | 303 | ||||||
| 2026-02-17 | 13F | Point72 Asset Management, L.P. | Put | 283.100 | 474,24 | 30.946 | 343,66 | |||
| 2026-01-21 | 13F | Flagship Harbor Advisors, Llc | 206 | 23 | ||||||
| 2026-02-13 | 13F | Taproot Management LP | 9.836 | 1.075 | ||||||
| 2026-01-26 | 13F | AE Wealth Management LLC | 2.246 | 246 | ||||||
| 2026-02-06 | 13F | Midwest Professional Planners, LTD. | 14.733 | 6,41 | 1.610 | -17,77 | ||||
| 2026-02-05 | 13F | iA Global Asset Management Inc. | 17.191 | 8,71 | 2 | -50,00 | ||||
| 2025-11-12 | 13F | FineMark National Bank & Trust | 0 | -100,00 | 0 | |||||
| 2026-03-04 | 13F | SHP Wealth Management | 630 | 69 | ||||||
| 2025-10-16 | 13F | Carnegie Capital Asset Management, LLC | 0 | -100,00 | 0 | |||||
| 2026-01-23 | 13F | Stanley-Laman Group, Ltd. | 43.416 | -1,22 | 4.746 | -23,69 | ||||
| 2026-02-11 | 13F | Krane Funds Advisors LLC | 4.451 | -10,80 | 487 | -41,38 | ||||
| 2025-09-26 | NP | PDAVX - PineBridge Dynamic Asset Allocation Fund Investor Servicing Shares | 594 | -21,22 | 84 | -2,35 | ||||
| 2026-02-13 | 13F | Greenline Wealth Management LLC | 512 | 56 | ||||||
| 2026-02-17 | 13F | Integrated Advisors Network LLC | 2.683 | 54,02 | 293 | 19,11 | ||||
| 2026-02-13 | 13F | Integrated Wealth Concepts LLC | 6.546 | -52,26 | 716 | -63,14 | ||||
| 2025-09-29 | NP | QTR - Global X NASDAQ 100 Tail Risk ETF This fund is a listed as child fund of Mirae Asset Global Investments Co., Ltd. and if that institution has disclosed ownership in this security, then these positions will not be double counted when calculating total shares and total value | 21 | 0,00 | 3 | 0,00 | ||||
| 2026-02-13 | 13F | Corps Capital Advisors, LLC | 9.580 | 36,86 | 1.047 | 5,76 | ||||
| 2025-11-14 | 13F/A | Elliott Investment Management L.P. | 0 | -100,00 | 0 | |||||
| 2026-02-11 | 13F | Argonautica Private Wealth Management, Inc | 3.733 | 29,08 | 408 | -0,24 | ||||
| 2026-02-13 | 13F | NLB Skladi, upravljanje premozenja, d.o.o. | 10.910 | 1.193 | ||||||
| 2026-01-14 | 13F | Barnes Dennig Private Wealth Management LLC | 39 | 0,00 | 4 | -20,00 | ||||
| 2026-01-27 | 13F | Belpointe Asset Management LLC | 2.440 | -2,94 | 267 | -25,07 | ||||
| 2026-02-17 | 13F | Creative Planning | 61.224 | 4,02 | 6.694 | -19,61 | ||||
| 2025-09-24 | NP | ESGEX - Reynders, McVeigh Core Equity Fund Institutional Shares | 6.500 | 0,00 | 919 | 23,89 | ||||
| 2025-10-27 | 13F | Belvedere Trading LLC | 0 | -100,00 | 0 | |||||
| 2026-02-17 | 13F | Manchester Global Management (UK) Ltd | 0 | -100,00 | 0 | |||||
| 2026-02-17 | 13F | Private Advisor Group, LLC | 8.739 | 4,52 | 955 | -19,27 | ||||
| 2026-02-12 | 13F | Leigh Baldwin & Co., Llc | 0 | -100,00 | 0 | |||||
| 2026-02-13 | 13F/A | Alberta Investment Management Corp | 0 | -100,00 | 0 | |||||
| 2026-02-10 | 13F | Envestnet Asset Management Inc | 47.987 | -43,62 | 5.245 | -56,44 | ||||
| 2026-02-17 | 13F | Clear Street Markets Llc | 211 | 23 | ||||||
| 2026-02-17 | 13F | IHT Wealth Management, LLC | 4.025 | 23,01 | 443 | -4,73 | ||||
| 2026-02-12 | 13F | Long Corridor Asset Management Ltd | 0 | -100,00 | 0 | |||||
| 2026-02-06 | 13F | Tensor Edge Capital, LLC | Call | 833.400 | 91.099 | |||||
| 2025-09-25 | NP | ITHAX - THE HARTFORD CAPITAL APPRECIATION FUND Class A | 89.213 | 9,77 | 12.612 | 36,07 | ||||
| 2026-02-04 | 13F | GGM Financials LLC | 150 | 16 | ||||||
| 2026-02-17 | 13F/A | United Capital Management of KS, Inc. | 104.361 | 3,47 | 11.408 | -20,07 | ||||
| 2026-02-13 | 13F | Bridgewater Associates, LP | 326.320 | 35.670 | ||||||
| 2026-02-10 | 13F | Lido Advisors, LLC | 12.647 | 345,79 | 1.462 | 264,34 | ||||
| 2026-02-13 | 13F | Wilmar Advisors LLC | 3.000 | 328 | ||||||
| 2026-02-10 | 13F | Lido Advisors, LLC | Call | 100 | 0,00 | 11 | -28,57 | |||
| 2026-01-27 | 13F | ZEGA Investments, LLC | 0 | -100,00 | 0 | -100,00 | ||||
| 2026-02-17 | 13F | Alliancebernstein L.p. | 25.128 | -60,02 | 2.747 | -69,12 | ||||
| 2026-02-02 | 13F | Advisors Preferred, LLC | 4.101 | 471 | ||||||
| 2026-02-02 | 13F | Truist Financial Corp | 0 | -100,00 | 0 | |||||
| 2025-09-26 | NP | HAOSX - Harbor Overseas Fund Institutional Class | 16.102 | 217,78 | 2.276 | 181,68 | ||||
| 2026-01-23 | 13F | Steigerwald, Gordon & Koch Inc. | 100 | 0,00 | 11 | -28,57 | ||||
| 2026-01-08 | 13F | Wealth Enhancement Advisory Services, Llc | 9.596 | -8,00 | 1.109 | -33,33 | ||||
| 2025-11-12 | 13F | Claro Advisors LLC | 0 | -100,00 | 0 | -100,00 | ||||
| 2026-02-03 | 13F | Asset Planning,Inc | 100 | 0,00 | 11 | -28,57 | ||||
| 2026-02-12 | 13F | Intesa Sanpaolo Wealth Management | 480 | 52 | ||||||
| 2026-02-11 | 13F | Group One Trading, L.p. | 44.562 | 33,04 | 4.871 | 2,79 | ||||
| 2026-01-15 | 13F | Zevenbergen Capital Investments Llc | 55.690 | -88,86 | 6.087 | -91,39 | ||||
| 2026-02-10 | 13F | Sustainable Growth Advisers, LP | 2.668.130 | -7,41 | 291.653 | -28,47 | ||||
| 2026-02-13 | 13F | Kestra Advisory Services, LLC | 0 | -100,00 | 0 | |||||
| 2026-02-04 | 13F | Nwam Llc | 1.817 | -8,42 | 207 | -37,95 | ||||
| 2025-11-14 | 13F | Fortress Investment Group LLC | 0 | -100,00 | 0 | |||||
| 2025-11-07 | 13F | Atticus Wealth Management, Llc | 0 | -100,00 | 0 | |||||
| 2026-01-26 | 13F | Key Capital Management, INC | 3 | 0 | ||||||
| 2026-01-06 | 13F | Ransom Advisory, Ltd | 670 | 0,00 | 73 | -22,34 | ||||
| 2026-02-13 | 13F | SRS Capital Advisors, Inc. | 382 | 13,02 | 42 | -12,77 | ||||
| 2026-02-13 | 13F | Pine Valley Investments Ltd Liability Co | 10.960 | 30,04 | 1.198 | 0,50 | ||||
| 2026-02-18 | 13F | Caitlin John, LLC | 10 | 0,00 | 1 | 0,00 | ||||
| 2026-01-30 | 13F | Rachor Investment Advisory Services, LLC | 56 | 6 | ||||||
| 2026-02-12 | 13F | Renaissance Technologies Llc | 473.600 | -4,40 | 51.769 | -26,14 | ||||
| 2026-02-14 | 13F | Rockefeller Capital Management L.P. | 26.745 | 0,65 | 2.923 | -22,24 | ||||
| 2026-02-13 | 13F | Rhumbline Advisers | 553 | 2,98 | 60 | -20,00 | ||||
| 2026-01-08 | 13F | Versant Capital Management, Inc | 51 | 0,00 | 6 | -28,57 | ||||
| 2026-02-12 | 13F | APG Asset Management N.V. | 68.753 | -9,42 | 6.399 | -29,98 | ||||
| 2025-11-13 | 13F | Bulltick Wealth Management, LLC | 0 | -100,00 | 0 | -100,00 | ||||
| 2026-01-28 | 13F | HB Wealth Management, LLC | 0 | -100,00 | 0 | |||||
| 2026-01-26 | 13F | United Advisor Group, LLC | 2.933 | -1,54 | 321 | -23,99 | ||||
| 2026-02-17 | 13F/A | Kovack Advisors, Inc. | 5.780 | 60,47 | 632 | 23,97 | ||||
| 2026-01-07 | 13F | Aventura Private Wealth, LLC | 1.161 | -0,60 | 127 | -23,64 | ||||
| 2025-09-26 | NP | RTNAX - Tax-Managed International Equity Fund Class A | 7.632 | 0,00 | 1.079 | 23,91 | ||||
| 2026-02-02 | 13F | Oppenheimer & Co Inc | 0 | -100,00 | 0 | |||||
| 2026-02-05 | 13F | Navalign, LLC | 300 | 33 | ||||||
| 2026-02-13 | 13F | Walleye Capital LLC | 33.070 | -5,90 | 3.615 | -27,31 | ||||
| 2026-02-13 | 13F | Walleye Capital LLC | Call | 21.600 | -75,97 | 2.361 | -81,44 | |||
| 2026-02-10 | 13F | Td Asset Management Inc | 123.764 | -11,62 | 13.529 | -31,73 | ||||
| 2025-09-26 | NP | SUNAMERICA SERIES TRUST - SA Schroders VCP Global Allocation Portfolio Class 3 | 3.354 | -22,49 | 474 | -3,85 | ||||
| 2026-02-12 | 13F | Wedbush Securities Inc | 4.066 | -12,31 | 0 | |||||
| 2026-02-17 | 13F | Limestone Investment Advisors LP | Put | 1.300 | 142 | |||||
| 2026-02-12 | 13F | Rossby Financial, LCC | 10 | 0,00 | 1 | 0,00 | ||||
| 2025-09-29 | NP | QYLG - Global X Nasdaq 100 Covered Call & Growth ETF This fund is a listed as child fund of Mirae Asset Global Investments Co., Ltd. and if that institution has disclosed ownership in this security, then these positions will not be double counted when calculating total shares and total value | 814 | -5,35 | 115 | 17,35 | ||||
| 2026-02-06 | 13F | Lazard Freres Gestion S.A.S. | 13.000 | -23,53 | 1 | -50,00 | ||||
| 2026-02-13 | 13F | Centiva Capital, LP | Put | 688.300 | 46,07 | 75.238 | 12,85 | |||
| 2026-02-13 | 13F | Walleye Capital LLC | Put | 55.400 | -26,43 | 6.056 | -43,17 | |||
| 2026-02-13 | 13F | Centiva Capital, LP | Call | 211.700 | 2.685,53 | 23.141 | 2.052,56 | |||
| 2026-02-13 | 13F | Centiva Capital, LP | 10.802 | -90,20 | 1.181 | -92,43 | ||||
| 2025-11-12 | 13F | Warm Springs Advisors Inc. | 0 | -100,00 | 0 | |||||
| 2025-11-06 | 13F | Blume Capital Management, Inc. | 0 | -100,00 | 0 | |||||
| 2025-10-07 | 13F | Sonora Investment Management Group, LLC | 4.628 | -0,15 | 655 | -12,68 | ||||
| 2026-02-10 | 13F/A | Northwestern Mutual Wealth Management Co | 72.331 | 17,83 | 7.907 | -8,97 | ||||
| 2026-02-11 | 13F | Ing Groep Nv | 0 | -100,00 | 0 | |||||
| 2026-01-07 | 13F | Retirement Wealth Solutions LLC | 5 | 400,00 | 1 | |||||
| 2025-09-25 | NP | HFGO - Hartford Large Cap Growth ETF | 7.559 | 0,40 | 1.069 | 24,48 | ||||
| 2026-02-17 | 13F | Price T Rowe Associates Inc /md/ | 477.040 | -8,86 | 52 | -29,73 | ||||
| 2026-01-08 | 13F | Sanders Morris Harris Llc | 3.667 | 51,72 | 404 | 18,48 | ||||
| 2025-11-07 | 13F | Wulff, Hansen & Co. | 0 | -100,00 | 0 | -100,00 | ||||
| 2026-02-13 | 13F | Morgan Stanley | 3.783.006 | 1,21 | 413.521 | -21,81 | ||||
| 2026-02-13 | 13F | Public Sector Pension Investment Board | Put | 0 | -100,00 | 0 | ||||
| 2026-02-17 | 13F | Altshuler Shaham Ltd | 153.103 | 166.316,30 | 16.736 | 128.630,77 | ||||
| 2026-02-13 | 13F | Victory Capital Management Inc | 62.268 | 5,01 | 6.807 | -18,87 | ||||
| 2026-02-17 | 13F | SageView Advisory Group, LLC | 532 | 58 | ||||||
| 2025-09-29 | NP | POGRX - PRIMECAP Odyssey Growth Fund | 21.680 | -3,39 | 3.065 | 19,77 | ||||
| 2025-11-14 | 13F | PineBridge Investments, L.P. | 27.937 | -36,06 | 3.953 | -44,07 | ||||
| 2026-01-14 | 13F | Nova Wealth Management, Inc. | 200 | 0,00 | 22 | -25,00 | ||||
| 2025-09-29 | NP | SPWO - SP Funds S&P World (ex-US) ETF | 557 | 32,62 | 79 | 65,96 | ||||
| 2026-02-11 | 13F | Capital International Ltd /ca/ | 26.804 | 5,22 | 2.930 | -18,73 | ||||
| 2026-02-17 | 13F | Limestone Investment Advisors LP | 850 | 93 | ||||||
| 2026-02-03 | 13F | RFG Advisory, LLC | 7.030 | -9,64 | 768 | -30,18 | ||||
| 2026-02-17 | 13F | Fmr Llc | 1.730.574 | 15,60 | 189.169 | -10,69 | ||||
| 2026-02-03 | 13F | Farmers & Merchants Investments Inc | 100 | 0,00 | 11 | -28,57 | ||||
| 2026-02-17 | 13F | Nvidia Corp | 0 | -100,00 | 0 | -100,00 | ||||
| 2026-01-26 | 13F | Private Trust Co Na | 35 | -96,84 | 4 | -98,08 | ||||
| 2026-02-06 | 13F | Pnc Financial Services Group, Inc. | 11.742 | 11,72 | 1.284 | -13,72 | ||||
| 2026-01-20 | 13F | SOA Wealth Advisors, LLC. | 505 | 0,00 | 55 | -22,54 | ||||
| 2026-02-17 | 13F | GAM Holding AG | 0 | -100,00 | 0 | |||||
| 2026-02-17 | 13F | Blair William & Co/il | 12.996 | -6,31 | 1.421 | -27,62 | ||||
| 2025-09-23 | NP | KLGAX - MainStay MacKay Growth Fund Class A | 21.542 | 9,50 | 3.046 | 35,76 | ||||
| 2025-11-14 | 13F | Bank Of Nova Scotia | 0 | -100,00 | 0 | |||||
| 2026-02-09 | 13F | Hantz Financial Services, Inc. | 1.756 | 16,29 | 0 | |||||
| 2025-11-04 | 13F | Transcend Wealth Collective, Llc | 0 | -100,00 | 0 | -100,00 | ||||
| 2026-01-30 | 13F | Strategic Blueprint, LLC | 4.700 | -0,68 | 514 | -23,32 | ||||
| 2026-02-17 | 13F | Defiance ETFs, LLC | 354.147 | 39.261 | ||||||
| 2026-02-09 | 13F | Avalon Trust Co | 200 | 0,00 | 22 | -25,00 | ||||
| 2026-02-13 | 13F | Sofos Investments, Inc. | 26.539 | 8,62 | 2.901 | -16,11 | ||||
| 2026-01-29 | 13F | Inscription Capital, LLC | 1.943 | -42,70 | 212 | -55,74 | ||||
| 2026-02-02 | 13F | Cornerstone Planning Group LLC | 134 | -0,74 | 15 | -36,36 | ||||
| 2025-11-14 | 13F | Point72 Italy, S.r.l. | 0 | -100,00 | 0 | |||||
| 2026-02-02 | 13F | Robertson Stephens Wealth Management, LLC | 9.175 | 113,37 | 1.003 | 64,80 | ||||
| 2025-11-13 | 13F | GeoWealth Management, LLC | 0 | -100,00 | 0 | |||||
| 2025-11-10 | 13F | Greenland Capital Management LP | Put | 0 | -100,00 | 0 | -100,00 | |||
| 2026-02-13 | 13F | Lansdowne Partners (uk) Llp | 472.076 | 687,12 | 51.603 | 508,16 | ||||
| 2025-11-14 | 13F | AXA Investment Managers S.A. | 89.548 | 12.670 | ||||||
| 2026-02-13 | 13F | Motiv8 Investments LLC | 346 | 0 | ||||||
| 2026-02-17 | 13F | Cantor Fitzgerald, L. P. | 85.432 | 11,01 | 9.339 | -14,24 | ||||
| 2026-01-15 | 13F | Royal Fund Management, LLC | Put | 0 | -100,00 | 0 | -100,00 | |||
| 2026-02-17 | 13F | Quantessence Capital LLC | 0 | -100,00 | 0 | |||||
| 2026-02-12 | 13F | Longitude (Cayman) Ltd. | Call | 60.000 | 6.559 | |||||
| 2026-02-17 | 13F | Schonfeld Strategic Advisors LLC | 0 | -100,00 | 0 | -100,00 | ||||
| 2026-02-17 | 13F | FIL Ltd | 4.619 | 505 | ||||||
| 2026-02-06 | 13F | Tanglewood Legacy Advisors, LLC | 50 | 0,00 | 5 | -28,57 | ||||
| 2026-02-10 | 13F | Hazlett, Burt & Watson, Inc. | 0 | -100,00 | 0 | |||||
| 2026-02-17 | 13F | Russell Investments Group, Ltd. | 7.772 | -66,90 | 850 | -74,44 | ||||
| 2026-02-11 | 13F | Manchester Capital Management LLC | 0 | -100,00 | 0 | -100,00 | ||||
| 2026-02-12 | 13F | Longitude (Cayman) Ltd. | 0 | -100,00 | 0 | |||||
| 2026-02-18 | 13F | Guardian Capital Lp | 19.906 | -1,38 | 2.176 | -23,82 | ||||
| 2026-01-09 | 13F | IFS Advisors, LLC | 15 | 0,00 | 2 | -50,00 | ||||
| 2026-02-03 | 13F | Generali Asset Management SPA SGR | 0 | -100,00 | 0 | |||||
| 2026-02-10 | 13F | COFG Advisors, LLC | 9.457 | 1.034 | ||||||
| 2026-01-15 | 13F | Royal Fund Management, LLC | Call | 0 | -100,00 | 0 | -100,00 | |||
| 2026-02-13 | 13F | Van Eck Associates Corp | 50.381 | 30,56 | 6 | 0,00 | ||||
| 2025-11-14 | 13F | 1832 Asset Management L.P. | 0 | -100,00 | 0 | |||||
| 2026-02-10 | 13F | Murphy & Mullick Capital Management Corp | 1.071 | 15,66 | 117 | -12,69 | ||||
| 2026-02-17 | 13F | Shelton Capital Management | 14.889 | 0,00 | 1.628 | -22,74 | ||||
| 2026-02-12 | 13F | New York State Common Retirement Fund | 40.087 | 4.382 | ||||||
| 2025-10-24 | 13F | Forum Financial Management, LP | 0 | -100,00 | 0 | |||||
| 2026-01-12 | 13F | Schaper Benz & Wise Investment Counsel Inc/wi | 32.624 | 252,20 | 3.566 | 172,21 | ||||
| 2026-01-26 | 13F | PayPay Securities Corp | 72 | 1,41 | 8 | -30,00 | ||||
| 2026-02-10 | 13F | Bnp Paribas Arbitrage, Sa | 585.505 | -33,18 | 64.002 | -48,38 | ||||
| 2026-02-12 | 13F | Mount Yale Investment Advisors, LLC | 12.414 | 259,10 | 1.357 | 177,30 | ||||
| 2026-02-13 | 13F | Peak6 Llc | Call | 2.098.600 | 35,64 | 229.398 | 4,79 | |||
| 2026-02-13 | 13F | Sterling Capital Management LLC | 25 | 3 | ||||||
| 2026-01-12 | 13F | Abound Wealth Management | 194 | 0,00 | 21 | -22,22 | ||||
| 2026-02-10 | 13F | Bnp Paribas Arbitrage, Sa | Put | 1.829 | 282,64 | 19.993 | 195,61 | |||
| 2026-02-12 | 13F | Hollencrest Capital Management | 0 | -100,00 | 0 | |||||
| 2026-02-10 | 13F | Bnp Paribas Arbitrage, Sa | Call | 2.239 | -9,61 | 24.475 | -30,17 | |||
| 2026-02-03 | 13F | Washington Trust Advisors, Inc. | 0 | -100,00 | 0 | |||||
| 2026-02-17 | 13F | Schonfeld Strategic Advisors LLC | Put | 0 | -100,00 | 0 | -100,00 | |||
| 2026-02-06 | 13F | Americana Partners, LLC | 4.011 | -45,44 | 438 | -57,88 | ||||
| 2026-01-21 | 13F | Newbridge Financial Services Group, Inc. | 90.145 | 54,00 | 9.854 | 18,97 | ||||
| 2026-02-09 | 13F | Atlantic Trust, LLC | 35 | 0,00 | 4 | -25,00 | ||||
| 2026-02-17 | 13F | Optiver Holding B.V. | 115.585 | 12.635 | ||||||
| 2025-09-24 | NP | AACRX - Strategic Allocation: Conservative Fund R Class This fund is a listed as child fund of American Century Companies Inc and if that institution has disclosed ownership in this security, then these positions will not be double counted when calculating total shares and total value | 174 | 0,00 | 25 | 26,32 | ||||
| 2026-02-13 | 13F | Wbi Investments, Inc. | 5.222 | 70,32 | 571 | 31,64 | ||||
| 2025-11-14 | 13F | Driehaus Capital Management Llc | 0 | -100,00 | 0 | |||||
| 2026-01-13 | 13F | Stephens Consulting, LLC | 4 | 0,00 | 0 | |||||
| 2026-02-13 | 13F | Peak6 Llc | Put | 3.038.000 | 34,57 | 332.084 | 3,96 | |||
| 2026-02-13 | 13F | Peak6 Llc | 301.275 | 38,79 | 32.932 | 7,23 | ||||
| 2026-02-13 | 13F | Alerus Financial Na | 20.274 | 29,65 | 2.216 | 0,18 | ||||
| 2026-02-17 | 13F | Cape Investment Advisory, Inc. | 28 | 3 | ||||||
| 2026-02-17 | 13F | Nwi Management Lp | 206.730 | -8,12 | 23 | -29,03 | ||||
| 2026-01-16 | 13F | FNY Investment Advisers, LLC | 0 | -100,00 | 0 | |||||
| 2025-10-23 | 13F | Vermillion Wealth Management, Inc. | 0 | -100,00 | 0 | |||||
| 2025-09-25 | NP | HFIGX - Hartford Schroders Diversified Growth Fund Class I | 833 | 27,37 | 118 | 58,11 | ||||
| 2026-02-12 | 13F | Cibc World Markets Corp | 6.721 | -29,48 | 735 | -52,37 | ||||
| 2025-10-17 | 13F | Sowell Financial Services LLC | 0 | -100,00 | 0 | |||||
| 2026-01-30 | 13F | Jennison Associates Llc | 2.253 | -32,85 | 246 | -48,10 | ||||
| 2026-02-17 | 13F | Nissay Asset Management Corp /japan/ /adv | 59.929 | 13,52 | 6.551 | -12,30 | ||||
| 2026-02-17 | 13F | High Falls Advisors, Inc | 5.400 | 0,00 | 590 | -22,77 | ||||
| 2026-02-05 | 13F | Everstar Asset Management, LLC | 22.000 | 588 | ||||||
| 2026-02-04 | 13F | Tsfg, Llc | 771 | -4,46 | 0 | |||||
| 2026-01-13 | 13F | Signal Advisors Wealth, LLC | 2.645 | -32,18 | 289 | -47,55 | ||||
| 2026-02-13 | 13F | Verition Fund Management LLC | Put | 6.600 | 0,00 | 721 | -22,72 | |||
| 2026-02-13 | 13F | Verition Fund Management LLC | 8.068 | -50,80 | 882 | -62,03 | ||||
| 2026-02-17 | 13F | Equitable Holdings, Inc. | 19.105 | 4,47 | 2.088 | -19,29 | ||||
| 2025-10-14 | 13F | JBR Co Financial Management Inc | 0 | -100,00 | 0 | |||||
| 2026-02-05 | 13F | Cambridge Investment Research Advisors, Inc. | 51.206 | -31,06 | 6 | -50,00 | ||||
| 2026-02-12 | 13F | Ankerstar Wealth, LLC | 181 | 20 | ||||||
| 2026-02-11 | 13F | Convergence Financial, LLC | 6.967 | -7,70 | 762 | -28,68 | ||||
| 2026-02-17 | 13F | Mark Asset Management Lp | 283.817 | -4,80 | 31.024 | -26,45 | ||||
| 2026-02-17 | 13F | PharVision Advisers, LLC | 2.261 | 247 | ||||||
| 2025-10-28 | 13F | BRYN MAWR TRUST Co | 210 | -82,74 | 30 | -85,20 | ||||
| 2025-12-29 | 13F/A | Triumph Capital Management | 0 | -100,00 | 0 | |||||
| 2026-01-12 | 13F | Seacrest Wealth Management, Llc | 0 | -100,00 | 0 | |||||
| 2026-01-29 | 13F | Veracity Capital LLC | 4.459 | 2,65 | 487 | -20,68 | ||||
| 2026-02-13 | 13F | First Trust Advisors Lp | 950.013 | 46,09 | 103.846 | 12,86 | ||||
| 2026-02-09 | 13F | Hartland & Co., LLC | 1.430 | -5,05 | 156 | -26,76 | ||||
| 2026-02-11 | 13F | LPL Financial LLC | 267.730 | -9,87 | 29.266 | -30,37 | ||||
| 2026-02-11 | 13F | LPL Financial LLC | Put | 7.000 | 133,33 | 765 | 80,42 | |||
| 2026-01-16 | 13F | Balboa Wealth Partners | 2.908 | -6,44 | 318 | -27,79 | ||||
| 2026-01-22 | 13F | Venturi Wealth Management, LLC | 0 | -100,00 | 0 | |||||
| 2026-02-13 | 13F | Pin Oak Investment Advisors Inc | 10 | 0,00 | 0 | -100,00 | ||||
| 2026-02-11 | 13F | Investors Towarzystwo Funduszy Inwestycyjnych Spolka Akcyjna | 15.155 | 1.657 | ||||||
| 2026-01-07 | 13F | Gilbert & Cook, Inc. | 4.855 | -0,25 | 531 | -22,97 | ||||
| 2026-02-13 | 13F | Brown Advisory Inc | 0 | -100,00 | 0 | |||||
| 2026-02-12 | 13F | Penserra Capital Management LLC | 354.147 | 30,73 | 39 | 0,00 | ||||
| 2026-02-11 | 13F | Deutsche Bank Ag\ | 245.094 | 538,81 | 26.791 | 393,57 | ||||
| 2026-02-12 | 13F | Wealthspire Advisors, LLC | 0 | -100,00 | 0 | |||||
| 2026-02-11 | 13F | Gordian Capital Singapore Pte Ltd | 37 | 0,00 | 4 | -20,00 | ||||
| 2025-09-26 | NP | RETSX - Tax-Managed U.S. Large Cap Fund Class S | 15.687 | -87,65 | 2.218 | -84,69 | ||||
| 2026-02-11 | 13F | Strategic Advocates LLC | 82 | 110,26 | 9 | 80,00 | ||||
| 2026-01-27 | 13F | Gf Fund Management Co. Ltd. | 29.183 | 9,53 | 3.190 | -15,39 | ||||
| 2025-11-03 | 13F | Phoenix Holdings Ltd. | 10.000 | 0,00 | 2.060 | 1,98 | ||||
| 2026-01-21 | 13F | Franklin Street Advisors Inc /nc | 125.062 | 17,39 | 13.671 | -9,31 | ||||
| 2026-02-13 | 13F | Arkadios Wealth Advisors | 2.698 | -0,07 | 295 | -23,04 | ||||
| 2026-02-18 | 13F | Strong Retirement Solutions LLC | 2.645 | 289 | ||||||
| 2026-02-27 | 13F | Strategic Investment Solutions, Inc. /IL | 627 | 120,77 | 69 | 518,18 | ||||
| 2026-01-26 | 13F | Zullo Investment Group, Inc. | 1.975 | -8,48 | 216 | -29,51 | ||||
| 2026-01-27 | 13F | Asset Management One Co., Ltd. | 1.076 | -68,28 | 119 | -75,37 | ||||
| 2026-02-02 | 13F | JDM Financial Group LLC | 34 | 0,00 | 4 | -25,00 | ||||
| 2026-02-12 | 13F | Marsico Capital Management Llc | 0 | -100,00 | 0 | |||||
| 2025-09-24 | NP | AFDIX - Sustainable Equity Fund Investor Class This fund is a listed as child fund of American Century Companies Inc and if that institution has disclosed ownership in this security, then these positions will not be double counted when calculating total shares and total value | 57.364 | -4,31 | 8.110 | 18,62 | ||||
| 2026-02-11 | 13F | Nemes Rush Group LLC | 44 | 0,00 | 5 | -33,33 | ||||
| 2026-02-13 | 13F | Walleye Trading LLC | Put | 2.668.800 | 1,79 | 291.727 | -21,36 | |||
| 2026-01-20 | 13F | Family Legacy Financial Solutions, LLC | 0 | -100,00 | 0 | |||||
| 2026-02-13 | 13F | Walleye Trading LLC | Call | 2.029.600 | -14,20 | 221.856 | -33,71 | |||
| 2026-02-06 | 13F | Abn Amro Investment Solutions | 0 | -100,00 | 0 | |||||
| 2026-02-17 | 13F | Caption Management, LLC | Put | 10.000 | 0,00 | 1.093 | -22,70 | |||
| 2026-02-17 | 13F | Fwl Investment Management, Llc | 125 | 0,00 | 14 | -23,53 | ||||
| 2026-01-22 | 13F | Bfsg, Llc | 700 | 0,00 | 77 | -23,23 | ||||
| 2026-02-10 | 13F | CIBC World Markets Inc. | 181.976 | 17,52 | 19.892 | -9,21 | ||||
| 2026-02-13 | 13F | Walleye Trading LLC | 1.316.179 | 332,92 | 143.872 | 234,46 | ||||
| 2026-02-17 | 13F | Caption Management, LLC | 9.250 | 12,12 | 1.011 | -13,37 | ||||
| 2025-09-26 | NP | TEC - Harbor Transformative Technologies ETF | 386 | -21,38 | 55 | -1,82 | ||||
| 2026-02-06 | 13F/A | Rathbone Brothers plc | 500.043 | 4.638,85 | 54.660 | 3.561,02 | ||||
| 2025-10-21 | 13F | Steel Peak Wealth Management LLC | 0 | -100,00 | 0 | |||||
| 2026-02-11 | 13F | Franklin Resources Inc | 1.461.410 | 0,72 | 159.747 | -20,05 | ||||
| 2026-02-13 | 13F | Change Path, LLC | 1.830 | 4,99 | 200 | -18,70 | ||||
| 2026-02-04 | 13F | Sentry Investment Management Llc | 0 | -100,00 | 0 | |||||
| 2026-02-17 | 13F | WFA of San Diego, LLC | 0 | -100,00 | 0 | |||||
| 2026-02-05 | 13F | Western Wealth Management, LLC | 0 | -100,00 | 0 | |||||
| 2026-01-23 | 13F | Tower View Investment Management & Research LLC | 20.152 | -5,18 | 2.203 | -26,77 | ||||
| 2025-09-25 | NP | PGKAX - PGIM Jennison Technology Fund Class A | 2.704 | -34,46 | 382 | -18,72 | ||||
| 2026-02-12 | 13F | Peterson Wealth Services | 10 | -99,87 | 1 | 0,00 | ||||
| 2026-01-26 | 13F | Merit Financial Group, LLC | 2.226 | 243 | ||||||
| 2025-09-24 | NP | Innovator ETFs Trust - Innovator Hedged Nasdaq-100 ETF | 74 | -13,95 | 10 | 11,11 | ||||
| 2025-11-14 | 13F | Jericho Capital Asset Management L.P. | 0 | -100,00 | 0 | -100,00 | ||||
| 2026-01-29 | 13F | China Universal Asset Management Co., Ltd. | 3.915 | 8,57 | 428 | -16,27 | ||||
| 2025-09-29 | NP | QYLD - Global X NASDAQ 100 Covered Call ETF This fund is a listed as child fund of Mirae Asset Global Investments Co., Ltd. and if that institution has disclosed ownership in this security, then these positions will not be double counted when calculating total shares and total value | 63.586 | -19,72 | 8.989 | -0,49 | ||||
| 2026-02-13 | 13F | Wilkerson Advisory Group LLC | 150 | 16 | ||||||
| 2026-02-17 | 13F | Canada Pension Plan Investment Board | 10 | -99,90 | 1 | -99,93 | ||||
| 2026-02-10 | 13F | CIBC Asset Management Inc | 25.220 | 13,32 | 2.757 | -12,45 | ||||
| 2026-02-11 | 13F | Ovata Capital Management Ltd | 0 | -100,00 | 0 | |||||
| 2026-02-09 | 13F | Koesten, Hirschmann & Crabtree, INC. | 0 | -100,00 | 0 | |||||
| 2025-11-05 | 13F | BI Asset Management Fondsmaeglerselskab A/S | 730 | 0,00 | 0 | |||||
| 2026-02-06 | 13F | Envestnet Portfolio Solutions, Inc. | 0 | -100,00 | 0 | |||||
| 2026-01-23 | 13F | Valley National Advisers Inc | 232 | 0,00 | 0 | |||||
| 2026-02-06 | 13F | Cullen/frost Bankers, Inc. | 5 | 0,00 | 1 | |||||
| 2026-02-04 | 13F | Fourth Dimension Wealth, LLC | 400 | 0,00 | 44 | -23,21 | ||||
| 2026-02-13 | 13F | Capula Management Ltd | 6.170 | -10,19 | 674 | -30,66 | ||||
| 2026-01-07 | 13F | Parisi Gray Wealth Management | 2.284 | -75,37 | 250 | -81,01 | ||||
| 2026-02-10 | 13F | Close Asset Management Ltd | 171 | 0,00 | 0 | |||||
| 2026-02-06 | 13F | Bare Financial Services, Inc | 6 | 1 | ||||||
| 2026-02-13 | 13F | Sei Investments Co | 271.175 | 12,11 | 29.642 | -13,39 | ||||
| 2026-02-12 | 13F | Brinker Capital Investments, LLC | 32.515 | -20,16 | 3.554 | -38,31 | ||||
| 2026-02-09 | 13F | Green Square Capital Advisors Llc | 8.650 | -3,03 | 946 | -34,47 | ||||
| 2026-02-09 | 13F/A | Swedbank AB | 364.000 | 16,29 | 39.789 | -10,16 | ||||
| 2026-02-17 | 13F | Schonfeld Strategic Advisors LLC | Call | 0 | -100,00 | 0 | -100,00 | |||
| 2025-10-21 | 13F | McElhenny Sheffield Capital Management, LLC | 0 | -100,00 | 0 | -100,00 | ||||
| 2026-02-13 | 13F | Citigroup Inc | Put | 87.200 | -14,68 | 9.532 | -34,09 | |||
| 2026-02-13 | 13F | Citigroup Inc | 707.517 | 36,24 | 77.339 | 5,25 | ||||
| 2026-02-13 | 13F | Citigroup Inc | Call | 60.800 | 0,00 | 6.646 | -22,74 | |||
| 2026-02-12 | 13F | BlackRock, Inc. | 1.308.027 | 18,43 | 142.980 | -8,51 | ||||
| 2026-02-13 | 13F | Kcm Investment Advisors Llc | 5.374 | 5,39 | 587 | -18,59 | ||||
| 2026-01-29 | 13F | Rakuten Securities, Inc. | 16.912 | 31,22 | 1.849 | 1,37 | ||||
| 2026-02-09 | 13F | Huntington National Bank | 2 | 0 | ||||||
| 2026-02-11 | 13F | Simplex Trading, Llc | 153.416 | 467,45 | 16.770 | 558.866,67 | ||||
| 2025-09-26 | NP | UOPIX - Ultranasdaq-100 Profund Investor Class | 6.670 | 18,83 | 943 | 47,19 | ||||
| 2026-02-11 | 13F | Dorsey & Whitney Trust CO LLC | 8.775 | 0,00 | 959 | -22,72 | ||||
| 2026-02-13 | 13F | Quarry LP | 153 | 17 | ||||||
| 2026-02-17 | 13F | XTX Topco Ltd | 0 | -100,00 | 0 | |||||
| 2026-02-13 | 13F | MAI Capital Management | 892 | -5,01 | 98 | -26,52 | ||||
| 2025-10-21 | 13F | Golden State Equity Partners | 0 | -100,00 | 0 | |||||
| 2026-02-09 | 13F | Harbour Investments, Inc. | 1.688 | 7,24 | 185 | -17,12 | ||||
| 2026-02-13 | 13F | MAI Capital Management | Call | 33 | -23,81 | |||||
| 2026-02-06 | 13F | Banque Cantonale Vaudoise | 7.407 | 27,77 | 810 | |||||
| 2026-02-17 | 13F | Raymond James Financial Inc | 207.017 | -30,89 | 22.629 | -46,61 | ||||
| 2026-02-17 | 13F | Blackstone Group Inc | 16.784 | 1.835 | ||||||
| 2026-01-27 | 13F | Godsey & Gibb Associates | 250 | 0,00 | 27 | -22,86 | ||||
| 2026-02-06 | 13F | Lloyd Advisory Services, LLC. | 8 | 1 | ||||||
| 2026-02-17 | 13F | State Of Wisconsin Investment Board | 0 | -100,00 | 0 | |||||
| 2025-11-14 | 13F | Mangrove Partners | 0 | -100,00 | 0 | |||||
| 2026-01-12 | 13F | Focus Financial Network, Inc. | 4.011 | 52,10 | 438 | 17,43 | ||||
| 2026-02-19 | 13F | Atomi Financial Group, Inc. | 0 | -100,00 | 0 | |||||
| 2026-02-14 | 13F | Whipplewood Advisors, LLC | 4 | 0 | ||||||
| 2026-02-13 | 13F | Resources Investment Advisors, LLC. | 1.955 | -58,65 | 214 | -68,11 | ||||
| 2026-02-02 | 13F | Millstone Evans Group, LLC | 100 | 0,00 | 11 | -28,57 | ||||
| 2026-02-11 | 13F | Capital International Inc /ca/ | 23.041 | 33,02 | 2.519 | 2,78 | ||||
| 2026-03-06 | 13F | Hsbc Holdings Plc | 92.992 | 25,20 | 10.281 | -0,94 | ||||
| 2026-02-12 | 13F | SWAN Capital LLC | 100 | 0,00 | 11 | -28,57 | ||||
| 2025-11-14 | 13F | Mercer Global Advisors Inc /adv | Call | 0 | -100,00 | 0 | -100,00 | |||
| 2026-02-12 | 13F/A | Pinebridge Investments Llc | 25.199 | 2.755 | ||||||
| 2026-02-13 | 13F | ROI Financial Advisors, LLC | 5.095 | -0,14 | 557 | -22,88 | ||||
| 2026-02-17 | 13F | Liontrust Investment Partners LLP | 144.929 | -2,57 | 15.842 | -24,73 | ||||
| 2025-11-14 | 13F | Hidden Lake Asset Management LP | 0 | -100,00 | 0 | |||||
| 2026-02-06 | 13F | Tortoise Investment Management, LLC | 0 | -100,00 | 0 | |||||
| 2026-02-12 | 13F | Federation des caisses Desjardins du Quebec | 10.291 | 0,33 | 1.125 | -22,54 | ||||
| 2026-02-17 | 13F | Engineers Gate Manager LP | 12.393 | 1.355 | ||||||
| 2026-02-13 | 13F | TFB Advisors LLC | 3.565 | 1,08 | 390 | -34,40 | ||||
| 2026-02-17 | 13F | SIH Partners, LLLP | 17.020 | -14,90 | 1.860 | -34,25 | ||||
| 2025-09-29 | NP | KNCT - Invesco Dynamic Networking ETF This fund is a listed as child fund of Invesco Ltd. and if that institution has disclosed ownership in this security, then these positions will not be double counted when calculating total shares and total value | 818 | -6,19 | 116 | 16,16 | ||||
| 2025-09-26 | NP | TIRTX - TIAA-CREF Large-Cap Growth Fund Retail Class | 193.238 | 27.319 | ||||||
| 2026-02-06 | 13F | Global Retirement Partners, LLC | 922 | 4,18 | 101 | -20,00 | ||||
| 2026-02-17 | 13F | Henry James International Management Inc. | 2.424 | -2,42 | 265 | -24,79 | ||||
| 2026-01-23 | 13F | Nbt Bank N A /ny | 109 | 2 | ||||||
| 2026-01-27 | 13F | Fortis Capital Advisors, LLC | 2.440 | -2,94 | 267 | -25,07 | ||||
| 2026-01-14 | 13F | TrueMark Investments, LLC | 7.485 | -2,78 | 818 | -24,89 | ||||
| 2026-01-23 | 13F | Aspect Partners, LLC | 27 | 3 | ||||||
| 2026-02-12 | 13F | Marex Group plc | 58.615 | -6,27 | 6.407 | -27,57 | ||||
| 2026-01-26 | 13F | Asset Dedication, LLC | 1.700 | 0,00 | 186 | -22,92 | ||||
| 2026-02-13 | 13F | Flow Traders U.s. Llc | 1.872 | 0 | ||||||
| 2025-09-29 | NP | CHAT - Roundhill Generative AI & Technology ETF | 75.521 | -5,03 | 10.677 | 17,72 | ||||
| 2026-02-12 | 13F | NZS Capital, LLC | 411.748 | -8,08 | 45.008 | -28,99 | ||||
| 2025-11-07 | 13F | Icapital Wealth Llc | 0 | -100,00 | 0 | |||||
| 2026-02-04 | 13F | Atlantic Union Bankshares Corp | 695 | 0,00 | 76 | -23,47 | ||||
| 2026-02-13 | 13F | Silvant Capital Management LLC | 99.136 | 0,15 | 10.837 | -22,63 | ||||
| 2025-09-26 | NP | BIVIX - Invenomic Fund Institutional Class shares | Short | -95.614 | -22,96 | -13.517 | -4,50 | |||
| 2026-01-28 | 13F | Geneos Wealth Management Inc. | 6.152 | 19,41 | 672 | -7,69 | ||||
| 2026-02-17 | 13F | Wiley Bros.-aintree Capital, Llc | 31.357 | 147,18 | 3.429 | 91,08 | ||||
| 2026-02-06 | 13F | IFP Advisors, Inc | 1.085 | 138,46 | 119 | 84,38 | ||||
| 2026-01-15 | 13F | Cherry Creek Investment Advisors, Inc. | 4.347 | 1,78 | 475 | -21,36 | ||||
| 2026-02-12 | 13F | Cloud Capital Management, LLC | 0 | -100,00 | 0 | |||||
| 2025-11-14 | 13F | Wolverine Trading, Llc | 5.349 | 748 | ||||||
| 2025-11-14 | 13F | Wolverine Trading, Llc | Call | 1.457.300 | 203.731 | |||||
| 2025-11-14 | 13F | Wolverine Trading, Llc | Put | 616.600 | 86.201 | |||||
| 2026-02-17 | 13F | Agf Management Ltd | 10.600 | 341,67 | 1.159 | 241,59 | ||||
| 2025-11-04 | 13F | Victrix Investment Advisors | 0 | -100,00 | 0 | |||||
| 2026-02-10 | 13F | KERR FINANCIAL PLANNING Corp | 2.675 | 0,00 | 302 | -20,53 | ||||
| 2025-09-29 | NP | SOXY - YieldMax(TM) Target 12(TM) Semiconductor Option Income ETF | 1.805 | -9,16 | 255 | 12,83 | ||||
| 2026-02-17 | 13F | Banco Bilbao Vizcaya Argentaria, S.a. | 0 | -100,00 | 0 | |||||
| 2026-02-13 | 13F | Clear Street Group Inc. | 122.733 | 5,50 | 13.416 | -18,50 | ||||
| 2026-02-06 | 13F | GPS Wealth Strategies Group, LLC | 310 | -96,39 | 34 | -97,28 | ||||
| 2026-02-11 | 13F | Capital Analysts, Inc. | 52 | -20,00 | 0 | |||||
| 2026-02-17 | 13F | Main Street Financial Solutions, LLC | 0 | -100,00 | 0 | |||||
| 2026-02-10 | 13F | Acadian Asset Management Llc | 62.329 | 187,08 | 7 | 100,00 | ||||
| 2026-02-09 | 13F | Berkshire Capital Holdings Inc | 10 | 0,00 | 1 | 0,00 | ||||
| 2026-02-03 | 13F | CGC Financial Services, LLC | 100 | 0,00 | 11 | -28,57 | ||||
| 2026-01-28 | 13F | Oversea-Chinese Banking CORP Ltd | 26.870 | 182,99 | 2.969 | 121,24 | ||||
| 2026-02-02 | 13F | PKO Investment Management Joint-Stock Co | 25.000 | 47,06 | 2.733 | 13,60 | ||||
| 2026-02-02 | 13F | Horizon Investments, LLC | 16.767 | 59,99 | 1.833 | 23,62 | ||||
| 2026-02-03 | 13F | International Assets Investment Management, Llc | 6.938 | 28,01 | 758 | -10,51 | ||||
| 2026-02-24 | 13F | DGS Capital Management, LLC | 0 | -100,00 | 0 | |||||
| 2026-02-17 | 13F | Sig Brokerage, Lp | Put | 10.000 | 1.093 | |||||
| 2026-02-17 | 13F | Sig Brokerage, Lp | Call | 471.600 | 0,00 | 51.551 | -22,74 | |||
| 2026-01-21 | 13F | Prime Capital Investment Advisors, LLC | 3.635 | 1,17 | 397 | -21,85 | ||||
| 2026-01-15 | 13F | Lodestone Wealth Management LLC | 76 | 8 | ||||||
| 2026-02-18 | 13F | Vident Advisory, LLC | 157.119 | 16,01 | 17.175 | -10,38 | ||||
| 2026-02-11 | 13F | Comprehensive Financial Planning, Inc./PA | 700 | 0,00 | 77 | -23,23 | ||||
| 2026-01-30 | 13F | Activest Wealth Management | 146 | 114,71 | 16 | 77,78 | ||||
| 2025-10-20 | 13F | Yarbrough Capital, LLC | 0 | -100,00 | 0 | -100,00 | ||||
| 2026-02-17 | 13F | Fairscale Capital, LLC | 257 | 0,00 | 28 | -22,22 | ||||
| 2025-10-23 | 13F | StoneCrest Wealth Management, Inc. | 0 | -100,00 | 0 | |||||
| 2026-02-11 | 13F | Capital Group Investment Management Pte. Ltd. | 5.478 | 0,00 | 599 | -22,84 | ||||
| 2025-11-14 | 13F | Victory Financial Group, Llc | 0 | -100,00 | 0 | |||||
| 2026-02-10 | 13F | Intellectus Partners, LLC | 0 | -100,00 | 0 | |||||
| 2026-02-06 | 13F | Copia Wealth Management | 4 | 0 | ||||||
| 2026-02-10 | 13F | Viawealth, Llc | 0 | -100,00 | 0 | |||||
| 2025-11-14 | 13F | Eqis Capital Management, Inc. | 0 | -100,00 | 0 | |||||
| 2025-11-14 | 13F | KP Management LLC | 0 | -100,00 | 0 | |||||
| 2026-01-29 | 13F | Concurrent Investment Advisors, LLC | 4.200 | -37,23 | 459 | -51,48 | ||||
| 2026-02-11 | 13F | Capital Research Global Investors | 1.805.110 | 5,06 | 197.332 | -18,83 | ||||
| 2026-01-22 | 13F | HHM Wealth Advisors, LLC | 2.490 | 0,00 | 272 | -22,73 | ||||
| 2025-11-14 | 13F | KP Management LLC | Call | 0 | -100,00 | 0 | ||||
| 2026-02-06 | 13F | ProShare Advisors LLC | 215.871 | 44,72 | 23.597 | 11,81 | ||||
| 2026-02-02 | 13F | Mutual Advisors, LLC | 0 | -100,00 | 0 | |||||
| 2025-10-28 | 13F | Global Trust Asset Management, LLC | 0 | -100,00 | 0 | |||||
| 2026-02-02 | 13F | Ascent Wealth Partners, LLC | 11.718 | 1,39 | 1.281 | -21,71 | ||||
| 2025-09-29 | NP | QCLR - Global X NASDAQ 100 Collar 95-110 ETF This fund is a listed as child fund of Mirae Asset Global Investments Co., Ltd. and if that institution has disclosed ownership in this security, then these positions will not be double counted when calculating total shares and total value | 20 | 11,11 | 3 | 0,00 | ||||
| 2026-02-12 | 13F | Alphabet Inc. | 1.960.784 | 0,00 | 214.333 | -22,74 | ||||
| 2026-02-17 | 13F | Toronto Dominion Bank | 2.397 | -69,46 | 262 | -76,47 | ||||
| 2026-02-06 | 13F | EverSource Wealth Advisors, LLC | 3.851 | -59,50 | 421 | -68,77 | ||||
| 2026-02-17 | 13F | Captrust Financial Advisors | 10.149 | -14,02 | 1.109 | -33,59 | ||||
| 2025-11-13 | 13F | RiverPark Advisors, LLC | 0 | -100,00 | 0 | |||||
| 2026-02-13 | 13F | Smartleaf Asset Management LLC | 2 | 100,00 | 0 | |||||
| 2025-11-13 | 13F | Riggs Asset Managment Co. Inc. | 0 | -100,00 | 0 | |||||
| 2026-02-17 | 13F | LMR Partners LLP | 3.748 | -69,92 | 410 | -76,79 | ||||
| 2026-02-10 | 13F | Smith Group Asset Management, LLC | 8.520 | 0,00 | 931 | -22,74 | ||||
| 2026-02-17 | 13F | LMR Partners LLP | Call | 1.600 | -97,99 | 175 | -98,46 | |||
| 2026-02-17 | 13F | LMR Partners LLP | Put | 84.300 | -12,10 | 9.215 | -32,09 | |||
| 2026-01-27 | 13F | Purus Wealth Management, LLC | 1.910 | -53,86 | 209 | -64,44 | ||||
| 2026-02-10 | 13F | FUKOKU MUTUAL LIFE INSURANCE Co | 10.000 | 0,00 | 1.093 | -22,70 | ||||
| 2025-09-24 | NP | Innovator ETFs Trust - Innovator Gradient Tactical Rotation Strategy ETF | 712 | 101 | ||||||
| 2025-09-25 | NP | SCVEX - Hartford Schroders International Stock Fund Class A | 440.871 | -19,27 | 62.328 | 0,07 | ||||
| 2026-01-20 | 13F | Sovran Advisors, LLC | 0 | -100,00 | 0 | |||||
| 2026-02-11 | 13F | Empowered Funds, LLC | 5.547 | 25,19 | 606 | -3,19 | ||||
| 2026-02-12 | 13F | Gerber Kawasaki Wealth & Investment Management | 1.905 | -37,27 | 208 | -51,52 | ||||
| 2025-09-24 | NP | TWBIX - Balanced Fund Investor Class This fund is a listed as child fund of American Century Companies Inc and if that institution has disclosed ownership in this security, then these positions will not be double counted when calculating total shares and total value | 7.996 | 0,00 | 1.130 | 24,04 | ||||
| 2026-02-13 | 13F | Centerpoint Advisors, LLC | 100 | 0,00 | 0 | |||||
| 2026-02-13 | 13F | Avanda Investment Management Pte. Ltd. | 0 | -100,00 | 0 | |||||
| 2026-01-30 | 13F | Simplicity Wealth,LLC | 4.399 | -31,15 | 481 | -46,84 | ||||
| 2026-02-03 | 13F | Legacy Wealth Managment, LLC/ID | 100 | 0,00 | 11 | -28,57 | ||||
| 2026-02-17 | 13F | Crawford Fund Management, LLC | Put | 7.800 | -38,10 | 853 | -52,19 | |||
| 2026-02-13 | 13F | Venture Visionary Partners LLC | 19.035 | -46,88 | 2.081 | -58,97 | ||||
| 2026-02-17 | 13F | Royal Bank Of Canada | Put | 212.200 | 54,66 | 23.196 | 19,49 | |||
| 2026-02-17 | 13F | Royal Bank Of Canada | Call | 27.700 | 0,00 | 3.028 | -22,74 | |||
| 2026-02-12 | 13F | WealthPLAN Partners, LLC | 4.850 | -0,10 | 530 | -22,74 | ||||
| 2026-02-13 | 13F | USS Investment Management Ltd | 28.348 | -0,28 | 3.099 | -22,93 | ||||
| 2026-01-30 | 13F | Bogart Wealth, LLC | 50 | 0,00 | 5 | -28,57 | ||||
| 2026-02-02 | 13F | Addison Capital Co | 1.977 | 0,00 | 216 | -22,58 | ||||
| 2025-10-24 | 13F | Mirae Asset Securities (usa) Inc. | 0 | -100,00 | 0 | -100,00 | ||||
| 2026-02-13 | 13F | Arrowstreet Capital, Limited Partnership | 72.508 | 7.926 | ||||||
| 2026-02-13 | 13F | Quinn Opportunity Partners LLC | 163.987 | 210,13 | 17.925 | 139,61 | ||||
| 2025-09-26 | NP | IGPT - Invesco Dynamic Software ETF This fund is a listed as child fund of Invesco Ltd. and if that institution has disclosed ownership in this security, then these positions will not be double counted when calculating total shares and total value | 20.008 | 3,68 | 2.829 | 28,55 | ||||
| 2026-01-13 | 13F | CoreCap Advisors, LLC | 748 | -0,40 | 82 | -23,58 | ||||
| 2026-01-26 | 13F | Reyes Financial Architecture, Inc. | 136 | 28,30 | 15 | 0,00 | ||||
| 2026-02-06 | 13F | Profund Advisors Llc | 18.341 | 20,21 | 2.005 | -7,14 | ||||
| 2025-09-29 | NP | CEFA - Global X S&P Catholic Values Developed ex-U.S. ETF This fund is a listed as child fund of Mirae Asset Global Investments Co., Ltd. and if that institution has disclosed ownership in this security, then these positions will not be double counted when calculating total shares and total value | 163 | -12,83 | 23 | 9,52 | ||||
| 2026-01-23 | 13F | U.S. Capital Wealth Advisors, LLC | 0 | -100,00 | 0 | |||||
| 2026-02-09 | 13F | Keating Financial Advisory Services, Inc. | 247 | 27 | ||||||
| 2025-11-10 | 13F | Dakota Wealth Management | 0 | -100,00 | 0 | |||||
| 2026-02-03 | 13F | SBI Securities Co., Ltd. | 108.484 | -8,36 | 11.858 | -29,20 | ||||
| 2026-02-13 | 13F | National Bank Of Canada /fi/ | 65.604 | 89,82 | 7.171 | 46,68 | ||||
| 2026-02-09 | 13F | Annis Gardner Whiting Capital Advisors, LLC | 3.210 | 0,00 | 351 | -22,91 | ||||
| 2026-02-09 | 13F | Texas Capital Bank Wealth Management Services Inc | 27.500 | 3.006 | ||||||
| 2025-11-13 | 13F | Dymon Asia Capital (singapore) Pte. Ltd. | Put | 0 | -100,00 | 0 | -100,00 | |||
| 2026-02-12 | 13F | Front Row Advisors LLC | 160 | 0,00 | 17 | -22,73 | ||||
| 2026-01-08 | 13F | Armstrong Advisory Group, Inc | 339 | 0,00 | 37 | -21,28 | ||||
| 2025-11-13 | 13F | Dymon Asia Capital (singapore) Pte. Ltd. | Call | 0 | -100,00 | 0 | -100,00 | |||
| 2025-11-14 | 13F | MUFG Securities EMEA plc | Put | 0 | -100,00 | 0 | -100,00 | |||
| 2026-01-29 | 13F | Financial Life Planners | 0 | -100,00 | 0 | |||||
| 2026-01-07 | 13F | Harbour Capital Advisors, LLC | 8.013 | -5,53 | 919 | -31,98 | ||||
| 2026-01-20 | 13F | Accel Wealth Management | 3.442 | -4,34 | 376 | -26,13 | ||||
| 2026-02-10 | 13F | 360 Financial, Inc. | 1.669 | 0,00 | 236 | 0,00 | ||||
| 2026-02-13 | 13F | Ubs Asset Management Americas Inc | 217.689 | 23.796 | ||||||
| 2026-01-23 | 13F | Brown, Lisle/cummings, Inc. | 941 | 0,00 | 103 | -23,31 | ||||
| 2026-02-17 | 13F | Ardsley Advisory Partners Lp | Call | 85.000 | 325,00 | 9.291 | 228,42 | |||
| 2026-02-13 | 13F | Evelyn Partners Investment Management LLP | 900 | 98 | ||||||
| 2026-02-09 | 13F | Jefferies Financial Group Inc. | Put | 10.000 | 1.093 | |||||
| 2026-01-29 | 13F | Kestra Private Wealth Services, Llc | 4.917 | -33,46 | 537 | -48,61 | ||||
| 2026-02-09 | 13F | Jefferies Financial Group Inc. | 3.200 | 350 | ||||||
| 2026-02-10 | 13F | Bnp Paribas | 13.425 | 36,27 | 1.468 | 5,31 | ||||
| 2026-02-12 | 13F | Commonwealth Equity Services, Llc | 26.786 | -34,98 | 2.928 | 58.440,00 | ||||
| 2026-02-17 | 13F | Royal Bank Of Canada | 280.625 | -37,06 | 30.676 | -51,37 | ||||
| 2026-02-17 | 13F | J. Goldman & Co LP | 52.500 | 5.739 | ||||||
| 2026-03-03 | 13F | Employees Provident Fund Board | 1.100.000 | 120.241 | ||||||
| 2025-10-24 | 13F | Mirae Asset Securities (usa) Inc. | Put | 0 | -100,00 | 0 | -100,00 | |||
| 2026-02-03 | 13F | Morse Asset Management, Inc | 174 | -65,82 | 19 | -73,61 | ||||
| 2026-02-17 | 13F | Prelude Capital Management, Llc | 7.772 | 85,05 | 850 | 42,93 | ||||
| 2026-01-30 | 13F | Covenant Asset Management, LLC | 33.298 | 0,51 | 3.640 | -22,36 | ||||
| 2025-09-29 | NP | PTNQ - Pacer Trendpilot 100 ETF | 9.443 | 48,13 | 1.335 | 31,27 | ||||
| 2026-01-23 | 13F | Blue Fin Capital, Inc. | 22.733 | -31,33 | 2.485 | -46,96 | ||||
| 2026-02-13 | 13F | Gts Securities Llc | 7.327 | 11,12 | 801 | -14,16 | ||||
| 2026-02-17 | 13F | National Asset Management, Inc. | 5.650 | -20,06 | 618 | -38,30 | ||||
| 2026-02-17 | 13F | Fountainhead AM, LLC | 0 | -100,00 | 0 | |||||
| 2026-02-11 | 13F | Ameritas Investment Partners, Inc. | 5.002 | 547 | ||||||
| 2026-02-10 | 13F | Essex Financial Services, Inc. | 2.971 | -7,76 | 325 | -28,79 | ||||
| 2026-01-27 | 13F | Zurcher Kantonalbank (Zurich Cantonalbank) | 24.188 | 2.644 | ||||||
| 2026-02-04 | 13F | Meridian Wealth Management, LLC | 3.342 | 30,04 | 365 | 0,55 | ||||
| 2025-10-29 | 13F | Wealth Enhancement Advisory Services, Llc | Call | 0 | -100,00 | 0 | -100,00 | |||
| 2026-01-13 | 13F | Stonehage Fleming Financial Services Holdings Ltd | 2.341 | 0,00 | 256 | -22,96 | ||||
| 2026-02-11 | 13F | J.w. Cole Advisors, Inc. | 2.695 | 30,70 | 270 | -7,56 | ||||
| 2026-02-17 | 13F | DV Trading LLC | 61 | 7 | ||||||
| 2025-11-13 | 13F | IPG Investment Advisors LLC | 0 | -100,00 | 0 | |||||
| 2026-02-26 | 13F | Anchor Investment Management, LLC | 0 | -100,00 | 0 | |||||
| 2026-01-14 | 13F | Mirador Capital Partners LP | 2.640 | 1,66 | 289 | -21,53 | ||||
| 2026-02-11 | 13F | Hilton Head Capital Partners, LLC | 6.945 | 759 | ||||||
| 2025-09-29 | NP | QQWZ - Pacer Cash COWZ 100-Nasdaq 100 Rotator ETF | 73 | 10 | ||||||
| 2026-02-17 | 13F | Summit Trail Advisors, Llc | 2.101 | -60,56 | 230 | -69,59 | ||||
| 2026-02-18 | 13F | Beacon Pointe Advisors, LLC | 2.930 | -22,24 | 320 | -39,96 | ||||
| 2026-01-16 | 13F | Empirical Financial Services, LLC d.b.a. Empirical Wealth Management | 3.096 | 18,03 | 338 | -8,89 | ||||
| 2026-02-03 | 13F | Costello Asset Management, INC | 3.223 | 32,42 | 352 | 2,33 | ||||
| 2026-02-10 | 13F | Root Financial Partners, LLC | 1.056 | 2.678,95 | 115 | 2.200,00 | ||||
| 2026-02-17 | 13F | Wellington Management Group Llp | Call | 0 | -100,00 | 0 | ||||
| 2026-01-12 | 13F | Willner & Heller, Llc | 11.258 | 9,46 | 1.231 | -15,46 | ||||
| 2025-11-14 | 13F | Point72 (DIFC) Ltd | 0 | -100,00 | 0 | -100,00 | ||||
| 2025-11-14 | 13F | ExodusPoint Capital Management, LP | 0 | -100,00 | 0 | -100,00 | ||||
| 2026-01-21 | 13F | Jackson Square Capital, Llc | 29.312 | -16,34 | 3.204 | -35,36 | ||||
| 2025-09-29 | NP | SOXL - Direxion Daily Semiconductor Bull 3X Shares | 401.067 | 18,07 | 56.701 | 46,36 | ||||
| 2026-02-17 | 13F | Two Sigma Securities, Llc | 3.650 | 120,41 | 399 | 70,09 | ||||
| 2026-02-17 | 13F | Signature Equity Partners, LLC | 367 | 40 | ||||||
| 2026-02-12 | 13F | Great Valley Advisor Group, Inc. | 0 | -100,00 | 0 | |||||
| 2026-02-03 | 13F | Sumitomo Mitsui DS Asset Management Company, Ltd | 14.287 | 20,31 | 1.562 | -7,08 | ||||
| 2026-02-02 | 13F | Pittenger & Anderson Inc | 180 | -91,80 | 20 | -93,87 | ||||
| 2026-02-10 | 13F | Telligent Fund, LP | 0 | -100,00 | 0 | |||||
| 2026-01-20 | 13F | AdvisorNet Financial, Inc | 1.583 | 0,00 | 173 | -22,42 | ||||
| 2026-02-11 | 13F | Meiji Yasuda Life Insurance Co | 7.679 | 0,00 | 839 | -22,74 | ||||
| 2026-02-11 | 13F | Cerity Partners LLC | 13.525 | -1,48 | 1.479 | -24,05 | ||||
| 2025-09-26 | NP | AIM INTERNATIONAL MUTUAL FUNDS (INVESCO INTERNATIONAL MUTUAL FUNDS) - Invesco Oppenheimer Global Fund Class C | 445.179 | 62.937 | ||||||
| 2026-02-13 | 13F | State Street Corp | 284.200 | -39,96 | 31.066 | -53,61 | ||||
| 2026-02-17 | 13F | Edmond De Rothschild Holding S.a. | 6.116 | 41,41 | 669 | 9,33 | ||||
| 2025-09-29 | NP | INVESCO ACTIVELY MANAGED EXCHANGE-TRADED FUND TRUST - Invesco QQQ Income Advantage ETF | 1.701 | 17,72 | 240 | 46,34 | ||||
| 2026-02-12 | 13F | Colonial Trust Advisors | 67 | 0,00 | 7 | -22,22 | ||||
| 2026-02-17 | 13F | Perennial Investment Advisors, LLC | 0 | -100,00 | 0 | -100,00 | ||||
| 2026-02-12 | 13F | DRW Securities, LLC | Put | 21.700 | -14,57 | 2.372 | -33,91 | |||
| 2026-02-12 | 13F | DRW Securities, LLC | 21.700 | 1.219,95 | 2.372 | 922,41 | ||||
| 2026-02-04 | 13F | Ameritas Advisory Services, LLC | 0 | -100,00 | 0 | |||||
| 2026-01-28 | 13F | Loring Wolcott & Coolidge Fiduciary Advisors Llp/ma | 375 | 43 | ||||||
| 2026-02-12 | 13F | Jane Street Group, Llc | 62.361 | -63,45 | 6.817 | -71,77 | ||||
| 2026-02-12 | 13F | Jane Street Group, Llc | Put | 7.034.500 | 4,88 | 768.941 | -18,97 | |||
| 2026-02-12 | 13F | Jane Street Group, Llc | Call | 5.699.500 | 3,33 | 623.012 | -20,17 | |||
| 2026-01-09 | 13F | 180 Wealth Advisors, Llc | 19.474 | 6,12 | 2.129 | -18,03 | ||||
| 2025-11-14 | 13F | Squarepoint Ops LLC | 0 | -100,00 | 0 | -100,00 | ||||
| 2026-01-23 | 13F | Paragon Capital Management Inc | 7.554 | 826 | ||||||
| 2026-02-13 | 13F | Squarepoint Ops LLC | Call | 101.300 | -89,30 | 11.073 | -91,74 | |||
| 2026-02-17 | 13F | Cim Investment Mangement Inc | 8.669 | 0,00 | 948 | -22,76 | ||||
| 2026-02-13 | 13F | Squarepoint Ops LLC | Put | 196.200 | 188,53 | 21.447 | 122,91 | |||
| 2026-02-13 | 13F | Siren, L.L.C. | 21.500 | 2.350 | ||||||
| 2025-09-24 | NP | TWSMX - Strategic Allocation: Moderate Fund Investor Class This fund is a listed as child fund of American Century Companies Inc and if that institution has disclosed ownership in this security, then these positions will not be double counted when calculating total shares and total value | 672 | 0,00 | 95 | 25,00 | ||||
| 2025-11-12 | 13F | Botty Investors LLC | 0 | -100,00 | 0 | |||||
| 2025-10-20 | 13F | Brendel Financial Advisors LLC | 0 | -100,00 | 0 | |||||
| 2026-02-04 | 13F | Fortem Financial Group, Llc | 9.053 | 0,37 | 990 | -22,49 | ||||
| 2026-02-09 | 13F | Leavell Investment Management, Inc. | 3.695 | -43,97 | 404 | -56,81 | ||||
| 2026-02-17 | 13F | Northern Trust Corp | 5.846 | 37,13 | 639 | 5,97 | ||||
| 2026-02-17 | 13F | Gilder Gagnon Howe & Co Llc | 366.729 | 5,36 | 40.087 | -18,60 | ||||
| 2026-02-12 | 13F | Hudock, Inc. | 2.081 | 0,00 | 227 | -22,79 | ||||
| 2026-01-15 | 13F | Dock Street Asset Management Inc | 216.235 | -0,15 | 23.637 | -22,86 | ||||
| 2025-11-10 | 13F | Adviser Investments LLC | 0 | -100,00 | 0 | |||||
| 2025-11-04 | 13F | Guerra Advisors Inc | 102 | 14 | ||||||
| 2026-02-13 | 13F | Vontobel Holding Ltd. | Call | 5.000 | 66,67 | 547 | 28,77 | |||
| 2026-02-13 | 13F | Vontobel Holding Ltd. | 25.627 | -45,26 | 2.801 | -57,71 | ||||
| 2026-02-13 | 13F | Marshall Wace, Llp | 1.128.252 | 123.329 | ||||||
| 2026-02-17 | 13F | VestGen Advisors, LLC | 25.202 | 487,60 | 2.755 | 354,46 | ||||
| 2025-11-17 | 13F | WJ Wealth Management, LLC | 1.550 | 0,00 | 219 | -12,40 | ||||
| 2026-01-23 | 13F | Diversify Advisory Services, LLC | 65.455 | -5,83 | 6.924 | -40,95 | ||||
| 2026-02-13 | 13F | Charles Schwab Investment Management Inc | 20.228 | -23,55 | 2.211 | -40,93 | ||||
| 2026-02-17 | 13F | Aquatic Capital Management LLC | 29.349 | 3.208 | ||||||
| 2025-10-30 | 13F | Covestor Ltd | 0 | -100,00 | 0 | |||||
| 2026-02-17 | 13F | Polar Asset Management Partners Inc. | 0 | -100,00 | 0 | -100,00 | ||||
| 2026-02-17 | 13F | Cetera Investment Advisers | 46.399 | 3,65 | 5.072 | -19,94 | ||||
| 2026-02-19 | 13F | Invesco Ltd. | 2.426.850 | 36,95 | 265.279 | 5,80 | ||||
| 2026-02-10 | 13F | Goldman Sachs Group Inc | Put | 2.098.700 | -17,44 | 229.409 | -36,21 | |||
| 2026-02-10 | 13F | Goldman Sachs Group Inc | Call | 2.367.000 | -2,03 | 258.737 | -24,31 | |||
| 2026-02-10 | 13F | Goldman Sachs Group Inc | 3.873.957 | 13,62 | 423.462 | -12,22 | ||||
| 2026-02-13 | 13F | Fiduciary Trust Co | 7.498 | -12,50 | 820 | -32,43 | ||||
| 2026-02-03 | 13F | Credit Industriel Et Commercial | 4.603 | 503 | ||||||
| 2026-02-03 | 13F | Credit Industriel Et Commercial | Put | 15.000 | 1.640 | |||||
| 2026-01-14 | 13F | ORG Partners LLC | 30 | -91,45 | 3 | -93,88 | ||||
| 2025-11-05 | 13F | State Of Michigan Retirement System | 0 | -100,00 | 0 | |||||
| 2026-02-18 | 13F | EP Wealth Advisors, Inc. | 2.317 | 253 | ||||||
| 2026-01-12 | 13F | First Bank & Trust | 2.116 | 0,00 | 231 | -22,74 | ||||
| 2026-01-28 | 13F | B. Metzler seel. Sohn & Co. AG | 5.225 | -69,63 | 571 | -76,54 | ||||
| 2026-02-17 | 13F | Advisory Services Network, LLC | 18.355 | 2,22 | 2.006 | -21,02 | ||||
| 2026-02-17 | 13F | Ardsley Advisory Partners Lp | 0 | -100,00 | 0 | |||||
| 2026-02-20 | 13F | Kovitz Investment Group Partners, LLC | 0 | -100,00 | 0 | |||||
| 2025-10-24 | 13F | MorganRosel Wealth Management, LLC | 0 | -100,00 | 0 | -100,00 | ||||
| 2026-01-07 | 13F | IAM Advisory, LLC | 4.597 | 1,17 | 502 | -21,81 | ||||
| 2025-10-08 | 13F/A | Westwood Holdings Group Inc | 0 | -100,00 | 0 | |||||
| 2026-02-05 | 13F | Kapstone Financial Advisors LLC | 0 | -100,00 | 0 | |||||
| 2026-01-30 | 13F | Caldwell Securities, Inc | 10 | 0,00 | 1 | 0,00 | ||||
| 2026-01-27 | 13F | CenterStar Asset Management, LLC | 2.318 | 254 | ||||||
| 2025-11-10 | 13F | Prakash Investment Advisors Llc | 0 | -100,00 | 0 | |||||
| 2026-02-11 | 13F | O'shaughnessy Asset Management, Llc | 1.884 | 1,07 | 206 | -22,05 | ||||
| 2026-02-02 | 13F | Elite Wealth Management, Inc. | 0 | -100,00 | 0 | -100,00 | ||||
| 2026-02-13 | 13F | Dymon Asia Capital (singapore) Pte. Ltd. | 106.000 | 11.587 | ||||||
| 2026-02-17 | 13F | Millennium Management Llc | Call | 353.800 | 157,12 | 38.674 | 98,64 | |||
| 2025-11-14 | 13F | Sig Brokerage, Lp | 0 | -100,00 | 0 | -100,00 | ||||
| 2026-02-17 | 13F | Millennium Management Llc | Put | 585.900 | 133,99 | 64.045 | 80,77 | |||
| 2026-02-17 | 13F | Millennium Management Llc | 143.691 | 16,25 | 15.707 | -10,19 | ||||
| 2026-02-17 | 13F | Rakuten Investment Management, Inc. | 20.466 | 154,05 | 2.262 | 71,81 | ||||
| 2026-01-21 | 13F | Crews Bank & Trust | 35 | 0,00 | 4 | -25,00 | ||||
| 2026-02-06 | 13F | Mizuho Markets Cayman LP | 15.966 | -3,55 | 1.745 | -25,49 | ||||
| 2026-02-17 | 13F | Two Sigma Investments, Lp | 1.259.155 | 501,28 | 137.638 | 364,54 | ||||
| 2026-02-17 | 13F | Adams Wealth Management | 22.405 | 17,72 | 2.449 | -9,03 | ||||
| 2026-02-06 | 13F | Kingdom Financial Group LLC. | 53 | 6 | ||||||
| 2025-09-26 | NP | UEPIX - Europe 30 Profund Investor Class | 1.291 | 24,73 | 183 | 54,24 | ||||
| 2026-02-17 | 13F | Two Sigma Investments, Lp | Put | 75.000 | 3.650,00 | 8.198 | 2.807,09 | |||
| 2026-02-13 | 13F | Golden State Wealth Management, LLC | 4.370 | 141,44 | 478 | 86,33 | ||||
| 2026-02-17 | 13F | Two Sigma Investments, Lp | Call | 77.400 | 8.461 | |||||
| 2026-01-16 | 13F | Perigon Wealth Management, LLC | 4.171 | -57,65 | 456 | -67,34 | ||||
| 2026-01-09 | 13F | SG Americas Securities, LLC | 265.608 | 1.283,23 | 29 | 1.350,00 | ||||
| 2026-02-17 | 13F | Tudor Investment Corp Et Al | 0 | -100,00 | 0 | -100,00 | ||||
| 2025-09-24 | NP | ACFOX - Focused Dynamic Growth Fund Investor Class This fund is a listed as child fund of American Century Companies Inc and if that institution has disclosed ownership in this security, then these positions will not be double counted when calculating total shares and total value | 194.613 | 0,00 | 27.513 | 23,96 | ||||
| 2025-09-26 | NP | REUYX - Sustainable Equity Fund Class Y | 0 | -100,00 | 0 | -100,00 | ||||
| 2025-11-14 | 13F | Castle Hook Partners LP | 0 | -100,00 | 0 | -100,00 | ||||
| 2026-02-06 | 13F | Empirical Asset Management, LLC | 9.000 | -2,17 | 984 | -24,44 | ||||
| 2026-03-20 | 13F/A | Hsbc Holdings Plc | Put | 99.000 | 10.955 | |||||
| 2026-02-11 | 13F | First Command Advisory Services, Inc. | 36 | 4 | ||||||
| 2025-11-06 | 13F | bLong Financial, LLC | 0 | -100,00 | 0 | |||||
| 2025-09-24 | NP | QFLR - Innovator Nasdaq-100 Managed Floor ETF | 7.177 | -4,32 | 1.015 | 18,60 | ||||
| 2026-02-17 | 13F | Duquesne Family Office LLC | 0 | -100,00 | 0 | -100,00 | ||||
| 2026-02-17 | 13F | Dimension Capital Management Llc | 0 | -100,00 | 0 | -100,00 | ||||
| 2026-01-20 | 13F | Tran Capital Management, L.p. | 189.496 | 20.714 | ||||||
| 2026-01-13 | 13F | Mather Group, Llc. | 0 | -100,00 | 0 | |||||
| 2026-02-11 | 13F | Capital International Sarl | 45.440 | 7,21 | 4.967 | -17,16 | ||||
| 2026-03-20 | 13F/A | Hsbc Holdings Plc | Call | 600 | 66 | |||||
| 2025-11-04 | 13F | State of Wyoming | 0 | -100,00 | 0 | |||||
| 2025-11-12 | 13F | HAP Trading, LLC | Put | 39.900 | 524 | |||||
| 2026-01-28 | 13F | Crown Wealth Group, LLC | 2.604 | 0,00 | 285 | -22,83 | ||||
| 2025-11-12 | 13F | HAP Trading, LLC | Call | 50.500 | 859 | |||||
| 2026-01-12 | 13F | Defender Capital, LLC. | 100.940 | 11.034 | ||||||
| 2025-11-12 | 13F | HAP Trading, LLC | 12.630 | 1.787 | ||||||
| 2025-09-29 | NP | PXF - Invesco FTSE RAFI Developed Markets ex-U.S. ETF This fund is a listed as child fund of Invesco Ltd. and if that institution has disclosed ownership in this security, then these positions will not be double counted when calculating total shares and total value | 3.340 | 146,31 | 472 | 206,49 | ||||
| 2026-01-27 | 13F | Atlantic Edge Private Wealth Management, LLC | 1.250 | 0,00 | 137 | -22,73 | ||||
| 2026-02-06 | 13F | Meiji Yasuda Asset Management Co Ltd. | 16.741 | -7,57 | 1.830 | -28,61 | ||||
| 2026-01-16 | 13F | Ronald Blue Trust, Inc. | 1.878 | -25,95 | 205 | -42,74 | ||||
| 2026-02-11 | 13F | Parallel Advisors, LLC | 2.049 | 18,51 | 224 | -8,20 | ||||
| 2026-02-13 | 13F | Oakum Bay Capital LLC | 200 | 22 | ||||||
| 2025-10-15 | 13F | Chesapeake Asset Management Llc | 0 | -100,00 | 0 | |||||
| 2026-02-18 | 13F | CacheTech Inc. | 25.665 | 24,32 | 2.805 | -3,97 | ||||
| 2026-02-13 | 13F | JustInvest LLC | 3.185 | 2,54 | 348 | -20,73 | ||||
| 2026-01-21 | 13F | Westfuller Advisors, LLC | 18 | 0,00 | 2 | -50,00 | ||||
| 2026-02-13 | 13F | Centaurus Financial, Inc. | 10.058 | 14,95 | 1 | 0,00 | ||||
| 2026-01-14 | 13F | Spire Wealth Management | 1.200 | 0,00 | 131 | -22,49 | ||||
| 2026-02-13 | 13F | B & T Capital Management DBA Alpha Capital Management | 6.885 | 18,85 | 753 | -8,18 | ||||
| 2026-02-17 | 13F | Public Employees Retirement System Of Ohio | 106.783 | 17,63 | 11.672 | -9,12 | ||||
| 2025-11-07 | 13F | Rothschild Investment Llc | 0 | -100,00 | 0 | |||||
| 2025-11-14 | 13F | Prudential Plc | 0 | -100,00 | 0 | |||||
| 2026-02-09 | 13F | Coldstream Capital Management Inc | 3.065 | 20,43 | 335 | -7,22 | ||||
| 2026-02-05 | 13F | Td Private Client Wealth Llc | 4 | 0,00 | 0 | |||||
| 2026-02-09 | 13F/A | Fideuram - Intesa Sanpaolo Private Banking S.p.a. | 23.100 | 2.525 | ||||||
| 2025-09-29 | NP | QQQE - Direxion NASDAQ-100(R) Equal Weighted Index Shares | 82.224 | -17,41 | 11.624 | 2,38 | ||||
| 2026-01-23 | 13F | Assetmark, Inc | 65.478 | -3,27 | 7.157 | -25,27 | ||||
| 2026-02-17 | 13F | Voloridge Investment Management, Llc | 343.576 | 37.556 | ||||||
| 2026-02-06 | 13F | New Millennium Group LLC | 74 | 0,00 | 8 | -20,00 | ||||
| 2026-02-12 | 13F | Dsm Capital Partners Llc | 2.596 | 284 | ||||||
| 2026-02-17 | 13F | Mercer Global Advisors Inc /adv | 3.948 | -84,43 | 432 | -86,30 | ||||
| 2026-02-12 | 13F | Voya Investment Management Llc | 259.232 | 28,05 | 28.337 | -1,07 | ||||
| 2026-02-17 | 13F | NCP Inc. | 36 | -99,94 | 4 | -99,96 | ||||
| 2026-02-13 | 13F | Caitong International Asset Management Co., Ltd | 0 | -100,00 | 0 | |||||
| 2025-11-07 | 13F | Glaxis Capital Management, LLC | 0 | -100,00 | 0 | |||||
| 2025-11-12 | 13F | Accent Capital Management, LLC | 0 | -100,00 | 0 | -100,00 | ||||
| 2026-01-20 | 13F | Signaturefd, Llc | 20 | -37,50 | 2 | -50,00 | ||||
| 2026-01-09 | 13F | Capital CS Group, LLC | 0 | -100,00 | 0 | -100,00 | ||||
| 2026-01-15 | 13F | Trust Co | 13 | 0,00 | 1 | 0,00 | ||||
| 2026-01-07 | 13F | Hilltop National Bank | 67 | 0,00 | 7 | -22,22 | ||||
| 2026-02-11 | 13F | Twin Tree Management, LP | Call | 40.400 | -57,87 | 4.416 | -67,45 | |||
| 2026-02-12 | 13F | Steward Partners Investment Advisory, Llc | 9.816 | -4,65 | 1.073 | -26,37 | ||||
| 2026-02-11 | 13F | Twin Tree Management, LP | Put | 334.900 | -58,25 | 36.608 | -67,74 | |||
| 2026-02-13 | 13F | Heritage Wealth Advisors | 40 | 0,00 | 4 | -20,00 | ||||
| 2025-10-21 | 13F | Altfest L J & Co Inc | 0 | -100,00 | 0 | |||||
| 2026-02-06 | 13F | Creative Financial Designs Inc /adv | 1.077 | 0,00 | 118 | -23,03 | ||||
| 2026-02-11 | 13F | Twin Tree Management, LP | 141.079 | 27,22 | 15.421 | -1,71 | ||||
| 2026-01-21 | 13F | Sound Income Strategies, LLC | 17 | 0,00 | 2 | -50,00 | ||||
| 2026-02-17 | 13F | Gladstone Institutional Advisory LLC | 3.325 | -9,10 | 363 | -29,79 | ||||
| 2026-01-26 | 13F | Cwm, Llc | 130.460 | 5,19 | 14 | -17,65 | ||||
| 2026-02-12 | 13F | Principal Securities, Inc. | 0 | -100,00 | 0 | |||||
| 2026-02-11 | 13F | Vise Technologies, Inc. | 2.450 | -64,03 | 268 | -72,27 | ||||
| 2026-01-05 | 13F | GAMMA Investing LLC | 120 | -31,03 | 13 | -45,83 | ||||
| 2025-09-24 | NP | SFNNX - Schwab Fundamental International Large Company Index Fund Institutional Shares | 5.947 | 1,04 | 841 | 25,19 | ||||
| 2026-02-06 | 13F | Larson Financial Group LLC | 2.246 | 189,81 | 246 | 124,77 | ||||
| 2026-02-13 | 13F | Natixis | 118.941 | 74,60 | 13.001 | 34,89 | ||||
| 2026-02-13 | 13F | Macquarie Group Ltd | 156 | 0,00 | 17 | -22,73 | ||||
| 2026-01-15 | 13F | Sage Capital Management, LLC | 2.231 | -0,04 | 244 | -22,86 | ||||
| 2025-10-28 | 13F | Thames Capital Management Llc | 0 | -100,00 | 0 | |||||
| 2026-02-13 | 13F | Colony Group, LLC | 109.245 | 11,14 | 14.934 | 7,38 | ||||
| 2026-01-20 | 13F | Fearless Solutions, LLC dba Best Invest | 3.816 | -2,55 | 417 | -24,73 | ||||
| 2026-01-23 | 13F | Farther Finance Advisors, LLC | 17.604 | 98,24 | 1.924 | 53,18 | ||||
| 2026-01-29 | 13F | Concord Wealth Partners | 161 | 0,00 | 18 | -22,73 | ||||
| 2026-01-12 | 13F | CVA Family Office, LLC | 20 | 0,00 | 2 | 0,00 | ||||
| 2025-11-13 | 13F | GQG Partners LLC | 0 | -100,00 | 0 | |||||
| 2026-02-05 | 13F | E Fund Management (Hong Kong) Co., Ltd. | 3.147 | 2.760,91 | 337 | 2.140,00 | ||||
| 2026-02-17 | 13F | Capstone Investment Advisors, Llc | 71.582 | 646,73 | 7.825 | 476,99 | ||||
| 2026-02-17 | 13F | Capstone Investment Advisors, Llc | Put | 2.700 | -22,86 | 295 | -40,40 | |||
| 2026-02-24 | 13F | Bell Investment Advisors, Inc | 6 | -79,31 | 1 | -100,00 | ||||
| 2026-02-10 | 13F | Thoroughbred Financial Services, Llc | 8.824 | -4,60 | 1 | -100,00 | ||||
| 2026-02-02 | 13F | Sawyer & Company, Inc | 70 | 0,00 | 8 | |||||
| 2026-01-14 | 13F | UNICOM Systems, Inc. | 89.000 | 0,00 | 9.729 | -22,74 | ||||
| 2026-01-27 | 13F | TD Waterhouse Canada Inc. | 1.550 | -35,23 | 169 | -52,92 | ||||
| 2026-02-12 | 13F | Bank of Jackson Hole Trust | 0 | -100,00 | 0 | |||||
| 2026-02-05 | 13F | STF Management LP | 846 | -53,18 | 92 | -63,92 | ||||
| 2026-02-05 | 13F | Allworth Financial LP | 2.233 | -8,67 | 244 | -29,28 | ||||
| 2026-02-13 | 13F | Hurley Capital, LLC | 26 | 0,00 | 3 | -33,33 | ||||
| 2026-02-17 | 13F | Ardmore Road Asset Management LP | 10.000 | 1.093 | ||||||
| 2026-02-05 | 13F | Stephens Inc /ar/ | 6.604 | 1,30 | 722 | -21,80 | ||||
| 2026-02-12 | 13F | CMT Capital Markets Trading GmbH | 0 | -100,00 | 0 | |||||
| 2026-02-11 | 13F | Modus Advisors, LLC | 27.497 | 24,93 | 3.006 | -3,50 | ||||
| 2026-01-30 | 13F | Us Bancorp \de\ | 6.078 | -6,28 | 664 | -27,59 | ||||
| 2026-02-03 | 13F | Manning & Napier Advisors Llc | 1 | 0 | ||||||
| 2026-01-16 | 13F | First Community Trust Na | 0 | -100,00 | 0 | |||||
| 2025-11-14 | 13F | Boothbay Fund Management, Llc | Call | 0 | -100,00 | 0 | -100,00 | |||
| 2026-02-12 | 13F | Scotia Capital Inc. | 14.306 | 17,08 | 1.564 | -9,55 | ||||
| 2025-11-14 | 13F | Boothbay Fund Management, Llc | 0 | -100,00 | 0 | -100,00 | ||||
| 2026-02-05 | 13F | Pacific Heights Asset Management Llc | 275.000 | 48,65 | 30.060 | 14,84 | ||||
| 2026-02-17 | 13F | Bank Of America Corp /de/ | 2.345.553 | 30,09 | 256.392 | 0,51 | ||||
| 2026-01-08 | 13F | Adirondack Trust Co | 0 | -100,00 | 0 | |||||
| 2026-02-12 | 13F | Grey Fox Wealth Advisors, LLC | 0 | -100,00 | 0 |