Grundlæggende statistik
| Institutionelle aktier (lange) | 230.880.000 - 83,88% (ex 13D/G) - change of -17,20MM shares -6,93% MRQ |
| Institutionel værdi (lang) | $ 17.466.297 USD ($1000) |
Institutionelt ejerskab og aktionærer
Global Payments Inc. (US:GPN) har 834 institutionelle ejere og aktionærer, der har indsendt 13D/G- eller 13F-formularer til Securities Exchange Commission (SEC). Disse institutioner har i alt 230,880,000 aktier. Største aktionærer omfatter Vanguard Group Inc, BlackRock, Inc., Pzena Investment Management Llc, Harris Associates L P, State Street Corp, Barclays Plc, Synovus Financial Corp, Pinnacle Financial Partners, Inc., Ameriprise Financial Inc, and Bank Of America Corp /de/ .
Global Payments Inc. (NYSE:GPN) institutionel ejerskabsstruktur viser aktuelle positioner i virksomheden efter institutioner og fonde, samt seneste ændringer i positionsstørrelse. Større aktionærer kan omfatte individuelle investorer, investeringsforeninger, hedgefonde eller institutioner. Skema 13D angiver, at investoren besidder (eller besidder) mere end 5 % af virksomheden og har til hensigt (eller har til hensigt at) aktivt at forfølge en ændring i forretningsstrategi. Skema 13G indikerer en passiv investering på over 5%.
The share price as of April 10, 2026 is 65,44 / share. Previously, on April 11, 2025, the share price was 84,96 / share. This represents a decline of 22,98% over that period.

Fondens stemningsscore
Fund Sentiment Score (fka Ownership Accumulation Score) finder de aktier, der bliver mest købt af fonde. Det er resultatet af en sofistikeret, multi-faktor kvantitativ model, der identificerer virksomheder med de højeste niveauer af institutionel akkumulering. Scoringsmodellen bruger en kombination af den samlede stigning i oplyste ejere, ændringerne i porteføljeallokeringer i disse ejere og andre målinger. Tallet går fra 0 til 100, hvor højere tal indikerer et højere niveau af akkumulering for sine jævnaldrende, og 50 er gennemsnittet.
Opdateringsfrekvens: Dagligt
Se Ownership Explorer, som giver en liste over højest rangerende virksomheder.
AI+ Ask Fintel’s AI assistant about Global Payments Inc..
Select a question to share a public post with an AI-crafted answer.
Thinking of good questions…
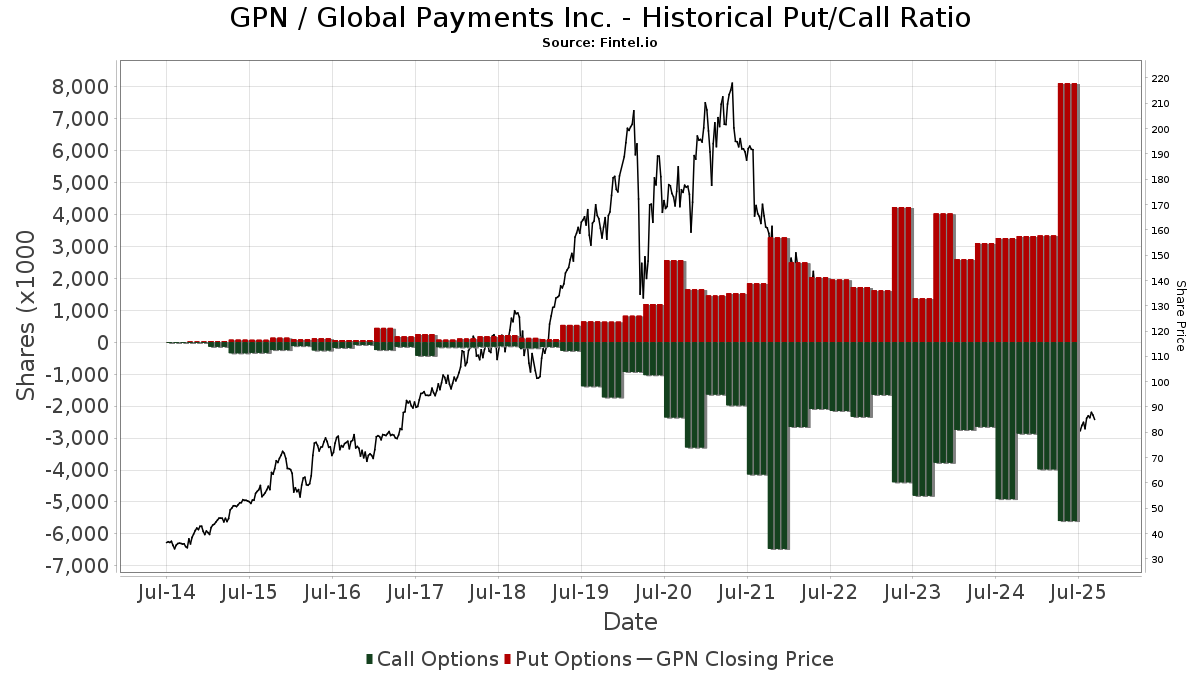
Institutionel Put/Call-forhold
Ud over at indberette standardaktie- og gældsudstedelser skal institutter med mere end 100 mill. aktiver under forvaltning også oplyse deres put- og call-optionsbeholdninger. Da salgsoptioner generelt indikerer negativ stemning, og købsoptioner indikerer positiv stemning, kan vi få en fornemmelse af den overordnede institutionelle stemning ved at plotte forholdet mellem put og kald. Diagrammet til højre viser det historiske put/call-forhold for dette instrument.
Brug af Put/Call Ratio som en indikator for investorernes stemning overvinder en af de vigtigste mangler ved at bruge totalt institutionelt ejerskab, som er, at en betydelig mængde af aktiver under forvaltning investeres passivt for at spore indekser. Passivt forvaltede fonde køber typisk ikke optioner, så indikatoren for put/call-forholdet følger mere nøje følelsen af aktivt forvaltede fonde.
13D/G-arkivering
Vi præsenterer 13D/G ansøgninger separat fra 13F ansøgninger på grund af den forskellige behandling af SEC. 13D/G-ansøgninger kan indgives af grupper af investorer (med én ledende), hvorimod 13F-ansøgninger ikke kan. Dette resulterer i situationer, hvor en investor kan indsende en 13D/G, der rapporterer én værdi for de samlede aktier (der repræsenterer alle de aktier, der ejes af investorgruppen), men derefter indsender en 13F, der rapporterer en anden værdi for de samlede aktier (der udelukkende repræsenterer deres egne) ejendomsret). Det betyder, at aktieejerskab af 13D/G-arkiver og 13F-arkiveringer ofte ikke er direkte sammenlignelige, så vi præsenterer dem separat.
Bemærk: Fra den 16. maj 2021 viser vi ikke længere ejere, der ikke har indsendt en 13D/G inden for det seneste år. Tidligere viste vi den fulde historie af 13D/G-arkiver. Generelt skal enheder, der er forpligtet til at indgive 13D/G-ansøgninger, indgive mindst årligt, før de indsender en afsluttende ansøgning. Dog forlader fonde nogle gange positioner uden at indsende en afsluttende ansøgning (dvs. de afvikler), så visning af den fulde historie resulterede nogle gange i forvirring om det nuværende ejerskab. For at undgå forvirring viser vi nu kun 'aktuelle' ejere - det vil sige - ejere, der har anmeldt inden for det seneste år.
Upgrade to unlock premium data.
| Fil dato | Form | Investor | Forrige Aktier |
Seneste Aktier |
Δ Aktier (Procent) |
Ejendomsret (Procent) |
Δ Ejerskab (Procent) |
|
|---|---|---|---|---|---|---|---|---|
| 2026-01-12 | GTCR W Aggregator LP | 43,268,041 | 15.45 |
13F og NPORT arkivering
Detaljer om 13F-arkivering er gratis. Detaljer om NP-ansøgninger kræver et premium-medlemskab. Grønne rækker angiver nye positioner. Røde rækker angiver lukkede positioner. Klik på linket ikon for at se den fulde transaktionshistorik.
Opgrader
for at låse premium-data op og eksportere til Excel ![]() .
.
Important Note
In an effort to reduce load times for our mobile users, we are testing some ways to deliver lighter pages.
In this first test, we will deliver only the most recent 750 transactions (out of 1101 for this stock). If you are interested in loading *all* the transactions for this company, click the "load all" button below. This is just a test and if you don't like it, please let us know by submitting some gentle feedback via the link at the bottom of this page.
Load All| Fil dato | Kilde | Investor | Type | Gennemsnitlig pris (Øst) |
Aktier | Δ Aktier (%) |
Rapporteret Værdi ($1000) |
Δ Værdi (%) |
Port Alloc (%) |
|
|---|---|---|---|---|---|---|---|---|---|---|
| 2026-02-17 | 13F | Silvercrest Asset Management Group Llc | 0 | -100,00 | 0 | |||||
| 2026-01-28 | 13F | Universal- Beteiligungs- und Servicegesellschaft mbH | 217.879 | 15,60 | 17.012 | 8,64 | ||||
| 2026-02-17 | 13F | D. E. Shaw & Co., Inc. | Call | 6.700 | -75,09 | 519 | -76,81 | |||
| 2026-02-05 | 13F | iA Global Asset Management Inc. | 32.680 | 5,41 | 3 | 0,00 | ||||
| 2026-02-17 | 13F | D. E. Shaw & Co., Inc. | Put | 21.200 | -67,58 | 1.641 | -69,81 | |||
| 2026-02-10 | 13F | Core Wealth Advisors, Llc | 12 | 1 | ||||||
| 2026-02-17 | 13F | Dean Investment Associates, Llc | 34.725 | -0,56 | 2.688 | -7,38 | ||||
| 2026-01-20 | 13F | Princeton Global Asset Management LLC | 41 | 0,00 | 3 | 0,00 | ||||
| 2025-11-07 | 13F | HighTower Advisors, LLC | Put | 0 | -100,00 | 0 | -100,00 | |||
| 2026-01-14 | 13F | Exchange Traded Concepts, Llc | 731 | -4,69 | 57 | -11,11 | ||||
| 2026-02-11 | 13F | Fjarde Ap-fonden /fourth Swedish National Pension Fund | 45.360 | 3.511 | ||||||
| 2026-04-02 | 13F | Aspect Partners, LLC | 23 | -11,54 | 2 | -50,00 | ||||
| 2026-03-31 | 13F | Hamrick Investment Counsel, llc | 903 | 70 | ||||||
| 2026-02-11 | 13F | Athena Investment Management | 2.702 | 0,00 | 209 | -6,70 | ||||
| 2026-01-20 | 13F | Red Door Wealth Management, LLC | 0 | -100,00 | 0 | |||||
| 2026-02-13 | 13F | Citigroup Inc | 219.107 | -7,19 | 16.959 | -13,54 | ||||
| 2026-01-07 | 13F | Private Client Services, Llc | 0 | -100,00 | 0 | -100,00 | ||||
| 2026-02-17 | 13F | D. E. Shaw & Co., Inc. | 716.144 | -64,50 | 55.430 | -66,93 | ||||
| 2026-02-10 | 13F | Adapt Wealth Advisors, Llc | 2.638 | -1,49 | 204 | -8,11 | ||||
| 2026-02-06 | 13F | Handelsbanken Fonder AB | 88.820 | 71,85 | 7 | 50,00 | ||||
| 2026-01-26 | 13F | Chicago Capital, LLC | 33.260 | -0,86 | 2.574 | -7,64 | ||||
| 2026-02-12 | 13F | BlackRock, Inc. | 19.687.339 | -1,22 | 1.523.800 | -7,97 | ||||
| 2026-02-17 | 13F | Tcw Group Inc | 3.838 | 297 | ||||||
| 2026-02-11 | 13F | Picton Mahoney Asset Management | 10.166 | -7,31 | 787 | |||||
| 2026-02-10 | 13F | Norges Bank | 3.566.068 | 276.014 | ||||||
| 2026-02-17 | 13F | Blair William & Co/il | 0 | -100,00 | 0 | |||||
| 2026-02-18 | 13F | State of Tennessee, Treasury Department | 64.836 | -28,43 | 4.651 | -38,20 | ||||
| 2026-01-26 | 13F | JNBA Financial Advisors | 100 | 0,00 | 8 | -12,50 | ||||
| 2026-02-26 | 13F/A | Sculptor Capital LP | 0 | -100,00 | 0 | |||||
| 2026-02-17 | 13F | Caption Management, LLC | 0 | -100,00 | 0 | |||||
| 2026-01-27 | 13F | VCI Wealth Management LLC | 13.155 | 1.018 | ||||||
| 2026-02-17 | 13F | Caption Management, LLC | Call | 0 | -100,00 | 0 | ||||
| 2026-01-29 | 13F | Nbc Securities, Inc. | 257 | 7,08 | 20 | 0,00 | ||||
| 2026-02-12 | 13F | Skandinaviska Enskilda Banken AB (publ) | 48.249 | -1,20 | 3.734 | -7,96 | ||||
| 2026-02-13 | 13F | Towarzystwo Funduszy Inwestycyjnych Pzu Sa | 0 | -100,00 | 0 | |||||
| 2026-01-27 | 13F | Greatmark Investment Partners, Inc. | 52.401 | 2,88 | 4.056 | -4,16 | ||||
| 2026-02-12 | 13F | Penserra Capital Management LLC | 138.436 | -9,80 | 11 | -16,67 | ||||
| 2026-02-13 | 13F | Kilter Group LLC | 14 | -30,00 | 1 | 0,00 | ||||
| 2026-03-09 | 13F | Flax Pond Capital, Llc | 61.110 | 4.730 | ||||||
| 2026-04-09 | 13F | Moody National Bank Trust Division | 3.267 | -19,03 | 220 | -29,81 | ||||
| 2026-02-17 | 13F | North Capital, Inc. | 0 | -100,00 | 0 | |||||
| 2026-02-17 | 13F | DV Trading LLC | 3 | 0 | ||||||
| 2026-02-17 | 13F | Royal Bank Of Canada | Call | 624.600 | 0,00 | 48.344 | -6,84 | |||
| 2026-02-10 | 13F | Daiwa Securities Group Inc. | 38.669 | -10,02 | 3 | -33,33 | ||||
| 2026-02-17 | 13F | Royal Bank Of Canada | 1.321.906 | 3,30 | 102.317 | -3,76 | ||||
| 2026-01-28 | 13F | Teacher Retirement System Of Texas | 8.051 | -74,81 | 623 | -76,53 | ||||
| 2026-01-30 | 13F | Samalin Investment Counsel, LLC | 0 | -100,00 | 0 | |||||
| 2025-11-12 | 13F | NewSquare Capital LLC | 0 | -100,00 | 0 | |||||
| 2026-02-06 | 13F | Twin Capital Management Inc | 14.938 | 110,36 | 1.156 | 96,26 | ||||
| 2026-01-21 | 13F | Oak Thistle LLC | 21.157 | 210,77 | 1.638 | 189,73 | ||||
| 2026-02-12 | 13F | BRYN MAWR TRUST Co | 26.749 | -20,72 | 2.070 | -26,15 | ||||
| 2026-02-19 | 13F | Invesco Ltd. | 3.326.615 | 14,10 | 257.480 | 6,30 | ||||
| 2026-02-17 | 13F | Royal Bank Of Canada | Put | 346.300 | -22,42 | 26.804 | -27,73 | |||
| 2026-02-17 | 13F | NEOS Investment Management LLC | 36.087 | 17,77 | 2.793 | 9,74 | ||||
| 2026-02-13 | 13F | Great West Life Assurance Co /can/ | 218.365 | -30,24 | 17 | -40,74 | ||||
| 2026-02-17 | 13F | Lazard Asset Management Llc | 1.209.742 | 5,96 | 93.634 | -1,28 | ||||
| 2026-02-03 | 13F | Crossmark Global Holdings, Inc. | 8.213 | 3,18 | 636 | -3,93 | ||||
| 2026-02-10 | 13F | Principia Wealth Advisory, LLC | 12 | -98,54 | 1 | -100,00 | ||||
| 2026-01-13 | 13F | Value Holdings Management Co. Llc | 215.412 | -24,39 | 17 | -30,43 | ||||
| 2026-02-17 | 13F | Sora Investors Llc | 252.912 | 342,59 | 19.575 | 312,37 | ||||
| 2026-02-17 | 13F | Sender Co & Partners, Inc. | 0 | -100,00 | 0 | |||||
| 2026-02-17 | 13F | Sender Co & Partners, Inc. | Call | 0 | -100,00 | 0 | ||||
| 2026-02-02 | 13F | CENTRAL TRUST Co | 117 | -63,66 | 9 | -65,38 | ||||
| 2026-02-13 | 13F | Diametric Capital, LP | 10.866 | 841 | ||||||
| 2026-01-29 | 13F | State Of Michigan Retirement System | 69.678 | -3,20 | 5.393 | -9,80 | ||||
| 2025-11-12 | 13F | Westfield Capital Management Co Lp | 0 | -100,00 | 0 | |||||
| 2026-02-13 | 13F | Candriam Luxembourg S.C.A. | 18.656 | 0,00 | 1.444 | -6,78 | ||||
| 2026-02-17 | 13F | Toronto Dominion Bank | 782.547 | 29,34 | 60.569 | 20,50 | ||||
| 2026-02-06 | 13F | ProShare Advisors LLC | 61.565 | 24,58 | 4.765 | 16,08 | ||||
| 2026-02-17 | 13F | Lombard Odier Asset Management (Europe) Ltd | 54.250 | -37,64 | 4.199 | -41,91 | ||||
| 2026-01-21 | 13F | Clayton Financial Group LLC | 14 | 1 | ||||||
| 2026-02-13 | 13F | Ossiam | 65.655 | 385,29 | 5.082 | 352,45 | ||||
| 2026-02-12 | 13F | State Board Of Administration Of Florida Retirement System | 215.021 | -1,46 | 16.643 | -8,20 | ||||
| 2025-10-30 | 13F | Twin Peaks Wealth Advisors, LLC | 0 | -100,00 | 0 | |||||
| 2026-02-12 | 13F | Hm Payson & Co | 975 | -18,75 | 75 | -24,24 | ||||
| 2026-02-13 | 13F | JustInvest LLC | 18.426 | -14,51 | 1.426 | -20,38 | ||||
| 2026-02-12 | 13F | Loomis Sayles & Co L P | 176.842 | 4,56 | 13.688 | -2,59 | ||||
| 2026-02-17 | 13F | Sagewood Asset Management LP | 3.914 | 303 | ||||||
| 2026-02-18 | 13F | First Citizens Bank & Trust Co | 2.743 | -4,99 | 212 | -11,30 | ||||
| 2026-01-23 | 13F | Portman Square Capital LLP | 0 | -100,00 | 0 | -100,00 | ||||
| 2026-02-10 | 13F | Westpac Banking Corp | 57.182 | 5.795,05 | 4.426 | 5.431,25 | ||||
| 2026-01-30 | 13F | Levin Capital Strategies, L.p. | 11.500 | 890 | ||||||
| 2026-02-11 | 13F | Invst, LLC | 11.978 | -37,05 | 927 | -41,33 | ||||
| 2026-02-12 | 13F | South Dakota Investment Council | 176.556 | -1,01 | 14 | -7,14 | ||||
| 2025-11-12 | 13F | Creekmur Asset Management LLC | 22 | 2 | ||||||
| 2026-01-14 | 13F | ORG Partners LLC | 85 | 32,81 | 7 | 20,00 | ||||
| 2026-02-17 | 13F | Wealth Watch Advisors, INC | 0 | -100,00 | 0 | |||||
| 2026-02-17 | 13F | Steamboat Capital Partners, LLC | 136.140 | -0,29 | 10.537 | -7,11 | ||||
| 2026-02-17 | 13F | Advisor Group Holdings, Inc. | 23.900 | -8,04 | 1.851 | -18,32 | ||||
| 2026-02-03 | 13F | Bokf, Na | 13.330 | -12,53 | 1.032 | -18,56 | ||||
| 2026-01-15 | 13F | Retirement Systems of Alabama | 50.365 | -2,68 | 3.898 | -9,33 | ||||
| 2026-01-23 | 13F | Sumitomo Mitsui Trust Holdings, Inc. | 591.883 | -2,05 | 45.812 | -8,75 | ||||
| 2026-02-09 | 13F | Coldstream Capital Management Inc | 2.687 | -1,83 | 208 | -8,81 | ||||
| 2026-02-13 | 13F | Colony Group, LLC | 23.410 | -64,74 | 1.872 | -63,02 | ||||
| 2026-02-12 | 13F | Conservest Capital Advisors, Inc. | 2.920 | 0,00 | 226 | -6,61 | ||||
| 2026-02-17 | 13F | AIMZ Investment Advisors, LLC | 0 | -100,00 | 0 | |||||
| 2026-02-11 | 13F | Janney Montgomery Scott LLC | 22.021 | -17,89 | 2 | -50,00 | ||||
| 2026-02-13 | 13F | Landscape Capital Management, L.l.c. | 0 | -100,00 | 0 | -100,00 | ||||
| 2026-02-13 | 13F | Marshall Wace, Llp | 960.166 | 74.317 | ||||||
| 2026-02-13 | 13F | Southeast Asset Advisors Inc. | 0 | -100,00 | 0 | |||||
| 2025-11-14 | 13F | WealthTrak Capital Management LLC | 0 | -100,00 | 0 | -100,00 | ||||
| 2025-11-12 | 13F | Transce3nd, LLC | 0 | -100,00 | 0 | |||||
| 2026-01-14 | 13F | Romano Brothers And Company | 41.327 | -16,37 | 3.199 | -22,19 | ||||
| 2026-02-13 | 13F | FORA Capital, LLC | 10.895 | 939 | ||||||
| 2026-02-13 | 13F | FJ Capital Management LLC | 0 | -100,00 | 0 | |||||
| 2026-02-17 | 13F | Brevan Howard Capital Management LP | 6.699 | -19,06 | 519 | -24,60 | ||||
| 2026-01-16 | 13F | FNY Investment Advisers, LLC | Call | 0 | -100,00 | 0 | ||||
| 2026-02-13 | 13F | Parkside Financial Bank & Trust | 683 | 473,95 | 53 | 477,78 | ||||
| 2026-02-17 | 13F | Raymond James Financial Inc | 237.942 | -1,25 | 18.417 | -8,01 | ||||
| 2025-11-14 | 13F | Wetherby Asset Management Inc | 40.486 | 0,77 | 3.364 | 4,60 | ||||
| 2025-11-13 | 13F | Meiji Yasuda Life Insurance Co | 0 | -100,00 | 0 | |||||
| 2025-11-10 | 13F | Prestige Wealth Management Group LLC | 0 | -100,00 | 0 | |||||
| 2026-02-06 | 13F | Leonteq Securities AG | 3.015 | -19,28 | 233 | -24,84 | ||||
| 2025-11-07 | 13F | Synovus Financial Corp | 7.653.761 | -0,80 | 635.876 | 2,97 | ||||
| 2026-01-28 | 13F | Mowery & Schoenfeld Wealth Management, LLC | 23 | 2 | ||||||
| 2025-11-14 | 13F | Wolverine Trading, Llc | 0 | -100,00 | 0 | -100,00 | ||||
| 2026-02-11 | 13F | MidWestOne Financial Group, Inc. | 30.157 | -48,22 | 2.334 | -51,76 | ||||
| 2026-02-17 | 13F | Farringdon Capital, Ltd. | 27.028 | 141,62 | 2.092 | 125,08 | ||||
| 2026-01-23 | 13F | Private Wealth Management Group, LLC | 58 | -34,09 | 4 | -42,86 | ||||
| 2026-02-13 | 13F | Blueshift Asset Management, LLC | 4.380 | 339 | ||||||
| 2026-02-09 | 13F | MTM Investment Management, LLC | 621 | 0,00 | 48 | -5,88 | ||||
| 2025-11-20 | 13F | Centaurus Financial, Inc. | 0 | -100,00 | 0 | |||||
| 2026-04-07 | 13F | Farther Finance Advisors, LLC | 1.919 | 36,58 | 125 | 15,74 | ||||
| 2026-02-12 | 13F | Commonwealth Equity Services, Llc | 17.188 | 81,44 | 1.330 | |||||
| 2025-11-14 | 13F | Binnacle Investments Inc | 8 | 1 | ||||||
| 2026-02-09 | 13F | Fisher Asset Management, LLC | 13.890 | -25,60 | 1.075 | -30,69 | ||||
| 2025-11-13 | 13F | Acadian Asset Management Llc | 0 | -100,00 | 0 | |||||
| 2026-02-17 | 13F | Mercer Global Advisors Inc /adv | 14.449 | 6,44 | 1.118 | -0,80 | ||||
| 2026-02-11 | 13F | LPL Financial LLC | 138.511 | 1,73 | 10.721 | -5,23 | ||||
| 2026-04-10 | 13F | Linden Thomas Advisory Services, LLC | 9.743 | 54,14 | 656 | 33,95 | ||||
| 2026-01-21 | 13F | Edmp, Inc. | 9.233 | -23,91 | 715 | -29,17 | ||||
| 2025-11-04 | 13F | ASB Consultores, LLC | 0 | -100,00 | 0 | -100,00 | ||||
| 2026-02-12 | 13F | Empirical Finance, LLC | 9.079 | -4,20 | 703 | -10,80 | ||||
| 2026-02-06 | 13F | EverSource Wealth Advisors, LLC | 2.012 | 56,45 | 156 | 46,23 | ||||
| 2026-02-13 | 13F | Walleye Trading LLC | 7.827 | -91,27 | 606 | -91,88 | ||||
| 2026-02-17 | 13F | Norinchukin Bank, The | 14.564 | 5,03 | 1.127 | -2,09 | ||||
| 2025-11-06 | 13F | Whipplewood Advisors, LLC | 0 | -100,00 | 0 | -100,00 | ||||
| 2026-01-30 | 13F | Oakworth Capital, Inc. | 11.313 | 0,37 | 876 | -6,52 | ||||
| 2026-02-12 | 13F | Empower Advisory Group, LLC | 0 | -100,00 | 0 | |||||
| 2026-02-18 | 13F | Garton & Associates Financial Advisors LLC | 9 | 1 | ||||||
| 2026-02-17 | 13F | Zacks Investment Management | 0 | -100,00 | 0 | |||||
| 2026-02-13 | 13F | Walleye Trading LLC | Put | 112.200 | 33,25 | 8.684 | 24,15 | |||
| 2026-02-11 | 13F | Cerity Partners LLC | 37.827 | 17,52 | 2.928 | 9,46 | ||||
| 2026-02-13 | 13F | Walleye Trading LLC | Call | 59.200 | 630,86 | 4.582 | 581,85 | |||
| 2026-02-18 | 13F/A | Fuller & Thaler Asset Management, Inc. | 289.369 | -8,37 | 22.397 | -14,64 | ||||
| 2026-02-17 | 13F | Oxford Asset Management Llp | 4.156 | 40,64 | 322 | -18,53 | ||||
| 2026-02-04 | 13F | Swiss Life Asset Management Ltd | 20.511 | -8,85 | 1.588 | -15,09 | ||||
| 2026-02-06 | 13F | Creative Financial Designs Inc /adv | 115 | 0,00 | 9 | -11,11 | ||||
| 2026-02-02 | 13F | Equitable Trust Co | 47.187 | -41,89 | 3.652 | -45,86 | ||||
| 2026-02-11 | 13F | Harvest Fund Management Co., Ltd | 0 | -100,00 | 0 | |||||
| 2026-02-12 | 13F | Foster Dykema Cabot & Partners, Llc | 0 | -100,00 | 0 | |||||
| 2026-01-23 | 13F | Robeco Institutional Asset Management B.V. | 100.725 | -23,52 | 7.796 | -28,75 | ||||
| 2026-01-16 | 13F | First Community Trust Na | 194 | 0,00 | 15 | -6,25 | ||||
| 2025-11-17 | 13F | Kestra Investment Management, LLC | 0 | -100,00 | 0 | -100,00 | ||||
| 2026-01-27 | 13F | Regions Financial Corp | 49.033 | -7,45 | 3.795 | -13,77 | ||||
| 2026-02-17 | 13F | Parallax Volatility Advisers, L.P. | 36.880 | -2,04 | 2.855 | -8,73 | ||||
| 2026-01-26 | 13F | Mirae Asset Global Investments Co., Ltd. | 39.217 | 17,19 | 3.035 | 9,17 | ||||
| 2026-02-04 | 13F | Clark Wealth Partners | 12 | 0,00 | 1 | |||||
| 2026-02-06 | 13F | Fairtree Asset Management (Pty) Ltd | 19.153 | 21,39 | 1.482 | 13,13 | ||||
| 2026-02-04 | 13F | C WorldWide Group Holding A/S | 93.912 | -1,45 | 7 | 0,00 | ||||
| 2026-01-30 | 13F | Us Bancorp \de\ | 31.846 | -16,27 | 2.465 | -22,00 | ||||
| 2026-02-06 | 13F | Resona Asset Management Co.,Ltd. | 70.687 | -8,04 | 5.505 | -14,36 | ||||
| 2026-02-02 | 13F | New England Capital Financial Advisors LLC | 1.771 | 0,00 | 137 | -6,80 | ||||
| 2026-01-20 | 13F | Cigna Investments Inc /new | 0 | -100,00 | 0 | |||||
| 2026-02-11 | 13F | Buckingham Strategic Partners | 5.852 | 7,24 | 453 | 5,12 | ||||
| 2026-02-13 | 13F | Schroder Investment Management Group | 20.123 | -6,34 | 1.558 | -12,72 | ||||
| 2026-02-02 | 13F | Danske Bank A/s | 180.179 | -2,65 | 13.946 | -9,31 | ||||
| 2026-02-17 | 13F | Jump Financial, LLC | 42.447 | 985,88 | 3.285 | 913,89 | ||||
| 2026-02-17 | 13F | Cetera Investment Advisers | 26.844 | -12,81 | 2.078 | -18,77 | ||||
| 2026-02-17 | 13F | Private Advisor Group, LLC | 0 | -100,00 | 0 | |||||
| 2026-02-13 | 13F | Transamerica Financial Advisors, Inc. | 24 | 2 | ||||||
| 2026-02-13 | 13F | Ostrum Asset Management | 2.890 | -24,90 | 224 | -30,09 | ||||
| 2026-02-13 | 13F | State Street Corp | 10.365.416 | -1,22 | 802.283 | -7,98 | ||||
| 2026-02-06 | 13F | Advisory Alpha, LLC | 3.175 | 9,82 | 246 | -1,61 | ||||
| 2026-01-15 | 13F | Nisa Investment Advisors, Llc | 86.579 | 7,49 | 6.701 | 0,15 | ||||
| 2026-02-06 | 13F | McKinley Carter Wealth Services, Inc. | 3.808 | 0,11 | 295 | -6,96 | ||||
| 2026-02-17 | 13F | ExodusPoint Capital Management, LP | 0 | -100,00 | 0 | -100,00 | ||||
| 2026-02-12 | 13F | UniSuper Management Pty Ltd | 31.197 | -6,81 | 2.415 | -13,20 | ||||
| 2026-02-17 | 13F | Tudor Investment Corp Et Al | Put | 3.700 | -92,54 | 286 | -93,06 | |||
| 2026-02-13 | 13F | Icon Advisers Inc/co | 24.766 | -34,38 | 1.917 | -38,88 | ||||
| 2026-02-17 | 13F | Capstone Investment Advisors, Llc | 0 | -100,00 | 0 | -100,00 | ||||
| 2026-02-17 | 13F | Tudor Investment Corp Et Al | Call | 38.500 | -54,65 | 2.980 | -57,76 | |||
| 2026-02-17 | 13F | Capstone Investment Advisors, Llc | Call | 0 | -100,00 | 0 | -100,00 | |||
| 2026-02-17 | 13F | Capstone Investment Advisors, Llc | Put | 0 | -100,00 | 0 | -100,00 | |||
| 2026-01-12 | 13F | Rialto Wealth Management, LLC | 4 | -75,00 | 0 | -100,00 | ||||
| 2026-01-16 | 13F | Louisiana State Employees Retirement System | 12.100 | -4,72 | 937 | -11,28 | ||||
| 2026-02-18 | 13F | GWM Advisors LLC | 0 | -100,00 | 0 | |||||
| 2026-01-27 | 13F | GHP Investment Advisors, Inc. | 31.358 | -2,61 | 2.427 | -9,24 | ||||
| 2026-02-14 | 13F | POM Investment Strategies, LLC | 336 | 0,00 | 26 | -3,70 | ||||
| 2026-02-13 | 13F | Squarepoint Ops LLC | Put | 43.100 | -50,46 | 3.336 | -53,85 | |||
| 2026-02-13 | 13F | Squarepoint Ops LLC | 29.328 | 353,22 | 2.270 | 322,53 | ||||
| 2026-01-23 | 13F | Assetmark, Inc | 14.430 | 42,29 | 1.117 | 32,54 | ||||
| 2026-02-09 | 13F | First National Trust Co | 3.258 | -7,23 | 252 | -13,40 | ||||
| 2026-01-15 | 13F | Allspring Global Investments Holdings, LLC | 10.879 | -7,09 | 822 | -17,57 | ||||
| 2026-02-13 | 13F | Squarepoint Ops LLC | Call | 54.700 | -53,49 | 4.234 | -56,67 | |||
| 2026-02-10 | 13F | Mutual Of America Capital Management Llc | 25.422 | -3,33 | 1.968 | -9,94 | ||||
| 2026-02-12 | 13F | Keel Point, LLC | 3.085 | -20,73 | 239 | -26,32 | ||||
| 2026-01-27 | 13F | First Horizon Corp | 59 | 0,00 | 5 | 0,00 | ||||
| 2026-02-10 | 13F | Savant Capital, LLC | 34.907 | -1,35 | 2.702 | -8,10 | ||||
| 2026-02-17 | 13F | Two Sigma Securities, Llc | 0 | -100,00 | 0 | |||||
| 2026-02-13 | 13F | Brant Point Investment Management Llc | 22.262 | 0,00 | 1.723 | -6,81 | ||||
| 2026-02-17 | 13F | Altshuler Shaham Ltd | 303 | 12,22 | 23 | 4,55 | ||||
| 2025-10-14 | 13F | Coho Partners, Ltd. | 191.311 | -43,11 | 15.894 | -40,95 | ||||
| 2026-02-02 | 13F | Core Alternative Capital | 0 | -100,00 | 0 | |||||
| 2026-04-02 | 13F | Byrne Asset Management LLC | 0 | -100,00 | 0 | |||||
| 2026-02-12 | 13F | Saiph Capital, LLC | 0 | -100,00 | 0 | |||||
| 2026-02-12 | 13F | Lansforsakringar Fondforvaltning AB (publ) | 84.737 | -1,73 | 6.559 | -8,45 | ||||
| 2026-01-12 | 13F | CVA Family Office, LLC | 302 | 3,07 | 23 | -4,17 | ||||
| 2026-02-17 | 13F | Freestone Grove Partners LP | 12.351 | 956 | ||||||
| 2026-02-09 | 13F | Morningstar Investment Management LLC | 0 | -100,00 | 0 | |||||
| 2026-02-17 | 13F | Northern Trust Corp | 2.675.925 | 1,74 | 207.117 | -5,21 | ||||
| 2026-01-16 | 13F | Tema Etfs Llc | 4.329 | 12,27 | 335 | 4,69 | ||||
| 2026-02-11 | 13F | Fox Run Management, L.l.c. | 12.521 | -23,73 | 969 | -28,91 | ||||
| 2026-02-11 | 13F | Vestcor Inc | 4.235 | 0,00 | 0 | |||||
| 2026-01-23 | 13F | Steigerwald, Gordon & Koch Inc. | 16 | 0,00 | 1 | 0,00 | ||||
| 2026-02-24 | 13F | DGS Capital Management, LLC | 2.967 | 230 | ||||||
| 2026-02-11 | 13F | Jpmorgan Chase & Co | Put | 57.400 | 0,00 | 4.443 | -6,84 | |||
| 2025-11-14 | 13F | Occudo Quantitative Strategies Lp | 0 | -100,00 | 0 | -100,00 | ||||
| 2026-04-08 | 13F | Systrade AG | 20.000 | 0,00 | 1.346 | -13,05 | ||||
| 2026-01-28 | 13F | Davis Capital Management | 4 | 33,33 | 0 | |||||
| 2026-02-11 | 13F | Jpmorgan Chase & Co | 456.784 | 1,29 | 35.355 | -5,65 | ||||
| 2025-11-12 | 13F | Andra AP-fonden | 0 | -100,00 | 0 | |||||
| 2026-02-11 | 13F | Jpmorgan Chase & Co | Call | 57.400 | 0,00 | 4.443 | -6,84 | |||
| 2026-02-10 | 13F | Bnp Paribas Arbitrage, Sa | 885.528 | 18,93 | 68.540 | 10,80 | ||||
| 2025-11-13 | 13F | Magnetar Financial LLC | 0 | -100,00 | 0 | -100,00 | ||||
| 2026-02-05 | 13F | Pinnacle Associates Ltd | 4.848 | 375 | ||||||
| 2026-02-10 | 13F | Bnp Paribas Arbitrage, Sa | Put | 47 | 0,00 | 364 | -6,92 | |||
| 2026-02-10 | 13F | Bnp Paribas Arbitrage, Sa | Call | 253 | 0,00 | 1.958 | -6,81 | |||
| 2026-02-10 | 13F | Fideuram Asset Management (Ireland) dac | 222 | 24 | ||||||
| 2025-11-06 | 13F | BlueChip Wealth Advisors LLC | 0 | -100,00 | 0 | |||||
| 2026-02-11 | 13F | Meeder Advisory Services, Inc. | 4.119 | 319 | ||||||
| 2026-02-13 | 13F | Neuberger Berman Group LLC | 18.962 | 12,78 | 1.468 | 5,09 | ||||
| 2026-02-17 | 13F | Clear Street Markets Llc | 351 | -50,35 | 27 | -53,45 | ||||
| 2026-02-13 | 13F | Toroso Investments, LLC | 52.264 | 59,00 | 4.045 | 48,17 | ||||
| 2026-01-21 | 13F | Raleigh Capital Management Inc. | 0 | -100,00 | 0 | -100,00 | ||||
| 2025-10-31 | 13F | Symphony Financial, Ltd. Co. | 0 | -100,00 | 0 | -100,00 | ||||
| 2025-10-17 | 13F | Institute for Wealth Management, LLC. | 0 | -100,00 | 0 | -100,00 | ||||
| 2026-02-05 | 13F | AlphaCore Capital LLC | 8.778 | 31,74 | 679 | 22,78 | ||||
| 2025-10-15 | 13F | Silver Lake Advisory, LLC | 0 | -100,00 | 0 | -100,00 | ||||
| 2026-02-06 | 13F | Tortoise Investment Management, LLC | 0 | -100,00 | 0 | |||||
| 2026-02-17 | 13F | Palogic Value Management, L.P. | 0 | -100,00 | 0 | |||||
| 2025-10-24 | 13F | Hemington Wealth Management | 204 | 35,10 | 0 | |||||
| 2026-02-17 | 13F | Two Sigma Advisers, Lp | 0 | -100,00 | 0 | -100,00 | ||||
| 2026-02-12 | 13F | Jane Street Group, Llc | Call | 128.300 | 2,15 | 9.930 | -4,83 | |||
| 2026-02-12 | 13F | Jane Street Group, Llc | 11.014 | -25,21 | 852 | -30,34 | ||||
| 2026-02-12 | 13F | Jane Street Group, Llc | Put | 197.400 | 436,41 | 15.279 | 399,77 | |||
| 2026-02-17 | 13F | Aqr Capital Management Llc | 607.598 | -8,23 | 47.028 | -14,51 | ||||
| 2026-04-06 | 13F | Miller Global Investments, LLC | 2.779 | 0,00 | 187 | -13,02 | ||||
| 2026-02-03 | 13F | Mitsubishi UFJ Kokusai Asset Management Co., Ltd. | 499.761 | 0,12 | 37.747 | -8,98 | ||||
| 2026-02-05 | 13F | Northwestern Mutual Investment Management Company, Llc | 7.565 | -2,16 | 586 | -8,88 | ||||
| 2026-01-27 | 13F | Bayforest Capital Ltd | 1.240 | 96 | ||||||
| 2026-02-09 | 13F | Prospera Financial Services Inc | 6.403 | -5,74 | 496 | -12,23 | ||||
| 2026-02-06 | 13F | Motco | 59 | 0,00 | 5 | 0,00 | ||||
| 2026-01-20 | 13F | Stratos Wealth Partners, LTD. | 3.076 | 0,00 | 238 | -6,67 | ||||
| 2026-02-05 | 13F | AustralianSuper Pty Ltd | 490.016 | 128,73 | 37.927 | 113,10 | ||||
| 2026-01-29 | 13F | UMA Financial Services, Inc. | 100 | -35,48 | 8 | -41,67 | ||||
| 2026-02-13 | 13F | Aviso Financial Inc. | 0 | -100,00 | 0 | |||||
| 2026-02-10 | 13F | Peapack Gladstone Financial Corp | 20.981 | 6,61 | 2 | 0,00 | ||||
| 2026-01-30 | 13F | Laurel Wealth Advisors LLC | 277 | 21 | ||||||
| 2026-01-26 | 13F | KBC Group NV | 52.171 | -3,03 | 4 | 0,00 | ||||
| 2026-02-10 | 13F | Kentucky Retirement Systems | 15.328 | 0,00 | 1.186 | -6,83 | ||||
| 2026-02-27 | 13F/A | Howard Bailey Securities, Llc | 0 | -100,00 | 0 | |||||
| 2026-01-27 | 13F | Osborne Partners Capital Management, Llc | 103.651 | 0,85 | 8.023 | -6,04 | ||||
| 2026-02-17 | 13F | Elequin Capital Lp | 161 | 12 | ||||||
| 2026-01-23 | 13F | State of Alaska, Department of Revenue | 23.818 | -8,98 | 2 | -50,00 | ||||
| 2026-02-17 | 13F | Capitolis Liquid Global Markets LLC | 122.553 | 9,91 | 9.486 | 2,40 | ||||
| 2026-02-17 | 13F | Guggenheim Capital Llc | 9.491 | -31,71 | 735 | -36,40 | ||||
| 2026-02-06 | 13F | Cullen/frost Bankers, Inc. | 1.074 | 842,11 | 83 | 822,22 | ||||
| 2026-02-11 | 13F | CLARET ASSET MANAGEMENT Corp | 2.906 | -0,24 | 0 | |||||
| 2026-01-23 | 13F | Tectonic Advisors Llc | 5.230 | 7,97 | 405 | 0,50 | ||||
| 2026-02-06 | 13F | GPS Wealth Strategies Group, LLC | 0 | -100,00 | 0 | |||||
| 2025-11-05 | 13F | Carlson Capital L P | 0 | -100,00 | 0 | -100,00 | ||||
| 2026-01-12 | 13F | Schaper Benz & Wise Investment Counsel Inc/wi | 79.267 | -6,47 | 6.135 | -12,87 | ||||
| 2026-02-17 | 13F | Man Group plc | 115.537 | 3.820,50 | 8.943 | 3.564,75 | ||||
| 2026-02-10 | 13F | Reinhart Partners, Inc. | 51.327 | -27,26 | 3.973 | -32,24 | ||||
| 2026-02-17 | 13F | Snowden Capital Advisors LLC | 10.985 | 850 | ||||||
| 2026-02-11 | 13F | Metis Global Partners, LLC | 7.566 | -8,45 | 586 | -14,72 | ||||
| 2026-02-17 | 13F | Price T Rowe Associates Inc /md/ | 1.073.172 | -8,24 | 83 | -14,43 | ||||
| 2026-02-17 | 13F | Creative Planning | 71.718 | 40,99 | 5.551 | 31,36 | ||||
| 2026-02-04 | 13F | Marco Investment Management Llc | 43.472 | -3,14 | 3.365 | -9,76 | ||||
| 2026-02-12 | 13F | Elevated Private Wealth, LLC | 13.577 | 1.051 | ||||||
| 2025-10-30 | 13F | Traub Capital Management LLC | 0 | -100,00 | 0 | |||||
| 2026-02-18 | 13F | Mackenzie Financial Corp | 284.408 | 3,48 | 22.512 | -1,41 | ||||
| 2026-02-11 | 13F | Parallel Advisors, LLC | 2.314 | 25,49 | 179 | 16,99 | ||||
| 2026-02-17 | 13F | Aster Capital Management (DIFC) Ltd | 0 | -100,00 | 0 | |||||
| 2026-04-10 | 13F | Armstrong Advisory Group, Inc | 303 | 1,00 | 20 | -13,04 | ||||
| 2026-02-13 | 13F | Public Employees Retirement Association Of Colorado | 22.805 | 0,00 | 2 | 0,00 | ||||
| 2026-02-12 | 13F | Ensign Peak Advisors, Inc | 32.914 | -38,95 | 2.548 | -43,13 | ||||
| 2026-02-17 | 13F | Palogic Value Management, L.P. | Call | 35.000 | 2.709 | |||||
| 2026-01-09 | 13F | Assenagon Asset Management S.A. | 1.207.277 | 117,29 | 93.443 | 102,44 | ||||
| 2026-02-17 | 13F | SummitTX Capital, L.P. | 8.728 | 676 | ||||||
| 2026-02-17 | 13F | Vinva Investment Management Ltd | 633.595 | 72,16 | 50.816 | 57,63 | ||||
| 2026-04-08 | 13F | NorthCrest Asset Manangement, LLC | 0 | -100,00 | 0 | |||||
| 2026-01-21 | 13F | Cidel Asset Management Inc | 3.226 | 16,46 | 250 | 8,26 | ||||
| 2026-02-13 | 13F | Aurora Investment Counsel | 0 | -100,00 | 0 | |||||
| 2026-02-06 | 13F | IFP Advisors, Inc | 1.473 | -6,95 | 114 | -12,98 | ||||
| 2026-02-13 | 13F | Davis Asset Management, L.P. | 1.400.000 | 0,00 | 108.360 | -6,84 | ||||
| 2026-02-17 | 13F | Woodline Partners LP | 40.501 | 3.135 | ||||||
| 2026-02-09 | 13F | Lgl Partners, Llc | 6.624 | 0,32 | 513 | -6,57 | ||||
| 2026-02-17 | 13F | Maryland State Retirement & Pension System | 11.898 | 0,00 | 921 | -6,88 | ||||
| 2026-02-13 | 13F | Wexford Capital Lp | 1.219 | 94 | ||||||
| 2026-02-05 | 13F | Bessemer Group Inc | 18.226 | 3,15 | 1 | 0,00 | ||||
| 2026-02-11 | 13F | Rise Advisors, LLC | 0 | -100,00 | 0 | |||||
| 2026-02-17 | 13F | Laird Norton Trust Company, Llc | 5.579 | 432 | ||||||
| 2025-11-12 | 13F | Integrated Quantitative Investments LLC | 0 | -100,00 | 0 | |||||
| 2026-02-13 | 13F | Formula Growth Ltd | 30.759 | -7,79 | 2.381 | -14,11 | ||||
| 2026-02-04 | 13F | Hartford Investment Management Co | 13.554 | -4,14 | 1.049 | -10,65 | ||||
| 2026-01-30 | 13F | GPM Growth Investors, Inc. | 53.439 | 4.136 | ||||||
| 2026-02-11 | 13F | Ameritas Investment Partners, Inc. | 2.211 | 171 | ||||||
| 2026-02-12 | 13F | Swiss National Bank | 664.851 | -5,43 | 51.459 | -11,90 | ||||
| 2026-01-29 | 13F | Deltec Asset Management Llc | 0 | -100,00 | 0 | |||||
| 2026-02-10 | 13F | Commonwealth Of Pennsylvania Public School Empls Retrmt Sys | 55.068 | -5,48 | 4.262 | -11,94 | ||||
| 2026-02-03 | 13F | RFG Advisory, LLC | 2.827 | -6,39 | 219 | -12,80 | ||||
| 2026-02-03 | 13F | Generali Asset Management SPA SGR | 22.964 | -8,56 | 1.777 | -14,81 | ||||
| 2026-02-13 | 13F | Entropy Technologies, LP | 10.047 | 778 | ||||||
| 2026-02-17 | 13F | Utah Retirement Systems | 40.165 | -0,32 | 3.109 | -7,14 | ||||
| 2026-01-20 | 13F | SS&H Financial Advisors, Inc. | 3.795 | -7,33 | 0 | -100,00 | ||||
| 2026-01-27 | 13F | Busey Wealth Management | 0 | -100,00 | 0 | |||||
| 2026-02-12 | 13F | Peterson Wealth Services | 2.008 | 32,02 | 155 | -6,63 | ||||
| 2026-02-05 | 13F | Atria Investments Llc | 3.891 | -12,62 | 301 | -18,43 | ||||
| 2026-02-13 | 13F | Kestra Advisory Services, LLC | 0 | -100,00 | 0 | |||||
| 2026-01-15 | 13F | Polianta Ltd | 0 | -100,00 | 0 | |||||
| 2026-02-06 | 13F | HighTower Advisors, LLC | 32.406 | -10,64 | 2.508 | -16,76 | ||||
| 2026-02-02 | 13F | Millstone Evans Group, LLC | 32 | 0,00 | 2 | 0,00 | ||||
| 2026-02-13 | 13F | Mml Investors Services, Llc | 24.579 | -5,99 | 1.902 | -12,43 | ||||
| 2025-11-14 | 13F | PineBridge Investments, L.P. | 28.176 | 2.341 | ||||||
| 2026-02-13 | 13F | Healthcare Of Ontario Pension Plan Trust Fund | 1.412.128 | 93,81 | 109.299 | 80,56 | ||||
| 2026-02-13 | 13F | Seneschal Advisors, LLC | 3 | -25,00 | 0 | |||||
| 2026-02-17 | 13F | FIL Ltd | 283.522 | 4,41 | 21.945 | -2,73 | ||||
| 2026-02-13 | 13F | Alberta Investment Management Corp | 17.200 | 1.331 | ||||||
| 2026-02-12 | 13F | Leith Wheeler Investment Counsel Ltd. | 156.904 | 0,09 | 12.144 | -6,75 | ||||
| 2026-02-13 | 13F | Y-Intercept (Hong Kong) Ltd | 10.563 | 818 | ||||||
| 2026-01-23 | 13F | Patton Fund Management, Inc. | 2.876 | -5,33 | 223 | -11,90 | ||||
| 2026-01-27 | 13F | Godsey & Gibb Associates | 775 | 0,00 | 60 | -7,81 | ||||
| 2026-02-12 | 13F | Ci Investments Inc. | 0 | -100,00 | 0 | |||||
| 2025-11-05 | 13F | Key FInancial Inc | 0 | -100,00 | 0 | |||||
| 2026-01-27 | 13F | Forum Financial Management, LP | 6.051 | 41,15 | 468 | 31,46 | ||||
| 2026-02-04 | 13F | Sentry Investment Management Llc | 519 | 0,00 | 0 | |||||
| 2026-02-10 | 13F | Intech Investment Management Llc | 9.048 | -67,92 | 700 | -70,12 | ||||
| 2026-02-18 | 13F | Front Street Capital Management, Inc. | 61.650 | 0,20 | 5 | -20,00 | ||||
| 2026-02-12 | 13F | Cibc World Markets Corp | 112.235 | 264,68 | 8.687 | 252,66 | ||||
| 2026-02-13 | 13F | Rafferty Asset Management, LLC | 76.749 | -8,67 | 5.940 | -14,91 | ||||
| 2026-02-03 | 13F | Ethic Inc. | 10.575 | -23,93 | 819 | -29,12 | ||||
| 2026-02-17 | 13F | California State Teachers Retirement System | 412.858 | -2,15 | 31.955 | -8,84 | ||||
| 2026-02-12 | 13F | MetLife Investment Management, LLC | 56.817 | -5,65 | 4.398 | -12,10 | ||||
| 2026-02-12 | 13F | APG Asset Management N.V. | 126.963 | -6,99 | 8.367 | -13,30 | ||||
| 2026-02-06 | 13F | Gables Capital Management Inc. | 235 | 0,00 | 18 | -5,26 | ||||
| 2026-02-11 | 13F | CenterBook Partners LP | 62.654 | 4.849 | ||||||
| 2025-11-20 | 13F | Maven Securities LTD | Call | 0 | -100,00 | 0 | ||||
| 2026-02-12 | 13F | Xponance, Inc. | 36.425 | 4,55 | 2.819 | -2,59 | ||||
| 2026-02-13 | 13F | Sei Investments Co | 342.634 | 35,92 | 26.520 | 26,62 | ||||
| 2026-02-17 | 13F | Capital Fund Management S.a. | Call | 19.100 | -77,34 | 1.478 | -78,89 | |||
| 2026-02-13 | 13F | Dai-Ichi Life Insurance Company, Ltd | 0 | -100,00 | 0 | |||||
| 2026-02-17 | 13F | Capital Fund Management S.a. | Put | 26.000 | -76,62 | 2.012 | -78,22 | |||
| 2026-04-08 | 13F | Arlington Trust Co LLC | 500 | 0,00 | 34 | -13,16 | ||||
| 2026-02-12 | 13F | Logan Capital Management Inc | 20.322 | 0,00 | 1.573 | -6,87 | ||||
| 2026-02-12 | 13F | Bank Of Montreal /can/ | Put | 50.000 | 3.870 | |||||
| 2026-02-09 | 13F | Community Bank & Trust, Waco, Texas | 12.533 | -5,82 | 1 | -100,00 | ||||
| 2026-02-12 | 13F | Bank Of Montreal /can/ | 590.208 | -37,90 | 45.682 | -42,14 | ||||
| 2025-11-14 | 13F | Imprint Wealth LLC | 0 | -100,00 | 0 | |||||
| 2026-02-12 | 13F | Brinker Capital Investments, LLC | 0 | -100,00 | 0 | |||||
| 2026-01-12 | 13F | Avanza Fonder AB | 28.447 | 58,18 | 2.202 | 47,32 | ||||
| 2026-02-17 | 13F | Quadrature Capital Ltd | 19.108 | -7,29 | 1.479 | -13,72 | ||||
| 2026-04-08 | 13F | Wealth Enhancement Advisory Services, Llc | 48.797 | 27,75 | 3.125 | 6,22 | ||||
| 2026-02-02 | 13F | Strs Ohio | 40.271 | -0,17 | 3.117 | -7,01 | ||||
| 2025-11-14 | 13F | AXA Investment Managers S.A. | 20.123 | 1.672 | ||||||
| 2026-02-02 | 13F | Truist Financial Corp | 47.572 | -37,92 | 3.682 | -42,16 | ||||
| 2026-01-22 | 13F | Venturi Wealth Management, LLC | 0 | -100,00 | 0 | -100,00 | ||||
| 2026-02-03 | 13F | SBI Securities Co., Ltd. | 163 | -2,98 | 13 | -7,69 | ||||
| 2025-11-14 | 13F | Point72 (DIFC) Ltd | 8.582 | 713 | ||||||
| 2026-02-11 | 13F | WESCAP Management Group, Inc. | 0 | -100,00 | 0 | |||||
| 2026-02-17 | 13F | Boothbay Fund Management, Llc | 6.672 | 72,09 | 516 | 60,25 | ||||
| 2026-02-06 | 13F | Cornerstone Management, Inc. | 10.279 | 0,00 | 796 | -6,80 | ||||
| 2026-02-18 | 13F | Achmea Investment Management B.V. | 182.785 | 14 | ||||||
| 2026-02-11 | 13F | First Command Advisory Services, Inc. | 4.787 | 0,00 | 371 | -6,80 | ||||
| 2026-02-12 | 13F | Advocate Investing Services LLC | 51 | 4 | ||||||
| 2026-02-13 | 13F | Chevy Chase Trust Holdings, Inc. | 120.028 | -3,40 | 9.290 | -10,01 | ||||
| 2026-02-17 | 13F | Credit Agricole S A | 28.735 | -61,57 | 2.224 | -64,20 | ||||
| 2026-01-22 | 13F | Financial Consulate, Inc | 12 | 0,00 | 1 | |||||
| 2026-04-06 | 13F | GAMMA Investing LLC | 7.223 | 53,35 | 486 | 33,52 | ||||
| 2026-01-06 | 13F | Penbrook Management LLC | 5.115 | 0,00 | 396 | -6,84 | ||||
| 2026-02-05 | 13F | Novare Capital Management Llc | 5.985 | 0,00 | 463 | -6,84 | ||||
| 2026-02-17 | 13F | Cape Investment Advisory, Inc. | 14 | 0,00 | 1 | 0,00 | ||||
| 2026-02-17 | 13F | Quantitative Investment Management, LLC | 16.279 | 471,79 | 1 | |||||
| 2026-02-23 | 13F | Mv Capital Management, Inc. | 27 | 42,11 | 2 | 100,00 | ||||
| 2026-02-12 | 13F | Steward Partners Investment Advisory, Llc | 105.821 | 23,17 | 8.191 | 14,75 | ||||
| 2026-02-17 | 13F | Css Llc/il | 13.124 | 8,07 | 1.016 | 0,69 | ||||
| 2026-01-21 | 13F | Prime Capital Investment Advisors, LLC | 0 | -100,00 | 0 | |||||
| 2026-02-05 | 13F | Applied Finance Capital Management, LLC | 2.698 | -46,09 | 209 | -49,88 | ||||
| 2025-12-09 | 13F/A | Tudor Investment Corp Et Al | 0 | -100,00 | 0 | -100,00 | ||||
| 2026-02-17 | 13F | Voloridge Investment Management, Llc | 0 | -100,00 | 0 | |||||
| 2026-02-13 | 13F | Quattro Advisors LLC | 58 | 5 | ||||||
| 2026-01-14 | 13F | Jfs Wealth Advisors, Llc | 90 | 100,00 | 7 | 100,00 | ||||
| 2026-02-13 | 13F | Pinnacle Wealth Planning Services, Inc. | 1.017 | 79 | ||||||
| 2026-01-16 | 13F | Marquette Asset Management, LLC | 0 | -100,00 | 0 | |||||
| 2026-01-21 | 13F | Y.D. More Investments Ltd | 598 | -44,11 | 46 | -47,73 | ||||
| 2026-01-12 | 13F | DAVENPORT & Co LLC | 0 | -100,00 | 0 | |||||
| 2026-02-10 | 13F | Arcadia Investment Management Corp/mi | 0 | -100,00 | 0 | |||||
| 2026-02-09 | 13F | Smithfield Trust Co | 134 | 0,00 | 0 | |||||
| 2026-01-21 | 13F | SJS Investment Consulting Inc. | 31 | 121,43 | 2 | 100,00 | ||||
| 2026-02-11 | 13F | Zions Bancorporation, National Association /ut/ | 1.850 | 2.271,79 | 143 | 2.283,33 | ||||
| 2026-02-10 | 13F | Lido Advisors, LLC | Put | 2.000 | 0,00 | 155 | -7,23 | |||
| 2026-02-10 | 13F | Lido Advisors, LLC | 12.256 | 0,17 | 1.015 | -0,10 | ||||
| 2026-02-03 | 13F | K.J. Harrison & Partners Inc | 11.200 | -34,88 | 867 | -41,72 | ||||
| 2026-02-12 | 13F | Equity Investment Corp | 10.448 | 0,97 | 809 | -5,94 | ||||
| 2026-02-13 | 13F | Union Heritage Capital, LLC | 18.219 | -10,03 | 1.410 | -16,17 | ||||
| 2026-02-13 | 13F | North Growth Management Ltd. | 153.000 | 14,18 | 12 | 0,00 | ||||
| 2026-03-04 | 13F | SHP Wealth Management | 12 | 1 | ||||||
| 2026-01-30 | 13F | Exencial Wealth Advisors, Llc | 14.507 | 0,52 | 1.123 | -6,42 | ||||
| 2026-01-15 | 13F | Mn Services Vermogensbeheer B.V. | 94.807 | 0,64 | 7 | 0,00 | ||||
| 2026-02-02 | 13F | Fifth Third Bancorp | 16.492 | -9,98 | 1.276 | -16,16 | ||||
| 2026-02-17 | 13F | Maytus Capital Management, LLC | 0 | -100,00 | 0 | |||||
| 2026-02-11 | 13F | Allianz Asset Management GmbH | 16.526 | 4,92 | 1.279 | -2,22 | ||||
| 2026-04-09 | 13F | Red Spruce Capital, LLC | 22.792 | 0,28 | 1.534 | -12,85 | ||||
| 2025-12-01 | 13F | Groupama Asset Managment | 0 | -100,00 | 0 | -100,00 | ||||
| 2026-01-07 | 13F | Massmutual Trust Co Fsb/adv | 2.905 | -4,97 | 225 | -11,46 | ||||
| 2026-02-13 | 13F | Bridgewater Associates, LP | 958.080 | -23,21 | 74.155 | -28,46 | ||||
| 2026-01-30 | 13F | State of New Jersey Common Pension Fund D | 82.437 | -2,30 | 6.381 | -8,97 | ||||
| 2026-02-06 | 13F | Covestor Ltd | 1.836 | -11,90 | 0 | |||||
| 2026-02-12 | 13F | Oak Associates Ltd /oh/ | 0 | -100,00 | 0 | |||||
| 2026-02-17 | 13F | Nissay Asset Management Corp /japan/ /adv | 31.504 | 1,18 | 2.438 | -5,72 | ||||
| 2026-02-13 | 13F | Police & Firemen's Retirement System of New Jersey | 37.308 | -5,23 | 2.888 | -11,71 | ||||
| 2025-11-13 | 13F | Renaissance Technologies Llc | 0 | -100,00 | 0 | -100,00 | ||||
| 2026-01-16 | 13F | Compagnie Lombard Odier SCmA | 1.530 | 0,00 | 118 | -7,09 | ||||
| 2026-02-13 | 13F | Umb Bank N A/mo | 694 | 18,23 | 54 | 10,42 | ||||
| 2026-02-24 | 13F/A | Pacer Advisors, Inc. | 25.053 | -31,48 | 1.939 | -36,15 | ||||
| 2026-02-13 | 13F | Kayne Anderson Rudnick Investment Management Llc | 16.612 | 27,34 | 1.286 | 18,65 | ||||
| 2026-02-13 | 13F | Cramer Rosenthal Mcglynn Llc | 142.967 | 100,64 | 11.066 | 86,94 | ||||
| 2025-10-16 | 13F | Signature Resources Capital Management, LLC | 0 | -100,00 | 0 | |||||
| 2026-02-10 | 13F | Thompson Siegel & Walmsley Llc | 759.191 | 0,81 | 59 | -6,45 | ||||
| 2026-02-10 | 13F | Connor, Clark & Lunn Investment Management Ltd. | 7.972 | 617 | ||||||
| 2025-11-12 | 13F | Saudi Central Bank | 0 | -100,00 | 0 | -100,00 | ||||
| 2026-02-04 | 13F | Securian Asset Management, Inc | 6.437 | -44,83 | 498 | -48,61 | ||||
| 2026-04-02 | 13F | Noble Wealth Management PBC | 85 | 0,00 | 6 | -16,67 | ||||
| 2026-02-12 | 13F | Voya Investment Management Llc | 47.173 | -11,66 | 3.651 | -17,70 | ||||
| 2026-04-07 | 13F | CoreCap Advisors, LLC | 128 | 392,31 | 9 | 300,00 | ||||
| 2026-01-14 | 13F | McMahon Financial Advisors, LLC | 3.122 | -6,13 | 242 | -12,68 | ||||
| 2026-02-17 | 13F | J. Goldman & Co LP | 42.717 | 3.306 | ||||||
| 2026-02-13 | 13F | Barclays Plc | Put | 0 | -100,00 | 0 | -100,00 | |||
| 2026-01-26 | 13F | Whittier Trust Co Of Nevada Inc | 520 | 116,67 | 40 | 90,48 | ||||
| 2026-01-26 | 13F | Financial Guidance Group, Inc. | 4.690 | 0,00 | 363 | -6,68 | ||||
| 2026-02-04 | 13F | Valeo Financial Advisors, LLC | 0 | -100,00 | 0 | |||||
| 2026-01-08 | 13F | Sound View Wealth Advisors Group, LLC | 9.347 | -0,18 | 723 | -6,95 | ||||
| 2026-01-27 | 13F | Asset Management One Co., Ltd. | 102.058 | -0,85 | 8.166 | -4,50 | ||||
| 2026-02-06 | 13F | Signature Estate & Investment Advisors Llc | 3.059 | 237 | ||||||
| 2026-02-17 | 13F | Ancora Advisors, LLC | 932 | 0,00 | 72 | -6,49 | ||||
| 2026-02-17 | 13F | Spears Abacus Advisors LLC | 17.194 | 0,05 | 1.331 | -6,80 | ||||
| 2026-02-05 | 13F | North Dakota State Investment Board | 10.906 | 844 | ||||||
| 2026-01-29 | 13F | Calamos Advisors LLC | 64.164 | -3,90 | 4.966 | -10,47 | ||||
| 2026-01-29 | 13F | Vanguard Group Inc | 23.175.164 | -1,56 | 1.793.758 | -8,29 | ||||
| 2026-02-13 | 13F | 1832 Asset Management L.P. | 26.149 | 0,33 | 2.024 | -6,56 | ||||
| 2026-02-10 | 13F | Td Asset Management Inc | 115.419 | -0,32 | 8.933 | -7,13 | ||||
| 2026-02-12 | 13F | Dimensional Fund Advisors Lp | 2.093.879 | -1,54 | 162.098 | -8,29 | ||||
| 2025-11-14 | 13F | Hbk Investments L P | Put | 0 | -100,00 | 0 | -100,00 | |||
| 2026-04-07 | 13F | Eastern Bank | 140 | -9,09 | 9 | -18,18 | ||||
| 2026-02-02 | 13F | Sachetta, LLC | 116 | 0,00 | 9 | -11,11 | ||||
| 2026-01-29 | 13F | Sanctuary Advisors, LLC | 6.441 | -31,45 | 499 | -36,15 | ||||
| 2026-02-03 | 13F | Farmers & Merchants Investments Inc | 188 | 0,00 | 15 | -6,67 | ||||
| 2026-02-06 | 13F | Callahan Advisors, LLC | 0 | -100,00 | 0 | |||||
| 2026-02-18 | 13F | EP Wealth Advisors, Inc. | 4.173 | -85,06 | 323 | -85,55 | ||||
| 2026-02-13 | 13F | RFP Financial Group LLC | 4.700 | -5,24 | 364 | -13,37 | ||||
| 2026-02-11 | 13F | 111 Capital | 3.865 | 299 | ||||||
| 2025-11-14 | 13F | Hbk Investments L P | Call | 0 | -100,00 | 0 | -100,00 | |||
| 2026-04-01 | 13F | Burkett Financial Services, Llc | 55 | 0,00 | 4 | -25,00 | ||||
| 2026-04-06 | 13F | CX Institutional | 1.085 | -70,15 | 0 | |||||
| 2026-02-05 | 13F | New York Life Investment Management Llc | 34.373 | -2,79 | 2.660 | -9,43 | ||||
| 2026-02-17 | 13F | Alliancebernstein L.p. | 413.026 | 17,95 | 31.968 | 9,88 | ||||
| 2025-11-14 | 13F | Hbk Investments L P | 0 | -100,00 | 0 | -100,00 | ||||
| 2025-10-23 | 13F | Integras Partners LLC | 0 | -100,00 | 0 | -100,00 | ||||
| 2025-11-04 | 13F | McKinley Carter Wealth Services, Inc. | Put | 282 | 3,68 | |||||
| 2025-11-14 | 13F | Point72 (DIFC) Ltd | Call | 0 | -100,00 | 0 | -100,00 | |||
| 2026-02-02 | 13F | Cornerstone Planning Group LLC | 87 | 17,57 | 6 | 20,00 | ||||
| 2026-02-17 | 13F | Millennium Management Llc | Put | 47.500 | -31,95 | 3.676 | -36,60 | |||
| 2026-02-17 | 13F | Centennial Bank/AR/ | 56 | 0,00 | 4 | 0,00 | ||||
| 2026-02-17 | 13F | Millennium Management Llc | Call | 29.100 | -33,71 | 2.252 | -38,25 | |||
| 2026-04-07 | 13F | Sage Capital Advisors,llc | 0 | -100,00 | 0 | |||||
| 2026-01-21 | 13F | Modera Wealth Management, LLC | 39.915 | -7,02 | 3.089 | -13,38 | ||||
| 2026-01-22 | 13F | Massachusetts Financial Services Co /ma/ | 1.962.974 | -4,13 | 151.934 | -10,69 | ||||
| 2026-01-16 | 13F | Augustine Asset Management Inc | 0 | -100,00 | 0 | |||||
| 2026-02-17 | 13F | Millennium Management Llc | 155.316 | 26,32 | 12.021 | 17,69 | ||||
| 2026-02-10 | 13F | Kentucky Retirement Systems Insurance Trust Fund | 6.425 | 0,00 | 497 | -6,75 | ||||
| 2026-02-12 | 13F | Alps Advisors Inc | 10.356 | 3,28 | 802 | -3,84 | ||||
| 2026-02-05 | 13F | Amalgamated Bank | 46.457 | 0,79 | 4 | 0,00 | ||||
| 2026-02-18 | 13F/A | Empowered Funds, LLC | 9.177 | 6,97 | 710 | -0,28 | ||||
| 2026-01-22 | 13F | Bartlett & Co. Wealth Management Llc | 838 | 5,14 | 65 | -3,03 | ||||
| 2026-01-23 | 13F | Optima Capital Llc | 6 | 0 | ||||||
| 2026-02-13 | 13F | Dynamic Technology Lab Private Ltd | 5.670 | 439 | ||||||
| 2026-02-17 | 13F | Public Employees Retirement System Of Ohio | 78.137 | -4,62 | 6.048 | -11,14 | ||||
| 2026-02-12 | 13F | Hrt Financial Lp | 83.609 | 6 | ||||||
| 2026-01-28 | 13F | Salomon & Ludwin, LLC | 381 | -13,61 | 29 | -23,68 | ||||
| 2026-01-26 | 13F | J.M. Arbour, LLC | 7.166 | 555 | ||||||
| 2026-01-23 | 13F | Westside Investment Management, Inc. | 24 | 2 | ||||||
| 2026-01-22 | 13F | Bfsg, Llc | 2.888 | 7,76 | 224 | 0,45 | ||||
| 2026-01-23 | 13F | Portman Square Capital LLP | Call | 28.500 | 2.206 | |||||
| 2026-01-23 | 13F | Portman Square Capital LLP | Put | 373.800 | -50,70 | 28.932 | -54,07 | |||
| 2026-02-10 | 13F | Natixis Advisors, L.p. | 73.979 | -12,95 | 6 | -28,57 | ||||
| 2026-02-13 | 13F | Tradewinds, LLC. | 7.000 | 0,00 | 542 | -6,88 | ||||
| 2026-02-04 | 13F | Independent Advisor Alliance | 17.070 | -42,03 | 1.321 | -45,99 | ||||
| 2026-01-21 | 13F | Aaron Wealth Advisors LLC | 4.093 | 30,98 | 317 | 22,01 | ||||
| 2026-01-28 | 13F | DekaBank Deutsche Girozentrale | 68.277 | 0,00 | 9 | 80,00 | ||||
| 2026-02-11 | 13F | Deseret Mutual Benefit Administrators | 937 | 16,83 | 73 | 9,09 | ||||
| 2026-01-21 | 13F | Flagship Harbor Advisors, Llc | 502 | 39 | ||||||
| 2026-02-10 | 13F | State of Wyoming | 0 | -100,00 | 0 | |||||
| 2026-02-17 | 13F | MIRAE ASSET GLOBAL ETFS HOLDINGS Ltd. | 177.552 | -2,73 | 13.744 | -9,41 | ||||
| 2026-01-29 | 13F | Teachers Retirement System Of The State Of Kentucky | 19.805 | 0,00 | 2 | 0,00 | ||||
| 2025-11-13 | 13F | GeoWealth Management, LLC | 0 | -100,00 | 0 | -100,00 | ||||
| 2025-11-14 | 13F | Cubist Systematic Strategies, LLC | Put | 36.800 | -0,27 | 3.057 | 3,52 | |||
| 2026-02-17 | 13F | Quantinno Capital Management LP | 106.447 | 6,17 | 8.239 | -1,09 | ||||
| 2025-11-14 | 13F | Cubist Systematic Strategies, LLC | Call | 20.900 | 14,84 | 1.736 | 19,23 | |||
| 2026-02-17 | 13F | Janus Henderson Group Plc | 104.564 | -95,05 | 8.093 | -95,39 | ||||
| 2026-02-13 | 13F | Royal London Asset Management Ltd | 116.206 | 0,26 | 8.994 | -6,59 | ||||
| 2025-11-13 | 13F | Limestone Investment Advisors LP | 0 | -100,00 | 0 | -100,00 | ||||
| 2026-02-05 | 13F | Dana Investment Advisors, Inc. | 5.650 | 437 | ||||||
| 2026-02-06 | 13F | Envestnet Portfolio Solutions, Inc. | 0 | -100,00 | 0 | |||||
| 2026-02-13 | 13F | Golden State Wealth Management, LLC | 0 | -100,00 | 0 | |||||
| 2026-04-09 | 13F | DHJJ Financial Advisors, Ltd. | 36 | 0,00 | 2 | 0,00 | ||||
| 2026-02-14 | 13F | Rockefeller Capital Management L.P. | 12.361 | -3,34 | 957 | -9,98 | ||||
| 2026-02-19 | 13F | Michels Family Financial, LLC | 0 | -100,00 | 0 | |||||
| 2025-11-13 | 13F | Texas Capital Bancshares Inc/tx | 18 | 1 | ||||||
| 2025-11-14 | 13F | Sig Brokerage, Lp | 0 | -100,00 | 0 | |||||
| 2025-11-14 | 13F | Sig Brokerage, Lp | Put | 0 | -100,00 | 0 | ||||
| 2026-02-12 | 13F | Nuveen, LLC | 512.134 | -3,86 | 39.639 | -10,43 | ||||
| 2026-02-11 | 13F | GW&K Investment Management, LLC | 157 | 0 | ||||||
| 2026-02-11 | 13F | OneAscent Investment Solutions LLC | 9.873 | 0,00 | 764 | -6,83 | ||||
| 2026-02-17 | 13F | Balyasny Asset Management Llc | 293.935 | -87,12 | 22.751 | -88,00 | ||||
| 2025-11-14 | 13F | J. Goldman & Co LP | Put | 0 | -100,00 | 0 | ||||
| 2026-02-12 | 13F | Sit Investment Associates Inc | 0 | -100,00 | 0 | |||||
| 2026-01-27 | 13F | Benedict Financial Advisors Inc | 25.469 | 93,25 | 1.971 | 80,16 | ||||
| 2026-02-05 | 13F | Allworth Financial LP | 868 | 42,30 | 67 | 34,00 | ||||
| 2026-02-06 | 13F | Larson Financial Group LLC | 98 | 36,11 | 8 | 40,00 | ||||
| 2026-01-23 | 13F | Rsm Us Wealth Management Llc | 2.961 | 3,60 | 235 | -1,27 | ||||
| 2026-02-17 | 13F | XTX Topco Ltd | 37.975 | 542,55 | 2.939 | 498,57 | ||||
| 2026-01-12 | 13F | Aurdan Capital Management, LLC | 0 | -100,00 | 0 | -100,00 | ||||
| 2026-02-12 | 13F | CIBC Private Wealth Group, LLC | 3.640 | -7,28 | 282 | -13,80 | ||||
| 2026-04-07 | 13F | Signaturefd, Llc | 2.835 | -9,13 | 191 | -21,16 | ||||
| 2026-02-11 | 13F | Erste Asset Management GmbH | 43.636 | 3.493 | ||||||
| 2026-02-13 | 13F | Pathstone Holdings, LLC | 66.456 | -6,69 | 5.144 | -13,07 | ||||
| 2026-02-04 | 13F | LRI Investments, LLC | 815 | 6,82 | 63 | 0,00 | ||||
| 2026-02-09 | 13F | Legal & General Group Plc | 1.658.880 | 1,03 | 128.397 | -5,88 | ||||
| 2026-02-17 | 13F | Readystate Asset Management Lp | 33.129 | -25,71 | 2.564 | -30,80 | ||||
| 2026-01-22 | 13F | Pinnacle Bancorp, Inc. | 70 | 0,00 | 5 | 0,00 | ||||
| 2026-02-20 | 13F | Sunbelt Securities, Inc. | 0 | -100,00 | 0 | |||||
| 2026-01-08 | 13F | True Wealth Design, LLC | 431 | 183,55 | 33 | 175,00 | ||||
| 2026-02-17 | 13F | Moore Capital Management, Lp | 353.600 | 52,94 | 27.369 | 42,48 | ||||
| 2026-02-12 | 13F | Wealthspire Advisors, LLC | 0 | -100,00 | 0 | -100,00 | ||||
| 2026-02-13 | 13F | SRS Capital Advisors, Inc. | 298 | -95,93 | 23 | -96,22 | ||||
| 2025-11-14 | 13F | Nomura Holdings Inc | Put | 0 | -100,00 | 0 | -100,00 | |||
| 2025-10-23 | 13F | SG Americas Securities, LLC | Call | 0 | -100,00 | 0 | -100,00 | |||
| 2026-02-17 | 13F | Ameriprise Financial Inc | 7.320.085 | -0,41 | 566.575 | -7,22 | ||||
| 2025-11-04 | 13F | Guerra Advisors Inc | 25 | 2 | ||||||
| 2026-04-08 | 13F | Wealth Enhancement Trust Services, Inc. | 160 | -33,33 | 11 | -44,44 | ||||
| 2025-11-14 | 13F | Centiva Capital, LP | 0 | -100,00 | 0 | -100,00 | ||||
| 2026-02-17 | 13F | State Of Wisconsin Investment Board | 125.498 | -2,24 | 9.714 | -8,92 | ||||
| 2026-04-03 | 13F | Investors Research Corp | 11.471 | 1,91 | 772 | -11,48 | ||||
| 2026-02-17 | 13F | Schonfeld Strategic Advisors LLC | 3.965 | -89,87 | 307 | -90,59 | ||||
| 2026-02-11 | 13F | Dorsey & Whitney Trust CO LLC | 2.698 | 209 | ||||||
| 2026-01-23 | 13F | Clear Creek Financial Management, LLC | 5.995 | 32,93 | 464 | 24,06 | ||||
| 2026-02-09 | 13F/A | Swedbank AB | 41.248 | -19,40 | 3.193 | -24,91 | ||||
| 2026-02-13 | 13F | DeepCurrents Investment Group LLC | 0 | -100,00 | 0 | |||||
| 2026-02-12 | 13F | Marex Group plc | 8.870 | 34,05 | 687 | 24,95 | ||||
| 2026-01-16 | 13F | Standard Life Aberdeen plc | 178.306 | -0,84 | 13.801 | -11,11 | ||||
| 2026-02-13 | 13F | Baird Financial Group, Inc. | 16.798 | -0,04 | 1.300 | -6,88 | ||||
| 2026-02-13 | 13F | Stifel Financial Corp | 152.345 | -3,62 | 11.792 | -10,21 | ||||
| 2026-02-11 | 13F | Hughes Financial Services, LLC | 15 | -25,00 | 1 | 0,00 | ||||
| 2026-01-30 | 13F | Kohmann Bosshard Financial Services, LLC | 624 | 48 | ||||||
| 2026-04-09 | 13F | Park Place Capital Corp | 247 | 0,00 | 17 | -15,79 | ||||
| 2026-02-11 | 13F | Los Angeles Capital Management Llc | 7.503 | -84,86 | 590 | -85,67 | ||||
| 2026-02-12 | 13F | Colonial Trust Advisors | 1.129 | 0,00 | 87 | -6,45 | ||||
| 2026-01-16 | 13F | Ronald Blue Trust, Inc. | 381.140 | -9,70 | 29.500 | -15,88 | ||||
| 2026-02-17 | 13F | Armistice Capital, Llc | 3.770 | 292 | ||||||
| 2026-02-13 | 13F | Barclays Plc | Call | 180.000 | -92,18 | 13.932 | -92,71 | |||
| 2025-11-14 | 13F | Axa S.a. | 0 | -100,00 | 0 | |||||
| 2026-02-13 | 13F | Barclays Plc | 9.297.502 | 38,06 | 719.627 | 28,62 | ||||
| 2026-02-17 | 13F | Rakuten Investment Management, Inc. | 31.392 | 563,12 | 2.513 | 220,41 | ||||
| 2025-11-14 | 13F | aeris Capital Holding GmbH | 0 | -100,00 | 0 | -100,00 | ||||
| 2026-02-12 | 13F | Brown Brothers Harriman & Co | 2.288 | 83,92 | 177 | 71,84 | ||||
| 2026-01-26 | 13F | Merit Financial Group, LLC | 20.168 | 6,20 | 1.561 | -1,08 | ||||
| 2026-02-10 | 13F | United Super Pty Ltd in its capacity as Trustee for the Construction & Building Unions Superannuation Fund | 151.370 | 11.716 | ||||||
| 2025-11-05 | 13F | Optimize Financial Inc | 0 | -100,00 | 0 | -100,00 | ||||
| 2026-02-09 | 13F | Annis Gardner Whiting Capital Advisors, LLC | 41 | 272,73 | 3 | |||||
| 2026-03-06 | 13F | Hsbc Holdings Plc | 1.428.962 | 39,54 | 110.772 | 31,12 | ||||
| 2026-02-17 | 13F | Amundi | 2.921.327 | 18,85 | 226.111 | 5,52 | ||||
| 2026-04-10 | 13F/A | OP Asset Management Ltd | 25.654 | 1.727 | ||||||
| 2026-02-04 | 13F | Rock Point Advisors, LLC | 76.292 | -1,93 | 5.905 | -8,62 | ||||
| 2026-02-11 | 13F | Winton Capital Group Ltd | 3.699 | 286 | ||||||
| 2026-02-12 | 13F | Cloud Capital Management, LLC | 0 | -100,00 | 0 | |||||
| 2026-02-17 | 13F | Melqart Asset Management (uk) Ltd | Call | 210.500 | 16.293 | |||||
| 2026-01-26 | 13F | Asset Dedication, LLC | 260 | 0,00 | 20 | -4,76 | ||||
| 2026-02-17 | 13F | CWM Advisors, LLC | 4 | 0 | ||||||
| 2026-02-17 | 13F | Melqart Asset Management (uk) Ltd | 37.386 | 2.894 | ||||||
| 2026-01-29 | 13F | Argyle Capital Management Inc. | 19.005 | 4,39 | 1.471 | -2,78 | ||||
| 2026-01-30 | 13F | Bogart Wealth, LLC | 80 | 0,00 | 6 | 0,00 | ||||
| 2026-02-09 | 13F | Malaga Cove Capital, LLC | 15.410 | -3,61 | 1.193 | -10,24 | ||||
| 2026-02-17 | 13F | Pinnacle Financial Partners, Inc. | 7.574.540 | 586.271 | ||||||
| 2026-01-29 | 13F | Cornerstone National Bank & Trust Co | 95 | 0,00 | 7 | 0,00 | ||||
| 2026-02-10 | 13F/A | Algebris (uk) Ltd | 284.945 | 33,86 | 22.065 | 24,87 | ||||
| 2026-02-13 | 13F | Gts Securities Llc | 3.392 | 263 | ||||||
| 2026-02-13 | 13F | Financial Network Wealth Advisors LLC | 31 | 0,00 | 2 | 0,00 | ||||
| 2026-02-11 | 13F | IMA Wealth, Inc. | 1.000 | 0,00 | 77 | -7,23 | ||||
| 2026-02-12 | 13F | IFM Investors Pty Ltd | 49.086 | -5,16 | 4 | -99,93 | ||||
| 2026-01-26 | 13F | SeaBridge Investment Advisors LLC | 18.748 | -2,14 | 1.451 | -8,80 | ||||
| 2026-01-26 | 13F | Independent Wealth Network Inc. | 3.400 | -3,08 | 263 | -9,62 | ||||
| 2026-02-05 | 13F | Qsemble Capital Management, LP | 15.904 | 1.231 | ||||||
| 2026-02-02 | 13F | Pettee Investors, Inc. | 0 | -100,00 | 0 | |||||
| 2026-01-20 | 13F | Guardian Wealth Management, LLC | 3.618 | 280 | ||||||
| 2026-01-27 | 13F | Focused Investors LLC | 1.462.200 | 21,36 | 113.174 | 13,07 | ||||
| 2026-02-09 | 13F | Hantz Financial Services, Inc. | 478 | 87,45 | 0 | |||||
| 2026-01-30 | 13F/A | M&t Bank Corp | 8.772 | 49,92 | 679 | 39,71 | ||||
| 2026-04-07 | 13F | Cardinal Capital Management, Inc. | 0 | -100,00 | 0 | |||||
| 2026-01-22 | 13F | HHM Wealth Advisors, LLC | 650 | 0,00 | 50 | -7,41 | ||||
| 2026-02-10 | 13F | Bruce G. Allen Investments, LLC | 521 | -4,75 | 40 | -11,11 | ||||
| 2026-02-17 | 13F | Tower Research Capital LLC (TRC) | 10.313 | 1.781,93 | 798 | 1.673,33 | ||||
| 2026-02-17 | 13F | Prelude Capital Management, Llc | 17.896 | 1.385 | ||||||
| 2026-02-04 | 13F | Plato Investment Management Ltd | 9.896 | 0,00 | 770 | -5,64 | ||||
| 2025-11-14 | 13F | Delta Global Management LP | 0 | -100,00 | 0 | -100,00 | ||||
| 2026-01-23 | 13F | Paragon Capital Management Inc | 11.181 | 865 | ||||||
| 2026-02-12 | 13F | Callan Family Office, LLC | 3.046 | 12,32 | 236 | 4,44 | ||||
| 2026-02-17 | 13F | Bank Of America Corp /de/ | Put | 0 | -100,00 | 0 | -100,00 | |||
| 2026-02-17 | 13F | SageView Advisory Group, LLC | 1.058 | 82 | ||||||
| 2026-01-30 | 13F | Activest Wealth Management | 8 | -38,46 | 1 | -100,00 | ||||
| 2026-04-03 | 13F | Coastline Trust Co | 2.390 | 0,00 | 161 | -13,04 | ||||
| 2026-02-13 | 13F | Quarry LP | 945 | 138,04 | 73 | 128,13 | ||||
| 2026-02-09 | 13F | CBIZ Investment Advisory Services, LLC | 11 | 1 | ||||||
| 2026-02-12 | 13F | Aviva Plc | 169.660 | 3,22 | 13.132 | -3,84 | ||||
| 2026-01-14 | 13F | Pallas Capital Advisors LLC | 0 | -100,00 | 0 | |||||
| 2026-02-03 | 13F | Capital City Trust Co/fl | 21.540 | -11,32 | 1.667 | -17,39 | ||||
| 2025-11-14 | 13F | Point72 Asia (Singapore) Pte. Ltd. | 4.316 | 359 | ||||||
| 2025-11-12 | 13F | Power Wealth Management Llc | 0 | -100,00 | 0 | -100,00 | ||||
| 2026-01-27 | 13F | Evergreen Capital Management Llc | 8.345 | 646 | ||||||
| 2026-01-21 | 13F | Hartford Financial Management Inc. | 84 | 0,00 | 7 | 0,00 | ||||
| 2026-02-17 | 13F | Engineers Gate Manager LP | 33.421 | 9,44 | 2.587 | 1,93 | ||||
| 2026-01-22 | 13F | Cache Advisors, LLC | 5.409 | 0,00 | 419 | -6,90 | ||||
| 2026-02-06 | 13F | BOK Financial Private Wealth, Inc. | 165 | 13 | ||||||
| 2026-02-13 | 13F | First Trust Advisors Lp | 376.229 | -27,15 | 29.120 | -32,13 | ||||
| 2026-02-03 | 13F | Manning & Napier Advisors Llc | 62.680 | -1,92 | 4.851 | -8,63 | ||||
| 2026-02-13 | 13F | USS Investment Management Ltd | 46.394 | 1,22 | 3.591 | -5,70 | ||||
| 2026-02-13 | 13F | Bank Of Nova Scotia | 425.142 | -70,09 | 32.906 | -72,13 | ||||
| 2026-02-12 | 13F | Distillate Capital Partners LLC | 232.519 | 17.997 | ||||||
| 2025-11-14 | 13F | Mbb Public Markets I Llc | 0 | -100,00 | 0 | -100,00 | ||||
| 2026-01-26 | 13F | Private Trust Co Na | 3.074 | 52,03 | 238 | 41,92 | ||||
| 2026-01-21 | 13F | Woodmont Investment Counsel Llc | 4.105 | -0,44 | 318 | -7,31 | ||||
| 2026-02-10 | 13F | CIBC Asset Management Inc | 55.807 | 61,09 | 4.319 | 50,07 | ||||
| 2026-02-11 | 13F | Syon Capital Llc | 3.053 | 236 | ||||||
| 2026-02-09 | 13F | Geode Capital Management, Llc | 6.313.046 | -1,20 | 486.746 | -7,94 | ||||
| 2026-01-13 | 13F | Trust Asset Management LLC | 2.828 | -3,84 | 219 | -10,66 | ||||
| 2026-02-13 | 13F | American Century Companies Inc | 150.846 | 4,34 | 11.676 | -2,80 | ||||
| 2026-02-17 | 13F | Twinbeech Capital Lp | 144.067 | 11.151 | ||||||
| 2026-01-20 | 13F | Thurston, Springer, Miller, Herd & Titak, Inc. | 29 | 2 | ||||||
| 2025-11-12 | 13F | Consolidated Portfolio Review Corp | 0 | -100,00 | 0 | -100,00 | ||||
| 2026-02-13 | 13F | Johnson Investment Counsel Inc | 5.072 | -11,88 | 393 | -17,99 | ||||
| 2026-02-17 | 13F | Ameriflex Group, Inc. | 2 | -50,00 | 0 | |||||
| 2026-03-05 | 13F | Bush Investment Group, Llc | 4.194 | 0,00 | 325 | -6,90 | ||||
| 2026-02-02 | 13F | Nicholas Hoffman & Company, LLC. | 2.688 | -17,97 | 208 | -23,53 | ||||
| 2026-02-09 | 13F | Allstate Corp | 15.510 | 74,21 | 1.200 | 62,38 | ||||
| 2026-02-10 | 13F | Bank of New York Mellon Corp | 1.385.384 | 13,75 | 107.229 | 5,98 | ||||
| 2026-01-30 | 13F | Catalytic Wealth RIA, LLC | 0 | -100,00 | 0 | |||||
| 2026-02-13 | 13F | Marshall Wace, Llp | Call | 0 | -100,00 | 0 | ||||
| 2026-02-04 | 13F | Ameritas Advisory Services, LLC | 0 | -100,00 | 0 | |||||
| 2026-02-17 | 13F | Polymer Capital Management (US) LLC | 0 | -100,00 | 0 | |||||
| 2025-11-14 | 13F | Contour Asset Management LLC | 0 | -100,00 | 0 | -100,00 | ||||
| 2026-04-06 | 13F | Versant Capital Management, Inc | 608 | 98,05 | 41 | 73,91 | ||||
| 2026-02-13 | 13F | Resources Investment Advisors, LLC. | 7.395 | -3,31 | 572 | -9,92 | ||||
| 2026-02-10 | 13F | National Pension Service | 61.769 | -85,06 | 4.781 | -86,09 | ||||
| 2026-01-07 | 13F | Procyon Private Wealth Partners, LLC | 19.611 | 2,02 | 1.518 | -5,01 | ||||
| 2026-02-10 | 13F | Goldman Sachs Group Inc | 2.275.546 | -6,23 | 176.127 | -12,64 | ||||
| 2026-01-12 | 13F | Hillcrest Wealth Advisors - NY, LLC | 9.992 | 0,00 | 773 | -6,87 | ||||
| 2026-01-28 | 13F | Arizona State Retirement System | 66.664 | -7,79 | 5.160 | -14,10 | ||||
| 2026-02-11 | 13F | Winnow Wealth Llc | 3 | 0 | ||||||
| 2026-02-09 | 13F | Hartland & Co., LLC | 1.875 | 29,58 | 145 | 20,83 | ||||
| 2026-02-17 | 13F | Qube Research & Technologies Ltd | Put | 82.300 | -5,73 | 6.370 | -12,16 | |||
| 2026-02-17 | 13F | Qube Research & Technologies Ltd | Call | 41.400 | -21,44 | 3.204 | -26,82 | |||
| 2026-01-15 | 13F | Fortitude Family Office, LLC | 81 | -5,81 | 6 | -14,29 | ||||
| 2026-02-11 | 13F | Hilton Head Capital Partners, LLC | 1.716 | 133 | ||||||
| 2026-01-29 | 13F | UBS Group AG | Put | 18.600 | 1.440 | |||||
| 2026-02-12 | 13F | Bradley Foster & Sargent Inc/ct | 5.349 | -7,66 | 414 | -13,93 | ||||
| 2026-01-29 | 13F | UBS Group AG | Call | 2.500 | -52,78 | 194 | -56,04 | |||
| 2026-01-29 | 13F | UBS Group AG | 2.080.577 | -18,85 | 161.037 | -24,39 | ||||
| 2026-02-17 | 13F | Qube Research & Technologies Ltd | 49.135 | 3.803 | ||||||
| 2025-11-14 | 13F | Wolverine Trading, Llc | Call | 128.400 | 89,94 | 11.086 | 108,34 | |||
| 2026-02-17 | 13F | Prana Capital Management, LP | 319.767 | -23,52 | 24.750 | -28,75 | ||||
| 2025-11-07 | 13F | Shell Asset Management Co | 913 | -44,87 | 0 | |||||
| 2025-11-14 | 13F | Wolverine Trading, Llc | Put | 29.400 | -81,47 | 2.538 | -79,68 | |||
| 2026-02-02 | 13F | Principal Financial Group Inc | 291.589 | 3,79 | 22.569 | -3,30 | ||||
| 2026-02-12 | 13F | Rossby Financial, LCC | 0 | -100,00 | 0 | |||||
| 2026-02-05 | 13F | Elyxium Wealth, LLC | 96 | 7 | ||||||
| 2026-01-07 | 13F | Harbor Investment Advisory, Llc | 15 | -95,56 | 1 | -96,43 | ||||
| 2026-02-11 | 13F | SOUTH STATE Corp | 375 | 9,33 | 29 | 3,57 | ||||
| 2026-02-13 | 13F | Cozad Asset Management Inc | 0 | -100,00 | 0 | |||||
| 2026-02-17 | 13F | Bayesian Capital Management, LP | 0 | -100,00 | 0 | |||||
| 2025-11-14 | 13F | Volterra Technologies LP | Call | 0 | -100,00 | 0 | ||||
| 2025-11-14 | 13F | Volterra Technologies LP | Put | 0 | -100,00 | 0 | ||||
| 2026-02-10 | 13F | Gulf International Bank (UK) Ltd | 13.903 | 0,00 | 1 | 0,00 | ||||
| 2026-02-20 | 13F | Kovitz Investment Group Partners, LLC | 0 | -100,00 | 0 | |||||
| 2026-01-20 | 13F | Pflug Koory, LLC | 10 | 0,00 | 1 | |||||
| 2026-02-05 | 13F | Convergence Investment Partners, LLC | 0 | -100,00 | 0 | |||||
| 2026-02-12 | 13F | Earnest Partners Llc | 692.957 | -4,82 | 53.635 | -11,33 | ||||
| 2026-02-04 | 13F | Atlantic Union Bankshares Corp | 11.540 | 5,89 | 893 | -1,33 | ||||
| 2026-01-08 | 13F | Gradient Investments LLC | 17.989 | 5,14 | 1.392 | -2,04 | ||||
| 2026-02-02 | 13F | Oppenheimer Asset Management Inc. | 95.533 | -2,20 | 7.394 | -8,88 | ||||
| 2026-02-17 | 13F | United Capital Financial Advisers, Llc | 6.144 | -38,31 | 476 | -42,56 | ||||
| 2026-02-02 | 13F | Baypointe Partners LLC | 0 | -100,00 | 0 | |||||
| 2026-02-06 | 13F | Abn Amro Investment Solutions | 7.101 | 550 | ||||||
| 2026-02-11 | 13F | Manchester Capital Management LLC | 39 | 3 | ||||||
| 2026-02-17 | 13F | Hancock Whitney Corp | 6.478 | -0,58 | 501 | -7,39 | ||||
| 2026-02-10 | 13F | MUFG Securities EMEA plc | 67.705 | 31,10 | 5.240 | 22,14 | ||||
| 2026-01-30 | 13F | Mitsubishi UFJ Trust & Banking Corp | 101.809 | -60,89 | 7.880 | -63,57 | ||||
| 2026-04-10 | 13F | Perigon Wealth Management, LLC | 3.544 | -3,17 | 238 | -15,90 | ||||
| 2026-02-03 | 13F | ASR Vermogensbeheer N.V. | 4.999 | -0,75 | 387 | -7,66 | ||||
| 2026-02-02 | 13F | PFA Pension, Forsikringsaktieselskab | 288.069 | 22.847 | ||||||
| 2026-04-10 | 13F | Abound Wealth Management | 27 | 0,00 | 2 | -50,00 | ||||
| 2026-01-12 | 13F | Kempner Capital Management Inc. | 37.989 | -9,12 | 3.101 | -10,71 | ||||
| 2026-02-13 | 13F | Aptus Capital Advisors, LLC | 5.977 | -6,49 | 463 | -12,99 | ||||
| 2026-01-20 | 13F | Cromwell Holdings LLC | 73 | -85,31 | 6 | -87,80 | ||||
| 2026-02-13 | 13F | OMERS ADMINISTRATION Corp | 9.260 | 0,00 | 717 | -6,89 | ||||
| 2026-01-14 | 13F | Wolff Wiese Magana Llc | 0 | -100,00 | 0 | |||||
| 2026-02-11 | 13F | Insight Advisors, LLC/ PA | 3.596 | 0,06 | 278 | -6,71 | ||||
| 2026-02-02 | 13F | Oppenheimer & Co Inc | 29.803 | -17,08 | 2.307 | -22,77 | ||||
| 2026-02-17 | 13F | Bank Of America Corp /de/ | 6.753.112 | -5,08 | 522.691 | -11,57 | ||||
| 2025-11-21 | 13F/A | CIBC Bancorp USA Inc. | 33.516 | 2.785 | ||||||
| 2026-01-20 | 13F | Quintet Private Bank (Europe) S.A. | 50 | 4 | ||||||
| 2026-02-11 | 13F | Private Management Group Inc | 418.681 | 21,37 | 32.406 | 13,07 | ||||
| 2026-01-28 | 13F | CAPROCK Group, Inc. | 4.339 | 16,26 | 336 | 1,21 | ||||
| 2026-02-18 | 13F | Vident Advisory, LLC | 7.894 | -18,60 | 611 | -24,10 | ||||
| 2026-02-13 | 13F | Verition Fund Management LLC | 52.870 | -23,65 | 4.092 | -28,86 | ||||
| 2026-02-20 | 13F | Dean Capital Management | 18.445 | 3,19 | 1.428 | -3,91 | ||||
| 2026-02-13 | 13F | Osmosis Investment Management UK Ltd | 2.727 | 211 | ||||||
| 2026-02-13 | 13F | Wells Fargo & Company/mn | Put | 7.000 | 0,00 | 542 | -6,88 | |||
| 2026-01-23 | 13F | Gw Henssler & Associates Ltd | 0 | -100,00 | 0 | |||||
| 2026-02-12 | 13F | Tocqueville Asset Management L.p. | 279.152 | 49,36 | 21.606 | 39,14 | ||||
| 2026-02-13 | 13F | Arrowstreet Capital, Limited Partnership | 1.431.107 | 18,88 | 110.768 | 10,76 | ||||
| 2026-02-10 | 13F | Envestnet Asset Management Inc | 211.574 | -29,53 | 16.376 | -34,35 | ||||
| 2026-02-03 | 13F | Everence Capital Management Inc | 4.430 | 0,00 | 0 | |||||
| 2026-04-08 | 13F | DiNuzzo Private Wealth, Inc. | 18 | -5,26 | 1 | 0,00 | ||||
| 2026-01-15 | 13F | J. Safra Sarasin Holding AG | 11.104 | -26,06 | 859 | -31,11 | ||||
| 2026-02-12 | 13F | Colonial Trust Co / SC | 1.200 | -4,38 | 93 | -11,54 | ||||
| 2026-04-08 | 13F | Legacy Wealth Asset Management, LLC | 3.313 | -2,76 | 223 | -15,59 | ||||
| 2026-02-09 | 13F | Mizuho Securities Usa Llc | 17.238 | -2,44 | 1.306 | -16,83 | ||||
| 2026-02-17 | 13F | Limestone Investment Advisors LP | Call | 0 | -100,00 | 0 | -100,00 | |||
| 2026-02-17 | 13F | Limestone Investment Advisors LP | Put | 0 | -100,00 | 0 | -100,00 | |||
| 2026-02-13 | 13F | Glen Eagle Advisors, LLC | 262 | 0,00 | 20 | -4,76 | ||||
| 2025-10-23 | 13F | Lecap Asset Management Ltd | 0 | -100,00 | 0 | |||||
| 2026-02-03 | 13F | Costello Asset Management, INC | 300 | 0,00 | 23 | -4,17 | ||||
| 2026-01-29 | 13F | Pictet Asset Management Holding SA | 133.121 | 5,76 | 10.304 | -1,47 | ||||
| 2026-02-12 | 13F | Pitcairn Co | 0 | -100,00 | 0 | |||||
| 2026-02-17 | 13F | Siemens Fonds Invest GmbH | 3.447 | 0,00 | 273 | -4,55 | ||||
| 2026-01-14 | 13F | Smith Thornton Advisors LLC | 11.060 | 0,00 | 856 | -6,75 | ||||
| 2026-01-30 | 13F | Torren Management, LLC | 445 | 34 | ||||||
| 2026-02-17 | 13F | Point72 Asset Management, L.P. | 404.917 | -37,22 | 31.341 | -41,51 | ||||
| 2026-02-17 | 13F | Greenhouse Funds LLLP | 0 | -100,00 | 0 | |||||
| 2025-11-13 | 13F | Total Investment Management Inc | 0 | -100,00 | 0 |