Grundlæggende statistik
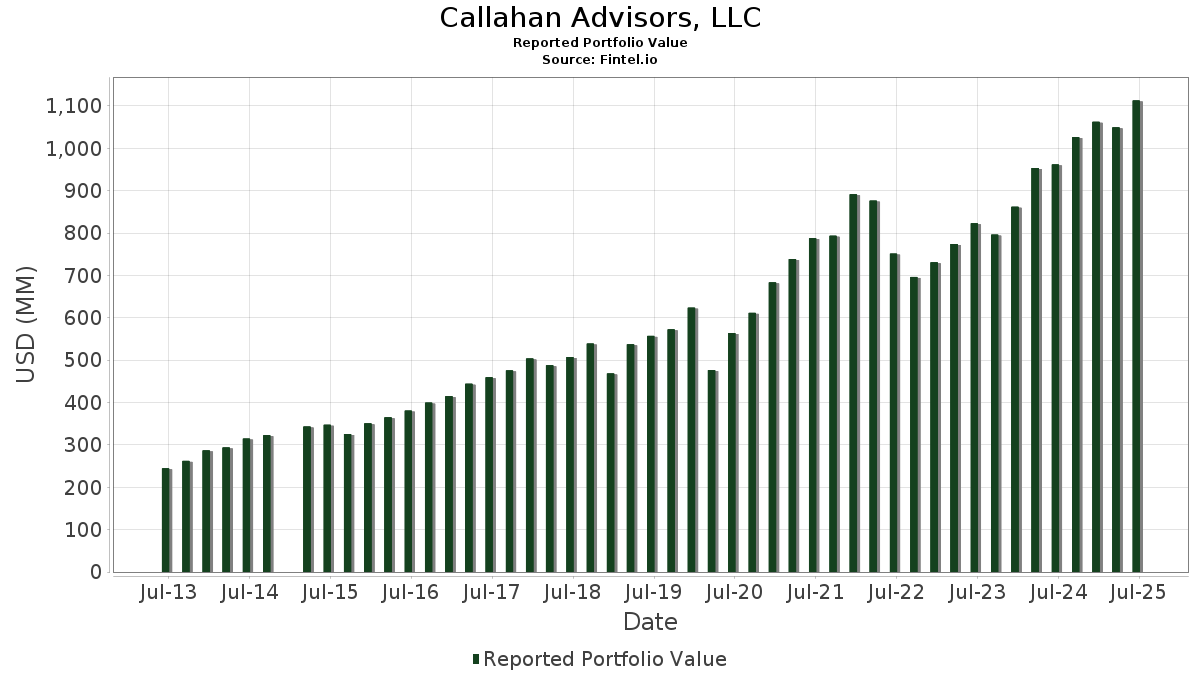
| Porteføljeværdi | $ 1.177.411.102 |
| Nuværende stillinger | 168 |
Seneste beholdninger, ydeevne, AUM (fra 13F, 13D)
Callahan Advisors, LLC har afsløret 168 samlede besiddelser i deres seneste SEC-arkivering. Den seneste porteføljeværdi er beregnet til at være $ 1.177.411.102 USD. Faktiske aktiver under forvaltning (AUM) er denne værdi plus kontanter (som ikke er oplyst). Callahan Advisors, LLCs største beholdninger er Meta Platforms, Inc. (US:META) , Alphabet Inc. (US:GOOG) , Microsoft Corporation (US:MSFT) , Amazon.com, Inc. (US:AMZN) , and Apple Inc. (US:AAPL) . Callahan Advisors, LLCs nye stillinger omfatter Kenvue Inc. (US:KVUE) , SouthState Bank Corporation (US:SSB) , .
Top øger dette kvartal
Vi bruger ændringen i porteføljeallokeringen, fordi dette er den mest meningsfulde metrik. Ændringer kan skyldes handler eller ændringer i aktiekurser.
| Sikkerhed | Aktier (MM) |
Værdi (MM$) |
Portefølje % | ΔPortefølje % |
|---|---|---|---|---|
| GOOG / Alphabet Inc. | 0,27 | 66,81 | 5,6743 | 1,3312 |
| AAPL / Apple Inc. | 0,15 | 37,19 | 3,1588 | 0,3889 |
| NVDA / NVIDIA Corporation | 0,16 | 29,35 | 2,4928 | 0,3742 |
| CAT / Caterpillar Inc. | 0,05 | 25,95 | 2,2040 | 0,2795 |
| JNJ / Johnson & Johnson | 0,12 | 22,94 | 1,9485 | 0,2533 |
| TSM / Taiwan Semiconductor Manufacturing Company Limited - Depositary Receipt (Common Stock) | 0,03 | 8,82 | 0,7495 | 0,2291 |
| NEE / NextEra Energy, Inc. | 0,33 | 24,60 | 2,0897 | 0,2184 |
| ASML / ASML Holding N.V. - Depositary Receipt (Common Stock) | 0,01 | 12,47 | 1,0591 | 0,2018 |
| URI / United Rentals, Inc. | 0,01 | 10,78 | 0,9159 | 0,1316 |
| IQV / IQVIA Holdings Inc. | 0,05 | 8,57 | 0,7278 | 0,1120 |
Top falder i dette kvartal
Vi bruger ændringen i porteføljeallokeringen, fordi dette er den mest meningsfulde metrik. Ændringer kan skyldes handler eller ændringer i aktiekurser.
| Sikkerhed | Aktier (MM) |
Værdi (MM$) |
Portefølje % | ΔPortefølje % |
|---|---|---|---|---|
| META / Meta Platforms, Inc. | 0,10 | 74,82 | 6,3542 | -0,4355 |
| CNI / Canadian National Railway Company | 0,08 | 7,36 | 0,6248 | -0,3731 |
| FTNT / Fortinet, Inc. | 0,14 | 11,59 | 0,9840 | -0,3009 |
| BKNG / Booking Holdings Inc. | 0,00 | 24,51 | 2,0819 | -0,2348 |
| ACN / Accenture plc | 0,02 | 5,15 | 0,4371 | -0,2202 |
| SYK / Stryker Corporation | 0,05 | 18,07 | 1,5351 | -0,2134 |
| AMZN / Amazon.com, Inc. | 0,22 | 49,19 | 4,1774 | -0,1877 |
| PAYX / Paychex, Inc. | 0,07 | 9,37 | 0,7954 | -0,1774 |
| CB / Chubb Limited | 0,10 | 26,98 | 2,2917 | -0,1474 |
| CTVA / Corteva, Inc. | 0,15 | 10,11 | 0,8589 | -0,1458 |
13F og Fondsarkivering
Denne formular blev indsendt den 2025-10-31 for rapporteringsperioden 2025-09-30. Klik på linkikonet for at se den fulde transaktionshistorik.
Opgrader for at låse op for premium-data og eksportere til Excel ![]() .
.
| Sikkerhed | Type | Gennemsnitlig aktiekurs | Aktier (MM) |
Δ Aktier (%) |
Δ Aktier (%) |
Værdi ($MM) |
Portefølje (%) |
ΔPortefølje (%) |
|
|---|---|---|---|---|---|---|---|---|---|
| META / Meta Platforms, Inc. | 0,10 | -0,47 | 74,82 | -0,97 | 6,3542 | -0,4355 | |||
| GOOG / Alphabet Inc. | 0,27 | 0,69 | 66,81 | 38,25 | 5,6743 | 1,3312 | |||
| MSFT / Microsoft Corporation | 0,12 | 0,06 | 64,59 | 4,19 | 5,4857 | -0,0854 | |||
| AMZN / Amazon.com, Inc. | 0,22 | 1,18 | 49,19 | 1,26 | 4,1774 | -0,1877 | |||
| AAPL / Apple Inc. | 0,15 | -2,77 | 37,19 | 20,67 | 3,1588 | 0,3889 | |||
| BN / Brookfield Corporation | 0,48 | -1,01 | 32,65 | 9,77 | 2,7734 | 0,0998 | |||
| JPM / JPMorgan Chase & Co. | 0,10 | -1,21 | 30,85 | 7,49 | 2,6204 | 0,0408 | |||
| BRK.B / Berkshire Hathaway Inc. | 0,06 | 0,89 | 29,61 | 4,42 | 2,5150 | -0,0336 | |||
| NVDA / NVIDIA Corporation | 0,16 | 5,42 | 29,35 | 24,50 | 2,4928 | 0,3742 | |||
| CB / Chubb Limited | 0,10 | 2,05 | 26,98 | -0,58 | 2,2917 | -0,1474 | |||
| CAT / Caterpillar Inc. | 0,05 | -1,41 | 25,95 | 21,18 | 2,2040 | 0,2795 | |||
| NEE / NextEra Energy, Inc. | 0,33 | 8,66 | 24,60 | 18,16 | 2,0897 | 0,2184 | |||
| BKNG / Booking Holdings Inc. | 0,00 | 1,95 | 24,51 | -4,91 | 2,0819 | -0,2348 | |||
| JNJ / Johnson & Johnson | 0,12 | 0,19 | 22,94 | 21,63 | 1,9485 | 0,2533 | |||
| PEP / PepsiCo, Inc. | 0,14 | 5,67 | 19,37 | 12,39 | 1,6450 | 0,0963 | |||
| EQT / EQT Corporation | 0,35 | 10,59 | 18,89 | 3,21 | 1,6040 | -0,0404 | |||
| PFE / Pfizer Inc. | 0,71 | 6,48 | 18,19 | 11,93 | 1,5447 | 0,0844 | |||
| SYK / Stryker Corporation | 0,05 | -0,58 | 18,07 | -7,10 | 1,5351 | -0,2134 | |||
| MA / Mastercard Incorporated | 0,03 | 8,66 | 17,62 | 9,99 | 1,4965 | 0,0568 | |||
| MCD / McDonald's Corporation | 0,06 | -0,23 | 17,61 | 3,78 | 1,4959 | -0,0294 | |||
| UNH / UnitedHealth Group Incorporated | 0,05 | 3,03 | 17,15 | 14,04 | 1,4567 | 0,1050 | |||
| PG / The Procter & Gamble Company | 0,11 | 0,70 | 16,42 | -2,88 | 1,3942 | -0,1248 | |||
| FDX / FedEx Corporation | 0,07 | -2,99 | 15,60 | 0,64 | 1,3247 | -0,0681 | |||
| WMT / Walmart Inc. | 0,15 | -3,23 | 15,51 | 1,99 | 1,3175 | -0,0494 | |||
| AMAT / Applied Materials, Inc. | 0,08 | -1,54 | 15,47 | 10,12 | 1,3138 | 0,0513 | |||
| XOM / Exxon Mobil Corporation | 0,14 | -4,23 | 15,36 | 0,17 | 1,3045 | -0,0735 | |||
| LOW / Lowe's Companies, Inc. | 0,06 | -0,97 | 15,10 | 12,18 | 1,2826 | 0,0727 | |||
| LLY / Eli Lilly and Company | 0,02 | 4,02 | 14,26 | 1,81 | 1,2114 | -0,0476 | |||
| CVX / Chevron Corporation | 0,09 | -2,02 | 13,47 | 6,26 | 1,1437 | 0,0048 | |||
| ASML / ASML Holding N.V. - Depositary Receipt (Common Stock) | 0,01 | 8,21 | 12,47 | 30,72 | 1,0591 | 0,2018 | |||
| STE / STERIS plc | 0,05 | 2,09 | 12,08 | 5,16 | 1,0256 | -0,0064 | |||
| FTNT / Fortinet, Inc. | 0,14 | 1,89 | 11,59 | -18,97 | 0,9840 | -0,3009 | |||
| ABT / Abbott Laboratories | 0,09 | 0,95 | 11,39 | -0,58 | 0,9673 | -0,0622 | |||
| URI / United Rentals, Inc. | 0,01 | -2,49 | 10,78 | 23,57 | 0,9159 | 0,1316 | |||
| EXP / Eagle Materials Inc. | 0,05 | 0,82 | 10,54 | 16,25 | 0,8948 | 0,0803 | |||
| CTVA / Corteva, Inc. | 0,15 | -0,32 | 10,11 | -9,54 | 0,8589 | -0,1458 | |||
| ADBE / Adobe Inc. | 0,03 | 19,17 | 9,76 | 8,66 | 0,8290 | 0,0217 | |||
| ETN / Eaton Corporation plc | 0,03 | 9,92 | 9,74 | 15,23 | 0,8270 | 0,0676 | |||
| CRM / Salesforce, Inc. | 0,04 | 22,13 | 9,58 | 6,15 | 0,8136 | 0,0026 | |||
| KMI / Kinder Morgan, Inc. | 0,34 | -6,41 | 9,54 | -9,88 | 0,8105 | -0,1411 | |||
| DY / Dycom Industries, Inc. | 0,03 | -6,57 | 9,50 | 11,54 | 0,8071 | 0,0414 | |||
| PAYX / Paychex, Inc. | 0,07 | -0,72 | 9,37 | -13,48 | 0,7954 | -0,1774 | |||
| TSM / Taiwan Semiconductor Manufacturing Company Limited - Depositary Receipt (Common Stock) | 0,03 | 23,58 | 8,82 | 52,40 | 0,7495 | 0,2291 | |||
| IQV / IQVIA Holdings Inc. | 0,05 | 3,77 | 8,57 | 25,06 | 0,7278 | 0,1120 | |||
| WELL / Welltower Inc. | 0,05 | 3,15 | 8,16 | 19,53 | 0,6929 | 0,0795 | |||
| CNI / Canadian National Railway Company | 0,08 | -26,91 | 7,36 | -33,75 | 0,6248 | -0,3731 | |||
| GOOGL / Alphabet Inc. | 0,03 | -6,42 | 7,17 | 29,10 | 0,6090 | 0,1098 | |||
| T / AT&T Inc. | 0,25 | -12,72 | 6,92 | -14,83 | 0,5881 | -0,1425 | |||
| CAH / Cardinal Health, Inc. | 0,04 | -9,06 | 6,80 | -15,03 | 0,5779 | -0,1418 | |||
| CTAS / Cintas Corporation | 0,03 | -0,94 | 6,75 | -8,77 | 0,5736 | -0,0917 | |||
| CVS / CVS Health Corporation | 0,09 | 15,86 | 6,70 | 26,63 | 0,5686 | 0,0935 | |||
| DIS / The Walt Disney Company | 0,05 | -4,14 | 6,16 | -11,50 | 0,5231 | -0,1023 | |||
| WTW / Willis Towers Watson Public Limited Company | 0,02 | 2,37 | 6,11 | 15,39 | 0,5190 | 0,0430 | |||
| ENB / Enbridge Inc. | 0,12 | 1,48 | 6,06 | 13,00 | 0,5146 | 0,0327 | |||
| AXP / American Express Company | 0,02 | 0,01 | 5,92 | 4,13 | 0,5029 | -0,0081 | |||
| VRSK / Verisk Analytics, Inc. | 0,02 | 0,62 | 5,15 | -18,76 | 0,4378 | -0,1324 | |||
| ACN / Accenture plc | 0,02 | -14,71 | 5,15 | -29,63 | 0,4371 | -0,2202 | |||
| STEL / Stellar Bancorp, Inc. | 0,16 | 0,00 | 4,94 | 8,43 | 0,4193 | 0,0101 | |||
| PLD / Prologis, Inc. | 0,04 | 10,58 | 4,69 | 20,46 | 0,3986 | 0,0485 | |||
| CSCO / Cisco Systems, Inc. | 0,07 | -0,36 | 4,58 | -1,74 | 0,3889 | -0,0299 | |||
| WDAY / Workday, Inc. | 0,02 | 1,91 | 4,11 | 2,21 | 0,3490 | -0,0123 | |||
| TRI / Thomson Reuters Corporation | 0,03 | 0,00 | 4,09 | -22,77 | 0,3471 | -0,1285 | |||
| SLB / SLB N.V. | 0,12 | -7,70 | 3,98 | -6,13 | 0,3380 | -0,0430 | |||
| PAYC / Paycom Software, Inc. | 0,02 | -7,49 | 3,86 | -16,80 | 0,3277 | -0,0890 | |||
| NOW / ServiceNow, Inc. | 0,00 | 1,01 | 3,59 | -9,57 | 0,3048 | -0,0519 | |||
| NTRS / Northern Trust Corporation | 0,03 | 5,94 | 3,57 | 12,46 | 0,3035 | 0,0179 | |||
| KO / The Coca-Cola Company | 0,05 | 0,06 | 3,57 | -6,20 | 0,3033 | -0,0388 | |||
| HD / The Home Depot, Inc. | 0,01 | 0,37 | 3,43 | 10,93 | 0,2914 | 0,0134 | |||
| CFR / Cullen/Frost Bankers, Inc. | 0,03 | 1,86 | 3,42 | 0,47 | 0,2907 | -0,0155 | |||
| ENTG / Entegris, Inc. | 0,03 | -6,94 | 3,18 | 6,71 | 0,2701 | 0,0022 | |||
| V / Visa Inc. | 0,01 | 0,00 | 3,15 | -3,84 | 0,2679 | -0,0269 | |||
| LAZ / Lazard, Inc. | 0,06 | -0,47 | 3,10 | 9,51 | 0,2631 | 0,0088 | |||
| TJX / The TJX Companies, Inc. | 0,02 | 3,24 | 3,10 | 20,84 | 0,2630 | 0,0327 | |||
| BRK.A / Berkshire Hathaway Inc. | 0,00 | 0,00 | 3,02 | 3,46 | 0,2562 | -0,0058 | |||
| HSY / The Hershey Company | 0,02 | -0,26 | 2,96 | 12,43 | 0,2512 | 0,0148 | |||
| ZTS / Zoetis Inc. | 0,02 | 1,61 | 2,74 | -4,67 | 0,2324 | -0,0256 | |||
| EOG / EOG Resources, Inc. | 0,02 | -12,21 | 2,71 | -17,71 | 0,2301 | -0,0658 | |||
| SKWD / Skyward Specialty Insurance Group, Inc. | 0,05 | 0,00 | 2,52 | -17,69 | 0,2142 | -0,0612 | |||
| RTX / RTX Corporation | 0,01 | 0,01 | 2,49 | 14,60 | 0,2114 | 0,0162 | |||
| GD / General Dynamics Corporation | 0,01 | 0,00 | 2,44 | 16,94 | 0,2070 | 0,0197 | |||
| EPD / Enterprise Products Partners L.P. - Limited Partnership | 0,08 | -7,86 | 2,41 | -7,10 | 0,2046 | -0,0284 | |||
| LMT / Lockheed Martin Corporation | 0,00 | 0,26 | 2,35 | 8,05 | 0,1996 | 0,0041 | |||
| BHP / BHP Group Limited - Depositary Receipt (Common Stock) | 0,04 | -5,45 | 2,33 | 9,58 | 0,1982 | 0,0069 | |||
| DHR / Danaher Corporation | 0,01 | -7,12 | 2,33 | -6,81 | 0,1978 | -0,0267 | |||
| UL / Unilever PLC - Depositary Receipt (Common Stock) | 0,04 | 0,00 | 2,23 | -3,09 | 0,1893 | -0,0174 | |||
| SPY / SPDR S&P 500 ETF | 0,00 | 92,96 | 2,19 | 108,07 | 0,1861 | 0,0915 | |||
| DHI / D.R. Horton, Inc. | 0,01 | 3,63 | 2,12 | 36,21 | 0,1799 | 0,0402 | |||
| PM / Philip Morris International Inc. | 0,01 | 0,47 | 2,09 | -10,52 | 0,1778 | -0,0325 | |||
| SCHB / Schwab Strategic Trust - Schwab U.S. Broad Market ETF | 0,08 | 20,14 | 2,01 | 29,68 | 0,1711 | 0,0314 | |||
| MRK / Merck & Co., Inc. | 0,02 | -8,33 | 2,01 | -2,81 | 0,1705 | -0,0151 | |||
| FLOT / iShares Trust - iShares Floating Rate Bond ETF | 0,04 | 15,80 | 1,97 | 15,93 | 0,1676 | 0,0146 | |||
| BFB / Brown-Forman Corp. - Class B | 0,07 | -17,31 | 1,94 | -16,77 | 0,1648 | -0,0448 | |||
| DEO / Diageo plc - Depositary Receipt (Common Stock) | 0,02 | 5,20 | 1,83 | -0,44 | 0,1552 | -0,0097 | |||
| BFK / BlackRock Municipal Income Trust | 0,18 | -3,09 | 1,80 | 1,58 | 0,1531 | -0,0064 | |||
| NKE / NIKE, Inc. | 0,02 | -13,33 | 1,71 | -14,93 | 0,1453 | -0,0354 | |||
| QSR / Restaurant Brands International Inc. | 0,03 | 0,00 | 1,61 | -3,25 | 0,1364 | -0,0128 | |||
| FE / FirstEnergy Corp. | 0,03 | 0,00 | 1,49 | 13,80 | 0,1269 | 0,0089 | |||
| ABBV / AbbVie Inc. | 0,01 | 3,00 | 1,37 | 28,57 | 0,1162 | 0,0205 | |||
| GPN / Global Payments Inc. | 0,02 | -37,97 | 1,34 | -35,65 | 0,1140 | -0,0733 | |||
| KVUE / Kenvue Inc. | 0,08 | 1,31 | 0,1110 | 0,1110 | |||||
| UNP / Union Pacific Corporation | 0,01 | 0,49 | 1,26 | 3,20 | 0,1067 | -0,0027 | |||
| IBM / International Business Machines Corporation | 0,00 | -26,33 | 1,23 | -29,53 | 0,1045 | -0,0523 | |||
| WM / Waste Management, Inc. | 0,01 | 0,24 | 1,21 | -3,27 | 0,1029 | -0,0096 | |||
| AVGO / Broadcom Inc. | 0,00 | -0,71 | 1,16 | 18,85 | 0,0986 | 0,0108 | |||
| MAIN / Main Street Capital Corporation | 0,02 | 5,21 | 1,14 | 13,19 | 0,0969 | 0,0063 | |||
| FI / Fiserv, Inc. | 0,01 | -0,91 | 1,14 | -25,91 | 0,0967 | -0,0414 | |||
| BLE / BlackRock Municipal Income Trust II | 0,09 | -13,78 | 0,99 | -10,25 | 0,0840 | -0,0150 | |||
| FRD / Friedman Industries, Incorporated | 0,04 | -11,89 | 0,96 | 16,61 | 0,0811 | 0,0074 | |||
| SBUX / Starbucks Corporation | 0,01 | -38,22 | 0,94 | -42,94 | 0,0800 | -0,0684 | |||
| RF / Regions Financial Corporation | 0,03 | 0,00 | 0,89 | 12,12 | 0,0755 | 0,0042 | |||
| FFIN / First Financial Bankshares, Inc. | 0,02 | 0,00 | 0,84 | -6,49 | 0,0711 | -0,0093 | |||
| BIP / Brookfield Infrastructure Partners L.P. - Limited Partnership | 0,03 | 0,40 | 0,83 | -1,42 | 0,0709 | -0,0052 | |||
| OKE / ONEOK, Inc. | 0,01 | -5,52 | 0,80 | -15,55 | 0,0683 | -0,0173 | |||
| COP / ConocoPhillips | 0,01 | 0,02 | 0,80 | 5,43 | 0,0676 | -0,0002 | |||
| ORCL / Oracle Corporation | 0,00 | -39,39 | 0,78 | -21,99 | 0,0660 | -0,0236 | |||
| MO / Altria Group, Inc. | 0,01 | 0,62 | 0,74 | 13,41 | 0,0632 | 0,0042 | |||
| FANG / Diamondback Energy, Inc. | 0,01 | -2,16 | 0,73 | 1,96 | 0,0617 | -0,0024 | |||
| COST / Costco Wholesale Corporation | 0,00 | 10,00 | 0,71 | 2,74 | 0,0606 | -0,0017 | |||
| CRGY / Crescent Energy Company | 0,07 | 19,00 | 0,65 | 23,33 | 0,0549 | 0,0078 | |||
| MVT / BlackRock MuniVest Fund II, Inc. | 0,06 | -5,02 | 0,60 | -2,27 | 0,0512 | -0,0042 | |||
| DLTR / Dollar Tree, Inc. | 0,01 | 1,26 | 0,53 | -3,64 | 0,0450 | -0,0043 | |||
| NFLX / Netflix, Inc. | 0,00 | 0,00 | 0,53 | -10,41 | 0,0446 | -0,0081 | |||
| REGN / Regeneron Pharmaceuticals, Inc. | 0,00 | -0,43 | 0,52 | 6,73 | 0,0445 | 0,0003 | |||
| BNS / The Bank of Nova Scotia | 0,01 | 32,17 | 0,50 | 54,77 | 0,0427 | 0,0135 | |||
| BMY / Bristol-Myers Squibb Company | 0,01 | -3,58 | 0,50 | -6,03 | 0,0424 | -0,0054 | |||
| IBOC / International Bancshares Corporation | 0,01 | 0,00 | 0,48 | 3,45 | 0,0408 | -0,0010 | |||
| TSLA / Tesla, Inc. | 0,00 | 0,48 | 0,46 | 40,73 | 0,0394 | 0,0098 | |||
| BKN / BlackRock Investment Quality Municipal Trust Inc. | 0,04 | -0,01 | 0,46 | 3,83 | 0,0392 | -0,0007 | |||
| VOO / Vanguard Index Funds - Vanguard S&P 500 ETF | 0,00 | 0,13 | 0,46 | 8,00 | 0,0390 | 0,0008 | |||
| NUV / Nuveen Municipal Value Fund, Inc. | 0,05 | 0,77 | 0,42 | 4,26 | 0,0354 | -0,0006 | |||
| IESC / IES Holdings, Inc. | 0,00 | 0,00 | 0,40 | 34,12 | 0,0338 | 0,0072 | |||
| LRCX / Lam Research Corporation | 0,00 | 3,68 | 0,40 | 42,60 | 0,0336 | 0,0087 | |||
| ISRG / Intuitive Surgical, Inc. | 0,00 | -0,23 | 0,39 | -17,91 | 0,0327 | -0,0095 | |||
| PAA / Plains All American Pipeline, L.P. - Limited Partnership | 0,02 | 0,09 | 0,37 | -6,78 | 0,0315 | -0,0043 | |||
| QQQ / Invesco QQQ Trust, Series 1 | 0,00 | 25,92 | 0,35 | 36,86 | 0,0297 | 0,0068 | |||
| GILD / Gilead Sciences, Inc. | 0,00 | 0,16 | 0,35 | 0,29 | 0,0297 | -0,0016 | |||
| VOX / Vanguard World Fund - Vanguard Communication Services ETF | 0,00 | 0,00 | 0,33 | 9,70 | 0,0279 | 0,0010 | |||
| TXN / Texas Instruments Incorporated | 0,00 | 0,28 | 0,33 | -11,35 | 0,0279 | -0,0054 | |||
| PSX / Phillips 66 | 0,00 | 0,00 | 0,31 | 14,29 | 0,0265 | 0,0019 | |||
| EMR / Emerson Electric Co. | 0,00 | -17,54 | 0,31 | -18,73 | 0,0262 | -0,0080 | |||
| O / Realty Income Corporation | 0,00 | 2,60 | 0,30 | 8,33 | 0,0254 | 0,0006 | |||
| SSB / SouthState Bank Corporation | 0,00 | 0,30 | 0,0252 | 0,0252 | |||||
| GLD / SPDR Gold Trust | 0,00 | 1,90 | 0,29 | 19,17 | 0,0243 | 0,0027 | |||
| MMM / 3M Company | 0,00 | -24,30 | 0,28 | -22,89 | 0,0241 | -0,0089 | |||
| STZ / Constellation Brands, Inc. | 0,00 | -0,67 | 0,28 | -17,75 | 0,0237 | -0,0068 | |||
| BX / Blackstone Inc. | 0,00 | 0,18 | 0,28 | 14,40 | 0,0237 | 0,0018 | |||
| VHT / Vanguard World Fund - Vanguard Health Care ETF | 0,00 | 0,00 | 0,28 | 4,56 | 0,0234 | -0,0003 | |||
| PR / Permian Resources Corporation | 0,02 | 39,81 | 0,27 | 31,22 | 0,0229 | 0,0045 | |||
| ARCC / Ares Capital Corporation | 0,01 | -24,13 | 0,27 | -29,58 | 0,0229 | -0,0115 | |||
| VCIT / Vanguard Scottsdale Funds - Vanguard Intermediate-Term Corporate Bond ETF | 0,00 | 6,02 | 0,26 | 7,82 | 0,0223 | 0,0004 | |||
| SO / The Southern Company | 0,00 | 0,00 | 0,26 | 3,24 | 0,0217 | -0,0005 | |||
| VTI / Vanguard Index Funds - Vanguard Total Stock Market ETF | 0,00 | -5,90 | 0,25 | 1,62 | 0,0213 | -0,0009 | |||
| GEV / GE Vernova Inc. | 0,00 | 0,00 | 0,25 | 16,28 | 0,0213 | 0,0019 | |||
| CADE / Cadence Bank | 0,01 | 0,00 | 0,25 | 17,22 | 0,0209 | 0,0021 | |||
| BRO / Brown & Brown, Inc. | 0,00 | 0,00 | 0,23 | -15,44 | 0,0196 | -0,0049 | |||
| TRP / TC Energy Corporation | 0,00 | 0,00 | 0,23 | 11,76 | 0,0194 | 0,0010 | |||
| VGT / Vanguard World Fund - Vanguard Information Technology ETF | 0,00 | 0,00 | 0,23 | 12,44 | 0,0193 | 0,0012 | |||
| MRVL / Marvell Technology, Inc. | 0,00 | 0,00 | 0,23 | 8,65 | 0,0193 | 0,0005 | |||
| GE / General Electric Company | 0,00 | -26,10 | 0,22 | -13,67 | 0,0188 | -0,0042 | |||
| VIG / Vanguard Specialized Funds - Vanguard Dividend Appreciation ETF | 0,00 | -11,16 | 0,22 | -6,03 | 0,0185 | -0,0024 | |||
| CRWD / CrowdStrike Holdings, Inc. | 0,00 | 0,00 | 0,22 | -3,56 | 0,0185 | -0,0018 | |||
| PAGP / Plains GP Holdings, L.P. - Limited Partnership | 0,01 | 0,21 | 0,0180 | 0,0180 | |||||
| VZ / Verizon Communications Inc. | 0,00 | 0,21 | 0,0179 | 0,0179 | |||||
| DVN / Devon Energy Corporation | 0,01 | -6,31 | 0,21 | 2,99 | 0,0176 | -0,0004 | |||
| CP / Canadian Pacific Kansas City Limited | 0,00 | -11,50 | 0,21 | -16,94 | 0,0175 | -0,0048 | |||
| ARLP / Alliance Resource Partners, L.P. - Limited Partnership | 0,01 | -32,20 | 0,20 | -34,42 | 0,0172 | -0,0105 | |||
| SLNG / Stabilis Solutions, Inc. | 0,03 | 0,00 | 0,12 | -8,27 | 0,0104 | -0,0016 | |||
| REI / Ring Energy, Inc. | 0,03 | -6,65 | 0,03 | 30,43 | 0,0026 | 0,0005 | |||
| BAC / Bank of America Corporation | 0,00 | -100,00 | 0,00 | -100,00 | -0,0182 | ||||
| SSB / SouthState Bank Corporation | 0,00 | -100,00 | 0,00 | 0,0000 | |||||
| AR / Antero Resources Corporation | 0,00 | -100,00 | 0,00 | 0,0000 | |||||
| MKTX / MarketAxess Holdings Inc. | 0,00 | -100,00 | 0,00 | 0,0000 | |||||
| DOW / Dow Inc. | 0,00 | -100,00 | 0,00 | 0,0000 | |||||
| IIM / Invesco Value Municipal Income Trust | 0,00 | -100,00 | 0,00 | 0,0000 | |||||
| ICE / Intercontinental Exchange, Inc. | 0,00 | -100,00 | 0,00 | 0,0000 | |||||
| PANW / Palo Alto Networks, Inc. | 0,00 | -100,00 | 0,00 | 0,0000 | |||||
| CRK / Comstock Resources, Inc. | 0,00 | -100,00 | 0,00 | 0,0000 |