Grundlæggende statistik
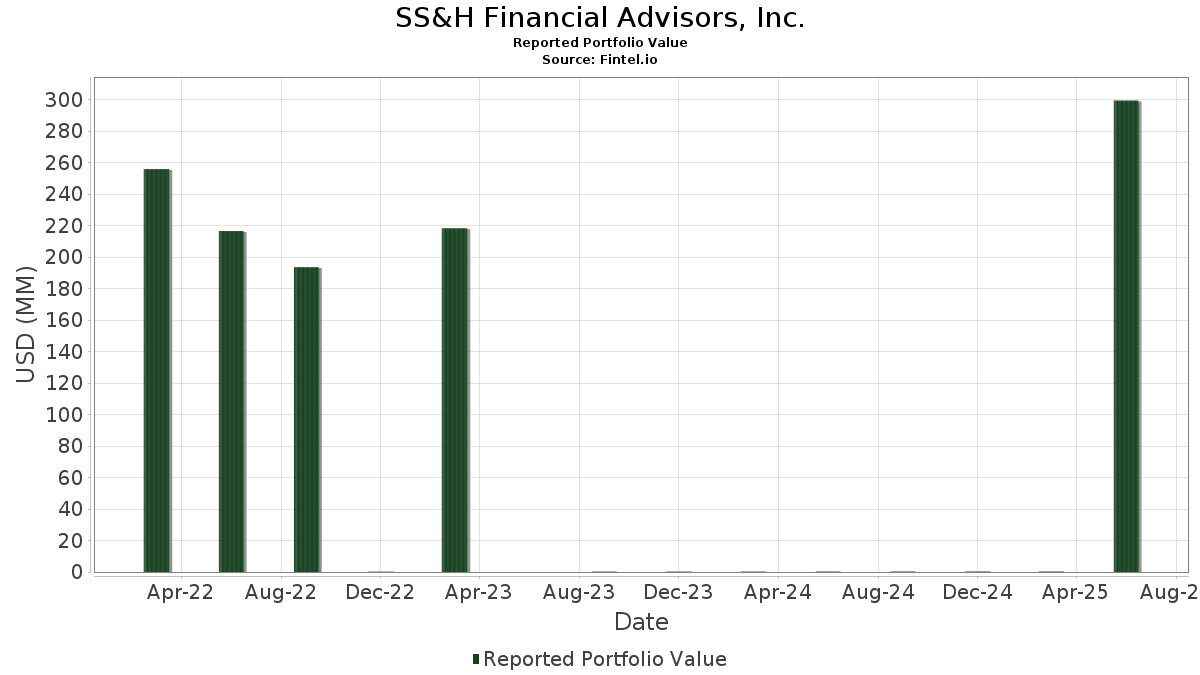
| Porteføljeværdi | $ 299.325.445 |
| Nuværende stillinger | 123 |
Seneste beholdninger, ydeevne, AUM (fra 13F, 13D)
SS&H Financial Advisors, Inc. har afsløret 123 samlede besiddelser i deres seneste SEC-arkivering. Den seneste porteføljeværdi er beregnet til at være $ 299.325.445 USD. Faktiske aktiver under forvaltning (AUM) er denne værdi plus kontanter (som ikke er oplyst). SS&H Financial Advisors, Inc.s største beholdninger er JPMorgan Chase & Co. (US:JPM) , NVIDIA Corporation (US:NVDA) , Microsoft Corporation (US:MSFT) , Apple Inc. (US:AAPL) , and Strats Trust For Procter & Gambel Security - Preferred Security (US:GJR) . SS&H Financial Advisors, Inc.s nye stillinger omfatter RTX Corporation (US:RTX) , abrdn Precious Metals Basket ETF - abrdn Physical Precious Metals Basket Shares ETF (US:GLTR) , Broadcom Inc. (US:AVGO) , .
Top øger dette kvartal
Vi bruger ændringen i porteføljeallokeringen, fordi dette er den mest meningsfulde metrik. Ændringer kan skyldes handler eller ændringer i aktiekurser.
| Sikkerhed | Aktier (MM) |
Værdi (MM$) |
Portefølje % | ΔPortefølje % |
|---|---|---|---|---|
| 0,02 | 5,98 | 1,9984 | 1,9984 | |
| 0,14 | 22,29 | 7,4452 | 1,6730 | |
| 0,04 | 21,10 | 7,0506 | 0,9071 | |
| 0,04 | 9,13 | 3,0487 | 0,8369 | |
| 0,07 | 10,54 | 3,5215 | 0,7187 | |
| 0,11 | 30,60 | 10,2220 | 0,5771 | |
| 0,03 | 3,94 | 1,3147 | 0,4470 | |
| 0,05 | 5,78 | 1,9324 | 0,2734 | |
| 0,01 | 4,28 | 1,4307 | 0,2646 | |
| 0,01 | 1,92 | 0,6414 | 0,2408 |
Top falder i dette kvartal
Vi bruger ændringen i porteføljeallokeringen, fordi dette er den mest meningsfulde metrik. Ændringer kan skyldes handler eller ændringer i aktiekurser.
| Sikkerhed | Aktier (MM) |
Værdi (MM$) |
Portefølje % | ΔPortefølje % |
|---|---|---|---|---|
| 0,07 | 15,00 | 5,0117 | -1,6067 | |
| 0,01 | 3,33 | 1,1126 | -0,4072 | |
| 0,05 | 2,45 | 0,8196 | -0,4066 | |
| 0,02 | 3,62 | 1,2097 | -0,3534 | |
| 0,02 | 2,60 | 0,8699 | -0,3351 | |
| 0,03 | 3,39 | 1,1333 | -0,3198 | |
| 0,04 | 8,32 | 2,7788 | -0,2762 | |
| 0,00 | 0,00 | 0,0000 | -0,2652 | |
| 0,03 | 4,54 | 1,5163 | -0,2632 | |
| 0,01 | 1,15 | 0,3848 | -0,2076 |
13F og Fondsarkivering
Denne formular blev indsendt den 2025-08-05 for rapporteringsperioden 2025-06-30. Klik på linkikonet for at se den fulde transaktionshistorik.
Opgrader for at låse op for premium-data og eksportere til Excel ![]() .
.
| Sikkerhed | Type | Gennemsnitlig aktiekurs | Aktier (MM) |
Δ Aktier (%) |
Δ Aktier (%) |
Værdi ($MM) |
Portefølje (%) |
ΔPortefølje (%) |
|
|---|---|---|---|---|---|---|---|---|---|
| JPM / JPMorgan Chase & Co. | 0,11 | 0,13 | 30,60 | 122.288,00 | 10,2220 | 0,5771 | |||
| NVDA / NVIDIA Corporation | 0,14 | -1,20 | 22,29 | 148.466,67 | 7,4452 | 1,6730 | |||
| MSFT / Microsoft Corporation | 0,04 | -3,29 | 21,10 | 131.800,00 | 7,0506 | 0,9071 | |||
| AAPL / Apple Inc. | 0,07 | -8,45 | 15,00 | 88.141,18 | 5,0117 | -1,6067 | |||
| GJR / Strats Trust For Procter & Gambel Security - Preferred Security | 0,07 | 50,08 | 10,54 | 150.471,43 | 3,5215 | 0,7187 | |||
| ABBV / AbbVie Inc. | 0,05 | 20,37 | 9,14 | 114.087,50 | 3,0520 | -0,1439 | |||
| ORCL / Oracle Corporation | 0,04 | -1,57 | 9,13 | 182.400,00 | 3,0487 | 0,8369 | |||
| AMZN / Amazon.com, Inc. | 0,04 | -11,92 | 8,32 | 103.862,50 | 2,7788 | -0,2762 | |||
| IBM / International Business Machines Corporation | 0,03 | 1,61 | 7,43 | 123.766,67 | 2,4832 | 0,1815 | |||
| SPGI / S&P Global Inc. | 0,01 | 0,00 | 6,27 | 104.350,00 | 2,0940 | -0,1592 | |||
| SHW / The Sherwin-Williams Company | 0,02 | 5,98 | 1,9984 | 1,9984 | |||||
| XOM / Exxon Mobil Corporation | 0,05 | 43,50 | 5,78 | 144.500,00 | 1,9324 | 0,2734 | |||
| CSCO / Cisco Systems, Inc. | 0,07 | -1,31 | 4,69 | 117.200,00 | 1,5676 | -0,0100 | |||
| GOOG / Alphabet Inc. | 0,03 | -16,21 | 4,54 | 113.350,00 | 1,5163 | -0,2632 | |||
| GLD / SPDR Gold Trust | 0,01 | 29,50 | 4,28 | 142.633,33 | 1,4307 | 0,2646 | |||
| MRK / Merck & Co., Inc. | 0,05 | 20,93 | 4,19 | 139.566,67 | 1,4001 | -0,0660 | |||
| ABT / Abbott Laboratories | 0,03 | 65,02 | 3,94 | 196.650,00 | 1,3147 | 0,4470 | |||
| T / AT&T Inc. | 0,13 | 2,22 | 3,89 | 129.633,33 | 1,3005 | -0,0877 | |||
| GE / General Electric Company | 0,01 | 0,00 | 3,85 | 192.400,00 | 1,2863 | 0,1694 | |||
| UNP / Union Pacific Corporation | 0,02 | -11,28 | 3,62 | 90.425,00 | 1,2097 | -0,3534 | |||
| PEP / PepsiCo, Inc. | 0,03 | -1,09 | 3,39 | 112.966,67 | 1,1333 | -0,3198 | |||
| AMGN / Amgen Inc. | 0,01 | -8,79 | 3,33 | 83.150,00 | 1,1126 | -0,4072 | |||
| V / Visa Inc. | 0,01 | -3,09 | 3,28 | 109.300,00 | 1,0967 | -0,1508 | |||
| GLW / Corning Incorporated | 0,06 | 0,97 | 3,28 | 163.750,00 | 1,0949 | 0,0410 | |||
| CL / Colgate-Palmolive Company | 0,04 | 7,22 | 3,20 | 106.566,67 | 1,0694 | -0,0785 | |||
| BAC / Bank of America Corporation | 0,07 | -1,50 | 3,19 | 159.600,00 | 1,0672 | 0,0003 | |||
| COST / Costco Wholesale Corporation | 0,00 | 0,00 | 3,12 | 156.000,00 | 1,0433 | -0,0695 | |||
| KO / The Coca-Cola Company | 0,04 | 0,00 | 2,80 | 139.800,00 | 0,9350 | -0,1219 | |||
| VZ / Verizon Communications Inc. | 0,06 | 2,61 | 2,73 | 136.250,00 | 0,9111 | -0,1283 | |||
| ACN / Accenture plc | 0,01 | -0,83 | 2,67 | 133.600,00 | 0,8935 | -0,1570 | |||
| LRCX / Lam Research Corporation | 0,03 | -6,05 | 2,64 | 132.050,00 | 0,8832 | 0,0991 | |||
| JNJ / Johnson & Johnson | 0,02 | -12,47 | 2,60 | 86.666,67 | 0,8699 | -0,3351 | |||
| MU / Micron Technology, Inc. | 0,02 | 0,00 | 2,56 | 255.800,00 | 0,8550 | 0,1820 | |||
| TSCO / Tractor Supply Company | 0,05 | 0,00 | 2,54 | 127.000,00 | 0,8495 | -0,1410 | |||
| MCK / McKesson Corporation | 0,00 | 0,00 | 2,49 | 124.450,00 | 0,8324 | -0,0212 | |||
| BMY / Bristol-Myers Squibb Company | 0,05 | -1,67 | 2,45 | 81.666,67 | 0,8196 | -0,4066 | |||
| AFL / Aflac Incorporated | 0,02 | -3,15 | 2,43 | 121.450,00 | 0,8123 | -0,1752 | |||
| FLR / Fluor Corporation | 0,05 | -2,12 | 2,36 | 236.200,00 | 0,7896 | 0,1603 | |||
| DE / Deere & Company | 0,00 | 0,00 | 2,02 | 202.200,00 | 0,6759 | -0,0209 | |||
| PFE / Pfizer Inc. | 0,08 | 24,20 | 1,95 | 194.800,00 | 0,6512 | 0,0393 | |||
| EMR / Emerson Electric Co. | 0,01 | 46,94 | 1,92 | 191.800,00 | 0,6414 | 0,2408 | |||
| SLB / Schlumberger Limited | 0,06 | 10,23 | 1,92 | 95.650,00 | 0,6401 | -0,1620 | |||
| ITA / iShares Trust - iShares U.S. Aerospace & Defense ETF | 0,01 | -23,67 | 1,83 | 182.400,00 | 0,6097 | -0,1144 | |||
| BA / The Boeing Company | 0,01 | -3,42 | 1,78 | 177.500,00 | 0,5936 | 0,0351 | |||
| MA / Mastercard Incorporated | 0,00 | -0,80 | 1,74 | 174.300,00 | 0,5827 | -0,0571 | |||
| NEE / NextEra Energy, Inc. | 0,02 | -14,24 | 1,67 | 167.100,00 | 0,5588 | -0,1843 | |||
| SPY / SPDR S&P 500 ETF | 0,00 | 0,00 | 1,64 | 164.000,00 | 0,5482 | -0,0061 | |||
| ITW / Illinois Tool Works Inc. | 0,01 | 0,00 | 1,52 | 151.900,00 | 0,5080 | -0,0609 | |||
| NSC / Norfolk Southern Corporation | 0,01 | 0,00 | 1,43 | 143.200,00 | 0,4789 | -0,0158 | |||
| AWK / American Water Works Company, Inc. | 0,01 | -16,51 | 1,41 | 140.500,00 | 0,4700 | -0,1967 | |||
| CAT / Caterpillar Inc. | 0,00 | 0,00 | 1,37 | 136.700,00 | 0,4572 | 0,0233 | |||
| CVX / Chevron Corporation | 0,01 | -4,12 | 1,33 | 133.200,00 | 0,4454 | -0,1608 | |||
| AEP / American Electric Power Company, Inc. | 0,01 | -20,14 | 1,23 | 123.300,00 | 0,4124 | -0,1949 | |||
| META / Meta Platforms, Inc. | 0,00 | 0,00 | 1,21 | 0,4034 | 0,0516 | ||||
| GOOGL / Alphabet Inc. | 0,01 | -36,35 | 1,15 | 115.000,00 | 0,3848 | -0,2076 | |||
| PFF / iShares Trust - iShares Preferred and Income Securities ETF | 0,04 | 6,95 | 1,15 | 114.400,00 | 0,3826 | -0,0173 | |||
| MAIN / Main Street Capital Corporation | 0,02 | 0,00 | 1,13 | 113.300,00 | 0,3791 | -0,0260 | |||
| HII / Huntington Ingalls Industries, Inc. | 0,00 | -4,17 | 1,11 | 0,3707 | 0,0058 | ||||
| HON / Honeywell International Inc. | 0,00 | -17,54 | 1,10 | 109.400,00 | 0,3658 | -0,0845 | |||
| MAR / Marriott International, Inc. | 0,00 | 0,00 | 1,07 | 0,3560 | 0,0094 | ||||
| WMT / Walmart Inc. | 0,01 | -4,64 | 1,00 | 0,3345 | -0,0173 | ||||
| COP / ConocoPhillips | 0,01 | 0,00 | 0,98 | 97.800,00 | 0,3272 | -0,1003 | |||
| LLY / Eli Lilly and Company | 0,00 | 8,82 | 0,96 | 0,3214 | -0,0282 | ||||
| ATO / Atmos Energy Corporation | 0,01 | 0,00 | 0,88 | 0,2942 | -0,0352 | ||||
| DRI / Darden Restaurants, Inc. | 0,00 | -27,40 | 0,84 | 83.900,00 | 0,2807 | -0,1308 | |||
| KMB / Kimberly-Clark Corporation | 0,01 | 6,56 | 0,84 | 0,2800 | -0,0439 | ||||
| INTU / Intuit Inc. | 0,00 | -11,58 | 0,82 | 0,2752 | 0,0044 | ||||
| TJX / The TJX Companies, Inc. | 0,01 | 0,00 | 0,82 | 0,2723 | -0,0276 | ||||
| MPC / Marathon Petroleum Corporation | 0,00 | 0,00 | 0,81 | 0,2691 | 0,0054 | ||||
| ADP / Automatic Data Processing, Inc. | 0,00 | -36,18 | 0,76 | 76.000,00 | 0,2545 | -0,1865 | |||
| RTX / RTX Corporation | 0,01 | 0,76 | 0,0000 | ||||||
| GIS / General Mills, Inc. | 0,01 | -9,31 | 0,76 | 0,2528 | -0,1064 | ||||
| NKE / NIKE, Inc. | 0,01 | -22,70 | 0,73 | 0,2425 | -0,0705 | ||||
| FDX / FedEx Corporation | 0,00 | 0,00 | 0,65 | 0,2183 | -0,0432 | ||||
| DTM / DT Midstream, Inc. | 0,01 | 0,00 | 0,65 | 0,2166 | 0,0044 | ||||
| ZTS / Zoetis Inc. | 0,00 | -26,70 | 0,64 | 0,2146 | -0,1305 | ||||
| NOC / Northrop Grumman Corporation | 0,00 | 0,00 | 0,63 | 0,2096 | -0,0302 | ||||
| DOW / Dow Inc. | 0,02 | -12,92 | 0,62 | 0,2080 | -0,1438 | ||||
| DTE / DTE Energy Company | 0,00 | -9,80 | 0,61 | 0,2036 | -0,0594 | ||||
| CI / The Cigna Group | 0,00 | 25,48 | 0,61 | 0,2023 | 0,0233 | ||||
| MCD / McDonald's Corporation | 0,00 | -16,10 | 0,58 | 0,1942 | -0,0822 | ||||
| SYK / Stryker Corporation | 0,00 | 0,00 | 0,55 | 0,1850 | -0,0093 | ||||
| VTRS / Viatris Inc. | 0,06 | -0,45 | 0,54 | 0,1802 | -0,0168 | ||||
| SCHW / The Charles Schwab Corporation | 0,01 | 0,00 | 0,54 | 0,1798 | 0,0075 | ||||
| HACK / Amplify ETF Trust - Amplify Cybersecurity ETF | 0,01 | -14,08 | 0,53 | 0,1760 | -0,0142 | ||||
| CP / Canadian Pacific Kansas City Limited | 0,01 | 0,00 | 0,51 | 0,1718 | 0,0017 | ||||
| CMA / Comerica Incorporated | 0,01 | -19,43 | 0,51 | 0,1713 | -0,0637 | ||||
| PHO / Invesco Exchange-Traded Fund Trust - Invesco Water Resources ETF | 0,01 | 0,00 | 0,50 | 0,1682 | -0,0053 | ||||
| XLK / The Select Sector SPDR Trust - The Technology Select Sector SPDR Fund | 0,00 | -36,11 | 0,49 | 0,1634 | -0,0693 | ||||
| D / Dominion Energy, Inc. | 0,01 | -1,16 | 0,48 | 0,1604 | -0,0194 | ||||
| ETN / Eaton Corporation plc | 0,00 | 0,00 | 0,48 | 0,1595 | 0,0240 | ||||
| MDT / Medtronic plc | 0,01 | 14,72 | 0,48 | 0,1589 | -0,0004 | ||||
| TSLA / Tesla, Inc. | 0,00 | 0,00 | 0,45 | 0,1507 | 0,0134 | ||||
| AFK / VanEck ETF Trust - VanEck Africa Index ETF | 0,01 | 0,00 | 0,44 | 0,1478 | 0,0020 | ||||
| USB / U.S. Bancorp | 0,01 | 11,91 | 0,41 | 0,1385 | 0,0094 | ||||
| WTRG / Essential Utilities, Inc. | 0,01 | 0,00 | 0,41 | 0,1374 | -0,0260 | ||||
| APH / Amphenol Corporation | 0,00 | 0,00 | 0,40 | 0,1320 | 0,0342 | ||||
| MAS / Masco Corporation | 0,01 | -19,67 | 0,39 | 0,1317 | -0,0660 | ||||
| F / Ford Motor Company | 0,04 | 28,58 | 0,39 | 0,1307 | 0,0259 | ||||
| CRUS / Cirrus Logic, Inc. | 0,00 | 0,00 | 0,39 | 0,1289 | -0,0088 | ||||
| HD / The Home Depot, Inc. | 0,00 | 0,00 | 0,36 | 0,1219 | -0,0143 | ||||
| GEHC / GE HealthCare Technologies Inc. | 0,00 | -4,32 | 0,34 | 0,1141 | -0,0311 | ||||
| O / Realty Income Corporation | 0,01 | -2,01 | 0,33 | 0,1109 | -0,0164 | ||||
| SLV / iShares Silver Trust | 0,01 | 0,00 | 0,33 | 0,1103 | -0,0061 | ||||
| GPN / Global Payments Inc. | 0,00 | -4,66 | 0,33 | 0,1095 | -0,0476 | ||||
| CLX / The Clorox Company | 0,00 | 0,00 | 0,31 | 0,1043 | -0,0386 | ||||
| IVV / iShares Trust - iShares Core S&P 500 ETF | 0,00 | -27,11 | 0,31 | 0,1021 | -0,0393 | ||||
| NFLX / Netflix, Inc. | 0,00 | 0,00 | 0,30 | 0,1007 | 0,0223 | ||||
| GSCE / GS Connect S&P GSCI Enhanced Commodity Total Return ETN | 0,00 | 0,00 | 0,28 | 0,0946 | 0,0129 | ||||
| GLTR / abrdn Precious Metals Basket ETF - abrdn Physical Precious Metals Basket Shares ETF | 0,00 | 0,28 | 0,0923 | 0,0923 | |||||
| SHOP / Shopify Inc. | 0,00 | 0,00 | 0,27 | 0,0894 | 0,0066 | ||||
| APD / Air Products and Chemicals, Inc. | 0,00 | -32,31 | 0,26 | 0,0855 | -0,0619 | ||||
| XLY / The Select Sector SPDR Trust - The Consumer Discretionary Select Sector SPDR Fund | 0,00 | -33,31 | 0,25 | 0,0847 | -0,0443 | ||||
| EL / The Estée Lauder Companies Inc. | 0,00 | -24,81 | 0,24 | 0,0818 | -0,0174 | ||||
| SJM / The J. M. Smucker Company | 0,00 | 0,00 | 0,24 | 0,0804 | -0,0278 | ||||
| BRK.A / Berkshire Hathaway Inc. | 0,00 | 0,00 | 0,24 | 0,0792 | -0,0178 | ||||
| AVGO / Broadcom Inc. | 0,00 | 0,23 | 0,0755 | 0,0755 | |||||
| ADBE / Adobe Inc. | 0,00 | -63,45 | 0,22 | 0,0744 | -0,1509 | ||||
| BP / BP p.l.c. - Depositary Receipt (Common Stock) | 0,01 | 0,21 | 0,0698 | 0,0698 | |||||
| MO / Altria Group, Inc. | 0,00 | 0,00 | 0,21 | 0,0695 | -0,0099 | ||||
| INTC / Intel Corporation | 0,01 | -5,18 | 0,21 | 0,0685 | -0,0132 | ||||
| MKC / McCormick & Company, Incorporated | 0,00 | 0,00 | 0,20 | 0,0676 | -0,0144 | ||||
| DOV / Dover Corporation | 0,00 | 0,20 | 0,0673 | 0,0673 | |||||
| RSG / Republic Services, Inc. | 0,00 | -100,00 | 0,00 | 0,0000 | |||||
| RTX / RTX Corporation | 0,00 | -100,00 | 0,00 | 0,0000 | -0,2652 | ||||
| BDX / Becton, Dickinson and Company | 0,00 | -100,00 | 0,00 | 0,0000 | |||||
| CDW / CDW Corporation | 0,00 | -100,00 | 0,00 | 0,0000 | -0,0839 | ||||
| SBUX / Starbucks Corporation | 0,00 | -100,00 | 0,00 | 0,0000 | -0,0783 |