Grundlæggende statistik
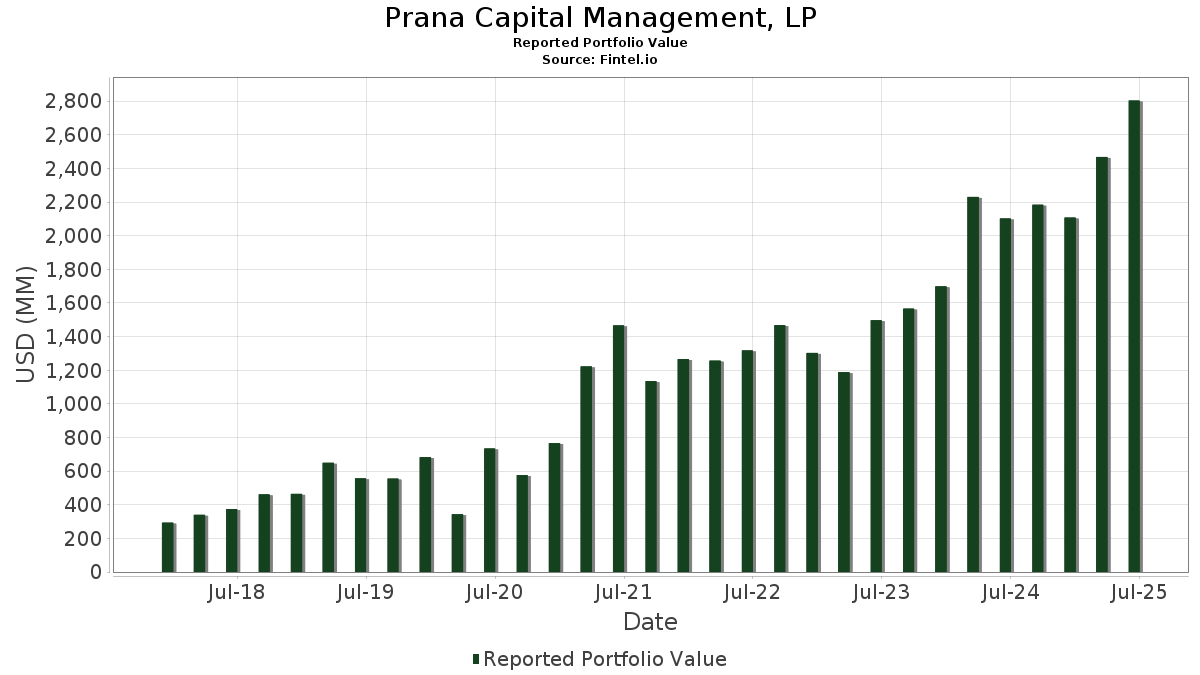
| Porteføljeværdi | $ 2.803.736.318 |
| Nuværende stillinger | 106 |
Seneste beholdninger, ydeevne, AUM (fra 13F, 13D)
Prana Capital Management, LP har afsløret 106 samlede besiddelser i deres seneste SEC-arkivering. Den seneste porteføljeværdi er beregnet til at være $ 2.803.736.318 USD. Faktiske aktiver under forvaltning (AUM) er denne værdi plus kontanter (som ikke er oplyst). Prana Capital Management, LPs største beholdninger er BlackRock, Inc. (US:BLK) , Aon plc (US:AON) , Mastercard Incorporated (US:MA) , Bank of America Corporation (US:BAC) , and U.S. Bancorp (US:USB) . Prana Capital Management, LPs nye stillinger omfatter Nasdaq, Inc. (US:NDAQ) , eToro Group Ltd. (US:ETOR) , Dollar Tree, Inc. (US:DLTR) , First Horizon Corporation (US:FHN) , and EPAM Systems, Inc. (US:EPAM) .
Top øger dette kvartal
Vi bruger ændringen i porteføljeallokeringen, fordi dette er den mest meningsfulde metrik. Ændringer kan skyldes handler eller ændringer i aktiekurser.
| Sikkerhed | Aktier (MM) |
Værdi (MM$) |
Portefølje % | ΔPortefølje % |
|---|---|---|---|---|
| 0,70 | 77,67 | 2,7704 | 2,7704 | |
| 0,52 | 184,63 | 6,5850 | 2,5007 | |
| 0,19 | 54,34 | 1,9381 | 1,9381 | |
| 0,51 | 103,34 | 3,6859 | 1,9185 | |
| 2,51 | 108,04 | 3,8535 | 1,5491 | |
| 0,08 | 40,65 | 1,4499 | 1,4499 | |
| 0,33 | 36,92 | 1,3168 | 1,3168 | |
| 0,70 | 33,12 | 1,1814 | 1,1814 | |
| 0,29 | 30,35 | 1,0825 | 1,0825 | |
| 0,33 | 100,37 | 3,5800 | 1,0590 |
Top falder i dette kvartal
Vi bruger ændringen i porteføljeallokeringen, fordi dette er den mest meningsfulde metrik. Ændringer kan skyldes handler eller ændringer i aktiekurser.
| Sikkerhed | Aktier (MM) |
Værdi (MM$) |
Portefølje % | ΔPortefølje % |
|---|---|---|---|---|
| 0,15 | 19,88 | 0,7090 | -3,8780 | |
| 0,04 | 10,89 | 0,3885 | -2,0258 | |
| 0,48 | 87,84 | 3,1329 | -1,6630 | |
| 0,70 | 63,00 | 2,2469 | -1,4543 | |
| 0,12 | 38,95 | 1,3890 | -1,3118 | |
| 0,68 | 58,19 | 2,0753 | -1,1983 | |
| 0,15 | 29,66 | 1,0578 | -1,0022 | |
| 0,01 | 0,80 | 0,0287 | -0,9170 | |
| 2,83 | 133,90 | 4,7758 | -0,7220 | |
| 0,57 | 47,28 | 1,6863 | -0,6397 |
13F og Fondsarkivering
Denne formular blev indsendt den 2025-08-14 for rapporteringsperioden 2025-06-30. Klik på linkikonet for at se den fulde transaktionshistorik.
Opgrader for at låse op for premium-data og eksportere til Excel ![]() .
.
| Sikkerhed | Type | Gennemsnitlig aktiekurs | Aktier (MM) |
Δ Aktier (%) |
Δ Aktier (%) |
Værdi ($MM) |
Portefølje (%) |
ΔPortefølje (%) |
|
|---|---|---|---|---|---|---|---|---|---|
| BLK / BlackRock, Inc. | 0,20 | 5,57 | 209,80 | 17,03 | 7,4827 | 0,2203 | |||
| AON / Aon plc | 0,52 | 104,86 | 184,63 | 83,13 | 6,5850 | 2,5007 | |||
| MA / Mastercard Incorporated | 0,28 | 4,57 | 156,29 | 7,21 | 5,5745 | -0,3315 | |||
| BAC / Bank of America Corporation | 2,83 | -12,99 | 133,90 | -1,33 | 4,7758 | -0,7220 | |||
| USB / U.S. Bancorp | 2,49 | 0,07 | 112,67 | 7,25 | 4,0187 | -0,2375 | |||
| TFC / Truist Financial Corporation | 2,51 | 81,81 | 108,04 | 89,95 | 3,8535 | 1,5491 | |||
| ALL / The Allstate Corporation | 0,51 | 143,66 | 103,34 | 136,89 | 3,6859 | 1,9185 | |||
| WTW / Willis Towers Watson Public Limited Company | 0,33 | 77,85 | 100,37 | 61,30 | 3,5800 | 1,0590 | |||
| C / Citigroup Inc. | 1,09 | 13,85 | 92,89 | 36,51 | 3,3132 | 0,5565 | |||
| ICE / Intercontinental Exchange, Inc. | 0,48 | -30,24 | 87,84 | -25,80 | 3,1329 | -1,6630 | |||
| BRO / Brown & Brown, Inc. | 0,70 | 77,67 | 2,7704 | 2,7704 | |||||
| KEY / KeyCorp | 4,06 | 38,20 | 70,79 | 50,56 | 2,5247 | 0,6200 | |||
| CIWV / Citizens Financial Corp. | 1,52 | 40,92 | 67,83 | 53,92 | 2,4192 | 0,6340 | |||
| NDAQ / Nasdaq, Inc. | 0,70 | -41,50 | 63,00 | -31,05 | 2,2469 | -1,4543 | |||
| AIG / American International Group, Inc. | 0,68 | -26,86 | 58,19 | -27,99 | 2,0753 | -1,1983 | |||
| CB / Chubb Limited | 0,19 | 54,34 | 1,9381 | 1,9381 | |||||
| SSNC / SS&C Technologies Holdings, Inc. | 0,57 | -4,07 | 47,28 | -17,65 | 1,6863 | -0,6397 | |||
| MS / Morgan Stanley | 0,33 | 15,01 | 46,11 | 38,86 | 1,6446 | 0,2993 | |||
| MCO / Moody's Corporation | 0,08 | 40,65 | 1,4499 | 1,4499 | |||||
| LOW / Lowe's Companies, Inc. | 0,18 | 43,96 | 40,21 | 36,95 | 1,4343 | 0,2447 | |||
| SEIC / SEI Investments Company | 0,44 | 15,19 | 39,74 | 33,34 | 1,4175 | 0,2100 | |||
| AXP / American Express Company | 0,12 | -50,73 | 38,95 | -41,58 | 1,3890 | -1,3118 | |||
| JLL / Jones Lang LaSalle Incorporated | 0,14 | 90,77 | 37,02 | 96,83 | 1,3206 | 0,5585 | |||
| LEN / Lennar Corporation | 0,33 | 36,92 | 1,3168 | 1,3168 | |||||
| SPG / Simon Property Group, Inc. | 0,23 | 27,42 | 36,24 | 23,34 | 1,2924 | 0,1022 | |||
| BAC / Bank of America Corporation | Put | 0,70 | 33,12 | 1,1814 | 1,1814 | ||||
| TOL / Toll Brothers, Inc. | 0,27 | -7,11 | 30,61 | 0,40 | 1,0917 | -0,1434 | |||
| AFL / Aflac Incorporated | 0,29 | 30,35 | 1,0825 | 1,0825 | |||||
| STT / State Street Corporation | 0,28 | -34,31 | 29,73 | -21,98 | 1,0604 | -0,4833 | |||
| RGA / Reinsurance Group of America, Incorporated | 0,15 | -42,10 | 29,66 | -41,68 | 1,0578 | -1,0022 | |||
| BX / Blackstone Inc. | 0,20 | 29,60 | 1,0559 | 1,0559 | |||||
| GPN / Global Payments Inc. | 0,31 | 85,56 | 24,58 | 51,68 | 0,8765 | 0,2201 | |||
| FIS / Fidelity National Information Services, Inc. | 0,29 | -36,14 | 23,46 | -30,38 | 0,8368 | -0,5285 | |||
| GS / The Goldman Sachs Group, Inc. | 0,03 | -31,96 | 22,96 | -11,85 | 0,8188 | -0,2362 | |||
| TRU / TransUnion | 0,25 | 17,96 | 21,92 | 25,08 | 0,7819 | 0,0719 | |||
| NTRS / Northern Trust Corporation | 0,17 | -48,33 | 21,86 | -33,59 | 0,7795 | -0,5536 | |||
| IBKR / Interactive Brokers Group, Inc. | 0,39 | 564,92 | 21,34 | 122,49 | 0,7610 | 0,3725 | |||
| PFG / Principal Financial Group, Inc. | 0,26 | 20,59 | 0,7344 | 0,7344 | |||||
| CTSH / Cognizant Technology Solutions Corporation | 0,26 | 295,85 | 19,96 | 303,82 | 0,7120 | 0,5117 | |||
| SF / Stifel Financial Corp. | 0,19 | 48,80 | 19,92 | 63,84 | 0,7106 | 0,2179 | |||
| KKR / KKR & Co. Inc. | 0,15 | -84,74 | 19,88 | -82,44 | 0,7090 | -3,8780 | |||
| BJ / BJ's Wholesale Club Holdings, Inc. | 0,18 | 157,19 | 19,61 | 143,08 | 0,6996 | 0,3727 | |||
| OWL / Blue Owl Capital Inc. | 0,95 | 18,31 | 0,6530 | 0,6530 | |||||
| CG / The Carlyle Group Inc. | 0,34 | 17,37 | 0,6196 | 0,6196 | |||||
| SPGI / S&P Global Inc. | 0,03 | -40,70 | 17,06 | -38,46 | 0,6086 | -0,5146 | |||
| IT / Gartner, Inc. | 0,04 | 614,50 | 16,63 | 588,33 | 0,5931 | 0,4952 | |||
| WM / Waste Management, Inc. | 0,07 | -21,43 | 15,30 | -22,34 | 0,5458 | -0,2525 | |||
| PRI / Primerica, Inc. | 0,05 | 78,43 | 14,91 | 71,62 | 0,5318 | 0,1798 | |||
| MSCI / MSCI Inc. | 0,03 | -19,85 | 14,75 | -18,26 | 0,5261 | -0,2050 | |||
| EG / Everest Group, Ltd. | 0,04 | 180,36 | 12,84 | 162,23 | 0,4580 | 0,2596 | |||
| PLD / Prologis, Inc. | 0,12 | 12,18 | 0,4344 | 0,4344 | |||||
| FNF / Fidelity National Financial, Inc. | 0,21 | 12,05 | 0,4298 | 0,4298 | |||||
| ACN / Accenture plc | 0,04 | -80,92 | 10,89 | -81,72 | 0,3885 | -2,0258 | |||
| XYZ / Block, Inc. | 0,15 | -22,08 | 10,44 | -2,57 | 0,3722 | -0,0617 | |||
| AIZ / Assurant, Inc. | 0,05 | 10,17 | 0,3627 | 0,3627 | |||||
| INVH / Invitation Homes Inc. | 0,28 | 9,29 | 0,3313 | 0,3313 | |||||
| NDAQ / Nasdaq, Inc. | Put | 0,10 | 8,94 | 0,3189 | 0,3189 | ||||
| BEN / Franklin Resources, Inc. | 0,37 | 8,71 | 0,3105 | 0,3105 | |||||
| CSGP / CoStar Group, Inc. | 0,10 | -18,36 | 7,91 | -17,16 | 0,2822 | -0,1047 | |||
| EVR / Evercore Inc. | 0,03 | 7,90 | 0,2816 | 0,2816 | |||||
| UNH / UnitedHealth Group Incorporated | 0,02 | 135,57 | 7,72 | 40,33 | 0,2752 | 0,0524 | |||
| MKL / Markel Group Inc. | 0,00 | -38,89 | 7,15 | -34,72 | 0,2550 | -0,1887 | |||
| MKTX / MarketAxess Holdings Inc. | 0,03 | -30,61 | 6,88 | -28,37 | 0,2455 | -0,1438 | |||
| EQH / Equitable Holdings, Inc. | 0,12 | 6,51 | 0,2323 | 0,2323 | |||||
| AFG / American Financial Group, Inc. | 0,05 | 17,41 | 5,86 | 12,83 | 0,2089 | -0,0014 | |||
| FCNCB / First Citizens BancShares, Inc. | 0,00 | -41,70 | 5,53 | -38,49 | 0,1973 | -0,1670 | |||
| TGT / Target Corporation | 0,05 | -61,38 | 4,88 | -63,50 | 0,1740 | -0,3673 | |||
| JEF / Jefferies Financial Group Inc. | 0,07 | 3,98 | 0,1420 | 0,1420 | |||||
| PAYX / Paychex, Inc. | 0,03 | 3,87 | 0,1379 | 0,1379 | |||||
| RKT / Rocket Companies, Inc. | 0,27 | 3,93 | 3,81 | 22,09 | 0,1361 | 0,0095 | |||
| GFL / GFL Environmental Inc. | 0,08 | 98,08 | 3,79 | 106,93 | 0,1353 | 0,0610 | |||
| ORCL / Oracle Corporation | 0,02 | -74,28 | 3,60 | -59,80 | 0,1283 | -0,2341 | |||
| NSP / Insperity, Inc. | 0,06 | 3,50 | 0,1248 | 0,1248 | |||||
| STEP / StepStone Group Inc. | 0,06 | 83,21 | 3,09 | 94,77 | 0,1102 | 0,0459 | |||
| IVZ / Invesco Ltd. | 0,19 | 3,00 | 0,1069 | 0,1069 | |||||
| COIN / Coinbase Global, Inc. | 0,01 | 2,86 | 0,1021 | 0,1021 | |||||
| INTU / Intuit Inc. | 0,00 | -86,45 | 2,72 | -82,61 | 0,0971 | -0,5373 | |||
| CPRT / Copart, Inc. | 0,05 | 27,32 | 2,62 | 10,38 | 0,0934 | -0,0027 | |||
| BGC / BGC Group, Inc. | 0,25 | 10,54 | 2,55 | 23,32 | 0,0911 | 0,0072 | |||
| ALLY / Ally Financial Inc. | 0,06 | 2,51 | 0,0895 | 0,0895 | |||||
| CNC / Centene Corporation | 0,04 | 9,63 | 2,25 | -2,00 | 0,0803 | -0,0128 | |||
| ELV / Elevance Health, Inc. | 0,01 | 61,30 | 2,23 | 44,32 | 0,0797 | 0,0169 | |||
| JHG / Janus Henderson Group plc | 0,05 | -56,03 | 1,75 | -52,77 | 0,0624 | -0,0876 | |||
| UHS / Universal Health Services, Inc. | 0,01 | 1,68 | 0,0599 | 0,0599 | |||||
| IRM / Iron Mountain Incorporated | 0,02 | 21,97 | 1,63 | 45,49 | 0,0581 | 0,0127 | |||
| WCN / Waste Connections, Inc. | 0,01 | 1,62 | 0,0579 | 0,0579 | |||||
| HLI / Houlihan Lokey, Inc. | 0,01 | -74,28 | 1,59 | -71,36 | 0,0567 | -0,1680 | |||
| XPRO / Expro Group Holdings N.V. | 0,01 | 1,58 | 0,0563 | 0,0563 | |||||
| LPLA / LPL Financial Holdings Inc. | 0,00 | 1,57 | 0,0561 | 0,0561 | |||||
| BAM / Brookfield Asset Management Ltd. | 0,02 | -56,11 | 1,36 | -49,93 | 0,0485 | -0,0615 | |||
| ETOR / eToro Group Ltd. | 0,02 | 1,34 | 0,0478 | 0,0478 | |||||
| RNR / RenaissanceRe Holdings Ltd. | 0,00 | 1,03 | 0,0366 | 0,0366 | |||||
| UNP / Union Pacific Corporation | 0,00 | 1,02 | 0,0364 | 0,0364 | |||||
| BR / Broadridge Financial Solutions, Inc. | 0,00 | -90,61 | 1,01 | -90,59 | 0,0361 | -0,3997 | |||
| VIRT / Virtu Financial, Inc. | 0,02 | -63,24 | 0,86 | -56,81 | 0,0305 | -0,0498 | |||
| PYPL / PayPal Holdings, Inc. | 0,01 | 0,84 | 0,0299 | 0,0299 | |||||
| MQ / Marqeta, Inc. | 0,14 | 433,19 | 0,81 | 659,43 | 0,0287 | 0,0244 | |||
| WMT / Walmart Inc. | 0,01 | -96,91 | 0,80 | -96,56 | 0,0287 | -0,9170 | |||
| DLTR / Dollar Tree, Inc. | 0,01 | 0,70 | 0,0249 | 0,0249 | |||||
| COF / Capital One Financial Corporation | 0,00 | 0,55 | 0,0196 | 0,0196 | |||||
| FOUR / Shift4 Payments, Inc. | 0,00 | -91,00 | 0,34 | -89,09 | 0,0122 | -0,1145 | |||
| FHN / First Horizon Corporation | 0,01 | 0,28 | 0,0099 | 0,0099 | |||||
| EPAM / EPAM Systems, Inc. | 0,00 | 0,27 | 0,0097 | 0,0097 | |||||
| ZION / Zions Bancorporation, National Association | 0,00 | 0,25 | 0,0089 | 0,0089 | |||||
| UWMC / UWM Holdings Corporation | 0,05 | 0,21 | 0,0076 | 0,0076 | |||||
| WBS / Webster Financial Corporation | 0,00 | 0,21 | 0,0075 | 0,0075 | |||||
| GLOB / Globant S.A. | 0,00 | -100,00 | 0,00 | 0,0000 | |||||
| DHI / D.R. Horton, Inc. | 0,00 | -100,00 | 0,00 | 0,0000 | |||||
| FTDR / Frontdoor, Inc. | 0,00 | -100,00 | 0,00 | 0,0000 | |||||
| HCA / HCA Healthcare, Inc. | 0,00 | -100,00 | 0,00 | 0,0000 | |||||
| FDS / FactSet Research Systems Inc. | 0,00 | -100,00 | 0,00 | 0,0000 | |||||
| UNM / Unum Group | 0,00 | -100,00 | 0,00 | 0,0000 | |||||
| CINF / Cincinnati Financial Corporation | 0,00 | -100,00 | 0,00 | 0,0000 | |||||
| SCHW / The Charles Schwab Corporation | 0,00 | -100,00 | 0,00 | 0,0000 | |||||
| ARES / Ares Management Corporation | 0,00 | -100,00 | 0,00 | 0,0000 | |||||
| CPAY / Corpay, Inc. | 0,00 | -100,00 | 0,00 | 0,0000 | |||||
| VOYA / Voya Financial, Inc. | 0,00 | -100,00 | 0,00 | 0,0000 | |||||
| BILL / BILL Holdings, Inc. | 0,00 | -100,00 | 0,00 | 0,0000 | |||||
| CRM / Salesforce, Inc. | 0,00 | -100,00 | 0,00 | 0,0000 | |||||
| CSX / CSX Corporation | 0,00 | -100,00 | 0,00 | 0,0000 | |||||
| HOOD / Robinhood Markets, Inc. | 0,00 | -100,00 | 0,00 | 0,0000 | |||||
| ECL / Ecolab Inc. | 0,00 | -100,00 | 0,00 | 0,0000 | |||||
| RYAN / Ryan Specialty Holdings, Inc. | 0,00 | -100,00 | 0,00 | 0,0000 | |||||
| CBOE / Cboe Global Markets, Inc. | 0,00 | -100,00 | 0,00 | 0,0000 | |||||
| MKTX / MarketAxess Holdings Inc. | Put | 0,00 | -100,00 | 0,00 | -100,00 | -0,0438 | |||
| ADP / Automatic Data Processing, Inc. | 0,00 | -100,00 | 0,00 | 0,0000 | |||||
| HBAN / Huntington Bancshares Incorporated | 0,00 | -100,00 | 0,00 | 0,0000 | |||||
| RF / Regions Financial Corporation | 0,00 | -100,00 | 0,00 | 0,0000 | |||||
| CG / The Carlyle Group Inc. | Call | 0,00 | -100,00 | 0,00 | -100,00 | -0,2119 | |||
| LAZ / Lazard, Inc. | 0,00 | -100,00 | 0,00 | 0,0000 | |||||
| ARMK / Aramark | 0,00 | -100,00 | 0,00 | 0,0000 | |||||
| WEX / WEX Inc. | 0,00 | -100,00 | 0,00 | 0,0000 | |||||
| ADBE / Adobe Inc. | 0,00 | -100,00 | 0,00 | 0,0000 | |||||
| TPG / TPG Inc. | 0,00 | -100,00 | 0,00 | 0,0000 | |||||
| GPN / Global Payments Inc. | Call | 0,00 | -100,00 | 0,00 | -100,00 | -0,1789 |