Grundlæggende statistik
| Institutionelle ejere | 722 total, 690 long only, 3 short only, 29 long/short - change of -0,28% MRQ |
| Gennemsnitlig porteføljeallokering | 0.1394 % - change of -25,28% MRQ |
| Institutionelle aktier (lange) | 112.451.112 (ex 13D/G) - change of -10,96MM shares -8,88% MRQ |
| Institutionel værdi (lang) | $ 6.560.795 USD ($1000) |
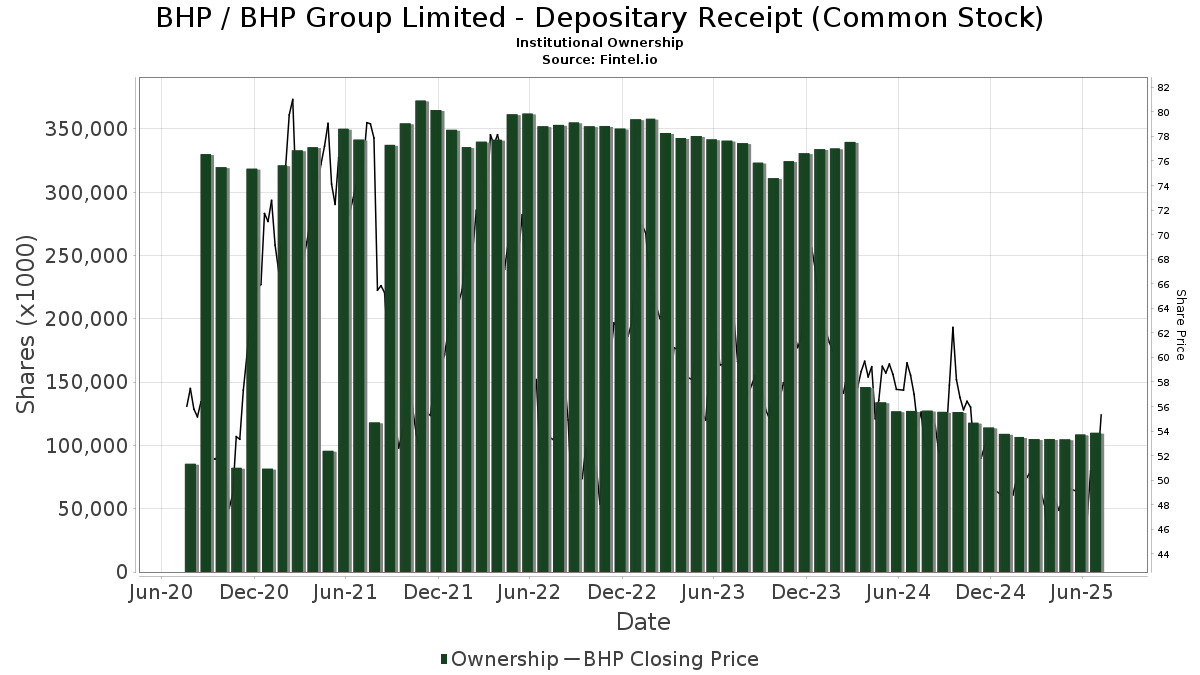
Institutionelt ejerskab og aktionærer
BHP Group Limited - Depositary Receipt (Common Stock) (US:BHP) har 722 institutionelle ejere og aktionærer, der har indsendt 13D/G- eller 13F-formularer til Securities Exchange Commission (SEC). Disse institutioner har i alt 112,457,922 aktier. Største aktionærer omfatter Fisher Asset Management, LLC, Morgan Stanley, Goldman Sachs Group Inc, IHGIX - THE HARTFORD DIVIDEND AND GROWTH FUND Class A, Wellington Management Group Llp, Dimensional Fund Advisors Lp, HLMIX - Harding Loevner International Equity Portfolio Institutional, Bank Of America Corp /de/, BlackRock, Inc., and Neuberger Berman Group LLC .
BHP Group Limited - Depositary Receipt (Common Stock) (NYSE:BHP) institutionel ejerskabsstruktur viser aktuelle positioner i virksomheden efter institutioner og fonde, samt seneste ændringer i positionsstørrelse. Større aktionærer kan omfatte individuelle investorer, investeringsforeninger, hedgefonde eller institutioner. Skema 13D angiver, at investoren besidder (eller besidder) mere end 5 % af virksomheden og har til hensigt (eller har til hensigt at) aktivt at forfølge en ændring i forretningsstrategi. Skema 13G indikerer en passiv investering på over 5%.
The share price as of March 17, 2026 is 70,48 / share. Previously, on March 18, 2025, the share price was 50,54 / share. This represents an increase of 39,45% over that period.
Fondens stemningsscore
Fund Sentiment Score (fka Ownership Accumulation Score) finder de aktier, der bliver mest købt af fonde. Det er resultatet af en sofistikeret, multi-faktor kvantitativ model, der identificerer virksomheder med de højeste niveauer af institutionel akkumulering. Scoringsmodellen bruger en kombination af den samlede stigning i oplyste ejere, ændringerne i porteføljeallokeringer i disse ejere og andre målinger. Tallet går fra 0 til 100, hvor højere tal indikerer et højere niveau af akkumulering for sine jævnaldrende, og 50 er gennemsnittet.
Opdateringsfrekvens: Dagligt
Se Ownership Explorer, som giver en liste over højest rangerende virksomheder.
AI+ Ask Fintel’s AI assistant about BHP Group Limited - Depositary Receipt (Common Stock).
Select a question to share a public post with an AI-crafted answer.
Thinking of good questions…
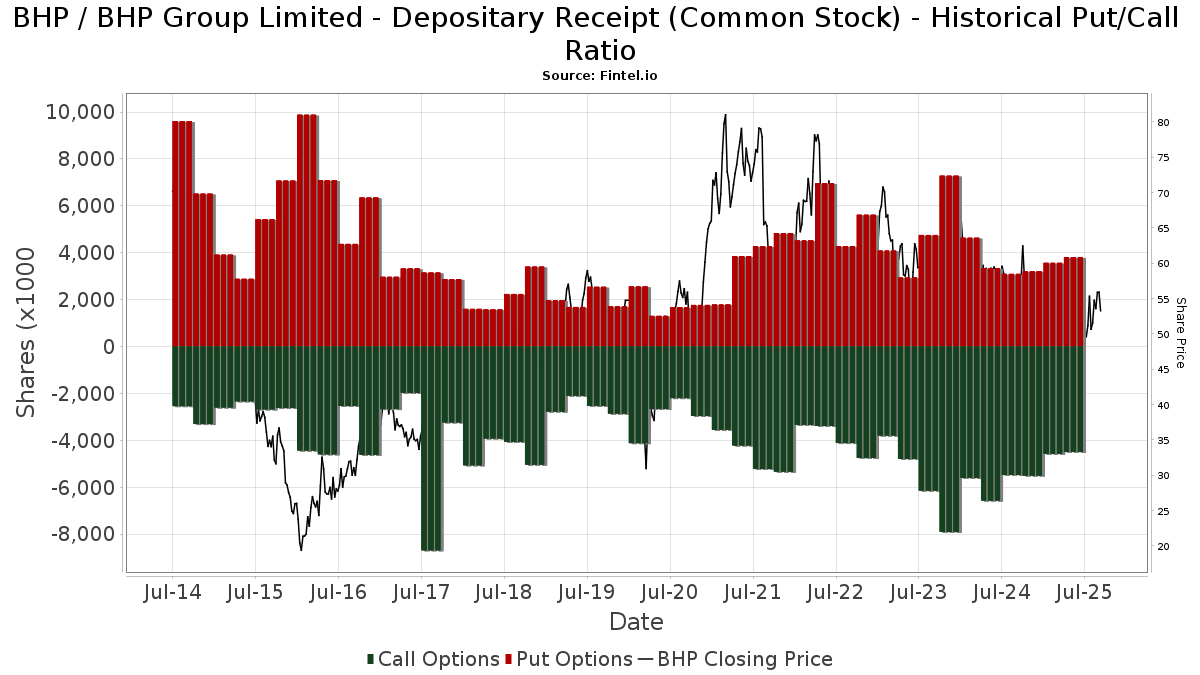
Institutionel Put/Call-forhold
Ud over at indberette standardaktie- og gældsudstedelser skal institutter med mere end 100 mill. aktiver under forvaltning også oplyse deres put- og call-optionsbeholdninger. Da salgsoptioner generelt indikerer negativ stemning, og købsoptioner indikerer positiv stemning, kan vi få en fornemmelse af den overordnede institutionelle stemning ved at plotte forholdet mellem put og kald. Diagrammet til højre viser det historiske put/call-forhold for dette instrument.
Brug af Put/Call Ratio som en indikator for investorernes stemning overvinder en af de vigtigste mangler ved at bruge totalt institutionelt ejerskab, som er, at en betydelig mængde af aktiver under forvaltning investeres passivt for at spore indekser. Passivt forvaltede fonde køber typisk ikke optioner, så indikatoren for put/call-forholdet følger mere nøje følelsen af aktivt forvaltede fonde.
13F og NPORT arkivering
Detaljer om 13F-arkivering er gratis. Detaljer om NP-ansøgninger kræver et premium-medlemskab. Grønne rækker angiver nye positioner. Røde rækker angiver lukkede positioner. Klik på linket ikon for at se den fulde transaktionshistorik.
Opgrader
for at låse premium-data op og eksportere til Excel ![]() .
.
Important Note
In an effort to reduce load times for our mobile users, we are testing some ways to deliver lighter pages.
In this first test, we will deliver only the most recent 750 transactions (out of 901 for this stock). If you are interested in loading *all* the transactions for this company, click the "load all" button below. This is just a test and if you don't like it, please let us know by submitting some gentle feedback via the link at the bottom of this page.
Load All| Fil dato | Kilde | Investor | Type | Gennemsnitlig pris (Øst) |
Aktier | Δ Aktier (%) |
Rapporteret Værdi ($1000) |
Δ Værdi (%) |
Port Alloc (%) |
|
|---|---|---|---|---|---|---|---|---|---|---|
| 2026-01-05 | 13F | GAMMA Investing LLC | 6.310 | 25,17 | 381 | 35,23 | ||||
| 2026-02-12 | 13F | Principal Securities, Inc. | 14.185 | 4,06 | 856 | 12,78 | ||||
| 2026-02-10 | 13F | Peapack Gladstone Financial Corp | 48.910 | -7,74 | 3 | 0,00 | ||||
| 2026-02-10 | 13F | Envestnet Asset Management Inc | 275.792 | -43,34 | 16.650 | -38,65 | ||||
| 2025-11-14 | 13F | Credit Agricole S A | 0 | -100,00 | 0 | |||||
| 2026-02-11 | 13F | Fox Run Management, L.l.c. | 6.739 | 407 | ||||||
| 2026-01-21 | 13F | Albion Financial Group /ut | 250 | 15 | ||||||
| 2026-02-04 | 13F | Marco Investment Management Llc | 28.934 | -5,55 | 1.747 | 2,28 | ||||
| 2026-02-11 | 13F | SOUTH STATE Corp | 30.361 | 2,63 | 1.833 | 11,10 | ||||
| 2026-01-15 | 13F | Royal Fund Management, LLC | 27.497 | 26,30 | 1.660 | 36,77 | ||||
| 2026-01-26 | 13F | AE Wealth Management LLC | 9.227 | 4,50 | 557 | 13,21 | ||||
| 2026-02-19 | 13F | Mcguire Capital Advisors Inc | 20 | 1 | ||||||
| 2026-01-16 | 13F | Louisbourg Investments Inc. | 11.080 | 0,00 | 669 | 8,27 | ||||
| 2026-01-30 | 13F | Laurel Wealth Advisors LLC | 88 | 5 | ||||||
| 2025-11-12 | 13F | CIBC Bancorp USA Inc. | 759.337 | 42.333 | ||||||
| 2026-02-13 | 13F | Schroder Investment Management Group | 17.557 | -6,25 | 1.070 | 1,62 | ||||
| 2026-02-17 | 13F | Palogic Value Management, L.P. | 86.039 | 0,66 | 5.194 | 9,00 | ||||
| 2026-02-09 | 13F | Frazier Financial Advisors, LLC | 500 | -2,72 | 30 | 7,14 | ||||
| 2026-01-27 | 13F | Novem Group | 18.517 | 1.118 | ||||||
| 2025-11-14 | 13F | Strategic Wealth Partners, Ltd. | 209 | 0,00 | 12 | 10,00 | ||||
| 2026-01-14 | 13F | Legal Advantage Investments, Inc. | 8.307 | -6,21 | 501 | 1,62 | ||||
| 2026-01-21 | 13F | Flagship Harbor Advisors, Llc | 773 | 47 | ||||||
| 2026-01-22 | 13F | Financial Consulate, Inc | 192 | 34,27 | 12 | 57,14 | ||||
| 2026-01-28 | 13F | Geneos Wealth Management Inc. | 207 | -49,14 | 12 | -45,45 | ||||
| 2026-01-20 | 13F | Trust Co Of Toledo Na /oh/ | 1.700 | 0,00 | 103 | 8,51 | ||||
| 2026-02-11 | 13F | Zions Bancorporation, National Association /ut/ | 202 | 13,48 | 12 | 33,33 | ||||
| 2025-11-14 | 13F | Gluskin Sheff & Assoc Inc | 0 | -100,00 | 0 | |||||
| 2026-02-09 | 13F | Summitry Llc | 0 | -100,00 | 0 | |||||
| 2026-02-04 | 13F | Ameritas Advisory Services, LLC | 0 | -100,00 | 0 | |||||
| 2026-03-04 | 13F | SHP Wealth Management | 267 | 16 | ||||||
| 2026-01-05 | 13F | GoalVest Advisory LLC | 1.000 | -60,78 | 60 | -57,75 | ||||
| 2026-02-03 | 13F | Redwood Wealth Management Group, LLC | 5.829 | 7,37 | 352 | 16,23 | ||||
| 2025-11-14 | 13F | ICONIQ Capital, LLC | 0 | -100,00 | 0 | |||||
| 2026-01-15 | 13F | Highline Wealth Partners Llc | 431 | -95,85 | 26 | -95,51 | ||||
| 2026-02-13 | 13F | Focused Alpha, Llc | 6.150 | 371 | ||||||
| 2026-01-12 | 13F | Salem Investment Counselors Inc | 0 | -100,00 | 0 | |||||
| 2026-01-29 | 13F | Cherokee Insurance Co | 4.700 | 0,00 | 284 | 8,02 | ||||
| 2026-01-06 | 13F | Nelson, Van Denburg & Campbell Wealth Management Group, LLC | 4.731 | 0,00 | 286 | 8,37 | ||||
| 2026-02-10 | 13F | Argent Trust Co | 14.177 | -2,07 | 856 | 5,95 | ||||
| 2026-01-21 | 13F | Sound Income Strategies, LLC | 422 | 222,14 | 27 | 285,71 | ||||
| 2026-02-06 | 13F | Lsv Asset Management | 65.595 | -17,07 | 4 | -25,00 | ||||
| 2026-02-11 | 13F | Vise Technologies, Inc. | 37.241 | 49,17 | 2.248 | 61,61 | ||||
| 2026-02-10 | 13F | Pinnacle West Asset Management, Inc. | 9.375 | -1,06 | 1 | |||||
| 2025-09-23 | NP | FNCRX - Franklin Natural Resources Fund Class C | 190.000 | -1,35 | 9.627 | 5,12 | ||||
| 2026-01-27 | 13F | Jeppson Wealth Management, Llc | 16.386 | 0,12 | 989 | 8,44 | ||||
| 2026-02-06 | 13F | Motco | 200 | 0,00 | 12 | 9,09 | ||||
| 2026-02-17 | 13F | Private Advisor Group, LLC | 17.950 | 86,13 | 1.084 | 101,68 | ||||
| 2026-02-10 | 13F | Lido Advisors, LLC | 6.989 | 1,47 | 391 | 1,56 | ||||
| 2026-01-08 | 13F | True Wealth Design, LLC | 799 | 5,83 | 48 | 14,29 | ||||
| 2026-02-13 | 13F | Kestra Advisory Services, LLC | 0 | -100,00 | 0 | |||||
| 2026-02-09 | 13F | Key FInancial Inc | 35 | 2 | ||||||
| 2026-02-13 | 13F | Johnson Investment Counsel Inc | 0 | -100,00 | 0 | |||||
| 2026-02-17 | 13F | Creative Planning | 354.310 | 22,70 | 21.390 | 32,87 | ||||
| 2026-02-17 | 13F | Clear Street Markets Llc | 2.200 | 0,00 | 133 | 8,20 | ||||
| 2026-02-13 | 13F | Integrated Wealth Concepts LLC | 7.428 | -45,43 | 448 | -40,90 | ||||
| 2026-02-13 | 13F | AlTi Global, Inc. | 3.976 | 5,30 | 240 | 14,29 | ||||
| 2026-02-13 | 13F | Mosaic Financial Group, Llc | 10.000 | 0,00 | 1 | |||||
| 2026-01-29 | 13F | Nbc Securities, Inc. | 387 | 0,00 | 23 | 9,52 | ||||
| 2026-02-12 | 13F | Intesa Sanpaolo Wealth Management | 800 | 48 | ||||||
| 2026-02-17 | 13F | Quantinno Capital Management LP | 406.226 | 28,61 | 24.524 | 39,26 | ||||
| 2026-02-12 | 13F | Dimensional Fund Advisors Lp | 3.625.889 | -6,53 | 218.903 | 1,21 | ||||
| 2026-02-13 | 13F | Corps Capital Advisors, LLC | 4.000 | 241 | ||||||
| 2026-01-27 | 13F | Belpointe Asset Management LLC | 3.393 | 205 | ||||||
| 2026-02-13 | 13F | NLB Skladi, upravljanje premozenja, d.o.o. | 113.144 | 6.831 | ||||||
| 2026-01-20 | 13F | AdvisorNet Financial, Inc | 571 | 0,00 | 34 | 9,68 | ||||
| 2026-02-17 | 13F | XTX Topco Ltd | 52.976 | 94,71 | 3.198 | 110,95 | ||||
| 2025-11-04 | 13F | Flaharty Asset Management, LLC | 0 | -100,00 | 0 | -100,00 | ||||
| 2026-01-14 | 13F | Jfs Wealth Advisors, Llc | 801 | 15,09 | 48 | 26,32 | ||||
| 2026-02-17 | 13F | Citadel Advisors Llc | Call | 256.600 | 15,02 | 15.491 | 24,55 | |||
| 2026-01-08 | 13F | Wealth Enhancement Advisory Services, Llc | 82.375 | 6,07 | 5.338 | 24,52 | ||||
| 2026-02-17 | 13F | Citadel Advisors Llc | Put | 579.000 | 219,71 | 34.954 | 246,22 | |||
| 2026-02-17 | 13F | Citadel Advisors Llc | 1.280.623 | 446,32 | 77.311 | 491,61 | ||||
| 2026-02-17 | 13F | IHT Wealth Management, LLC | 8.012 | -3,94 | 484 | 4,09 | ||||
| 2026-01-15 | 13F | Allspring Global Investments Holdings, LLC | 19.137 | 41,50 | 1.203 | 62,87 | ||||
| 2026-02-05 | 13F | AlphaCore Capital LLC | 15.418 | -11,06 | 931 | -3,73 | ||||
| 2026-01-20 | 13F | SOA Wealth Advisors, LLC. | 225 | -49,32 | 14 | -45,83 | ||||
| 2026-02-13 | 13F | Williams Jones Wealth Management, LLC. | 5.069 | 0,00 | 306 | 8,51 | ||||
| 2026-02-10 | 13F | Savant Capital, LLC | 15.031 | 14,16 | 907 | 23,57 | ||||
| 2026-02-12 | 13F | CIBC Private Wealth Group, LLC | 788.140 | 4,02 | 47.580 | 12,64 | ||||
| 2026-02-17 | 13F | Tower Research Capital LLC (TRC) | 249 | -99,36 | 15 | -99,31 | ||||
| 2026-02-04 | 13F | HighPoint Advisor Group LLC | 4.448 | 11,17 | 269 | 20,18 | ||||
| 2026-01-22 | 13F | City Holding Co | 67 | 0,00 | 4 | 33,33 | ||||
| 2026-02-17 | 13F | Qube Research & Technologies Ltd | 144.880 | 768,06 | 6.516 | 600,65 | ||||
| 2026-01-23 | 13F | Westside Investment Management, Inc. | 197 | 0,00 | 12 | 20,00 | ||||
| 2026-02-12 | 13F | Hikari Tsushin, Inc. | 0 | -100,00 | 0 | |||||
| 2025-10-15 | 13F | Marshall & Sullivan Inc /wa/ | 0 | -100,00 | 0 | |||||
| 2026-01-12 | 13F | Rialto Wealth Management, LLC | 91 | 0,00 | 5 | 0,00 | ||||
| 2026-02-04 | 13F | BCJ Capital Management, LLC | 4.212 | 13,41 | 254 | 22,71 | ||||
| 2026-02-17 | 13F | Qube Research & Technologies Ltd | Put | 3.600 | 0,00 | 217 | 8,50 | |||
| 2026-02-17 | 13F | Balyasny Asset Management Llc | Put | 33.200 | 1.008 | |||||
| 2026-02-17 | 13F | MIRAE ASSET GLOBAL ETFS HOLDINGS Ltd. | 44.347 | 162,16 | 2.677 | 183,88 | ||||
| 2026-02-12 | 13F | XY Capital Ltd | 0 | -100,00 | 0 | |||||
| 2025-11-07 | 13F | Beacon Capital Management, LLC | 0 | -100,00 | 0 | |||||
| 2026-01-28 | 13F | Retirement Planning Co of New England, Inc. | 5.082 | -1,65 | 307 | 6,25 | ||||
| 2026-02-09 | 13F | Knights of Columbus Asset Advisors LLC | 4.808 | 0,00 | 290 | 8,21 | ||||
| 2026-02-13 | 13F | Transamerica Financial Advisors, Inc. | 274 | 17 | ||||||
| 2026-02-06 | 13F | Integral Investment Advisors, Inc. | 4.180 | -2,54 | 252 | 5,44 | ||||
| 2026-02-13 | 13F | Minot DeBlois Advisors LLC | 8.543 | 3,08 | 516 | 11,47 | ||||
| 2026-02-03 | 13F | Wesbanco Bank Inc | 4.792 | 18,73 | 289 | 28,44 | ||||
| 2026-02-05 | 13F | Bessemer Group Inc | 6.856 | 3,78 | 0 | |||||
| 2026-02-23 | 13F | Wealth Preservation Advisors, LLC | 200 | -74,46 | 12 | -45,45 | ||||
| 2026-02-11 | 13F | Jpmorgan Chase & Co | 578.034 | 102,78 | 34.896 | 119,59 | ||||
| 2026-02-11 | 13F | Jpmorgan Chase & Co | Put | 50.000 | 0,00 | 3.018 | 8,29 | |||
| 2026-02-24 | 13F | DGS Capital Management, LLC | 23.361 | 5,80 | 1.410 | 14,54 | ||||
| 2026-02-03 | 13F | Farmers & Merchants Investments Inc | 500 | 0,00 | 30 | 11,11 | ||||
| 2026-02-10 | 13F | Td Asset Management Inc | 0 | -100,00 | 0 | |||||
| 2026-02-17 | 13F | Laird Norton Trust Company, Llc | 51.244 | 3.094 | ||||||
| 2026-01-29 | 13F | Dunhill Financial, LLC | 585 | -41,50 | 35 | -36,36 | ||||
| 2025-09-26 | NP | JHMD - John Hancock Multifactor Developed International ETF | 118.525 | -0,79 | 2.995 | 2,60 | ||||
| 2026-01-20 | 13F | Stratos Wealth Advisors, LLC | 0 | -100,00 | 0 | |||||
| 2026-02-05 | 13F | Roberts Glore & Co Inc /il/ | 4.265 | -1,16 | 257 | 7,08 | ||||
| 2026-01-23 | 13F | Rsm Us Wealth Management Llc | 20.565 | -42,46 | 1.253 | -37,15 | ||||
| 2026-02-12 | 13F | Quadrant Capital Group Llc | 66.308 | -1,25 | 4.003 | 6,95 | ||||
| 2026-02-13 | 13F | Sterling Capital Management LLC | 342 | -97,27 | 21 | -97,13 | ||||
| 2026-02-17 | 13F | SageView Advisory Group, LLC | 429 | 26 | ||||||
| 2026-02-17 | 13F | LaSalle St. Investment Advisors, LLC | 7.286 | 5,67 | 0 | |||||
| 2026-02-13 | 13F | Centiva Capital, LP | Put | 1.048.800 | 63.316 | |||||
| 2026-02-03 | 13F | Manske Wealth Management | 13.384 | -4,60 | 808 | 3,20 | ||||
| 2026-02-11 | 13F | LPL Financial LLC | 247.963 | 20,97 | 14.970 | 31,00 | ||||
| 2026-02-10 | 13F | New Republic Capital, LLC | 7.554 | 456 | ||||||
| 2026-02-13 | 13F | Manufacturers Life Insurance Company, The | 0 | -100,00 | 0 | |||||
| 2026-02-14 | 13F | Frec Markets, Inc. | 5.010 | 302 | ||||||
| 2026-02-17 | 13F | Blair William & Co/il | 5.478 | 14,39 | 331 | 24,06 | ||||
| 2026-02-13 | 13F | Cornerstone Financial Management LLC | 86 | 5 | ||||||
| 2025-12-18 | 13F/A | Westwood Global Investments, LLC | 1.476.010 | 1,23 | 72.074 | -20,41 | ||||
| 2026-01-16 | 13F | Montgomery Investment Management Inc | 16.150 | -9,01 | 975 | -1,52 | ||||
| 2026-01-27 | 13F | Forum Financial Management, LP | 75.967 | 0,00 | 4.586 | 8,29 | ||||
| 2025-11-07 | 13F | Sierra Ocean, Llc | 0 | -100,00 | 0 | -100,00 | ||||
| 2026-02-13 | 13F | Peak6 Llc | Call | 1.438.400 | -13,36 | 86.836 | -6,18 | |||
| 2026-02-13 | 13F | Peak6 Llc | Put | 882.900 | 0,56 | 53.301 | 8,89 | |||
| 2025-11-13 | 13F | Capital International Investors | 0 | -100,00 | 0 | |||||
| 2026-02-10 | 13F | Natixis Advisors, L.p. | 216.187 | -8,12 | 13 | 0,00 | ||||
| 2026-02-02 | 13F | Cornerstone Planning Group LLC | 232 | 25,41 | 16 | 60,00 | ||||
| 2025-11-14 | 13F | Atom Investors LP | 0 | -100,00 | 0 | |||||
| 2026-02-17 | 13F | Limestone Investment Advisors LP | Call | 17.800 | 1.075 | |||||
| 2026-01-26 | 13F | Private Trust Co Na | 301 | 0,00 | 18 | 12,50 | ||||
| 2026-02-17 | 13F | Limestone Investment Advisors LP | Put | 9.600 | 580 | |||||
| 2026-02-09 | 13F | Optimist Retirement Group LLC | 44.246 | -3,13 | 2.671 | 4,91 | ||||
| 2026-02-02 | 13F | Oppenheimer & Co Inc | 0 | -100,00 | 0 | |||||
| 2026-01-13 | 13F | Stephens Consulting, LLC | 98 | 6 | ||||||
| 2026-02-02 | 13F | Avidian Wealth Solutions, LLC | 7.531 | -0,63 | 455 | 7,58 | ||||
| 2026-02-10 | 13F | Murphy & Mullick Capital Management Corp | 72 | 1,41 | 4 | 0,00 | ||||
| 2026-02-17 | 13F | Sandler Capital Management | 46.732 | -18,11 | 2.821 | -11,32 | ||||
| 2026-01-21 | 13F | Newbridge Financial Services Group, Inc. | 168 | 0,00 | 10 | 11,11 | ||||
| 2026-02-17 | 13F | Tudor Investment Corp Et Al | Call | 0 | -100,00 | 0 | -100,00 | |||
| 2026-02-17 | 13F | Old Mission Capital Llc | 28.165 | 1.700 | ||||||
| 2026-01-28 | 13F | Salomon & Ludwin, LLC | 1.115 | 61,36 | 70 | 84,21 | ||||
| 2026-02-05 | 13F | Cambridge Investment Research Advisors, Inc. | 63.637 | -6,84 | 4 | 0,00 | ||||
| 2026-02-12 | 13F | Raiffeisen Bank International AG | Call | 0 | -100,00 | 0 | ||||
| 2026-02-17 | 13F | Summit Trail Advisors, Llc | 0 | -100,00 | 0 | |||||
| 2026-02-06 | 13F | Creative Financial Designs Inc /adv | 164 | 0,00 | 10 | 0,00 | ||||
| 2026-02-09 | 13F | Hartland & Co., LLC | 384 | 562,07 | 23 | 666,67 | ||||
| 2026-02-10 | 13F | Foundations Investment Advisors, LLC | 207.331 | 12.517 | ||||||
| 2026-03-16 | 13F | Bank of New Hampshire | 3.000 | 0,00 | 181 | 8,38 | ||||
| 2026-02-03 | 13F | Washington Trust Advisors, Inc. | 0 | -100,00 | 0 | |||||
| 2026-02-09 | 13F | Avalon Trust Co | 400 | 24 | ||||||
| 2026-01-12 | 13F | Abound Wealth Management | 153 | 512,00 | 9 | 800,00 | ||||
| 2026-02-13 | 13F | Motiv8 Investments LLC | 377 | 0 | ||||||
| 2026-02-03 | 13F | K.J. Harrison & Partners Inc | 50.005 | 0,00 | 3.019 | 8,76 | ||||
| 2026-02-12 | 13F | Great Valley Advisor Group, Inc. | 3.742 | 0,59 | 226 | 8,70 | ||||
| 2026-01-28 | 13F | Chicago Partners Investment Group LLC | 7.465 | 0,59 | 504 | 19,15 | ||||
| 2026-02-13 | 13F | Northwest Bancshares, Inc. | 14.917 | -5,54 | 901 | 2,27 | ||||
| 2025-09-25 | NP | DFIEX - International Core Equity Portfolio - Institutional Class This fund is a listed as child fund of Dimensional Fund Advisors Lp and if that institution has disclosed ownership in this security, then these positions will not be double counted when calculating total shares and total value | 1.184.773 | 0,00 | 60.032 | 6,56 | ||||
| 2026-02-12 | 13F | Groupe la Francaise | 0 | -100,00 | 0 | |||||
| 2025-09-29 | NP | CNZLX - Commonwealth Australia/New Zealand Fund | 2.300 | 0,00 | 117 | 6,42 | ||||
| 2026-01-21 | 13F | Signature Resources Capital Management, LLC | 102 | 0,00 | 6 | 20,00 | ||||
| 2026-02-17 | 13F | American Trust Investment Advisors, LLC | 6.072 | 0,00 | 367 | 8,28 | ||||
| 2026-02-13 | 13F | Umb Bank N A/mo | 1.468 | -12,36 | 89 | -5,38 | ||||
| 2026-02-17 | 13F | Shelton Capital Management | 6.300 | 0,00 | 380 | 8,26 | ||||
| 2026-02-17 | 13F | Advisor Group Holdings, Inc. | 110.865 | 36,49 | 6.696 | 47,40 | ||||
| 2026-01-30 | 13F | AMG National Trust Bank | 5.284 | 28,16 | 319 | 38,86 | ||||
| 2025-11-14 | 13F | 1832 Asset Management L.P. | 0 | -100,00 | 0 | |||||
| 2026-02-13 | 13F | Beutel, Goodman & Co Ltd. | 300 | 0,00 | 0 | |||||
| 2026-02-17 | 13F | Quadrature Capital Ltd | 56.192 | 3.392 | ||||||
| 2026-02-19 | 13F | Rare Wolf Capital LLC | 9.906 | 598 | ||||||
| 2026-02-02 | 13F | Mutual Advisors, LLC | 7.225 | -1,98 | 436 | 7,13 | ||||
| 2026-02-13 | 13F | Icon Advisers Inc/co | 40.000 | -28,57 | 2.415 | -22,68 | ||||
| 2026-02-17 | 13F | Jain Global LLC | 23.009 | 1.389 | ||||||
| 2026-02-03 | 13F | Providence First Trust Co | 5.656 | 341 | ||||||
| 2026-01-08 | 13F | Norway Savings Bank | 10.432 | 2,96 | 630 | 11,52 | ||||
| 2026-02-12 | 13F | Adviser Investments LLC | 4.350 | 0,00 | 263 | 8,26 | ||||
| 2026-02-13 | 13F | First Trust Advisors Lp | 32.156 | -59,83 | 1.941 | -56,51 | ||||
| 2026-01-26 | 13F | Townsend & Associates, Inc | 626.081 | 1,34 | 41.340 | 20,38 | ||||
| 2026-01-15 | 13F | Jamison Private Wealth Management, Inc. | 81.095 | -0,16 | 4.896 | 8,11 | ||||
| 2026-02-17 | 13F | Cape Investment Advisory, Inc. | 240 | 14 | ||||||
| 2026-01-12 | 13F | Kozak & Associates, Inc. | 65 | 0,00 | 4 | 33,33 | ||||
| 2026-02-19 | 13F | CI Private Wealth, LLC | 323.596 | -0,12 | 19.537 | 8,17 | ||||
| 2026-02-06 | 13F | Berbice Capital Management LLC | 500 | 0,00 | 30 | 11,11 | ||||
| 2026-02-13 | 13F | Van Eck Associates Corp | 297.488 | 241,83 | 18 | 325,00 | ||||
| 2026-02-17 | 13F | Ancora Advisors, LLC | 798 | 17,35 | 48 | 29,73 | ||||
| 2026-02-13 | 13F | Charles Schwab Investment Management Inc | 381.106 | 14,39 | 23.007 | 23,87 | ||||
| 2026-02-12 | 13F | Insigneo Advisory Services, Llc | 4.428 | -5,24 | 267 | 2,69 | ||||
| 2026-02-12 | 13F | Cibc World Markets Corp | 11.512 | 695 | ||||||
| 2026-02-17 | 13F | Jones Financial Companies Lllp | 38.983 | 10,33 | 2.353 | 21,66 | ||||
| 2026-01-14 | 13F | Centurion Wealth Management LLC | 4.700 | 0,00 | 284 | 8,02 | ||||
| 2026-01-22 | 13F | Vicus Capital | 219.540 | -4,03 | 13.254 | 3,92 | ||||
| 2026-02-17 | 13F | Point72 Asset Management, L.P. | 621.383 | 37.513 | ||||||
| 2026-01-21 | 13F | Persium Advisors, LLC | 15.293 | 3,91 | 923 | 12,56 | ||||
| 2026-01-27 | 13F | GHP Investment Advisors, Inc. | 842 | 0,00 | 51 | 8,70 | ||||
| 2026-02-11 | 13F | Saturna Capital CORP | 12.025 | 726 | ||||||
| 2026-01-20 | 13F | Independence Bank of Kentucky | 91 | 5 | ||||||
| 2026-02-13 | 13F | Alerus Financial Na | 344 | 0,00 | 21 | 5,26 | ||||
| 2026-02-13 | 13F | Y-Intercept (Hong Kong) Ltd | 325.416 | 247,77 | 19.645 | 276,63 | ||||
| 2025-11-12 | 13F | Creekmur Asset Management LLC | 75 | 0,00 | 4 | 33,33 | ||||
| 2026-01-29 | 13F | UBS Group AG | Put | 636.600 | 45,81 | 38.432 | 57,89 | |||
| 2026-02-23 | 13F | Mv Capital Management, Inc. | 28 | 2 | ||||||
| 2026-01-29 | 13F | UBS Group AG | Call | 281.600 | -4,09 | 17.000 | 3,86 | |||
| 2026-01-29 | 13F | UBS Group AG | 389.336 | -30,92 | 23.504 | -25,19 | ||||
| 2025-09-29 | NP | SEG Partners Long/Short Equity Fund | Short | -6.810 | -18,16 | -345 | -12,66 | |||
| 2026-01-23 | 13F | Freestone Capital Holdings, LLC | 3.558 | 215 | ||||||
| 2026-02-17 | 13F | Two Sigma Advisers, Lp | 5.201 | 314 | ||||||
| 2025-11-14 | 13F | AXA Investment Managers S.A. | 5.240 | 292 | ||||||
| 2026-02-13 | 13F | American Century Companies Inc | 1.028.917 | 11,80 | 62.116 | 21,07 | ||||
| 2026-02-11 | 13F | Holowesko Partners Ltd. | 116.800 | 27,09 | 7.051 | 37,63 | ||||
| 2025-10-07 | 13F | Thurston, Springer, Miller, Herd & Titak, Inc. | 0 | -100,00 | 0 | |||||
| 2026-02-12 | 13F | Triumph Capital Management | 100 | 334,78 | 6 | 500,00 | ||||
| 2026-02-13 | 13F | Pathstone Holdings, LLC | 44.735 | 7,79 | 2.701 | 16,73 | ||||
| 2026-02-11 | 13F | State Farm Mutual Automobile Insurance Co | 1.348.932 | 0,00 | 81.435 | 8,29 | ||||
| 2026-02-11 | 13F | Havemeyer Place LP | 2.876 | 174 | ||||||
| 2026-02-13 | 13F | Invictus Private Wealth, Llc | 0 | -100,00 | 0 | |||||
| 2026-02-17 | 13F | Capital Fund Management S.a. | Call | 20.300 | -9,38 | 1.226 | -1,84 | |||
| 2026-02-11 | 13F | West Family Investments, Inc. | 11.551 | 0,00 | 697 | 8,40 | ||||
| 2026-02-17 | 13F | Capital Fund Management S.a. | Put | 11.400 | -57,46 | 688 | -53,95 | |||
| 2026-02-02 | 13F | Oppenheimer Asset Management Inc. | 0 | -100,00 | 0 | |||||
| 2026-02-17 | 13F | Schonfeld Strategic Advisors LLC | 52.368 | 3.161 | ||||||
| 2026-02-13 | 13F | Baird Financial Group, Inc. | 32.581 | -1,18 | 1.967 | 6,96 | ||||
| 2026-02-18 | 13F | EP Wealth Advisors, Inc. | 8.129 | 44,18 | 491 | 80,81 | ||||
| 2026-01-26 | 13F | Merit Financial Group, LLC | 13.275 | 51,58 | 801 | 64,14 | ||||
| 2026-02-12 | 13F | Investment Research Partners LLC | 6.369 | -1,55 | 385 | 2,67 | ||||
| 2026-01-13 | 13F | Kathmere Capital Management, LLC | 11.681 | 3,96 | 705 | 12,62 | ||||
| 2026-02-06 | 13F | Gsa Capital Partners Llp | 5.654 | 0 | ||||||
| 2026-02-17 | 13F | Raymond James Financial Inc | 525.154 | 3,28 | 31.704 | 11,84 | ||||
| 2026-01-23 | 13F | Castellan Group, LLC | 27.083 | 0,52 | 1.635 | 8,85 | ||||
| 2026-02-13 | 13F | MAI Capital Management | 15.103 | -1,00 | 912 | 7,18 | ||||
| 2026-02-06 | 13F | EverSource Wealth Advisors, LLC | 3.353 | 2,76 | 202 | 11,60 | ||||
| 2026-02-13 | 13F | Corient IA LLC | 0 | -100,00 | 0 | |||||
| 2025-11-13 | 13F | Twin Tree Management, LP | 0 | -100,00 | 0 | -100,00 | ||||
| 2026-02-13 | 13F | Morgan Stanley | 13.800.183 | 22,81 | 833.117 | 32,98 | ||||
| 2026-02-13 | 13F | Pin Oak Investment Advisors Inc | 4 | -98,71 | 0 | -100,00 | ||||
| 2025-11-06 | 13F | Savvy Advisors, Inc. | 0 | -100,00 | 0 | |||||
| 2026-02-17 | 13F | Amundi | 91.930 | -2,41 | 5.550 | 5,25 | ||||
| 2026-02-09 | 13F | Harbour Investments, Inc. | 2.093 | 0,58 | 126 | 8,62 | ||||
| 2025-11-04 | 13F | High Note Wealth, LLC | 0 | -100,00 | 0 | |||||
| 2026-01-08 | 13F | Grove Bank & Trust | 857 | -3,05 | 52 | 4,08 | ||||
| 2026-02-05 | 13F | Lockheed Martin Investment Management Co | 37.460 | -29,27 | 2.261 | -23,41 | ||||
| 2026-02-23 | 13F | Walser Wealth Management Company, A Ltd Liability Co | 3.593 | 217 | ||||||
| 2025-11-14 | 13F | Concentric Capital Strategies, LP | 0 | -100,00 | 0 | |||||
| 2026-02-11 | 13F | Nemes Rush Group LLC | 9 | 1 | ||||||
| 2026-02-13 | 13F | Inspire Advisors, LLC | 11.302 | -8,69 | 682 | -1,16 | ||||
| 2026-01-23 | 13F | Bridgewater Advisors Inc. | 6.193 | 5,52 | 406 | 24,54 | ||||
| 2026-02-10 | 13F | CIBC Asset Management Inc | 30.115 | 306,90 | 1.818 | 341,26 | ||||
| 2026-01-30 | 13F/A | M&t Bank Corp | 19.550 | 30,73 | 1.180 | 41,66 | ||||
| 2025-10-27 | 13F | Kiker Wealth Management, LLC | 0 | -100,00 | 0 | |||||
| 2026-02-05 | 13F | Rossmore Private Capital | 14.695 | -10,72 | 887 | -3,27 | ||||
| 2026-02-13 | 13F | Rhumbline Advisers | 21.179 | 43,66 | 1.279 | 55,66 | ||||
| 2026-02-17 | 13F | North Capital, Inc. | 0 | -100,00 | 0 | |||||
| 2026-03-11 | 13F | Larry Mathis Financial Planning, LLC | 8.451 | 510 | ||||||
| 2026-01-22 | 13F | Venturi Wealth Management, LLC | 7.468 | 69,42 | 451 | 83,67 | ||||
| 2025-09-26 | NP | HLMIX - Harding Loevner International Equity Portfolio Institutional | 3.414.868 | -4,31 | 173.031 | 1,97 | ||||
| 2026-01-12 | 13F | Legacy Wealth Asset Management, LLC | 25.939 | -14,56 | 1.566 | -7,51 | ||||
| 2026-02-10 | 13F | Founders Financial Securities Llc | 12.956 | 4,11 | 782 | 12,84 | ||||
| 2026-02-11 | 13F | Dorsey & Whitney Trust CO LLC | 12.849 | 5,81 | 776 | 14,64 | ||||
| 2026-02-12 | 13F | Brinker Capital Investments, LLC | 24.909 | -12,88 | 1.504 | -5,65 | ||||
| 2025-09-29 | NP | SPWO - SP Funds S&P World (ex-US) ETF | 11.867 | 42,65 | 601 | 52,15 | ||||
| 2026-01-09 | 13F | Marshall Financial Group LLC | 13.220 | 798 | ||||||
| 2026-02-23 | 13F | Beaird Harris Wealth Management, LLC | 6 | 0,00 | 0 | |||||
| 2026-03-04 | 13F/A | Pure Financial Advisors, Inc. | 5.046 | 305 | ||||||
| 2025-09-26 | NP | HLIDX - International Developed Markets Equity Portfolio Institutional Class | 31.331 | -6,14 | 1.588 | 0,00 | ||||
| 2025-10-16 | 13F | Portman Square Capital LLP | Call | 0 | -100,00 | 0 | -100,00 | |||
| 2025-10-16 | 13F | Portman Square Capital LLP | 0 | -100,00 | 0 | -100,00 | ||||
| 2026-01-26 | 13F | Cordatus Wealth Management LLC | 10.033 | -3,44 | 606 | 4,49 | ||||
| 2026-01-29 | 13F | Rakuten Securities, Inc. | 291 | 15,02 | 18 | 21,43 | ||||
| 2025-10-16 | 13F | Portman Square Capital LLP | Put | 0 | -100,00 | 0 | -100,00 | |||
| 2026-01-21 | 13F | Aaron Wealth Advisors LLC | 20.424 | 37,33 | 1.233 | 48,73 | ||||
| 2026-02-13 | 13F | PCM Encore, LLC | 9.372 | 566 | ||||||
| 2026-01-12 | 13F | DAVENPORT & Co LLC | 0 | -100,00 | 0 | |||||
| 2025-11-14 | 13F | Aigen Investment Management, Lp | 0 | -100,00 | 0 | |||||
| 2026-02-09 | 13F | Cary Street Partners Financial Llc | 855 | 11,33 | 52 | 21,43 | ||||
| 2026-02-11 | 13F | GW&K Investment Management, LLC | 421 | 0,00 | 0 | |||||
| 2026-01-27 | 13F | Fractal Investments LLC | 9.000 | 0,00 | 543 | 8,38 | ||||
| 2026-02-06 | 13F | Plan A Wealth LLC | 10.058 | 4,75 | 607 | 13,46 | ||||
| 2026-02-11 | 13F | MCF Advisors LLC | 0 | -100,00 | 0 | |||||
| 2025-11-14 | 13F | Mangrove Partners | 0 | -100,00 | 0 | |||||
| 2026-02-13 | 13F | Knollwood Investment Advisory, LLC | 4.150 | 0,00 | 251 | 8,23 | ||||
| 2026-02-13 | 13F | Walleye Capital LLC | Put | 129.000 | 7.788 | |||||
| 2026-02-17 | 13F | Susquehanna International Group, Llp | Call | 1.437.700 | 43,61 | 86.794 | 55,51 | |||
| 2026-02-18 | 13F | Caitlin John, LLC | 85 | 5 | ||||||
| 2026-01-23 | 13F | Optima Capital Llc | 278 | 17 | ||||||
| 2026-02-09 | 13F | Kingsview Wealth Management, LLC | 12.247 | 27,24 | 739 | 37,87 | ||||
| 2026-02-13 | 13F | Walleye Capital LLC | 80.941 | 4.886 | ||||||
| 2026-02-17 | 13F | Susquehanna International Group, Llp | 44.404 | 204,20 | 2.681 | 229,64 | ||||
| 2026-02-13 | 13F | Walleye Capital LLC | Call | 59.500 | 3.592 | |||||
| 2026-02-17 | 13F | Susquehanna International Group, Llp | Put | 632.500 | -4,24 | 38.184 | 3,70 | |||
| 2026-02-17 | 13F | Boreal Capital Management LLC | 330 | 0,00 | 20 | 5,56 | ||||
| 2026-03-06 | 13F | Hsbc Holdings Plc | 5.117 | -51,02 | 309 | -46,45 | ||||
| 2026-01-23 | 13F | Valley National Advisers Inc | 400 | 0,00 | 0 | |||||
| 2026-01-12 | 13F | Moody National Bank Trust Division | 18.428 | -2,51 | 1.112 | 5,60 | ||||
| 2026-02-13 | 13F | Financial Sense Advisors, Inc. | 6.000 | -61,97 | 362 | -58,82 | ||||
| 2026-02-12 | 13F | Chilton Capital Management Llc | 690 | 0,00 | 42 | 7,89 | ||||
| 2025-11-12 | 13F | NewSquare Capital LLC | 0 | -100,00 | 0 | -100,00 | ||||
| 2026-02-17 | 13F | Fmr Llc | 2.066.768 | 6,56 | 124.771 | 15,39 | ||||
| 2025-11-10 | 13F | Raiffeisen Bank International AG | 0 | -100,00 | 0 | -100,00 | ||||
| 2025-09-25 | NP | DFIC - Dimensional International Core Equity 2 ETF | 459.721 | 0,00 | 23.294 | 6,56 | ||||
| 2026-01-26 | 13F | Cwm, Llc | 6.579 | -1,22 | 0 | |||||
| 2026-02-05 | 13F | Mission Wealth Management, Lp | 10.162 | 0,20 | 613 | 8,50 | ||||
| 2026-02-06 | 13F | Bare Financial Services, Inc | 0 | -100,00 | 0 | |||||
| 2026-02-12 | 13F | Sit Investment Associates Inc | 16.050 | -22,84 | 1 | -100,00 | ||||
| 2025-11-14 | 13F | Engineers Gate Manager LP | 0 | -100,00 | 0 | |||||
| 2026-01-15 | 13F | Lodestone Wealth Management LLC | 11 | 1 | ||||||
| 2026-02-06 | 13F | Pnc Financial Services Group, Inc. | 72.102 | -6,62 | 4.353 | 1,12 | ||||
| 2026-02-13 | 13F | Brown Advisory Inc | 17.495 | 26,49 | 1.056 | 36,96 | ||||
| 2025-10-17 | 13F | Hm Payson & Co | 0 | -100,00 | 0 | |||||
| 2026-01-26 | 13F | Abbington Investment Group | 69.288 | 45,60 | 4.183 | 57,63 | ||||
| 2025-10-14 | 13F | Trust Co Of Vermont | 0 | -100,00 | 0 | |||||
| 2026-01-21 | 13F | Naviter Wealth, LLC | 47.151 | -7,03 | 2.846 | 0,67 | ||||
| 2026-02-13 | 13F | Kayne Anderson Rudnick Investment Management Llc | 42 | 0,00 | 3 | 0,00 | ||||
| 2025-09-25 | NP | DFA INVESTMENT DIMENSIONS GROUP INC - World ex U.S. Core Equity Portfolio Institutional Class Shares | 52.042 | 0,00 | 2.637 | 6,55 | ||||
| 2026-02-11 | 13F | TT Capital Management LLC | 4.867 | -7,59 | 294 | 0,00 | ||||
| 2026-02-13 | 13F | Strategic Global Advisors, LLC | 29.295 | 8,50 | 1.769 | 17,48 | ||||
| 2026-01-12 | 13F | CVA Family Office, LLC | 3.600 | 0,00 | 217 | 8,50 | ||||
| 2026-02-12 | 13F | SWAN Capital LLC | 27 | 0,00 | 2 | 0,00 | ||||
| 2026-02-09 | 13F | Morningstar Investment Management LLC | 0 | -100,00 | 0 | |||||
| 2026-02-11 | 13F | Rise Advisors, LLC | 0 | -100,00 | 0 | |||||
| 2026-02-11 | 13F | Ovata Capital Management Ltd | 46.187 | 103,58 | 2.806 | 120,08 | ||||
| 2025-10-06 | 13F | NWF Advisory Services Inc. | 0 | -100,00 | 0 | -100,00 | ||||
| 2026-02-10 | 13F/A | Northwestern Mutual Wealth Management Co | 37.647 | 13,94 | 2.273 | 23,41 | ||||
| 2026-02-03 | 13F | Violich Capital Management, Inc. | 186.326 | -3,34 | 11.249 | 4,67 | ||||
| 2026-01-22 | 13F | Bartlett & Co. Wealth Management Llc | 2.008 | 0,00 | 121 | 9,01 | ||||
| 2026-02-02 | 13F | Farmers & Merchants Trust Co of Chambersburg PA | 3.000 | 0,00 | 0 | |||||
| 2026-02-10 | 13F | Rothschild Investment Llc | 969 | -5,09 | 58 | 3,57 | ||||
| 2026-02-10 | 13F | Bearing Point Capital, Llc | 125.425 | 9,61 | 7.572 | 18,69 | ||||
| 2026-01-22 | 13F | Comprehensive Money Management Services LLC | 5.936 | 0,00 | 358 | 8,48 | ||||
| 2026-01-21 | 13F | Yousif Capital Management, Llc | 30.326 | -21,34 | 1.953 | -9,17 | ||||
| 2026-02-12 | 13F | Wedbush Securities Inc | 8.087 | 7,90 | 0 | |||||
| 2026-02-17 | 13F | SIH Partners, LLLP | 306.158 | -83,51 | 18.483 | -82,14 | ||||
| 2026-02-11 | 13F | Erste Asset Management GmbH | 0 | 0 | ||||||
| 2026-02-17 | 13F | Russell Investments Group, Ltd. | 43.892 | 33,18 | 2.650 | 44,20 | ||||
| 2026-02-14 | 13F | Whipplewood Advisors, LLC | 5 | 0 | ||||||
| 2026-02-09 | 13F | Hantz Financial Services, Inc. | 68.872 | 75,98 | 4 | 100,00 | ||||
| 2026-02-12 | 13F | New York State Common Retirement Fund | 8.100 | 158,70 | 489 | 180,46 | ||||
| 2026-01-20 | 13F | American National Bank | 371 | -65,36 | 22 | -62,71 | ||||
| 2026-01-13 | 13F | Mather Group, Llc. | 3.396 | 4,49 | 205 | 13,26 | ||||
| 2026-01-07 | 13F | Retirement Wealth Solutions LLC | 182 | -19,47 | 11 | -16,67 | ||||
| 2026-02-13 | 13F | Centiva Capital, LP | Call | 40.000 | 2.415 | |||||
| 2026-02-13 | 13F | Centiva Capital, LP | 56.436 | 156,88 | 3.407 | 178,35 | ||||
| 2026-01-22 | 13F | Pinnacle Bancorp, Inc. | 300 | -63,19 | 18 | -60,00 | ||||
| 2026-01-26 | 13F | Main Street Group, LTD | 0 | -100,00 | 0 | |||||
| 2026-02-06 | 13F | Associated Banc-corp | 36.629 | -1,47 | 2.211 | 6,71 | ||||
| 2026-02-12 | 13F | Federation des caisses Desjardins du Quebec | 8.272 | 24,97 | 499 | 35,23 | ||||
| 2026-02-10 | 13F | Connor, Clark & Lunn Investment Management Ltd. | 198.144 | -57,31 | 11.962 | -53,77 | ||||
| 2026-02-13 | 13F | Fairfield, Bush & Co. | 14.887 | 0,00 | 899 | 8,32 | ||||
| 2026-02-17 | 13F | Price T Rowe Associates Inc /md/ | 171.734 | 0,00 | 10 | 11,11 | ||||
| 2026-02-10 | 13F | Dynasty Wealth Management, Llc | 14.414 | 7,91 | 870 | 16,94 | ||||
| 2026-02-11 | 13F | Group One Trading, L.p. | Put | 65.700 | 83,52 | 3.966 | 98,80 | |||
| 2026-02-05 | 13F | Center for Financial Planning, Inc. | 500 | 0,00 | 30 | 11,11 | ||||
| 2026-02-11 | 13F | Group One Trading, L.p. | 27.926 | -38,28 | 1.686 | -33,19 | ||||
| 2026-02-11 | 13F | Group One Trading, L.p. | Call | 122.700 | -18,04 | 7.407 | -11,24 | |||
| 2026-02-13 | 13F | Bollard Group LLC | 8.324 | -15,18 | 1 | |||||
| 2026-02-04 | 13F | Oxbow Advisors, LLC | 119.974 | 1.093,77 | 7.243 | 1.393,20 | ||||
| 2025-10-14 | 13F | Bridge Creek Capital Management LLC | 51.706 | -1,13 | 2.883 | 14,64 | ||||
| 2026-02-06 | 13F | Harmony Asset Management Llc | 5.583 | 15,76 | 337 | 25,75 | ||||
| 2026-02-05 | 13F | Gabelli Funds Llc | 524.400 | 18,27 | 31.658 | 28,07 | ||||
| 2026-02-17 | 13F | Captrust Financial Advisors | 18.401 | -52,53 | 1.111 | -48,61 | ||||
| 2026-02-17 | 13F | Agf Management Ltd | 5.200 | 0,00 | 314 | 8,30 | ||||
| 2026-02-17 | 13F | Greenline Partners, LLC | 123.288 | 23,05 | 7.443 | 33,25 | ||||
| 2026-02-17 | 13F | Sig Brokerage, Lp | Call | 35.700 | 0,00 | 2.155 | 8,29 | |||
| 2025-09-25 | NP | QUVU - Hartford Quality Value ETF | 49.639 | 9,51 | 2.515 | 16,71 | ||||
| 2026-02-17 | 13F | Quantitative Investment Management, LLC | 0 | -100,00 | 0 | |||||
| 2025-09-24 | NP | SNTKX - Steward International Enhanced Index Fund Class A | 116.431 | 11,47 | 5.900 | 18,79 | ||||
| 2026-02-11 | 13F | Empowered Funds, LLC | 5.800 | 350 | ||||||
| 2026-01-27 | 13F | Fortis Capital Advisors, LLC | 3.393 | 205 | ||||||
| 2026-02-13 | 13F | Smartleaf Asset Management LLC | 15.011 | 8,61 | 914 | 17,63 | ||||
| 2025-11-06 | 13F | Abich Financial Wealth Management LLC | 43 | 2 | ||||||
| 2025-09-19 | NP | PRPFX - Permanent Portfolio Class I | 350.000 | 7,69 | 17.734 | 14,76 | ||||
| 2026-02-06 | 13F | Profund Advisors Llc | 16.201 | -13,40 | 978 | -6,14 | ||||
| 2026-02-12 | 13F | Pitcairn Co | 0 | -100,00 | 0 | |||||
| 2026-02-10 | 13F | Meramec Financial Planners, LLC | 32 | 2 | ||||||
| 2026-01-23 | 13F | Factory Mutual Insurance Co | 89.252 | 0,00 | 5.388 | 8,30 | ||||
| 2026-01-26 | 13F | Asset Dedication, LLC | 450 | 0,00 | 27 | 8,00 | ||||
| 2026-01-23 | 13F | Nbt Bank N A /ny | 2.172 | 0,18 | 134 | 8,13 | ||||
| 2026-02-03 | 13F | International Assets Investment Management, Llc | 8.542 | -7,06 | 516 | 15,21 | ||||
| 2025-11-14 | 13F | Wolverine Trading, Llc | Call | 83.600 | 4.700 | |||||
| 2026-01-28 | 13F | Aspen Wealth Strategies, LLC | 4.200 | 1,03 | 254 | 9,52 | ||||
| 2025-11-14 | 13F | Wolverine Trading, Llc | Put | 69.900 | 3.930 | |||||
| 2026-02-09 | 13F | Atlantic Trust, LLC | 0 | -100,00 | 0 | |||||
| 2026-02-17 | 13F | Abel Hall, LLC | 15.221 | 103,87 | 919 | 120,67 | ||||
| 2025-09-25 | NP | DIHRX - International High Relative Profitability Portfolio Institutional Class This fund is a listed as child fund of Dimensional Fund Advisors Lp and if that institution has disclosed ownership in this security, then these positions will not be double counted when calculating total shares and total value | 365.914 | 0,00 | 18.541 | 6,56 | ||||
| 2026-01-08 | 13F | Traveka Wealth, LLC | 4.877 | 0,31 | 294 | 8,49 | ||||
| 2026-02-17 | 13F | Pinnacle Financial Partners, Inc. | 4.955 | 299 | ||||||
| 2025-11-14 | 13F | Wolverine Trading, Llc | 7.220 | 406 | ||||||
| 2026-02-04 | 13F | Legacy Financial Advisors, Inc. | 0 | -100,00 | 0 | |||||
| 2025-11-13 | 13F | Hsbc Holdings Plc | Put | 0 | -100,00 | 0 | -100,00 | |||
| 2026-02-02 | 13F | PKO Investment Management Joint-Stock Co | 76.208 | 0,00 | 4.601 | 8,29 | ||||
| 2026-02-02 | 13F | One Wealth Advisors, LLC | 0 | -100,00 | 0 | |||||
| 2026-02-02 | 13F | CX Institutional | 14 | 7,69 | 0 | |||||
| 2026-02-12 | 13F | Qtron Investments LLC | 0 | -100,00 | 0 | |||||
| 2026-02-13 | 13F | Arrowstreet Capital, Limited Partnership | 575.410 | 17,79 | 34.738 | 27,55 | ||||
| 2026-02-17 | 13F | Fairscale Capital, LLC | 322 | 0,00 | 19 | 11,76 | ||||
| 2026-02-20 | 13F | Kovitz Investment Group Partners, LLC | 0 | -100,00 | 0 | |||||
| 2026-02-03 | 13F | Gallacher Capital Management LLC | 9.967 | -0,05 | 602 | 8,29 | ||||
| 2026-01-13 | 13F | Trust Point Inc. | 5.273 | 318 | ||||||
| 2025-11-13 | 13F | Jump Financial, LLC | 0 | -100,00 | 0 | |||||
| 2026-01-27 | 13F | Benedict Financial Advisors Inc | 7.198 | 0,00 | 435 | 8,23 | ||||
| 2026-02-12 | 13F | CoreCommodity Management, LLC | 8.828 | 0,00 | 533 | 8,13 | ||||
| 2025-11-14 | 13F | Intrepid Family Office Llc | 0 | -100,00 | 0 | -100,00 | ||||
| 2026-01-08 | 13F | Armstrong Advisory Group, Inc | 160 | 0,00 | 10 | 12,50 | ||||
| 2026-02-13 | 13F | Ubs Asset Management Americas Inc | 7.634 | 461 | ||||||
| 2025-10-30 | 13F | Ridgewood Investments LLC | 17.771 | 4,16 | 991 | 20,73 | ||||
| 2026-02-17 | 13F | Optiver Holding B.V. | Call | 682.200 | 37,73 | 41.184 | 49,15 | |||
| 2026-02-17 | 13F | Optiver Holding B.V. | Put | 660.000 | 51,13 | 39.844 | 63,66 | |||
| 2026-02-09 | 13F | Keating Financial Advisory Services, Inc. | 148 | 9 | ||||||
| 2026-01-13 | 13F | CoreCap Advisors, LLC | 1.302 | -60,20 | 79 | -57,14 | ||||
| 2026-02-13 | 13F | Walleye Trading LLC | 523 | 32 | ||||||
| 2026-02-13 | 13F | Walleye Trading LLC | Put | 179.500 | 34,96 | 10.836 | 46,16 | |||
| 2026-01-23 | 13F | Avion Wealth | 89 | 0,00 | 0 | |||||
| 2026-02-12 | 13F | Commonwealth Equity Services, Llc | 87.743 | 3,17 | 5.297 | 132.325,00 | ||||
| 2026-02-13 | 13F | Walleye Trading LLC | Call | 203.000 | 103,00 | 12.255 | 119,82 | |||
| 2026-01-22 | 13F | HHM Wealth Advisors, LLC | 1.000 | 0,00 | 60 | 9,09 | ||||
| 2026-01-29 | 13F | IMC-Chicago, LLC | Put | 71.200 | 101,70 | 4.298 | 118,51 | |||
| 2026-01-29 | 13F | IMC-Chicago, LLC | Call | 99.300 | 146,40 | 5.995 | 166,87 | |||
| 2026-02-13 | 13F | SPX Equities Gestao de Recursos Ltda | 0 | 0 | ||||||
| 2026-01-27 | 13F | Zurcher Kantonalbank (Zurich Cantonalbank) | 1.241 | 23,48 | 75 | 32,14 | ||||
| 2026-02-13 | 13F | 1248 Management, LLC | 0 | -100,00 | 0 | |||||
| 2026-01-29 | 13F | Kestra Private Wealth Services, Llc | 17.327 | 168,80 | 1.046 | 191,36 | ||||
| 2026-02-13 | 13F | Centerpoint Advisors, LLC | 275 | 0,00 | 0 | |||||
| 2026-02-13 | 13F | Stifel Financial Corp | 163.343 | -0,70 | 9.861 | 7,54 | ||||
| 2026-02-06 | 13F | Radnor Capital Management, LLC | 7.600 | 0,00 | 459 | 8,27 | ||||
| 2026-02-14 | 13F | Rockefeller Capital Management L.P. | 420.018 | 37,32 | 25.297 | 48,35 | ||||
| 2026-02-10 | 13F | Essex Financial Services, Inc. | 4.895 | -14,91 | 295 | -7,81 | ||||
| 2026-01-26 | 13F | PDS Planning, Inc | 9.481 | 3,90 | 572 | 12,60 | ||||
| 2026-02-12 | 13F | Nuveen, LLC | 0 | -100,00 | 0 | |||||
| 2025-11-14 | 13F | Decade Renewable Partners Lp | 0 | -100,00 | 0 | |||||
| 2026-01-09 | 13F | SG Americas Securities, LLC | Put | 150.000 | 0 | |||||
| 2025-11-21 | 13F/A | CIBC Bancorp USA Inc. | Call | 310.300 | 17.299 | |||||
| 2026-02-13 | 13F | Wright Wealth Llc | 4.657 | 281 | ||||||
| 2026-02-13 | 13F | Citigroup Inc | Call | 385.000 | 196,15 | 23.242 | 220,71 | |||
| 2026-02-13 | 13F | Citigroup Inc | Put | 315.000 | 61,54 | 19.017 | 74,92 | |||
| 2026-02-11 | 13F | Deutsche Bank Ag\ | 482.650 | 64.253,33 | 29.138 | 70.965,85 | ||||
| 2026-01-30 | 13F | Bogart Wealth, LLC | 18 | -91,13 | 1 | -90,91 | ||||
| 2026-02-13 | 13F | Citigroup Inc | 2.251.802 | -30,35 | 135.941 | -24,58 | ||||
| 2026-02-12 | 13F | Callan Family Office, LLC | 86.329 | 10,17 | 5.212 | 19,30 | ||||
| 2026-02-04 | 13F | Western Pacific Wealth Management, LP | 51 | 0,00 | 3 | 50,00 | ||||
| 2025-09-25 | NP | DIHP - Dimensional International High Profitability ETF | 467.129 | 0,00 | 23.669 | 6,56 | ||||
| 2026-02-11 | 13F | Franklin Resources Inc | 338.213 | 774,93 | 20.418 | 818,86 | ||||
| 2026-02-12 | 13F | Godshalk Welsh Capital Management, Inc. | 4.050 | -5,81 | 244 | 2,09 | ||||
| 2026-02-12 | 13F | BlackRock, Inc. | 2.627.868 | -4,86 | 158.644 | 3,02 | ||||
| 2026-02-05 | 13F | May Hill Capital, LLC | 14.330 | 114,55 | 865 | 132,53 | ||||
| 2026-02-10 | 13F | Bnp Paribas Arbitrage, Sa | 14.603 | -97,22 | 882 | -96,99 | ||||
| 2025-11-13 | 13F | FORA Capital, LLC | 0 | -100,00 | 0 | -100,00 | ||||
| 2026-01-22 | 13F | Northcape Wealth Management, Llc | 44.874 | -2,65 | 2.709 | 5,45 | ||||
| 2026-02-10 | 13F | Bnp Paribas Arbitrage, Sa | Put | 1.391 | -27,17 | 8.397 | -21,14 | |||
| 2026-02-10 | 13F | Bnp Paribas Arbitrage, Sa | Call | 966 | -53,08 | 5.832 | -49,20 | |||
| 2026-01-27 | 13F | Evergreen Capital Management Llc | 36.584 | 7,87 | 2.209 | 16,83 | ||||
| 2026-02-09 | 13F | Huntington National Bank | 1.183 | -20,12 | 71 | -13,41 | ||||
| 2026-01-30 | 13F | Exencial Wealth Advisors, Llc | 3.418 | -11,75 | 206 | -4,19 | ||||
| 2026-02-03 | 13F | Ballentine Partners, LLC | 13.110 | 0,88 | 791 | 9,25 | ||||
| 2026-01-07 | 13F | Harbour Capital Advisors, LLC | 15.565 | 0,06 | 961 | 12,00 | ||||
| 2026-01-20 | 13F | Family Legacy Financial Solutions, LLC | 0 | -100,00 | 0 | |||||
| 2026-02-06 | 13F/A | Rathbone Brothers plc | 4.616 | 0,00 | 279 | 8,17 | ||||
| 2026-02-17 | 13F | Royal Bank Of Canada | 1.050.956 | -11,21 | 63.447 | -3,85 | ||||
| 2026-01-23 | 13F | Brown, Lisle/cummings, Inc. | 18 | 0,00 | 1 | |||||
| 2026-02-13 | 13F | Gts Securities Llc | 12.092 | 730 | ||||||
| 2026-02-11 | 13F | Hilton Head Capital Partners, LLC | 427 | 26 | ||||||
| 2026-02-02 | 13F | SevenBridge Financial Group, LLC | 9.399 | -4,71 | 637 | 14,59 | ||||
| 2026-02-13 | 13F | Solstein Capital, LLC | 1.459 | 110,23 | 88 | 131,58 | ||||
| 2026-02-13 | 13F | Shelter Mutual Insurance Co | 94.680 | 0,00 | 5.716 | 8,28 | ||||
| 2026-02-17 | 13F | Ameriflex Group, Inc. | 359 | -50,00 | 22 | -47,50 | ||||
| 2026-01-15 | 13F | Trust Co | 12 | 1 | ||||||
| 2025-10-31 | 13F | Whittier Trust Co Of Nevada Inc | 0 | -100,00 | 0 | |||||
| 2026-02-10 | 13F | CIBC World Markets Inc. | 184.200 | 224,29 | 11.120 | 251,23 | ||||
| 2026-02-03 | 13F | Garner Asset Management Corp | 6.411 | -9,77 | 387 | -2,27 | ||||
| 2026-01-23 | 13F | Timber Creek Capital Management LLC | 5.000 | 0,00 | 302 | 8,27 | ||||
| 2026-01-15 | 13F | Uncommon Cents Investing LLC | 7.465 | 4,85 | 451 | 13,64 | ||||
| 2026-02-17 | 13F | Cetera Investment Advisers | 207.917 | 9,40 | 12.552 | 18,46 | ||||
| 2026-01-28 | 13F | CAPROCK Group, Inc. | 39.306 | 11,70 | 2.373 | 20,90 | ||||
| 2026-02-13 | 13F | Entropy Technologies, LP | 12.033 | 726 | ||||||
| 2026-02-03 | 13F | SBI Securities Co., Ltd. | 24.628 | -1,33 | 1.487 | 6,83 | ||||
| 2026-01-20 | 13F | Cohen Capital Management, Inc. | 3.419 | 206 | ||||||
| 2026-01-27 | 13F | Brighton Jones Llc | 0 | -100,00 | 0 | |||||
| 2026-02-19 | 13F | Invesco Ltd. | 11.283 | -9,05 | 681 | -1,45 | ||||
| 2026-02-09 | 13F | Smithfield Trust Co | 40 | 0 | ||||||
| 2026-01-05 | 13F | Rosenberg Matthew Hamilton | 2.406 | 0,00 | 145 | 8,21 | ||||
| 2026-02-05 | 13F | IMG Wealth Management, Inc. | 39 | 0,00 | 2 | 0,00 | ||||
| 2026-02-13 | 13F | Mariner, LLC | 143.219 | -18,96 | 8.652 | -12,20 | ||||
| 2026-02-06 | 13F | Aviance Capital Partners, LLC | 3.991 | -16,03 | 241 | -9,09 | ||||
| 2026-02-03 | 13F | Ethic Inc. | 11.914 | 11,35 | 719 | 20,64 | ||||
| 2025-11-04 | 13F | Raleigh Capital Management Inc. | 0 | -100,00 | 0 | |||||
| 2025-11-12 | 13F | Quantbot Technologies LP | 0 | -100,00 | 0 | |||||
| 2026-02-17 | 13F | Bedell Frazier Investment Counseling, LLC | 12.375 | 3,50 | 747 | 12,16 | ||||
| 2025-11-14 | 13F | BlueCrest Capital Management Ltd | 12.541 | 699 | ||||||
| 2026-02-17 | 13F | Buckland Partners Management Co LLC | 6.000 | 925 | ||||||
| 2026-01-30 | 13F | North Star Investment Management Corp. | 159 | 238,30 | 10 | 350,00 | ||||
| 2026-03-05 | 13F | Bayban | 416 | 25 | ||||||
| 2025-11-14 | 13F | Prelude Capital Management, Llc | 0 | -100,00 | 0 | |||||
| 2026-01-15 | 13F | J. Safra Sarasin Holding AG | 4.000 | 0,00 | 241 | 8,07 | ||||
| 2026-02-17 | 13F | Aquatic Capital Management LLC | 151.226 | 746,97 | 9.130 | 817,49 | ||||
| 2026-02-03 | 13F | Costello Asset Management, INC | 438 | 0,00 | 26 | 8,33 | ||||
| 2026-01-16 | 13F | Empirical Financial Services, LLC d.b.a. Empirical Wealth Management | 12.490 | 66,02 | 754 | 79,95 | ||||
| 2026-02-17 | 13F | Two Sigma Investments, Lp | 5.209 | 314 | ||||||
| 2026-01-28 | 13F | Quaker Wealth Management, LLC | 40 | 2 | ||||||
| 2026-02-13 | 13F | Ieq Capital, Llc | 50.200 | 13,85 | 3.031 | 23,27 | ||||
| 2026-02-12 | 13F | Marex Group plc | 9.975 | 602 | ||||||
| 2026-02-10 | 13F | REAP Financial Group, LLC | 0 | -100,00 | 0 | |||||
| 2025-10-31 | 13F | Whittier Trust Co | 0 | -100,00 | 0 | -100,00 | ||||
| 2026-01-13 | 13F | Olistico Wealth, LLC | 100 | 6 | ||||||
| 2025-09-25 | NP | DFALX - Large Cap International Portfolio - Institutional Class This fund is a listed as child fund of Dimensional Fund Advisors Lp and if that institution has disclosed ownership in this security, then these positions will not be double counted when calculating total shares and total value | 300.265 | 0,00 | 15.214 | 6,56 | ||||
| 2026-02-04 | 13F | Hallmark Capital Management Inc | 96 | 6 | ||||||
| 2026-02-13 | 13F | Glen Eagle Advisors, LLC | 57 | -9,52 | 3 | 0,00 | ||||
| 2026-02-17 | 13F | United Capital Financial Advisers, Llc | 16.246 | 19,36 | 981 | 29,29 | ||||
| 2026-01-28 | 13F | City State Bank | 25 | 0,00 | 2 | 0,00 | ||||
| 2026-01-09 | 13F | Breakwater Capital Group | 7.689 | 8,31 | 464 | 17,47 | ||||
| 2026-02-04 | 13F | Bailard, Inc. | 12.395 | 1,42 | 748 | 9,84 | ||||
| 2026-02-11 | 13F | O'shaughnessy Asset Management, Llc | 207.441 | 12,62 | 12.523 | 21,96 | ||||
| 2026-02-14 | 13F | Torrey Growth & Income Advisors | 3.530 | -30,76 | 213 | -25,00 | ||||
| 2026-02-13 | 13F | Fiduciary Trust Co | 15.568 | 0,40 | 940 | 8,68 | ||||
| 2026-02-17 | 13F | Rexford Capital Inc | 2.586 | 0,00 | 156 | 8,33 | ||||
| 2026-02-13 | 13F | Golden State Wealth Management, LLC | 142 | 0,00 | 9 | 14,29 | ||||
| 2026-01-09 | 13F | 180 Wealth Advisors, Llc | 25.987 | 5,16 | 1.569 | 13,87 | ||||
| 2026-01-09 | 13F | SG Americas Securities, LLC | 143.065 | 442,24 | 9 | 700,00 | ||||
| 2026-01-27 | 13F | Checchi Capital Advisers, LLC | 16.107 | -1,73 | 972 | 6,46 | ||||
| 2026-01-28 | 13F | HB Wealth Management, LLC | 6.200 | 9,99 | 374 | 19,11 | ||||
| 2026-02-11 | 13F | Buckingham Strategic Partners | 0 | -100,00 | 0 | |||||
| 2025-11-04 | 13F | Guerra Advisors Inc | 126 | 7 | ||||||
| 2025-09-29 | NP | GCOW - Pacer Global Cash Cows Dividend ETF | 0 | -100,00 | 0 | -100,00 | ||||
| 2026-02-06 | 13F | Intrust Bank Na | 7.233 | 12,49 | 437 | 21,79 | ||||
| 2026-01-29 | 13F | DecisionPoint Financial, LLC | 100 | 6 | ||||||
| 2026-02-04 | 13F | Naples Global Advisors, Llc | 5.243 | 0,96 | 316 | 9,34 | ||||
| 2026-02-17 | 13F | Graham Capital Management, L.P. | 39.245 | -1,89 | 2.369 | 6,23 | ||||
| 2026-02-11 | 13F | J.w. Cole Advisors, Inc. | 0 | -100,00 | 0 | |||||
| 2026-02-02 | 13F | Nicholas Hoffman & Company, LLC. | 11.552 | 0,38 | 697 | 8,74 | ||||
| 2026-02-12 | 13F | BRYN MAWR TRUST Co | 0 | -100,00 | 0 | |||||
| 2026-02-17 | 13F | Advisory Services Network, LLC | 4.248 | -44,44 | 256 | -39,91 | ||||
| 2026-02-06 | 13F | Cullen/frost Bankers, Inc. | 3.951 | 7,57 | 239 | 16,67 | ||||
| 2026-02-13 | 13F | Quinn Opportunity Partners LLC | 14.300 | 0,00 | 863 | 8,28 | ||||
| 2026-01-27 | 13F | Lorne Steinberg Wealth Management Inc. | 3.260 | 197 | ||||||
| 2026-02-13 | 13F | Flow Traders U.s. Llc | 40.324 | 2 | ||||||
| 2026-02-12 | 13F | Sprott Inc. | 14.521 | -2,11 | 877 | 6,05 | ||||
| 2026-02-17 | 13F | Scopus Asset Management, L.p. | Put | 450.000 | 27.166 | |||||
| 2026-02-06 | 13F | IFP Advisors, Inc | 1.204 | 2,73 | 73 | 10,77 | ||||
| 2026-02-09 | 13F | St. Louis Trust Co | 33.687 | 2.034 | ||||||
| 2026-01-14 | 13F | ORG Partners LLC | 172 | 0,00 | 10 | 11,11 | ||||
| 2026-02-05 | 13F | Thrivent Financial For Lutherans | 3.792 | -8,34 | 0 | |||||
| 2026-01-12 | 13F | Seacrest Wealth Management, Llc | 3.769 | 0,96 | 241 | 14,83 | ||||
| 2026-01-12 | 13F | Byrne Asset Management LLC | 0 | -100,00 | 0 | |||||
| 2025-09-25 | NP | IPAYX - Integrity Dividend Summit Fund Class I | 4.000 | 33,33 | 203 | 42,25 | ||||
| 2026-01-14 | 13F | Petredis Investment Advisors Llc | 64.380 | -1,36 | 3.887 | 6,82 | ||||
| 2026-02-06 | 13F | Callahan Advisors, LLC | 36.168 | -13,60 | 2.183 | -6,43 | ||||
| 2026-02-13 | 13F | Parkside Financial Bank & Trust | 5.528 | 298,85 | 334 | 332,47 | ||||
| 2026-02-04 | 13F | Independent Advisor Alliance | 17.455 | 20,75 | 1.054 | 30,81 | ||||
| 2025-11-14 | 13F | Squarepoint Ops LLC | 0 | -100,00 | 0 | -100,00 | ||||
| 2026-01-08 | 13F | Versant Capital Management, Inc | 13.943 | 10,76 | 842 | 19,97 | ||||
| 2026-02-11 | 13F | Manchester Capital Management LLC | 1.862 | 112 | ||||||
| 2026-02-13 | 13F | Recurrent Investment Advisors LLC | 26.071 | -4,80 | 1.574 | 3,08 | ||||
| 2026-02-13 | 13F | Cozad Asset Management Inc | 3.330 | 201 | ||||||
| 2026-02-04 | 13F | Hikari Power Ltd | 147.400 | 0,00 | 9 | 0,00 | ||||
| 2026-02-05 | 13F | Baader Bank INC | 14.668 | 24,31 | 882 | 34,50 | ||||
| 2026-02-13 | 13F | Aptus Capital Advisors, LLC | 12.688 | -3,71 | 766 | 4,22 | ||||
| 2026-01-21 | 13F | Prime Capital Investment Advisors, LLC | 6.160 | 0,21 | 372 | 8,48 | ||||
| 2026-02-06 | 13F | GPS Wealth Strategies Group, LLC | 85 | -73,68 | 5 | -72,22 | ||||
| 2026-01-27 | 13F | First Horizon Corp | 2.293 | -24,45 | 138 | -18,34 | ||||
| 2026-02-06 | 13F | Adell Harriman & Carpenter Inc | 3.669 | 222 | ||||||
| 2026-02-12 | 13F | Skopos Labs, Inc. | 89.504 | 541,28 | 5.405 | 697,20 | ||||
| 2026-01-29 | 13F | Viewpoint Investment Partners Corp | 5.100 | -77,55 | 308 | -71,89 | ||||
| 2026-02-11 | 13F | Prestige Wealth Management Group LLC | 100 | 0,00 | 6 | 20,00 | ||||
| 2026-02-17 | 13F | Harding Loevner Lp | 70.086 | -99,10 | 4.231 | -99,03 | ||||
| 2026-02-17 | 13F | Wiley Bros.-aintree Capital, Llc | 47.666 | 24,98 | 2.879 | 35,37 | ||||
| 2026-01-29 | 13F | Integras Partners LLC | 57.132 | -5,09 | 3.449 | 2,80 | ||||
| 2026-02-11 | 13F | Simplex Trading, Llc | 8.070 | 25,64 | 487 | |||||
| 2026-02-11 | 13F | Simplex Trading, Llc | Call | 169.200 | 57,10 | 10.215 | 170.133,33 | |||
| 2026-02-11 | 13F | Simplex Trading, Llc | Put | 150.700 | -3,71 | 9.098 | 113.612,50 | |||
| 2026-02-17 | 13F | Millennium Management Llc | 0 | -100,00 | 0 | |||||
| 2026-02-04 | 13F | LRI Investments, LLC | 2.522 | -5,44 | 152 | 2,70 | ||||
| 2026-02-17 | 13F | TIG Advisors, LLC | Put | 0 | -100,00 | 0 | ||||
| 2026-02-18 | 13F | Vident Advisory, LLC | 74.446 | -0,60 | 4.494 | 7,64 | ||||
| 2026-02-02 | 13F | Kornitzer Capital Management Inc /ks | 163.930 | -3,72 | 9.896 | 4,26 | ||||
| 2026-02-06 | 13F | Cadence Wealth Management LLC | 16.164 | 2,06 | 976 | 10,54 | ||||
| 2025-11-13 | 13F | Glenmede Investment Management, LP | 8.133 | -14,19 | 453 | -0,44 | ||||
| 2026-01-30 | 13F | Sage Rhino Capital Llc | 11.422 | 0,94 | 690 | 9,37 | ||||
| 2026-01-21 | 13F | Touchstone Capital, Inc. | 0 | -100,00 | 0 | |||||
| 2026-01-23 | 13F | Eagle Bay Advisors LLC | 650 | 39 | ||||||
| 2026-02-13 | 13F | Atlas Capital Advisors Llc | 10.370 | 568,17 | 626 | 745,95 | ||||
| 2026-02-10 | 13F | Hazlett, Burt & Watson, Inc. | 198 | 482,35 | 0 | |||||
| 2026-02-10 | 13F | State of Wyoming | 2.040 | -7,69 | 123 | 0,00 | ||||
| 2026-01-23 | 13F | Sumitomo Mitsui Trust Holdings, Inc. | 91.178 | -4,01 | 5.504 | 3,95 | ||||
| 2026-02-05 | 13F | Passumpsic Savings Bank | 7.458 | 53,05 | 450 | 89,87 | ||||
| 2026-02-06 | 13F | Global Retirement Partners, LLC | 8.762 | 464,20 | 529 | 513,95 | ||||
| 2025-09-26 | NP | MSTFX - Morningstar International Equity Fund | 77.933 | -1,25 | 3.949 | 5,22 | ||||
| 2026-02-13 | 13F | Colony Group, LLC | 26.858 | 36,79 | 1.621 | 38,31 | ||||
| 2025-10-22 | 13F | Hennion & Walsh Asset Management, Inc. | 0 | -100,00 | 0 | |||||
| 2026-02-04 | 13F | Tls Advisors Llc | 4.460 | 0 | ||||||
| 2026-01-07 | 13F | Riversedge Advisors, Llc | 3.771 | 228 | ||||||
| 2026-02-24 | 13F | Bell Investment Advisors, Inc | 1.212 | 25,86 | 73 | 37,74 | ||||
| 2026-01-07 | 13F | Hilltop National Bank | 675 | 0,00 | 41 | 8,11 | ||||
| 2026-02-11 | 13F | Twin Tree Management, LP | Call | 146.400 | 460,92 | 8.838 | 507,42 | |||
| 2026-01-27 | 13F | Financial Management Professionals, Inc. | 6.437 | 0,30 | 389 | 8,68 | ||||
| 2026-02-11 | 13F | Twin Tree Management, LP | Put | 5.600 | 338 | |||||
| 2026-01-12 | 13F | Kempner Capital Management Inc. | 7.408 | -9,13 | 438 | -3,52 | ||||
| 2026-02-12 | 13F | Brown Brothers Harriman & Co | 929 | 9,68 | 56 | 19,15 | ||||
| 2026-02-12 | 13F | Steward Partners Investment Advisory, Llc | 7.863 | 6,70 | 475 | 15,61 | ||||
| 2026-02-05 | 13F | Simmons Bank | 43.817 | 5,18 | 2.645 | 13,91 | ||||
| 2026-02-17 | 13F | Aqr Capital Management Llc | 181.750 | 29,23 | 10.972 | 39,95 | ||||
| 2026-02-06 | 13F | New Millennium Group LLC | 2.736 | 151,47 | 165 | 175,00 | ||||
| 2025-10-27 | 13F | Baugh & Associates, LLC | 0 | -100,00 | 0 | |||||
| 2026-01-30 | 13F | Us Bancorp \de\ | 176.695 | -24,02 | 10.667 | -17,72 | ||||
| 2026-02-06 | 13F | Nano Cap New Millennium Growth Fund L P | 10.750 | 649 | ||||||
| 2026-02-13 | 13F | National Bank Of Canada /fi/ | 111.579 | 0,27 | 6.734 | 8,58 | ||||
| 2026-01-14 | 13F | Wolff Wiese Magana Llc | 0 | -100,00 | 0 | |||||
| 2026-01-30 | 13F | American Capital Advisory, LLC | 36 | -5,26 | 2 | 0,00 | ||||
| 2026-02-03 | 13F | Rnc Capital Management Llc | 9.331 | -1,53 | 563 | 6,63 | ||||
| 2026-02-17 | 13F | Tudor Investment Corp Et Al | Put | 13.800 | -35,51 | 833 | -30,18 | |||
| 2026-01-21 | 13F | Westfuller Advisors, LLC | 49 | -44,94 | 3 | -50,00 | ||||
| 2026-02-17 | 13F | Tudor Investment Corp Et Al | 523.099 | 31.579 | ||||||
| 2026-02-19 | 13F | Atomi Financial Group, Inc. | 31.493 | 18,81 | 1.901 | 28,71 | ||||
| 2026-01-16 | 13F | Bangor Savings Bank | 447 | 0,00 | 27 | 8,33 | ||||
| 2026-02-12 | 13F | Scotia Capital Inc. | 72.241 | -2,43 | 4.361 | 5,67 | ||||
| 2025-11-12 | 13F | Riverview Capital Advisers, LLC | 0 | -100,00 | 0 | -100,00 | ||||
| 2026-01-09 | 13F | Murphy, Middleton, Hinkle & Parker, Inc. | 8.115 | 793 | ||||||
| 2026-01-20 | 13F | Wall Street Access Asset Management, LLC | 6.542 | 0,00 | 395 | 8,24 | ||||
| 2026-02-03 | 13F | Sequoia Financial Advisors, LLC | 49.391 | 0,21 | 2.982 | 8,52 | ||||
| 2026-02-17 | 13F | Cresset Asset Management, LLC | 0 | -100,00 | 0 | -100,00 | ||||
| 2026-02-17 | 13F | Cresset Asset Management, LLC | Put | 0 | -100,00 | 0 | -100,00 | |||
| 2026-02-12 | 13F | Mindset Wealth Management, Llc | 0 | -100,00 | 0 | |||||
| 2026-02-13 | 13F | Natixis | 1.274 | 32,85 | 77 | 43,40 | ||||
| 2026-01-27 | 13F | TD Waterhouse Canada Inc. | 29.718 | 14,21 | 1.793 | 23,66 | ||||
| 2025-09-25 | NP | DFA INVESTMENT DIMENSIONS GROUP INC - International Vector Equity Portfolio Shares | 13.221 | 0,00 | 670 | 6,53 | ||||
| 2026-02-12 | 13F | Earnest Partners Llc | 97.456 | 9,89 | 5.883 | 18,99 | ||||
| 2026-02-12 | 13F | Bank of Jackson Hole Trust | 70 | 0,00 | 4 | 33,33 | ||||
| 2026-02-10 | 13F | Nomura Asset Management Co Ltd | 0 | 0 | ||||||
| 2026-01-28 | 13F | WPG Advisers, LLC | 8 | 0,00 | 0 | |||||
| 2026-02-12 | 13F | Campbell & CO Investment Adviser LLC | 232.558 | 14.040 | ||||||
| 2026-02-13 | 13F | Allianz Se | 0 | -100,00 | 0 | |||||
| 2026-01-15 | 13F | Shrier Wealth Management, Llc | 43.558 | 2.630 | ||||||
| 2026-02-17 | 13F | Driehaus Capital Management Llc | 0 | -100,00 | 0 | |||||
| 2026-02-10 | 13F | Carnegie Lake Advisors LLC | 5.800 | 0,00 | 350 | 8,36 | ||||
| 2025-11-13 | 13F | Bridgewater Associates, LP | 0 | -100,00 | 0 | |||||
| 2026-02-17 | 13F | Two Sigma Securities, Llc | 4.367 | 264 | ||||||
| 2026-02-13 | 13F | State Street Corp | 9.884 | 0,00 | 597 | 8,17 | ||||
| 2026-02-17 | 13F | CWM Advisors, LLC | 4.985 | 1,38 | 301 | 9,49 | ||||
| 2026-01-16 | 13F | Augustine Asset Management Inc | 53.029 | 3.201 | ||||||
| 2026-02-02 | 13F | Horizon Investments, LLC | 0 | -100,00 | 0 | |||||
| 2026-01-21 | 13F | Stone House Investment Management, LLC | 106 | 10,42 | 6 | 20,00 | ||||
| 2026-02-12 | 13F | Wealthspire Advisors, LLC | 3.966 | 135,65 | 239 | 156,99 | ||||
| 2026-01-22 | 13F | Harwood Advisory Group, LLC | 0 | -100,00 | 0 | -100,00 | ||||
| 2025-09-26 | 13F | Capital A Wealth Management, LLC | 0 | -100,00 | 0 | -100,00 | ||||
| 2026-01-15 | 13F | Alpine Bank Wealth Management | 4.000 | 0,00 | 241 | 8,07 | ||||
| 2026-01-15 | 13F | Frank, Rimerman Advisors LLC | 37.148 | 0,73 | 2.243 | 9,05 | ||||
| 2026-01-23 | 13F | First PREMIER Bank | 1.296 | 0,00 | 0 | |||||
| 2026-02-03 | 13F | Strengthening Families & Communities, LLC | 226 | -34,49 | 14 | -31,58 | ||||
| 2026-01-15 | 13F | Range Financial Group LLC | 9.710 | 3,96 | 586 | 12,69 | ||||
| 2026-01-29 | 13F | Anchyra Partners Llc | 5.464 | 330 | ||||||
| 2026-01-23 | 13F | U.S. Capital Wealth Advisors, LLC | 15.005 | -12,59 | 906 | -5,43 | ||||
| 2026-02-10 | 13F | Goldman Sachs Group Inc | 6.986.149 | -32,80 | 421.754 | -27,23 | ||||
| 2026-02-13 | 13F | Evelyn Partners Investment Management Services Ltd | 155 | 0,00 | 9 | 12,50 | ||||
| 2026-02-17 | 13F | Wellington Management Group Llp | 3.637.463 | -21,80 | 219.594 | -15,32 | ||||
| 2026-02-10 | 13F | Goldman Sachs Group Inc | Call | 145.200 | 161,62 | 8.766 | 183,29 | |||
| 2026-02-11 | 13F | Nikko Asset Management Americas, Inc. | 91.178 | 5.504 | ||||||
| 2026-02-10 | 13F | Goldman Sachs Group Inc | Put | 153.000 | 175,68 | 9.237 | 198,51 | |||
| 2025-11-04 | 13F | IMC-Chicago, LLC | 0 | -100,00 | 0 | -100,00 | ||||
| 2026-02-04 | 13F | Boyd Watterson Asset Management Llc/oh | 297 | 0,00 | 18 | 6,25 | ||||
| 2026-02-12 | 13F | Advisors Asset Management, Inc. | 32.702 | -8,16 | 1.974 | -0,55 | ||||
| 2026-02-17 | 13F | FIL Ltd | 0 | -100,00 | 0 | |||||
| 2026-02-05 | 13F | Pacific Heights Asset Management Llc | 425.000 | 21,43 | 25.657 | 31,49 | ||||
| 2026-02-11 | 13F | Greykasell Wealth Strategies, Inc. | 120 | 7 | ||||||
| 2026-02-02 | 13F | Sawyer & Company, Inc | 450 | -68,97 | 27 | |||||
| 2026-02-12 | 13F | Cibc World Markets Corp | Call | 0 | -100,00 | 0 | -100,00 | |||
| 2025-10-20 | 13F | HighMark Wealth Management LLC | 0 | -100,00 | 0 | |||||
| 2026-02-05 | 13F | Burford Brothers, Inc. | 12.077 | -0,25 | 729 | 8,16 | ||||
| 2026-01-22 | 13F | Willis Investment Counsel | 474.843 | -5,82 | 28.666 | 1,98 | ||||
| 2026-02-13 | 13F | VPR Management LLC | 20.000 | 0,00 | 1.207 | 8,25 | ||||
| 2026-02-11 | 13F | Janney Montgomery Scott LLC | 233.056 | 743,58 | 14 | 1.300,00 | ||||
| 2026-02-11 | 13F | Cerity Partners LLC | 111.504 | -6,02 | 6.731 | 1,77 | ||||
| 2026-02-13 | 13F | Squarepoint Ops LLC | Put | 225.000 | -10,61 | 13.583 | -3,20 | |||
| 2026-01-28 | 13F | Financial Perspectives, Inc | 365 | 0,00 | 22 | 10,00 | ||||
| 2026-02-10 | 13F | Bruce G. Allen Investments, LLC | 1.175 | -32,47 | 71 | -27,84 | ||||
| 2026-02-13 | 13F | Squarepoint Ops LLC | Call | 247.000 | -0,12 | 14.911 | 8,16 | |||
| 2026-02-03 | 13F | Canal Insurance CO | 60.000 | 0,00 | 4 | 0,00 | ||||
| 2025-11-14 | 13F | Capstone Investment Advisors, Llc | Call | 14.700 | 820 | |||||
| 2026-01-23 | 13F | Stephenson National Bank & Trust | 0 | -100,00 | 0 | |||||
| 2026-02-03 | 13F | Manning & Napier Advisors Llc | 126.696 | -2,55 | 7.718 | 5,60 | ||||
| 2026-01-12 | 13F | Viking Fund Management Llc | 5.000 | -50,00 | 302 | -45,96 | ||||
| 2025-10-21 | 13F | Optimum Investment Advisors | 1.150 | 0,00 | 64 | 16,36 | ||||
| 2025-11-14 | 13F | Capstone Investment Advisors, Llc | Put | 6.000 | 334 | |||||
| 2026-01-12 | 13F | Uhlmann Price Securities, Llc | 3.508 | 212 | ||||||
| 2026-02-17 | 13F | Northern Trust Corp | 2.273.182 | -6,97 | 137.232 | 0,74 | ||||
| 2025-11-14 | 13F | Axa S.a. | 0 | -100,00 | 0 | |||||
| 2026-02-17 | 13F | Millennium Management Llc | Put | 14.000 | -97,47 | 845 | -97,26 | |||
| 2026-02-09 | 13F | Choate Investment Advisors | 7.228 | -6,95 | 436 | 0,69 | ||||
| 2026-02-17 | 13F | Millennium Management Llc | Call | 57.400 | 229,89 | 3.465 | 257,22 | |||
| 2025-11-17 | 13F | FSA Wealth Management LLC | 250 | 0,00 | 14 | 8,33 | ||||
| 2026-01-13 | 13F | First Financial Corp /in/ | 8.988 | -0,66 | 543 | 7,54 | ||||
| 2026-02-11 | 13F | Syon Capital Llc | 43.124 | 2.603 | ||||||
| 2026-02-05 | 13F | Elyxium Wealth, LLC | 78 | 5 | ||||||
| 2026-02-13 | 13F | Palisade Asset Management, LLC | 0 | -100,00 | 0 | |||||
| 2026-01-23 | 13F | Successful Portfolios LLC | 6.122 | 17,75 | 378 | 30,45 | ||||
| 2026-02-12 | 13F | DRW Securities, LLC | 6.081 | 367 | ||||||
| 2026-01-15 | 13F | Nisa Investment Advisors, Llc | 1.628 | 16,29 | 98 | 25,64 | ||||
| 2026-01-23 | 13F | Strong Tower Advisory Services | 68.113 | 3,71 | 4.112 | 12,29 | ||||
| 2026-02-03 | 13F | We Are One Seven, LLC | 7.749 | -4,30 | 468 | 3,55 | ||||
| 2026-01-28 | 13F | Hoey Investments, Inc | 1.000 | 0,00 | 60 | 9,09 | ||||
| 2025-09-25 | NP | DFAX - Dimensional World ex U.S. Core Equity 2 ETF | 227.380 | 0,00 | 11.521 | 6,57 | ||||
| 2026-01-21 | 13F | Jackson Square Capital, Llc | 5.639 | 340 | ||||||
| 2026-01-28 | 13F | U S Global Investors Inc | 3.500 | 0,00 | 211 | 8,21 | ||||
| 2026-01-07 | 13F | Harbor Investment Advisory, Llc | 52 | 3 | ||||||
| 2026-02-12 | 13F | Tocqueville Asset Management L.p. | 25.185 | 0,14 | 1.520 | 8,42 | ||||
| 2026-02-18 | 13F | Beacon Pointe Advisors, LLC | 12.148 | -27,67 | 733 | -21,69 | ||||
| 2026-01-08 | 13F | Wedmont Private Capital | 7.659 | 11,29 | 489 | 29,02 | ||||
| 2026-02-17 | 13F | Signature Equity Partners, LLC | 165 | 10 | ||||||
| 2026-02-06 | 13F | Hartford Funds Management Co LLC | 12.730 | -0,83 | 769 | 7,41 | ||||
| 2025-11-14 | 13F | Hrt Financial Lp | 0 | -100,00 | 0 | |||||
| 2026-02-06 | 13F | Addison Advisors LLC | 751 | 31,75 | 45 | 45,16 | ||||
| 2026-02-06 | 13F | Leonteq Securities AG | 3.346 | -50,49 | 202 | -46,54 | ||||
| 2026-02-13 | 13F | SRS Capital Advisors, Inc. | 4.016 | 8,92 | 242 | 18,05 | ||||
| 2026-01-27 | 13F | WealthCollab, LLC | 126 | 50,00 | 8 | 75,00 | ||||
| 2026-02-11 | 13F | IMA Wealth, Inc. | 95 | 6 | ||||||
| 2026-01-14 | 13F | Eastern Bank | 425 | 0,00 | 26 | 8,70 | ||||
| 2026-02-02 | 13F | Breakwater Investment Management | 160 | 0,00 | 10 | 12,50 | ||||
| 2026-02-13 | 13F | Kilter Group LLC | 26 | 116,67 | 2 | |||||
| 2026-02-03 | 13F | Anfield Capital Management, LLC | 1.931 | 0,00 | 117 | 8,41 | ||||
| 2026-02-24 | 13F | MidFirst Bank | 33.096 | 1.987 | ||||||
| 2026-01-21 | 13F | Country Trust Bank | 150 | 0,00 | 9 | 12,50 | ||||
| 2026-01-21 | 13F/A | Euro Pacific Asset Management, LLC | 58.343 | 0,02 | 3 | 0,00 | ||||
| 2026-01-15 | 13F | Cohen Investment Advisors LLC | 64.849 | 1,68 | 3.915 | 10,10 | ||||
| 2026-01-21 | 13F | Greenleaf Trust | 20.447 | 0,18 | 1.234 | 8,53 | ||||
| 2026-02-11 | 13F | Vermillion Wealth Management, Inc. | 1.460 | 42,58 | 88 | 54,39 | ||||
| 2026-02-10 | 13F | Welch & Forbes Llc | 3.619 | -29,30 | 218 | -23,51 | ||||
| 2025-10-24 | 13F | Bayforest Capital Ltd | 0 | -100,00 | 0 | -100,00 | ||||
| 2026-01-26 | 13F | PFG Investments, LLC | 5.147 | 0,00 | 311 | 8,39 | ||||
| 2026-01-08 | 13F | Gryphon Financial Partners LLC | 17.595 | 72,15 | 1.062 | 86,64 | ||||
| 2026-01-29 | 13F | Aprio Wealth Management, LLC | 7.466 | 32,45 | 451 | 43,31 | ||||
| 2026-01-05 | 13F | Coastline Trust Co | 0 | -100,00 | 0 | |||||
| 2025-11-03 | 13F | Stonegate Investment Group, LLC | 49.897 | 2,23 | 2.782 | 18,49 | ||||
| 2026-03-03 | 13F/A | Caitong International Asset Management Co., Ltd | 6.974 | 136,41 | 421 | 156,71 | ||||
| 2026-01-16 | 13F | Ronald Blue Trust, Inc. | 11.523 | -9,39 | 696 | -1,84 | ||||
| 2026-02-18 | 13F | GWM Advisors LLC | 0 | -100,00 | 0 | |||||
| 2026-02-13 | 13F | Ingalls & Snyder Llc | 51.219 | -11,16 | 3 | 0,00 | ||||
| 2026-02-17 | 13F | Ameriprise Financial Inc | 692.562 | 76,38 | 41.801 | 90,98 | ||||
| 2026-02-17 | 13F | Capital Fund Management S.a. | 100.524 | 6.069 | ||||||
| 2026-01-15 | 13F | Gleason Group, Inc. | 14.747 | 0,00 | 890 | 8,27 | ||||
| 2026-02-13 | 13F | OpenArc Corporate Advisory, LLC | 5.374 | 324 | ||||||
| 2026-01-22 | 13F | Accordant Advisory Group Inc | 3 | 0 | ||||||
| 2026-02-05 | 13F | Sapient Capital Llc | 3.620 | 221 | ||||||
| 2026-01-29 | 13F | Quent Capital, LLC | 27 | 0,00 | 2 | 0,00 | ||||
| 2026-02-06 | 13F | Envestnet Portfolio Solutions, Inc. | 5.602 | -1,55 | 338 | 6,62 | ||||
| 2026-02-09 | 13F | Coldstream Capital Management Inc | 6.885 | 6,73 | 416 | 15,60 | ||||
| 2026-02-09 | 13F | Delta Asset Management Llc/tn | 1.733 | 0,00 | 105 | 8,33 | ||||
| 2026-02-04 | 13F | Raelipskie Partnership | 17.527 | -6,41 | 1.058 | 1,34 | ||||
| 2025-11-14 | 13F | D. E. Shaw & Co., Inc. | Call | 0 | -100,00 | 0 | -100,00 | |||
| 2026-01-20 | 13F | YANKCOM Partnership | 301 | 238,20 | 18 | 350,00 | ||||
| 2026-02-12 | 13F | Stamos Capital Partners, L.p. | 9.820 | 9,68 | 593 | 18,64 | ||||
| 2026-01-23 | 13F | Assetmark, Inc | 2.658 | 14,18 | 160 | 24,03 |