Grundlæggende statistik
| Institutionelle aktier (lange) | 419.593.913 - 87,75% (ex 13D/G) - change of -74,38MM shares -15,06% MRQ |
| Institutionel værdi (lang) | $ 30.083.021 USD ($1000) |
Institutionelt ejerskab og aktionærer
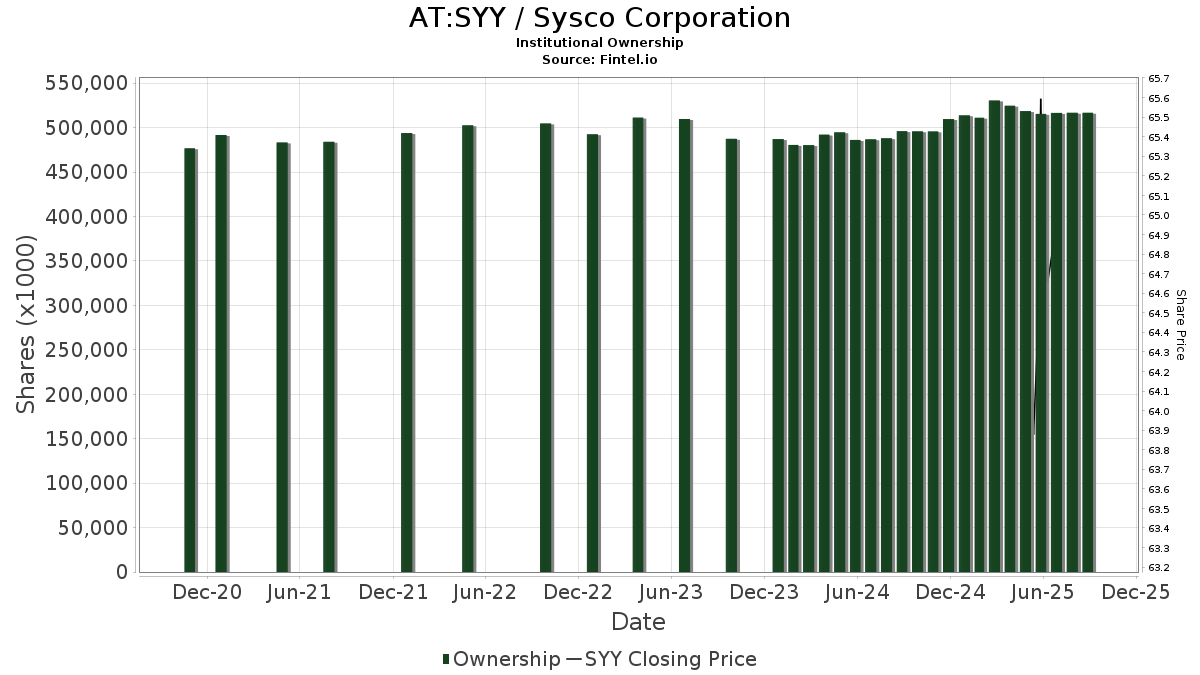
Sysco Corporation (AT:SYY) har 1578 institutionelle ejere og aktionærer, der har indsendt 13D/G- eller 13F-formularer til Securities Exchange Commission (SEC). Disse institutioner har i alt 419,593,913 aktier. Største aktionærer omfatter Vanguard Group Inc, BlackRock, Inc., State Street Corp, Capital Research Global Investors, Invesco Ltd., Geode Capital Management, Llc, Boston Partners, Harris Associates L P, Norges Bank, and Morgan Stanley .
Sysco Corporation (WBAG:SYY) institutionel ejerskabsstruktur viser aktuelle positioner i virksomheden efter institutioner og fonde, samt seneste ændringer i positionsstørrelse. Større aktionærer kan omfatte individuelle investorer, investeringsforeninger, hedgefonde eller institutioner. Skema 13D angiver, at investoren besidder (eller besidder) mere end 5 % af virksomheden og har til hensigt (eller har til hensigt at) aktivt at forfølge en ændring i forretningsstrategi. Skema 13G indikerer en passiv investering på over 5%.
The share price as of April 24, 2026 is 65,24 / share. Previously, on May 9, 2025, the share price was 63,06 / share. This represents an increase of 3,46% over that period.
Fondens stemningsscore
Fund Sentiment Score (fka Ownership Accumulation Score) finder de aktier, der bliver mest købt af fonde. Det er resultatet af en sofistikeret, multi-faktor kvantitativ model, der identificerer virksomheder med de højeste niveauer af institutionel akkumulering. Scoringsmodellen bruger en kombination af den samlede stigning i oplyste ejere, ændringerne i porteføljeallokeringer i disse ejere og andre målinger. Tallet går fra 0 til 100, hvor højere tal indikerer et højere niveau af akkumulering for sine jævnaldrende, og 50 er gennemsnittet.
Opdateringsfrekvens: Dagligt
Se Ownership Explorer, som giver en liste over højest rangerende virksomheder.
AI+ Ask Fintel’s AI assistant about Sysco Corporation.
Select a question to share a public post with an AI-crafted answer.
Thinking of good questions…
13F og NPORT arkivering
Detaljer om 13F-arkivering er gratis. Detaljer om NP-ansøgninger kræver et premium-medlemskab. Grønne rækker angiver nye positioner. Røde rækker angiver lukkede positioner. Klik på linket ikon for at se den fulde transaktionshistorik.
Opgrader
for at låse premium-data op og eksportere til Excel ![]() .
.
Important Note
In an effort to reduce load times for our mobile users, we are testing some ways to deliver lighter pages.
In this first test, we will deliver only the most recent 750 transactions (out of 1872 for this stock). If you are interested in loading *all* the transactions for this company, click the "load all" button below. This is just a test and if you don't like it, please let us know by submitting some gentle feedback via the link at the bottom of this page.
Load All| Fil dato | Kilde | Investor | Type | Gennemsnitlig pris (Øst) |
Aktier | Δ Aktier (%) |
Rapporteret Værdi ($1000) |
Δ Værdi (%) |
Port Alloc (%) |
|
|---|---|---|---|---|---|---|---|---|---|---|
| 2026-02-11 | 13F | WESCAP Management Group, Inc. | 10.421 | -23,21 | 768 | -31,33 | ||||
| 2026-01-30 | 13F | Turning Point Benefit Group, Inc. | 44 | 388,89 | 3 | |||||
| 2026-04-15 | 13F | Radnor Capital Management, LLC | 4.795 | 0,00 | 342 | -3,12 | ||||
| 2026-04-23 | 13F | Sawyer & Company, Inc | 43.953 | -5,83 | 3.135 | -8,84 | ||||
| 2026-02-12 | 13F | Federation des caisses Desjardins du Quebec | 207.727 | 6,27 | 15.307 | -4,90 | ||||
| 2026-04-17 | 13F | Brown, Lisle/cummings, Inc. | 25.433 | -0,39 | 1.814 | -3,56 | ||||
| 2026-02-17 | 13F | Lombard Odier Asset Management (Europe) Ltd | 148.429 | -46,18 | 10.938 | -56,04 | ||||
| 2026-04-06 | 13F | Trust Co of the South | 3.029 | 0,00 | 216 | -3,14 | ||||
| 2026-01-07 | 13F | New England Research & Management, Inc. | 36.474 | -0,21 | 2.688 | -10,70 | ||||
| 2026-01-23 | 13F | Inlight Wealth Management, LLC | 68 | 0,00 | 5 | 0,00 | ||||
| 2026-01-20 | 13F | Red Door Wealth Management, LLC | 0 | -100,00 | 0 | |||||
| 2026-04-15 | 13F | Ai Financial Services Llc | 9.408 | 671 | ||||||
| 2026-02-17 | 13F | Oxford Asset Management Llp | 6.028 | 444 | ||||||
| 2026-04-22 | 13F | Aspire Private Capital, LLC | 12.164 | 0,41 | 868 | -2,80 | ||||
| 2026-01-23 | 13F | Smith, Moore & Co. | 11.505 | -5,22 | 848 | -15,22 | ||||
| 2026-01-30 | 13F | American Capital Advisory, LLC | 14 | 0,00 | 1 | 0,00 | ||||
| 2026-04-13 | 13F | Wedge Capital Management L L P/nc | 0 | -100,00 | 0 | |||||
| 2026-02-17 | 13F | Aquatic Capital Management LLC | 18.724 | 1.380 | ||||||
| 2026-01-29 | 13F | Camelot Portfolios, LLC | 2.549 | 0,00 | 188 | -10,53 | ||||
| 2026-02-17 | 13F | Sagewood Asset Management LP | 2.987 | 220 | ||||||
| 2026-01-26 | 13F | Whittier Trust Co | 7.484 | 0,13 | 546 | -10,93 | ||||
| 2026-01-29 | 13F | Northern Oak Wealth Management Inc | 12.600 | 0,00 | 928 | -10,51 | ||||
| 2026-02-13 | 13F | Treasurer of the State of North Carolina | 200.819 | -7,94 | 15 | -17,65 | ||||
| 2026-02-04 | 13F | Wsfs Capital Management, Llc | 90.543 | -6,52 | 6.672 | -16,34 | ||||
| 2026-02-12 | 13F | JPL Wealth Management, LLC | 0 | -100,00 | 0 | |||||
| 2026-04-21 | 13F | Fruth Investment Management | 37.844 | -2,29 | 3 | 0,00 | ||||
| 2026-02-10 | 13F | EagleClaw Capital Managment, LLC | 44.485 | 0,34 | 3.278 | -10,19 | ||||
| 2026-02-06 | 13F | Bare Financial Services, Inc | 34 | -30,61 | 3 | -50,00 | ||||
| 2026-04-23 | 13F | SevenBridge Financial Group, LLC | 4.518 | -3,63 | 341 | -3,67 | ||||
| 2026-02-10 | 13F | IAG Wealth Partners, LLC | 100 | 0,00 | 7 | -12,50 | ||||
| 2026-04-24 | 13F | Wagner Wealth Management, Llc | 3.401 | 243 | ||||||
| 2026-02-04 | 13F | Community Bank, N.A. | 1.765 | 0,00 | 130 | -10,34 | ||||
| 2026-02-13 | 13F | First Trust Advisors Lp | 710.297 | 196,30 | 52.342 | 165,18 | ||||
| 2026-02-17 | 13F | Balyasny Asset Management Llc | 557.307 | 42,40 | 41.068 | 27,44 | ||||
| 2026-02-17 | 13F | Perbak Capital Partners LLP | 0 | -100,00 | 0 | |||||
| 2026-02-17 | 13F | Atom Investors LP | 48.093 | -54,89 | 3.544 | -59,63 | ||||
| 2026-02-10 | 13F | Daiwa Securities Group Inc. | 105.414 | 0,63 | 8 | -12,50 | ||||
| 2026-02-26 | 13F | Anchor Investment Management, LLC | 2.832 | -0,70 | 209 | -11,11 | ||||
| 2026-01-15 | 13F | Nisa Investment Advisors, Llc | 138.060 | -13,58 | 10.174 | -22,66 | ||||
| 2026-04-14 | 13F | West Branch Capital LLC | 700 | -5,79 | 50 | -9,26 | ||||
| 2026-04-23 | 13F | Impact Partnership Wealth, LLC | 0 | -100,00 | 0 | |||||
| 2026-02-10 | 13F | Holderness Investments Co | 3.033 | 0,00 | 224 | -10,44 | ||||
| 2026-02-03 | 13F | Yacktman Asset Management Lp | 1.223.605 | -2,33 | 90.167 | -12,59 | ||||
| 2026-02-09 | 13F | Carl P. Sherr & Co., LLC | 3.101 | -0,93 | 260 | 0,78 | ||||
| 2026-02-11 | 13F | Waddell & Associates, Llc | 6.079 | 16,48 | 448 | 4,20 | ||||
| 2026-02-17 | 13F | Polar Capital Holdings Plc | 223.714 | -0,78 | 16.485 | -11,20 | ||||
| 2026-02-11 | 13F | Brandywine Global Investment Management, LLC | 813.340 | 1,57 | 59.935 | -9,10 | ||||
| 2025-11-13 | 13F | Glenmede Investment Management, LP | 173.657 | -1,31 | 14.299 | 7,29 | ||||
| 2026-04-13 | 13F | Bank of New Hampshire | 1.165 | -11,41 | 83 | -13,54 | ||||
| 2026-02-17 | 13F | Stokes Family Office, LLC | 15.146 | 0,13 | 1.116 | -10,36 | ||||
| 2026-02-10 | 13F | Sivia Capital Partners, LLC | 8.166 | 602 | ||||||
| 2026-02-11 | 13F | Clearbridge Investments, LLC | 8.165 | -0,49 | 602 | -10,96 | ||||
| 2026-01-12 | 13F | Heartwood Wealth Advisors LLC | 0 | -100,00 | 0 | |||||
| 2026-02-17 | 13F | Blue Chip Partners, Inc. | 0 | -100,00 | 0 | |||||
| 2026-04-17 | 13F | Clear Trail Advisors, LLC | 11.057 | 789 | ||||||
| 2026-02-12 | 13F | Wealthspire Advisors, LLC | 5.566 | 1.319,90 | 410 | 1.181,25 | ||||
| 2026-02-13 | 13F | Korea Investment CORP | 409.444 | 17,11 | 30.172 | 4,80 | ||||
| 2026-01-30 | 13F | R Squared Ltd | 15.238 | 1.123 | ||||||
| 2026-02-10 | 13F | Linscomb & Williams, Inc. | 0 | -100,00 | 0 | |||||
| 2026-04-24 | 13F | Mitchell & Pahl Private Wealth, Llc | 26.050 | 4,81 | 1.858 | 1,47 | ||||
| 2026-02-11 | 13F | Manchester Capital Management LLC | 3.301 | 243 | ||||||
| 2026-02-13 | 13F | 71 West Capital Partners | 3.774 | 278 | ||||||
| 2026-04-14 | 13F | Drive Wealth Management, Llc | 11.063 | -17,16 | 789 | -19,82 | ||||
| 2026-02-13 | 13F | OpenArc Corporate Advisory, LLC | 2.881 | 212 | ||||||
| 2026-04-14 | 13F | Papp L Roy & Associates | 23.960 | -0,71 | 1.709 | -3,88 | ||||
| 2026-02-09 | 13F | Mediolanum International Funds Ltd | 357.980 | 24,02 | 26.562 | 12,45 | ||||
| 2026-01-30 | 13F | Torren Management, LLC | 372 | 27 | ||||||
| 2026-01-26 | 13F | AE Wealth Management LLC | 82.395 | 3,53 | 6.072 | -7,36 | ||||
| 2026-01-26 | 13F | Riverview Trust Co | 2.543 | 0,00 | 187 | -10,53 | ||||
| 2026-02-09 | 13F | Ghe, Llc | 13.018 | 0,00 | 959 | -10,46 | ||||
| 2026-02-17 | 13F | Aqr Capital Management Llc | 1.193.651 | 183,16 | 87.960 | 154,37 | ||||
| 2026-02-11 | 13F | Clifford Swan Investment Counsel Llc | 273.714 | -0,90 | 20.170 | -11,31 | ||||
| 2025-10-31 | 13F | Y-Intercept (Hong Kong) Ltd | 0 | -100,00 | 0 | |||||
| 2026-04-06 | 13F | Hall Laurie J Trustee | 18.388 | -14,39 | 1.312 | -17,13 | ||||
| 2025-10-30 | 13F | Ridgewood Investments LLC | 0 | -100,00 | 0 | -100,00 | ||||
| 2026-01-29 | 13F | Dunhill Financial, LLC | 44 | 4,76 | 3 | 0,00 | ||||
| 2026-02-13 | 13F | Boston Partners | 10.732.673 | -14,11 | 791.691 | -22,96 | ||||
| 2026-04-06 | 13F | Versant Capital Management, Inc | 3.227 | 79,38 | 230 | 74,24 | ||||
| 2026-01-27 | 13F | BankPlus Trust Department | 20.889 | -3,13 | 1.539 | -13,30 | ||||
| 2026-02-05 | 13F | 1620 Investment Advisors, Inc. | 3.628 | -26,02 | 267 | -33,75 | ||||
| 2026-02-17 | 13F | Silvercrest Asset Management Group Llc | 18.967 | 0,00 | 1.398 | -10,51 | ||||
| 2026-02-13 | 13F | GM Advisory Group, Inc. | 5.547 | 38,88 | 409 | 24,39 | ||||
| 2026-02-13 | 13F | Mariner, LLC | 1.003.019 | -0,10 | 73.915 | -10,59 | ||||
| 2026-01-29 | 13F | Sanctuary Advisors, LLC | 70.668 | 5,12 | 5.208 | -5,93 | ||||
| 2026-04-22 | 13F | Sterling Capital Management LLC | 10.308 | -31,55 | 735 | -33,72 | ||||
| 2026-02-10 | 13F | Westpac Banking Corp | 35.929 | -28,51 | 2.648 | -36,02 | ||||
| 2026-02-13 | 13F | Maven Securities LTD | Put | 0 | -100,00 | 0 | -100,00 | |||
| 2026-02-03 | 13F | Sound Financial Strategies Group, LLC | 8.271 | -9,44 | 609 | -19,02 | ||||
| 2026-01-30 | 13F | Bogart Wealth, LLC | 1.001 | -4,85 | 74 | -15,12 | ||||
| 2026-04-15 | 13F | Cypress Wealth Services, LLC | 5.266 | -4,55 | 376 | -7,64 | ||||
| 2026-02-17 | 13F | Gladstone Institutional Advisory LLC | 3.993 | -0,99 | 294 | -11,45 | ||||
| 2026-01-29 | 13F | Courier Capital Llc | 0 | -100,00 | 0 | -100,00 | ||||
| 2026-02-13 | 13F | Ingalls & Snyder Llc | 0 | -100,00 | 0 | |||||
| 2026-02-13 | 13F | Southeast Asset Advisors Inc. | 0 | -100,00 | 0 | |||||
| 2026-01-23 | 13F | Halbert Hargrove Global Advisors, Llc | 0 | -100,00 | 0 | |||||
| 2026-02-09 | 13F | Onefund, Llc | 1.429 | 5,62 | 105 | -5,41 | ||||
| 2026-02-09 | 13F | Catalyst Funds Management Pty Ltd | 0 | -100,00 | 0 | |||||
| 2026-02-17 | 13F | Core Wealth Partners LLC | 10.882 | 0,26 | 802 | -10,30 | ||||
| 2026-02-06 | 13F | Nixon Peabody Trust Co | 7.997 | -2,18 | 589 | -12,48 | ||||
| 2026-02-04 | 13F | Valeo Financial Advisors, LLC | 4.509 | -51,65 | 332 | -56,71 | ||||
| 2026-02-02 | 13F | Advisors Preferred, LLC | 3.872 | 34,03 | 281 | 17,57 | ||||
| 2026-04-08 | 13F | Thompson Investment Management, Inc. | 7.265 | 83,46 | 518 | 78,01 | ||||
| 2026-02-12 | 13F | Richard W. Paul & Associates, LLC | 3.471 | -6,77 | 256 | -16,67 | ||||
| 2026-01-28 | 13F | CAPROCK Group, Inc. | 9.440 | -31,33 | 696 | -37,16 | ||||
| 2026-02-12 | 13F | Ci Investments Inc. | 36.465 | -0,47 | 2.687 | 89.466,67 | ||||
| 2026-04-09 | 13F | Tompkins Financial Corp | 8.950 | 0,00 | 638 | -3,19 | ||||
| 2026-01-21 | 13F | Rocky Mountain Advisers, Llc | 300 | 0,00 | 22 | -8,33 | ||||
| 2026-02-17 | 13F | Lombard Odier Asset Management (Switzerland) SA | 0 | -100,00 | 0 | |||||
| 2026-04-24 | 13F | Lederer & Associates Investment Counsel/ca | 13.044 | -3,57 | 1 | |||||
| 2026-04-08 | 13F | DiNuzzo Private Wealth, Inc. | 49 | -3,92 | 3 | 0,00 | ||||
| 2026-02-06 | 13F | Rps Advisory Solutions Llc | 3.499 | 0,09 | 258 | -10,45 | ||||
| 2026-01-23 | 13F | Avion Wealth | 4.371 | -0,95 | 0 | |||||
| 2026-02-13 | 13F | State Street Corp | 26.445.663 | -0,84 | 1.948.781 | -11,26 | ||||
| 2026-04-23 | 13F | Kohmann Bosshard Financial Services, LLC | 1.272 | 0,00 | 91 | -3,23 | ||||
| 2025-11-14 | 13F | Wetherby Asset Management Inc | 9.969 | 8,14 | 821 | 17,48 | ||||
| 2026-02-13 | 13F | Towarzystwo Funduszy Inwestycyjnych Pzu Sa | 0 | -100,00 | 0 | |||||
| 2026-04-08 | 13F | Partnership Wealth Management, LLC | 5.000 | 0,00 | 357 | -3,26 | ||||
| 2026-01-16 | 13F | Hopwood Financial Services, Inc. | 0 | -100,00 | 0 | |||||
| 2026-04-22 | 13F | Kennedy Investment Group | 16.538 | -2,55 | 1.180 | -5,68 | ||||
| 2026-04-24 | 13F | CHICAGO TRUST Co NA | 4.002 | -20,12 | 285 | -22,76 | ||||
| 2026-02-10 | 13F | Eurizon Capital SGR S.p.A. | 693.621 | 51.115 | ||||||
| 2026-02-13 | 13F | Voya Financial Advisors, Inc. | 14.953 | -4,39 | 1.113 | -12,98 | ||||
| 2026-04-07 | 13F | Signaturefd, Llc | 5.339 | 13,86 | 381 | 10,14 | ||||
| 2026-04-15 | 13F | Exchange Traded Concepts, Llc | 20.254 | -7,37 | 1.445 | -10,37 | ||||
| 2026-01-27 | 13F | Regions Financial Corp | 490.193 | -2,56 | 36.122 | -12,80 | ||||
| 2026-02-11 | 13F | Cookson Peirce & Co Inc | 16.291 | 12,51 | 1.200 | 0,67 | ||||
| 2026-04-15 | 13F | Murphy, Middleton, Hinkle & Parker, Inc. | 4.120 | 294 | ||||||
| 2026-02-14 | 13F | Frec Markets, Inc. | 3.062 | 226 | ||||||
| 2026-02-09 | 13F | Fisher Asset Management, LLC | 5.790 | 427 | ||||||
| 2026-04-22 | 13F | Pictet Asset Management Holding SA | 1.402.676 | 22,18 | 100.049 | 18,26 | ||||
| 2026-02-10 | 13F | IFG Advisory, LLC | 4.401 | 324 | ||||||
| 2026-03-12 | 13F/A | Peak6 Llc | Put | 2.900 | -49,12 | 214 | -54,58 | |||
| 2026-04-24 | 13F | Ledyard National Bank | 2.962 | -0,03 | 211 | -3,21 | ||||
| 2026-01-26 | 13F | KBC Group NV | 84.428 | 3,36 | 6 | 0,00 | ||||
| 2026-03-12 | 13F/A | Peak6 Llc | Call | 9.400 | -64,93 | 693 | -68,63 | |||
| 2026-02-23 | 13F | Wealth Preservation Advisors, LLC | 47 | -6,00 | 3 | -25,00 | ||||
| 2026-02-04 | 13F | HighPoint Advisor Group LLC | 12.378 | 19,12 | 912 | 6,67 | ||||
| 2026-04-07 | 13F | Agate Pass Investment Management, LLC | 7.484 | -12,81 | 534 | -15,66 | ||||
| 2026-02-17 | 13F | Tcw Group Inc | 7.514 | 554 | ||||||
| 2026-02-17 | 13F | Advanced Portfolio Management, LLC | 0 | -100,00 | 0 | |||||
| 2026-02-12 | 13F | Summit Financial, LLC | 11.822 | 11,37 | 871 | -0,34 | ||||
| 2026-02-11 | 13F | MCF Advisors LLC | 1.933 | 205,37 | 142 | 173,08 | ||||
| 2026-01-16 | 13F | Applied Capital LLC/FL | 0 | -100,00 | 0 | |||||
| 2026-02-03 | 13F | NewEdge Wealth, LLC | 11.887 | 876 | ||||||
| 2026-02-18 | 13F | Caitlin John, LLC | 14 | 0,00 | 1 | 0,00 | ||||
| 2026-02-18 | 13F | EP Wealth Advisors, Inc. | 16.651 | -14,21 | 1.227 | -16,53 | ||||
| 2026-04-14 | 13F | Prospera Financial Services Inc | 14.762 | 11,53 | 1.054 | 7,99 | ||||
| 2026-04-22 | 13F | JNBA Financial Advisors | 1.016 | 0,00 | 72 | -2,70 | ||||
| 2025-11-07 | 13F | Synovus Financial Corp | 4.476 | -0,97 | 369 | 7,60 | ||||
| 2026-01-29 | 13F | Quest 10 Wealth Builders, Inc. | 204 | -1,45 | 15 | -11,76 | ||||
| 2026-02-05 | 13F | Flavin Financial Services, Inc. | 7.974 | -7,01 | 588 | -16,86 | ||||
| 2025-11-14 | 13F | Strategic Wealth Partners, Ltd. | 5.118 | -6,95 | 421 | 1,20 | ||||
| 2026-02-02 | 13F | Qrg Capital Management, Inc. | 18.296 | -3,44 | 1.348 | -13,59 | ||||
| 2026-02-11 | 13F | Taylor Hoffman Capital Management LLC | 5.508 | 0,00 | 406 | -10,60 | ||||
| 2026-04-24 | 13F | Mitchell Mcleod Pugh & Williams Inc | 5.377 | 0,00 | 384 | -17,63 | ||||
| 2026-01-20 | 13F | Wealth Management Associates, Inc. | 5.467 | 0,00 | 403 | -10,67 | ||||
| 2026-02-12 | 13F | Loudon Investment Management, LLC | 7.445 | 0,00 | 549 | -10,60 | ||||
| 2026-04-17 | 13F | Hanson & Doremus Investment Management | 1.076 | -10,93 | 0 | |||||
| 2026-01-14 | 13F | LVW Advisors, LLC | 0 | -100,00 | 0 | |||||
| 2026-02-03 | 13F | Cheviot Value Management, LLC | 475 | 0,00 | 40 | 8,33 | ||||
| 2026-02-18 | 13F | Beacon Pointe Advisors, LLC | 17.844 | 9,47 | 1.315 | -2,09 | ||||
| 2025-10-27 | 13F | Smith Shellnut Wilson Llc /adv | 6.970 | -6,10 | 574 | 1,96 | ||||
| 2026-02-12 | 13F | Bank Of Montreal /can/ | 2.043.841 | 56,50 | 150.611 | 40,06 | ||||
| 2026-04-17 | 13F | Cornell Pochily Investment Advisors, Inc. | 4.294 | 0,00 | 306 | -3,16 | ||||
| 2026-01-07 | 13F | Sagespring Wealth Partners, Llc | 6.978 | -8,32 | 514 | -17,89 | ||||
| 2026-04-09 | 13F | Goelzer Investment Management, Inc. | 77.474 | 0,19 | 5.526 | -3,02 | ||||
| 2026-02-12 | 13F | Great Valley Advisor Group, Inc. | 4.809 | 354 | ||||||
| 2026-02-17 | 13F | Modern Wealth Management, LLC | 9.255 | -7,33 | 682 | -17,03 | ||||
| 2026-04-22 | 13F | Cantor Fitzgerald Investment Adviser L.p. | 86.770 | 1,03 | 6.189 | -2,21 | ||||
| 2026-01-15 | 13F | Royal Fund Management, LLC | 45.177 | 18,46 | 3.332 | 6,02 | ||||
| 2026-04-07 | 13F | CoreCap Advisors, LLC | 8.798 | 53,04 | 628 | 48,23 | ||||
| 2026-04-10 | 13F | Salvus Wealth Management, LLC | 4.072 | -11,96 | 290 | -14,71 | ||||
| 2026-04-17 | 13F | Krilogy Financial LLC | 62.210 | 8,75 | 4.607 | 6,47 | ||||
| 2026-01-26 | 13F | PFG Investments, LLC | 13.939 | 3,66 | 1.027 | -7,23 | ||||
| 2026-02-04 | 13F | Oregon Public Employees Retirement Fund | 54.843 | 0,55 | 4.041 | -10,02 | ||||
| 2026-02-11 | 13F | Fjarde Ap-fonden /fourth Swedish National Pension Fund | 53.814 | -10,48 | 3.966 | 99.025,00 | ||||
| 2026-02-11 | 13F | Schulhoff & Co Inc | 12.390 | 0,08 | 913 | -10,40 | ||||
| 2026-04-24 | 13F | Boston Trust Walden Corp | 880.947 | -4,05 | 62.838 | -7,13 | ||||
| 2026-02-12 | 13F | Nuveen, LLC | 1.275.924 | 15,06 | 94.023 | 2,97 | ||||
| 2026-02-17 | 13F | Lighthouse Investment Partners, LLC | 370.000 | 6.751,85 | 27.265 | 6.040,77 | ||||
| 2026-01-28 | 13F | Mowery & Schoenfeld Wealth Management, LLC | 10 | 0,00 | 1 | |||||
| 2026-02-02 | 13F | Summit Place Financial Advisors, LLC | 4.300 | -0,09 | 317 | -10,73 | ||||
| 2026-02-13 | 13F | American Century Companies Inc | 3.839.688 | 337,11 | 282.947 | 291,20 | ||||
| 2026-04-08 | 13F | Wealth Enhancement Advisory Services, Llc | 153.248 | -25,07 | 10.628 | -28,84 | ||||
| 2026-02-03 | 13F | SBI Securities Co., Ltd. | 733 | 1,95 | 54 | -8,47 | ||||
| 2026-02-13 | 13F | Rafferty Asset Management, LLC | 40.104 | -1,44 | 2.955 | -11,79 | ||||
| 2026-02-17 | 13F | Scientech Research LLC | 0 | -100,00 | 0 | |||||
| 2026-02-12 | 13F | Principal Securities, Inc. | 20.206 | 17,89 | 1.489 | 5,46 | ||||
| 2026-04-01 | 13F | Bangor Savings Bank | 300 | 0,00 | 21 | -4,55 | ||||
| 2026-04-13 | 13F | First Hawaiian Bank | 0 | -100,00 | 0 | |||||
| 2026-02-13 | 13F | Squarepoint Ops LLC | Call | 173.200 | 360,64 | 12.763 | 312,37 | |||
| 2026-02-13 | 13F | Squarepoint Ops LLC | Put | 19.200 | 291,84 | 1.415 | 250,87 | |||
| 2026-02-13 | 13F | Squarepoint Ops LLC | 12.761 | 0,20 | 940 | -10,31 | ||||
| 2026-01-12 | 13F | Schaper Benz & Wise Investment Counsel Inc/wi | 258.005 | 0,85 | 19.012 | -9,74 | ||||
| 2026-02-06 | 13F | Addison Advisors LLC | 2.310 | 1,36 | 170 | -9,09 | ||||
| 2026-02-11 | 13F | State Farm Mutual Automobile Insurance Co | 3.443.431 | 0,00 | 253.746 | -10,51 | ||||
| 2026-04-21 | 13F | GHP Investment Advisors, Inc. | 3 | -99,48 | 0 | -100,00 | ||||
| 2026-01-28 | 13F | Citizens & Northern Corp | 0 | -100,00 | 0 | |||||
| 2026-02-19 | 13F | Atomi Financial Group, Inc. | 6.648 | -11,53 | 490 | -20,87 | ||||
| 2026-04-22 | 13F | Romano Brothers And Company | 6.997 | -2,81 | 499 | -5,85 | ||||
| 2026-04-17 | 13F | CENTRAL TRUST Co | 3.126 | -23,70 | 223 | -26,25 | ||||
| 2026-02-04 | 13F | Dogwood Wealth Management LLC | 33 | -63,74 | 2 | -71,43 | ||||
| 2026-04-15 | 13F | Hartford Financial Management Inc. | 373 | -5,33 | 27 | -10,34 | ||||
| 2026-02-13 | 13F | Panagora Asset Management Inc | 4.693 | 19,96 | 346 | 7,14 | ||||
| 2026-01-28 | 13F | Proathlete Wealth Management Llc | 961 | 0,00 | 71 | -11,39 | ||||
| 2026-01-28 | 13F | United Asset Strategies, Inc. | 23.864 | -15,92 | 1.759 | -24,74 | ||||
| 2026-02-09 | 13F | Wellington Shields Capital Management, LLC | 3.400 | -12,82 | 251 | -22,12 | ||||
| 2026-02-09 | 13F | Integrity Alliance, Llc. | 6.620 | 5,78 | 488 | -5,44 | ||||
| 2026-02-09 | 13F | Cary Street Partner Investment Advisory Llc | 1.469 | 11,12 | 108 | 0,00 | ||||
| 2026-04-10 | 13F | Quaker Wealth Management, LLC | 514 | 0,59 | 37 | -2,70 | ||||
| 2026-04-06 | 13F | CX Institutional | 18.133 | -41,31 | 1 | -50,00 | ||||
| 2026-04-20 | 13F | Inscription Capital, LLC | 3.205 | 10,18 | 229 | 6,54 | ||||
| 2026-04-20 | 13F | CWA Asset Management Group, LLC | 24.781 | -6,25 | 1.768 | -9,24 | ||||
| 2026-02-17 | 13F | Public Employees Retirement System Of Ohio | 144.266 | -4,83 | 10.631 | -14,83 | ||||
| 2026-02-20 | 13F | Kovitz Investment Group Partners, LLC | 61.194 | -32,94 | 4.509 | -39,99 | ||||
| 2025-11-14 | 13F | Cubist Systematic Strategies, LLC | Call | 38.100 | 677,55 | 3.137 | 745,55 | |||
| 2025-11-14 | 13F | Cubist Systematic Strategies, LLC | Put | 11.000 | 906 | |||||
| 2026-04-22 | 13F | CrossGen Wealth, LLC | 14 | 0,00 | 1 | -100,00 | ||||
| 2026-03-04 | 13F | Rehmann Capital Advisory Group | 26.025 | 0,15 | 1.921 | -10,15 | ||||
| 2026-02-10 | 13F | Basepoint Wealth LLC | 278 | 21 | ||||||
| 2026-04-23 | 13F | Folger Nolan Fleming Douglas Capital Management, Inc | 10.300 | -4,94 | 735 | -8,02 | ||||
| 2026-01-12 | 13F | CVA Family Office, LLC | 1.210 | -10,96 | 89 | -19,82 | ||||
| 2026-03-03 | 13F/A | Caitong International Asset Management Co., Ltd | 2.511 | 466,82 | 185 | 413,89 | ||||
| 2026-02-17 | 13F | Delta Global Management LP | 15.502 | 0,06 | 1.142 | -10,43 | ||||
| 2026-04-20 | 13F | Louisiana State Employees Retirement System | 24.400 | -0,41 | 1.740 | -3,60 | ||||
| 2026-02-17 | 13F | MIRAE ASSET GLOBAL ETFS HOLDINGS Ltd. | 53.159 | 9,27 | 3.917 | -2,20 | ||||
| 2026-04-20 | 13F | Friedenthal Financial | 13.801 | 984 | ||||||
| 2026-02-05 | 13F | Stephens Inc /ar/ | 22.289 | -5,74 | 1.642 | -15,67 | ||||
| 2026-04-17 | 13F | LMG Wealth Partners, LLC | 56.326 | 3,44 | 4.018 | 0,12 | ||||
| 2026-02-13 | 13F | Bollard Group LLC | 1.225 | 0,66 | 0 | |||||
| 2026-02-04 | 13F | Oxbow Advisors, LLC | 9.600 | 0,00 | 707 | -10,51 | ||||
| 2026-04-15 | 13F | Financial Management Professionals, Inc. | 832 | 258,62 | 59 | 247,06 | ||||
| 2026-02-17 | 13F | Woodline Partners LP | 8.818 | -98,90 | 650 | -99,02 | ||||
| 2026-04-10 | 13F | Armstrong Advisory Group, Inc | 25 | -82,64 | 2 | -90,00 | ||||
| 2026-01-30 | 13F | Simplicity Wealth,LLC | 11.519 | -37,00 | 849 | -43,65 | ||||
| 2026-01-14 | 13F | Enterprise Financial Services Corp | 0 | -100,00 | 0 | |||||
| 2026-02-11 | 13F | Dearborn Partners Llc | 3.563 | -0,28 | 263 | -10,88 | ||||
| 2026-02-17 | 13F | DoubleLine ETF Adviser LP | 27.073 | 4,57 | 1.995 | -6,38 | ||||
| 2026-02-03 | 13F | International Assets Investment Management, Llc | 104.664 | 2.345,42 | 443 | 33,84 | ||||
| 2026-02-17 | 13F | Wiley Bros.-aintree Capital, Llc | 36.502 | -6,99 | 2.687 | -16,92 | ||||
| 2025-11-06 | 13F | Westbourne Investments, Inc. | 0 | -100,00 | 0 | |||||
| 2026-02-12 | 13F | Wescott Financial Advisory Group, LLC | 3.763 | 0,32 | 277 | -10,06 | ||||
| 2026-04-21 | 13F | Financial Consulate, Inc | 65 | 261,11 | 5 | 300,00 | ||||
| 2026-04-08 | 13F | Community Financial Services Group, LLC | 149 | 11 | ||||||
| 2026-01-21 | 13F | Sound Income Strategies, LLC | 3.102 | 2,38 | 244 | 3,39 | ||||
| 2026-02-10 | 13F | Axq Capital, Lp | 27.948 | 63,92 | 2.059 | 46,76 | ||||
| 2026-02-03 | 13F | Crossmark Global Holdings, Inc. | 212.272 | 7,08 | 15.642 | -4,17 | ||||
| 2026-02-05 | 13F | Northwestern Mutual Investment Management Company, Llc | 15.301 | 0,53 | 1.128 | -10,06 | ||||
| 2026-02-17 | 13F | Sherman Porfolios, Llc | 58.642 | 4.321 | ||||||
| 2026-02-09 | 13F | Frazier Financial Advisors, LLC | 57 | -91,05 | 4 | -92,31 | ||||
| 2026-02-12 | 13F | Advisors Asset Management, Inc. | 0 | -100,00 | 0 | |||||
| 2026-04-21 | 13F | Wesbanco Bank Inc | 0 | -100,00 | 0 | |||||
| 2026-01-13 | 13F | Stephens Consulting, LLC | 248 | 0,00 | 18 | -10,00 | ||||
| 2026-01-21 | 13F | Newbridge Financial Services Group, Inc. | 196 | 0,00 | 14 | -12,50 | ||||
| 2026-04-22 | 13F | Bravera Wealth | 0 | -100,00 | 0 | |||||
| 2025-11-14 | 13F | Two Sigma Securities, Llc | 0 | -100,00 | 0 | -100,00 | ||||
| 2026-02-05 | 13F | John G Ullman & Associates Inc | 69.185 | -1,47 | 5.098 | -11,81 | ||||
| 2026-04-22 | 13F | apricus wealth, LLC | 2.989 | 0,00 | 213 | -3,18 | ||||
| 2026-02-13 | 13F | Prudential Financial Inc | 652.452 | 122,74 | 48.079 | 99,34 | ||||
| 2026-04-24 | 13F | Vision Financial Markets Llc | 3.375 | 0,00 | 241 | -3,23 | ||||
| 2026-04-13 | 13F | Hm Payson & Co | 14.307 | -3,05 | 1.021 | -6,16 | ||||
| 2026-04-22 | 13F | Portus Wealth Advisors, LLC | 10 | 1 | ||||||
| 2026-02-19 | 13F | Van Diest Capital, LLC | 3.972 | 293 | ||||||
| 2026-04-22 | 13F | Richard Bernstein Advisors LLC | 15.864 | 0,00 | 1.132 | -3,25 | ||||
| 2026-02-10 | 13F | Nomura Asset Management Co Ltd | 670.953 | -0,22 | 49.443 | -10,70 | ||||
| 2026-04-15 | 13F | Avanza Fonder AB | 60.948 | 0,00 | 4.347 | -3,21 | ||||
| 2026-02-17 | 13F | Kerrisdale Advisers, LLC | 211.229 | 108,27 | 15.565 | 86,38 | ||||
| 2026-02-10 | 13F | Argent Trust Co | 9.197 | -14,91 | 678 | -23,93 | ||||
| 2026-02-09 | 13F | Prairie Wealth Advisors, Inc. | 0 | -100,00 | 210 | -10,68 | ||||
| 2026-02-17 | 13F | Advisor Group Holdings, Inc. | Put | 500 | 37 | |||||
| 2026-01-29 | 13F | Directional Asset Management | 10.327 | 761 | ||||||
| 2026-02-20 | 13F | Kinloch Capital, LLC | 47.034 | -3,42 | 3.466 | -13,57 | ||||
| 2026-04-23 | 13F | CBOE Vest Financial, LLC | 673.133 | 7,26 | 48.015 | 3,82 | ||||
| 2026-04-21 | 13F | Trust Co Of Virginia /va | 2.973 | 0,00 | 212 | -3,20 | ||||
| 2026-01-30 | 13F | Sigma Planning Corp | 5.912 | -3,29 | 436 | -13,52 | ||||
| 2026-02-17 | 13F | Nomura Holdings Inc | 27.884 | -18,79 | 2.055 | -27,34 | ||||
| 2026-02-17 | 13F | Nomura Holdings Inc | Call | 128.400 | 9.462 | |||||
| 2025-11-18 | 13F | Copley Financial Group, Inc. | 0 | -100,00 | 0 | |||||
| 2026-02-11 | 13F | Rise Advisors, LLC | 0 | -100,00 | 0 | |||||
| 2026-02-10 | 13F | Principia Wealth Advisory, LLC | 111 | 0,00 | 8 | -11,11 | ||||
| 2026-02-04 | 13F | Virginia Retirement Systems Et Al | 801.400 | 12,73 | 59.055 | 0,89 | ||||
| 2026-02-04 | 13F | Swiss Life Asset Management Ltd | 154.130 | 79,31 | 11.358 | 60,48 | ||||
| 2025-11-14 | 13F | Royal Bank Of Canada | Put | 0 | -100,00 | 0 | -100,00 | |||
| 2026-04-13 | 13F | Nvest Wealth Strategies, Inc. | 4 | 0 | ||||||
| 2026-02-13 | 13F | Level Four Advisory Services, Llc | 4.194 | -41,74 | 309 | -47,80 | ||||
| 2026-02-11 | 13F | Illinois Municipal Retirement Fund | 249.243 | 34,14 | 18.367 | 20,05 | ||||
| 2026-02-13 | 13F | Resources Investment Advisors, LLC. | 23.712 | -15,65 | 1.747 | -24,50 | ||||
| 2026-02-10 | 13F | Peapack Gladstone Financial Corp | 240.491 | 2,37 | 18 | -10,53 | ||||
| 2026-02-06 | 13F | Envestnet Portfolio Solutions, Inc. | 16.239 | -3,14 | 1.197 | -13,33 | ||||
| 2025-10-30 | 13F | iA Global Asset Management Inc. | 0 | -100,00 | 0 | |||||
| 2026-01-26 | 13F | Taylor Frigon Capital Management LLC | 21.651 | 7,06 | 1.595 | -4,20 | ||||
| 2026-02-17 | 13F | Advisor Group Holdings, Inc. | 166.367 | -12,02 | 12.266 | -20,60 | ||||
| 2026-02-05 | 13F | Navalign, LLC | 398 | 29 | ||||||
| 2026-01-26 | 13F | Main Street Group, LTD | 0 | -100,00 | 0 | |||||
| 2026-02-17 | 13F | Prevatt Capital Ltd | 280.000 | 0,00 | 20.633 | -10,51 | ||||
| 2026-04-23 | 13F | Conscious Wealth Investments, Llc | 10.336 | 3,08 | 766 | -9,79 | ||||
| 2026-01-13 | 13F | Triangle Securities Wealth Management | 0 | -100,00 | 0 | |||||
| 2026-02-04 | 13F | Madison Asset Management, LLC | 0 | -100,00 | 0 | |||||
| 2026-04-13 | 13F | CGC Financial Services, LLC | 446 | 0,00 | 32 | -3,12 | ||||
| 2026-02-10 | 13F | Fiduciary Family Office, Llc | 9.366 | -2,47 | 690 | -12,66 | ||||
| 2026-02-17 | 13F | Magnetar Financial LLC | 3.871 | 285 | ||||||
| 2026-03-23 | 13F/A | Barclays Plc | Call | 0 | -100,00 | 0 | -100,00 | |||
| 2026-02-13 | 13F | Kempen Capital Management N.v. | 386.615 | 2,33 | 28.490 | -8,42 | ||||
| 2026-02-09 | 13F | Keating Financial Advisory Services, Inc. | 757 | 56 | ||||||
| 2026-01-15 | 13F | Jamison Private Wealth Management, Inc. | 7.903 | -7,84 | 582 | -17,56 | ||||
| 2026-01-21 | 13F | Raleigh Capital Management Inc. | 3.758 | -1,13 | 277 | -11,54 | ||||
| 2026-01-27 | 13F | Birch Hill Investment Advisors LLC | 3.006 | -27,88 | 222 | -35,57 | ||||
| 2026-02-13 | 13F | Ames National Corp | 4.895 | 0,00 | 361 | -10,67 | ||||
| 2026-02-13 | 13F | Public Sector Pension Investment Board | 0 | -100,00 | 0 | |||||
| 2026-02-13 | 13F | Centaurus Financial, Inc. | 0 | -100,00 | 0 | |||||
| 2026-02-13 | 13F | Whalerock Point Partners, Llc | 0 | -100,00 | 0 | |||||
| 2026-02-13 | 13F | Adams Diversified Equity Fund, Inc. | 0 | -100,00 | 0 | -100,00 | ||||
| 2026-02-17 | 13F | Fairview Capital Investment Management, Llc | 110.479 | -3,80 | 8.141 | -13,91 | ||||
| 2025-11-17 | 13F | LGT Financial Advisors LLC | 0 | -100,00 | 0 | |||||
| 2026-02-17 | 13F | Warren Averett Asset Management, LLC | 19.541 | 17,08 | 1.440 | 4,73 | ||||
| 2026-04-21 | 13F | Montgomery Investment Management Inc | 6.230 | 0,00 | 444 | -3,27 | ||||
| 2026-04-10 | 13F | Country Trust Bank | 497.894 | 14,54 | 35.515 | 10,87 | ||||
| 2026-02-13 | 13F | Cullen Capital Management, LLC | 619.282 | -9,70 | 45.635 | -19,18 | ||||
| 2026-02-05 | 13F | Tucker Asset Management Llc | 1.054 | 78 | ||||||
| 2026-02-05 | 13F | Amalgamated Bank | 97.858 | -1,45 | 7 | -12,50 | ||||
| 2026-02-11 | 13F | Heartland Advisors Inc | 155.123 | -16,39 | 11.431 | -25,17 | ||||
| 2026-01-20 | 13F | Savvy Advisors, Inc. | 8.695 | 94,91 | 641 | 74,39 | ||||
| 2026-04-01 | 13F | Rowland & Co Investment Counsel/adv | 55.291 | -4,01 | 3.944 | -7,09 | ||||
| 2026-04-17 | 13F | Outlook Wealth Advisors, LLC | 9.578 | -5,37 | 683 | -8,32 | ||||
| 2026-02-17 | 13F | Eminence Capital, Lp | 897.277 | 71,76 | 66.120 | 53,72 | ||||
| 2026-04-16 | 13F | Capital Advisors, Ltd. LLC | 33 | -29,79 | 0 | |||||
| 2026-02-05 | 13F | High Note Wealth, LLC | 106 | 1,92 | 8 | -12,50 | ||||
| 2026-02-10 | 13F | Edgemoor Investment Advisors, Inc. | 0 | -100,00 | 0 | |||||
| 2026-02-13 | 13F | Clarkston Capital Partners, LLC | 821.027 | -52,53 | 60.502 | -57,51 | ||||
| 2026-02-12 | 13F | CIBC Private Wealth Group, LLC | 60.977 | -1,82 | 4.493 | -12,14 | ||||
| 2026-04-22 | 13F | Patriot Financial Group Insurance Agency, LLC | 19.564 | 1.396 | ||||||
| 2026-02-13 | 13F | Wbi Investments, Inc. | 12.031 | 14,14 | 887 | 2,19 | ||||
| 2026-04-20 | 13F | Benedict Financial Advisors Inc | 58.913 | 1,08 | 4.202 | -2,14 | ||||
| 2026-02-13 | 13F | Brown Advisory Inc | 88.185 | -12,38 | 6.498 | -21,59 | ||||
| 2026-01-29 | 13F | State Of Michigan Retirement System | 125.317 | -2,94 | 9.235 | -13,14 | ||||
| 2026-02-09 | 13F | Quest Partners LLC | 30.305 | 1.146,61 | 2.233 | 1.016,50 | ||||
| 2026-02-17 | 13F | MGB Wealth Management, LLC | 5.250 | 0,00 | 387 | -10,65 | ||||
| 2026-04-14 | 13F | Zrc Wealth Management, Llc | 626 | 463,96 | 45 | 450,00 | ||||
| 2026-02-06 | 13F | Cullen/frost Bankers, Inc. | 9.609 | 0,65 | 708 | -9,92 | ||||
| 2026-02-11 | 13F | Sunrise Financial Services, LLC | 47 | 3 | ||||||
| 2026-04-21 | 13F | Moseley Investment Management Inc | 6.011 | -1,62 | 429 | -4,89 | ||||
| 2026-02-13 | 13F | Gts Securities Llc | 0 | -100,00 | 0 | -100,00 | ||||
| 2026-04-23 | 13F | SJS Investment Consulting Inc. | 21.613 | 0,48 | 1.542 | -2,78 | ||||
| 2026-02-12 | 13F | Edgewood Management Llc | 35.136 | 0,00 | 2.589 | -10,51 | ||||
| 2026-02-06 | 13F | Saranac Partners Ltd | 0 | -100,00 | 0 | |||||
| 2025-11-14 | 13F | Binnacle Investments Inc | 72 | 188,00 | 6 | 400,00 | ||||
| 2026-02-17 | 13F | Sandler Capital Management | Put | 35.000 | 2.579 | |||||
| 2025-10-28 | 13F | Impact Capital Partners LLC | 0 | -100,00 | 0 | |||||
| 2026-04-08 | 13F | M.e. Allison & Co., Inc. | 8.252 | 0,00 | 589 | -3,29 | ||||
| 2026-01-28 | 13F | Oversea-Chinese Banking CORP Ltd | 4.468 | 329 | ||||||
| 2026-02-18 | 13F | State of Tennessee, Treasury Department | 136.534 | -10,82 | 11.448 | -9,19 | ||||
| 2026-02-12 | 13F | Bahl & Gaynor Inc | 0 | -100,00 | 0 | |||||
| 2026-02-11 | 13F | Los Angeles Capital Management Llc | 2.168 | -65,78 | 162 | -69,10 | ||||
| 2026-02-17 | 13F | Lazard Asset Management Llc | 85.859 | -41,47 | 6.327 | -47,62 | ||||
| 2026-02-06 | 13F | Resona Asset Management Co.,Ltd. | 175.130 | -4,61 | 12.945 | -14,23 | ||||
| 2026-02-12 | 13F | Grey Fox Wealth Advisors, LLC | 0 | -100,00 | 0 | |||||
| 2026-02-12 | 13F | Keel Point, LLC | 2.952 | 11,23 | 218 | -0,46 | ||||
| 2026-02-11 | 13F | Parallel Advisors, LLC | 5.492 | -7,98 | 405 | -17,72 | ||||
| 2026-02-13 | 13F | Charles Schwab Investment Management Inc | 3.190.972 | 1,98 | 235.143 | -8,73 | ||||
| 2026-01-15 | 13F | Cherry Creek Investment Advisors, Inc. | 9.807 | 0,66 | 723 | -9,98 | ||||
| 2026-02-13 | 13F | Financial Network Wealth Advisors LLC | 312 | 0,00 | 23 | -12,00 | ||||
| 2026-04-23 | 13F | Farmers & Merchants Investments Inc | 175.686 | -1,30 | 12.532 | -4,47 | ||||
| 2026-02-13 | 13F | Seneschal Advisors, LLC | 7 | 0,00 | 1 | |||||
| 2025-11-13 | 13F | Banco de Sabadell, S.A | 0 | -100,00 | 0 | -100,00 | ||||
| 2026-02-05 | 13F | Thrivent Financial For Lutherans | 1.776.370 | 0,41 | 130 | -11,03 | ||||
| 2026-04-13 | 13F | Gradient Investments LLC | 13.745 | -8,13 | 980 | -11,07 | ||||
| 2026-04-20 | 13F | Heritage Wealth Management, Inc. | 0 | -100,00 | 0 | |||||
| 2026-02-13 | 13F | Ausdal Financial Partners, Inc. | 3.054 | -0,97 | 225 | -11,07 | ||||
| 2025-11-03 | 13F | Pandora Wealth, Inc. | 0 | -100,00 | 0 | -100,00 | ||||
| 2026-04-23 | 13F | Wendell David Associates Inc | 59.949 | -1,07 | 4 | 0,00 | ||||
| 2026-02-04 | 13F | Advisor OS, LLC | 14.653 | -1,03 | 1.080 | -11,48 | ||||
| 2026-02-10 | 13F | CFS Investment Advisory Services, LLC | 18.571 | -2,02 | 1.368 | -6,68 | ||||
| 2026-02-12 | 13F | BlackRock, Inc. | 40.359.885 | 0,47 | 2.974.120 | -10,09 | ||||
| 2026-02-17 | 13F | First Manhattan Co | 6.553 | 1,60 | 483 | -9,23 | ||||
| 2026-02-04 | 13F | Long Road Investment Counsel, LLC | 12.568 | -23,18 | 926 | -31,25 | ||||
| 2026-02-03 | 13F | Generali Asset Management SPA SGR | 23.254 | 5,06 | 1.714 | -5,98 | ||||
| 2026-02-04 | 13F | Tsfg, Llc | 37 | 0,00 | 0 | |||||
| 2026-02-12 | 13F | Renaissance Technologies Llc | 423.369 | 5.398,30 | 31.198 | 4.820,82 | ||||
| 2026-02-17 | 13F | Snowden Capital Advisors LLC | 12.885 | 11,69 | 950 | 0,00 | ||||
| 2026-02-10 | 13F | MainStreet Investment Advisors LLC | 37.187 | -7,25 | 2.740 | -16,99 | ||||
| 2026-02-10 | 13F | DT Investment Partners, LLC | 29 | 0,00 | 2 | 0,00 | ||||
| 2025-11-13 | 13F | Blueshift Asset Management, LLC | 0 | -100,00 | 0 | |||||
| 2026-02-10 | 13F | Intellectus Partners, LLC | 0 | -100,00 | 0 | -100,00 | ||||
| 2026-04-14 | 13F | Beacon Investment Advisory Services, Inc. | 1.258 | 90 | ||||||
| 2026-02-11 | 13F | Cypress Capital Group | 6.170 | 7,40 | 455 | -4,02 | ||||
| 2026-04-20 | 13F | Jfs Wealth Advisors, Llc | 822 | -13,84 | 59 | -17,14 | ||||
| 2026-04-22 | 13F | Invera Wealth Advisors, LLC | 4.435 | 6,82 | 316 | 3,61 | ||||
| 2026-02-10 | 13F | Bnp Paribas Arbitrage, Sa | Put | 178 | 0,00 | 1.312 | -10,51 | |||
| 2026-02-10 | 13F | Bnp Paribas Arbitrage, Sa | Call | 352 | -42,86 | 2.594 | -48,88 | |||
| 2026-02-17 | 13F | XTX Topco Ltd | 0 | -100,00 | 0 | |||||
| 2026-02-13 | 13F | Tradewinds, LLC. | 4.844 | 0,00 | 357 | -10,55 | ||||
| 2026-01-23 | 13F | Steigerwald, Gordon & Koch Inc. | 190.564 | -3,09 | 14.043 | -13,27 | ||||
| 2026-04-15 | 13F | Iowa State Bank | 17.725 | 0,70 | 1.264 | -2,54 | ||||
| 2025-11-14 | 13F | Axa S.a. | 0 | -100,00 | 0 | -100,00 | ||||
| 2026-01-29 | 13F | Lee Danner & Bass Inc | 180.980 | -1,85 | 13.336 | -12,16 | ||||
| 2026-04-16 | 13F | Petredis Investment Advisors Llc | 0 | -100,00 | 0 | |||||
| 2026-02-13 | 13F | Chevy Chase Trust Holdings, Inc. | 244.316 | -0,36 | 18.004 | -10,83 | ||||
| 2026-02-10 | 13F | Norges Bank | 7.365.716 | 542.780 | ||||||
| 2026-02-03 | 13F | D.B. Root & Company, LLC | 6.113 | -0,23 | 450 | -10,71 | ||||
| 2026-02-03 | 13F | Broadwater Capital Management Llc | 865 | -11,28 | 64 | -21,25 | ||||
| 2026-02-17 | 13F | Mirabella Financial Services Llp | 6.526 | 481 | ||||||
| 2026-02-05 | 13F | 1st Source Bank | 21.487 | -1,39 | 1.583 | -11,76 | ||||
| 2026-02-13 | 13F | Citigroup Inc | 987.924 | 17,28 | 72.800 | 4,96 | ||||
| 2026-04-21 | 13F | Olstein Capital Management, L.P. | 60.000 | -20,00 | 4 | -20,00 | ||||
| 2026-02-06 | 13F | Profund Advisors Llc | 6.061 | -0,77 | 447 | -11,16 | ||||
| 2026-01-22 | 13F | Weaver Capital Management LLC | 0 | -100,00 | 0 | |||||
| 2026-02-17 | 13F | Aristotle Capital Management, LLC | 20.918 | -4,75 | 1.541 | -14,77 | ||||
| 2026-04-21 | 13F | Lewis Asset Management, LLC | 0 | -100,00 | 0 | |||||
| 2026-04-03 | 13F | Investors Research Corp | 0 | -100,00 | 0 | |||||
| 2026-02-13 | 13F | Kcm Investment Advisors Llc | 11.007 | -0,05 | 811 | -10,49 | ||||
| 2026-02-14 | 13F | Howe & Rusling Inc | 3.114 | 23,38 | 229 | 10,63 | ||||
| 2026-02-13 | 13F | Ostrum Asset Management | 3.154 | -33,74 | 232 | -40,66 | ||||
| 2026-02-03 | 13F | Sequoia Financial Advisors, LLC | 29.133 | 22,84 | 2.147 | 9,94 | ||||
| 2026-02-11 | 13F | Inceptionr Llc | 20.268 | 3,62 | 1.494 | -7,27 | ||||
| 2026-02-17 | 13F | Brevan Howard Capital Management LP | 98.377 | 186,50 | 7.249 | 156,42 | ||||
| 2026-04-21 | 13F | Cambient Family Office, Llc | 8.462 | 2,86 | 604 | -0,50 | ||||
| 2026-04-22 | 13F | Princeton Global Asset Management LLC | 1.185 | -29,67 | 85 | -32,26 | ||||
| 2026-02-17 | 13F | Maryland State Retirement & Pension System | 24.184 | 0,00 | 1.782 | -10,50 | ||||
| 2026-02-10 | 13F | Bnp Paribas Arbitrage, Sa | 1.171.712 | 32,72 | 86.343 | 18,78 | ||||
| 2026-04-01 | 13F | Burkett Financial Services, Llc | 403 | 0,75 | 29 | -3,45 | ||||
| 2026-02-09 | 13F | Smithfield Trust Co | 7.315 | 0,36 | 1 | |||||
| 2026-02-11 | 13F | CenterBook Partners LP | 65.463 | 4.824 | ||||||
| 2026-01-27 | 13F | TD Waterhouse Canada Inc. | 1.630 | -44,12 | 120 | -48,05 | ||||
| 2026-01-26 | 13F | Northwest Capital Management Inc | 0 | -100,00 | 0 | |||||
| 2026-02-12 | 13F | Federated Hermes, Inc. | 194.802 | 234,11 | 14.355 | 199,04 | ||||
| 2026-04-07 | 13F | Farther Finance Advisors, LLC | 14.771 | 14,72 | 1.066 | 12,45 | ||||
| 2026-04-23 | 13F | McElhenny Sheffield Capital Management, LLC | 4.383 | -8,80 | 313 | -11,86 | ||||
| 2026-02-06 | 13F | Copia Wealth Management | 23 | 0,00 | 2 | 0,00 | ||||
| 2026-01-23 | 13F | Diversify Advisory Services, LLC | 4.314 | -9,88 | 340 | -2,87 | ||||
| 2026-02-06 | 13F | Associated Banc-corp | 172.561 | -0,05 | 12.716 | -10,55 | ||||
| 2026-02-04 | 13F | Nicholas Company, Inc. | 30.915 | 2.278 | ||||||
| 2026-01-26 | 13F | Keystone Wealth Services, LLC | 3.524 | -0,23 | 260 | -10,69 | ||||
| 2026-02-12 | 13F | BRYN MAWR TRUST Co | 186.962 | -3,55 | 13.777 | -13,68 | ||||
| 2026-02-17 | 13F | Quantitative Investment Management, LLC | 7.044 | 1 | ||||||
| 2025-11-14 | 13F | PineBridge Investments, L.P. | 23.962 | -77,00 | 1.973 | -74,99 | ||||
| 2026-04-13 | 13F | Compass Ion Advisors, LLC | 3.946 | 0,00 | 281 | -3,10 | ||||
| 2026-01-28 | 13F | Leelyn Smith, LLC | 35.631 | 2,69 | 2.626 | -8,12 | ||||
| 2026-04-24 | 13F | WHI TRUST Co LLC | 1.300 | 0,00 | 93 | -3,16 | ||||
| 2026-02-17 | 13F | Main Street Financial Solutions, LLC | 5.005 | -3,32 | 369 | -13,62 | ||||
| 2026-01-20 | 13F | Independence Bank of Kentucky | 28.766 | 0,24 | 2.120 | -10,29 | ||||
| 2026-02-11 | 13F | LPL Financial LLC | 605.451 | 2,73 | 44.616 | -8,07 | ||||
| 2026-04-06 | 13F | GAMMA Investing LLC | 11.988 | 35,81 | 855 | 31,54 | ||||
| 2026-04-23 | 13F | J.w. Cole Advisors, Inc. | 0 | -100,00 | 0 | |||||
| 2026-02-05 | 13F | Saratoga Research & Investment Management | 7.295 | -0,30 | 538 | -10,80 | ||||
| 2026-02-12 | 13F | New York State Common Retirement Fund | 306.391 | -1,42 | 22.578 | -11,77 | ||||
| 2026-02-13 | 13F | 1248 Management, LLC | 79 | -86,81 | 6 | -89,80 | ||||
| 2026-04-20 | 13F | Longview Financial Advisors, Inc. | 1.900 | 136 | ||||||
| 2025-11-12 | 13F | Headlands Technologies LLC | 0 | -100,00 | 0 | |||||
| 2025-11-07 | 13F | Sierra Ocean, Llc | 0 | -100,00 | 0 | |||||
| 2026-02-06 | 13F | Blackston Financial Advisory Group, LLC | 0 | -100,00 | 0 | |||||
| 2026-04-20 | 13F | Tower View Investment Management & Research LLC | 900 | 64 | ||||||
| 2026-02-13 | 13F | BNP Paribas Asset Management Holding S.A. | 438.975 | 302,92 | 32 | 300,00 | ||||
| 2026-01-14 | 13F | Canoe Financial LP | 0 | -100,00 | 0 | |||||
| 2026-02-10 | 13F | Camden National Bank | 3.542 | -18,89 | 261 | -27,30 | ||||
| 2026-02-09 | 13F | Allstate Corp | 36.057 | 104,92 | 2.657 | 83,49 | ||||
| 2025-11-14 | 13F | 1858 Wealth Management, Llc | 3.037 | -6,41 | 250 | 2,04 | ||||
| 2026-02-13 | 13F | First National Bank Of Omaha | 4.579 | 340 | ||||||
| 2026-04-23 | 13F | Asset Planning,Inc | 2.125 | 0,00 | 152 | -3,21 | ||||
| 2026-01-22 | 13F | Harwood Advisory Group, LLC | 413 | 0,49 | 30 | -9,09 | ||||
| 2026-04-06 | 13F | WASHINGTON TRUST Co | 17.573 | -7,83 | 1.253 | -10,75 | ||||
| 2026-02-13 | 13F | Capula Management Ltd | Call | 700 | 133,33 | 52 | 112,50 | |||
| 2026-02-11 | 13F | Flagship Wealth Advisors, Llc | 400 | 0,00 | 29 | -9,37 | ||||
| 2026-02-13 | 13F | University Of Texas/texas Am Investment Managment Co | 198 | 15 | ||||||
| 2026-02-05 | 13F | Allworth Financial LP | 18.286 | 53,25 | 1.347 | 37,17 | ||||
| 2026-02-12 | 13F | Quadrant Capital Group Llc | 7.798 | -2,80 | 575 | -13,03 | ||||
| 2026-04-15 | 13F | Badgley Phelps Wealth Managers, LLC | 50.869 | 1,83 | 3.628 | -1,44 | ||||
| 2026-01-21 | 13F | Woodmont Investment Counsel Llc | 4.754 | -0,02 | 350 | -10,49 | ||||
| 2026-04-16 | 13F | Bright Rock Capital Management, Llc | 20.000 | 0,00 | 1.427 | -3,19 | ||||
| 2026-02-24 | 13F | Astoria Portfolio Advisors LLC. | 2.604 | 233 | ||||||
| 2026-04-07 | 13F | U.S. Capital Wealth Advisors, LLC | 33.810 | -0,12 | 2.412 | -3,33 | ||||
| 2026-02-10 | 13F | National Pension Service | 836.452 | 1,64 | 61.638 | -9,03 | ||||
| 2026-02-11 | 13F | Erste Asset Management GmbH | 0 | 0 | ||||||
| 2026-02-17 | 13F | Canada Pension Plan Investment Board | 258.545 | 3,76 | 19.052 | -7,14 | ||||
| 2026-02-13 | 13F | Storgate, LLC | 6.136 | 452 | ||||||
| 2026-04-15 | 13F | Curbstone Financial Management Corp | 28.224 | -0,18 | 2.013 | -3,36 | ||||
| 2026-02-13 | 13F | Sargent Investment Group, LLC | 12.752 | -3,71 | 940 | -13,85 | ||||
| 2026-02-17 | 13F | Fairscale Capital, LLC | 390 | 0,00 | 29 | -12,50 | ||||
| 2026-04-20 | 13F | State of Alaska, Department of Revenue | 47.734 | 0,09 | 3 | 0,00 | ||||
| 2026-02-13 | 13F | Jacobi Capital Management LLC | 25.063 | -2,51 | 1.847 | -12,76 | ||||
| 2026-01-21 | 13F | Modera Wealth Management, LLC | 117.571 | 2,88 | 8.664 | -7,93 | ||||
| 2026-02-09 | 13F | Mizuho Securities Usa Llc | 34.868 | 0,26 | 2.657 | -5,08 | ||||
| 2026-01-26 | 13F | Mirae Asset Global Investments Co., Ltd. | 90.593 | 21,00 | 6.676 | 8,29 | ||||
| 2026-02-12 | 13F | Granite Investment Partners, LLC | 6.000 | 0,00 | 442 | -10,53 | ||||
| 2026-02-17 | 13F | Adams Wealth Management | 33.607 | 13,50 | 2.476 | 1,56 | ||||
| 2026-02-05 | 13F | New York Life Investment Management Llc | 69.631 | -0,36 | 5.131 | -10,83 | ||||
| 2026-04-13 | 13F | Wolff Wiese Magana Llc | 48 | 0,00 | 3 | 0,00 | ||||
| 2026-02-12 | 13F | Distillate Capital Partners LLC | 208.551 | -1,35 | 15.262 | -12,32 | ||||
| 2026-02-12 | 13F | Cibc World Markets Corp | 174.547 | 185,28 | 12.862 | 177,56 | ||||
| 2026-02-17 | 13F | Citadel Advisors Llc | Call | 359.600 | 22,48 | 26.499 | 9,61 | |||
| 2026-04-08 | 13F | Hummer Financial Advisory Services Inc | 3.050 | 0,00 | 218 | -3,12 | ||||
| 2026-02-17 | 13F | Citadel Advisors Llc | 917.267 | 655,82 | 67.593 | 576,47 | ||||
| 2026-02-10 | 13F | Texas Yale Capital Corp. | 28.135 | 0,00 | 2.073 | -10,49 | ||||
| 2026-02-17 | 13F | Citadel Advisors Llc | Put | 198.300 | 57,88 | 14.613 | 41,30 | |||
| 2026-02-03 | 13F | Winch Advisory Services, LLC | 49 | 0,00 | 4 | -25,00 | ||||
| 2026-01-21 | 13F | West Paces Advisors Inc. | 3.029 | 1,99 | 223 | -8,61 | ||||
| 2026-04-08 | 13F | Dover Advisors, Llc | 3.500 | -5,41 | 250 | -8,46 | ||||
| 2026-02-10 | 13F | Lcnb Corp | 6.019 | 1,52 | 444 | -9,22 | ||||
| 2026-04-08 | 13F | Wealth Enhancement Trust Services, Inc. | 9.319 | 0,00 | 665 | -3,21 | ||||
| 2026-02-13 | 13F | Clarity Asset Management, Inc. | 414 | 0,73 | 31 | -9,09 | ||||
| 2026-02-11 | 13F | Dorsey & Whitney Trust CO LLC | 22.036 | 2,01 | 1.624 | -8,72 | ||||
| 2026-04-22 | 13F | James Hambro & Partners | 7.000 | 0,00 | 499 | -3,11 | ||||
| 2026-04-24 | 13F | Bayban | 200 | 0,00 | 14 | 0,00 | ||||
| 2026-02-09 | 13F | Mathes Company, Inc. | 3.900 | 0,00 | 0 | |||||
| 2026-02-10 | 13F | Kentucky Retirement Systems Insurance Trust Fund | 12.768 | 0,00 | 941 | -10,56 | ||||
| 2026-04-23 | 13F | Oppenheimer Asset Management Inc. | 93.076 | 23,05 | 6.639 | 19,13 | ||||
| 2026-02-17 | 13F | Spears Abacus Advisors LLC | 265.545 | 0,56 | 19.568 | -10,00 | ||||
| 2026-02-13 | 13F | Motiv8 Investments LLC | 338 | 0 | ||||||
| 2026-02-10 | 13F | Savant Capital, LLC | 11.156 | -2,81 | 822 | -13,02 | ||||
| 2026-02-06 | 13F | Csenge Advisory Group | 4.504 | 12,91 | 332 | 0,91 | ||||
| 2026-01-08 | 13F | Lincoln Capital LLC | 0 | -100,00 | 0 | -100,00 | ||||
| 2026-02-17 | 13F | FIL Ltd | 221.877 | -76,16 | 16.350 | -78,66 | ||||
| 2026-02-11 | 13F | Strategic Advocates LLC | 139 | 93,06 | 10 | 100,00 | ||||
| 2026-02-13 | 13F | Islay Capital Management, Llc | 0 | -100,00 | 0 | |||||
| 2026-02-17 | 13F | Weiss Asset Management LP | 65.193 | 1.542,14 | 4.804 | 1.373,62 | ||||
| 2025-11-14 | 13F | AXA Investment Managers S.A. | 316.506 | 26.061 | ||||||
| 2026-02-17 | 13F | Utah Retirement Systems | 79.850 | -0,28 | 5.884 | -10,75 | ||||
| 2026-02-11 | 13F | O'shaughnessy Asset Management, Llc | 68.948 | -14,96 | 5.081 | -23,90 | ||||
| 2026-02-02 | 13F | Millstone Evans Group, LLC | 187 | 0,00 | 14 | -13,33 | ||||
| 2026-04-01 | 13F | Pensionfund Sabic | 0 | -100,00 | 0 | |||||
| 2026-01-29 | 13F | Integras Partners LLC | 39.037 | 0,11 | 2.877 | -10,40 | ||||
| 2026-04-07 | 13F | Retirement Wealth Solutions LLC | 56 | 3,70 | 4 | 0,00 | ||||
| 2026-02-12 | 13F | Chilton Capital Management Llc | 33.052 | -3,15 | 2.436 | -13,31 | ||||
| 2025-11-12 | 13F | Cobblestone Capital Advisors Llc /ny/ | 2.500 | 206 | ||||||
| 2026-01-08 | 13F | Sound View Wealth Advisors Group, LLC | 5.316 | -1,46 | 392 | -11,94 | ||||
| 2026-02-05 | 13F | Dana Investment Advisors, Inc. | 248.584 | -1,61 | 18.318 | -11,95 | ||||
| 2026-04-08 | 13F | Canandaigua National Corp | 11.800 | 72,14 | 842 | |||||
| 2026-04-09 | 13F | Park Place Capital Corp | 1.055 | 247,04 | 75 | 240,91 | ||||
| 2026-02-13 | 13F | Evelyn Partners Investment Management LLP | 1.900 | 0,00 | 140 | -10,26 | ||||
| 2026-02-11 | 13F | VeraBank, N.A. | 3.606 | -1,39 | 266 | -11,96 | ||||
| 2026-02-17 | 13F | Wealth Watch Advisors, INC | 1.054 | 22,13 | 78 | 8,45 | ||||
| 2026-01-28 | 13F | Confluence Wealth Services, Inc. | 5.685 | 1,10 | 419 | -9,52 | ||||
| 2026-02-12 | 13F | Sit Investment Associates Inc | 0 | -100,00 | 0 | |||||
| 2026-02-12 | 13F | Hrt Financial Lp | 2.900 | 0 | ||||||
| 2026-02-03 | 13F | Ethic Inc. | 104.837 | -7,54 | 7.725 | -17,26 | ||||
| 2026-02-03 | 13F | McIlrath & Eck, LLC | 69 | 5 | ||||||
| 2026-02-11 | 13F | TCTC Holdings, LLC | 18.441 | 0,00 | 1.359 | -10,54 | ||||
| 2026-04-14 | 13F | Palisade Asset Management, LLC | 18.403 | -3,03 | 1.313 | -6,15 | ||||
| 2026-02-11 | 13F | Franklin Resources Inc | 585.639 | 1,16 | 43.156 | -9,47 | ||||
| 2025-11-12 | 13F | RiverGlades Family Offices LLC | 4.300 | 0,00 | 354 | 8,92 | ||||
| 2026-02-03 | 13F | Retirement Planning Group | 7.737 | 20,97 | 570 | 8,37 | ||||
| 2026-01-28 | 13F | Universal- Beteiligungs- und Servicegesellschaft mbH | 412.423 | 9,46 | 30.445 | -1,87 | ||||
| 2026-02-13 | 13F | Gen-Wealth Partners Inc | 4.021 | -35,40 | 296 | -42,19 | ||||
| 2026-02-17 | 13F | Longview Partners (Guernsey) LTD | 4.908.607 | -1,69 | 361.715 | -12,02 | ||||
| 2026-02-13 | 13F | Public Employees Retirement Association Of Colorado | 45.617 | 0,00 | 3 | 0,00 | ||||
| 2026-02-05 | 13F | Mission Wealth Management, Lp | 8.140 | -18,40 | 600 | -27,04 | ||||
| 2026-02-17 | 13F | Trexquant Investment LP | 271.504 | 133,40 | 20.007 | 108,88 | ||||
| 2026-04-24 | 13F | Yousif Capital Management, Llc | 163.585 | 5,62 | 11.669 | -1,54 | ||||
| 2026-04-13 | 13F | Winthrop Advisory Group LLC | 3.959 | 0,33 | 282 | -2,76 | ||||
| 2026-02-17 | 13F | Guggenheim Capital Llc | 257.785 | -13,04 | 18.996 | -22,17 | ||||
| 2026-01-23 | 13F | Sage Mountain Advisors LLC | 0 | -100,00 | 0 | |||||
| 2026-02-17 | 13F | Centennial Bank/AR/ | 155 | 0,00 | 11 | -8,33 | ||||
| 2026-02-18 | 13F | KKM Financial LLC | 64.166 | 15,79 | 4.728 | 3,64 | ||||
| 2026-02-10 | 13F | Bank of New York Mellon Corp | 4.669.295 | -2,42 | 344.080 | -12,68 | ||||
| 2026-02-17 | 13F | Mairs & Power Inc | 138.534 | -11,33 | 10.209 | -20,65 | ||||
| 2026-02-17 | 13F | Bank Of America Corp /de/ | 5.850.484 | 8,15 | 431.122 | -3,21 | ||||
| 2026-02-13 | 13F | Entropy Technologies, LP | 83.305 | 6.139 | ||||||
| 2026-04-15 | 13F | Activest Wealth Management | 127 | 2,42 | 9 | 0,00 | ||||
| 2026-01-20 | 13F | Cigna Investments Inc /new | 4.646 | 0,00 | 0 | |||||
| 2026-02-04 | 13F | Blackhawk Capital Partners LLC. | 10.862 | -4,46 | 800 | -14,53 | ||||
| 2026-02-12 | 13F | Riverwater Partners LLC | 6.508 | 0,22 | 480 | -10,30 | ||||
| 2026-04-17 | 13F | Kennebec Savings Bank | 789 | 0,00 | 56 | -3,45 | ||||
| 2026-01-26 | 13F | Liberty Capital Management, Inc. | 3.990 | 0,00 | 294 | -10,37 | ||||
| 2026-01-14 | 13F | Smith Thornton Advisors LLC | 0 | -100,00 | 0 | |||||
| 2026-04-22 | 13F | Tred Avon Family Wealth, Llc | 9.469 | -3,04 | 675 | -6,12 | ||||
| 2026-02-13 | 13F | Schroder Investment Management Group | 79.967 | -14,34 | 5.934 | -22,34 | ||||
| 2026-02-03 | 13F | Stiles Financial Services Inc | 0 | -100,00 | 0 | |||||
| 2026-02-12 | 13F | Ensign Peak Advisors, Inc | 871.975 | -20,04 | 64.256 | -28,44 | ||||
| 2026-02-14 | 13F | Whipplewood Advisors, LLC | 1.256 | -5,28 | 93 | -15,60 | ||||
| 2025-10-28 | 13F | Copperleaf Capital, LLC | 3.533 | 291 | ||||||
| 2026-04-17 | 13F | HHM Wealth Advisors, LLC | 300 | 0,00 | 21 | -4,55 | ||||
| 2026-01-30 | 13F | Citizens Financial Group Inc/ri | 56.976 | -3,66 | 4.199 | -13,78 | ||||
| 2026-02-09 | 13F | Troy Asset Management Ltd | 442.441 | -1,12 | 32.603 | -11,50 | ||||
| 2026-04-17 | 13F | Kentucky Trust Co | 10.782 | -3,58 | 769 | -6,67 | ||||
| 2026-02-05 | 13F | BlueChip Wealth Advisors LLC | 4.000 | 0,00 | 295 | -10,64 | ||||
| 2026-04-21 | 13F | Aaron Wealth Advisors LLC | 0 | -100,00 | 0 | |||||
| 2026-02-11 | 13F | Zions Bancorporation, National Association /ut/ | 4.410 | 116,92 | 325 | 94,01 | ||||
| 2025-11-14 | 13F | Freestone Grove Partners LP | 0 | -100,00 | 0 | |||||
| 2026-02-06 | 13F | Global Retirement Partners, LLC | 14.129 | 337,84 | 1.041 | 292,83 | ||||
| 2026-01-16 | 13F | Longboard Asset Management, LP | 0 | -100,00 | 0 | |||||
| 2026-02-10 | 13F | Td Asset Management Inc | 187.175 | -15,08 | 13.793 | -24,00 | ||||
| 2026-02-10 | 13F | Walsky Investment Management, Inc. | 3.320 | 245 | ||||||
| 2026-02-11 | 13F | Cerity Partners LLC | 248.435 | 28,17 | 18.307 | 14,71 | ||||
| 2026-02-06 | 13F | Legato Capital Management LLC | 39.571 | 26,09 | 2.916 | 12,85 | ||||
| 2026-01-27 | 13F | Penobscot Investment Management Company, Inc. | 8.144 | -3,27 | 600 | -13,42 | ||||
| 2026-02-11 | 13F | Motley Fool Asset Management LLC | 13.843 | 2,34 | 1.020 | -8,36 | ||||
| 2026-01-29 | 13F | St. Johns Investment Management Company, LLC | 66 | 0,00 | 5 | -20,00 | ||||
| 2025-11-07 | 13F | Shell Asset Management Co | 6.282 | -67,31 | 1 | -100,00 | ||||
| 2026-01-21 | 13F | Crews Bank & Trust | 1.636 | 0,00 | 121 | -10,45 | ||||
| 2026-02-17 | 13F | IHT Wealth Management, LLC | 6.113 | 40,82 | 451 | 26,05 | ||||
| 2026-01-23 | 13F | Northwest Quadrant Wealth Management, LLC | 0 | -100,00 | 0 | |||||
| 2026-04-08 | 13F | Lynch & Associates/in | 57.863 | 0,34 | 4.127 | -2,87 | ||||
| 2026-04-23 | 13F | Accurate Wealth Management, LLC | 21.644 | -25,63 | 1.576 | -27,07 | ||||
| 2026-02-05 | 13F | Canada Post Corp Registered Pension Plan | 11.258 | 28,99 | 830 | 16,11 | ||||
| 2026-04-07 | 13F | Park Avenue Securities Llc | 16.925 | 7,84 | 1 | 0,00 | ||||
| 2026-02-17 | 13F | Cresset Asset Management, LLC | 80.682 | -1,29 | 5.945 | -11,66 | ||||
| 2026-02-11 | 13F | J.Safra Asset Management Corp | 49 | 4 | ||||||
| 2026-02-17 | 13F | Equitable Holdings, Inc. | 5.001 | 10,64 | 369 | -1,08 | ||||
| 2026-02-17 | 13F | Rakuten Investment Management, Inc. | 62.979 | -51,48 | 4.689 | -61,53 | ||||
| 2026-02-13 | 13F | Transamerica Financial Advisors, Inc. | 3.281 | 242 | ||||||
| 2026-01-29 | 13F | Resonant Capital Advisors, LLC | 0 | -100,00 | 0 | -100,00 | ||||
| 2026-04-17 | 13F | Wealth Management Partners, LLC | 6.474 | 1,12 | 462 | -2,12 | ||||
| 2026-02-13 | 13F | Cornercap Investment Counsel Inc | 19.835 | -1,35 | 1.462 | -11,72 | ||||
| 2026-01-30 | 13F | Valued Wealth Advisors LLC | 28 | 0,00 | 2 | 0,00 | ||||
| 2026-04-09 | 13F | Diversified Management Inc | 30.369 | 501,13 | 2.166 | 482,26 | ||||
| 2026-04-21 | 13F | Pinnacle Wealth Management Advisory Group, LLC | 0 | -100,00 | 0 | |||||
| 2026-02-11 | 13F | Mattson Financial Services, LLC | 0 | -100,00 | 0 | |||||
| 2026-01-28 | 13F | Chicago Partners Investment Group LLC | 10.483 | 8,80 | 799 | 9,17 | ||||
| 2026-01-26 | 13F | Roman Butler Fullerton & Co | 7.192 | 0,00 | 553 | 3,37 | ||||
| 2026-04-10 | 13F | GEM Asset Management, LLC | 413.033 | -1,53 | 29.462 | -2,61 | ||||
| 2026-01-16 | 13F | Crowley Wealth Management, Inc. | 0 | -100,00 | 0 | |||||
| 2026-02-12 | 13F | Elo Mutual Pension Insurance Co | 99.083 | 29,26 | 7.301 | 15,69 | ||||
| 2026-02-13 | 13F | SRS Capital Advisors, Inc. | 6.222 | 2,39 | 458 | -8,40 | ||||
| 2025-11-04 | 13F | Pineridge Advisors LLC | 42 | 2,44 | 3 | 0,00 | ||||
| 2026-02-05 | 13F | Sherman Asset Management, Inc. | 80 | 0,00 | 6 | -16,67 | ||||
| 2026-04-13 | 13F | Highland Capital Management, Llc | 3.000 | 0,00 | 214 | -3,62 | ||||
| 2026-02-11 | 13F | Group One Trading, L.p. | Put | 9.300 | 47,62 | 685 | 32,24 | |||
| 2025-10-30 | 13F | TrueMark Investments, LLC | 0 | -100,00 | 0 | |||||
| 2026-02-11 | 13F | Group One Trading, L.p. | Call | 69.900 | 69,66 | 5.151 | 51,83 | |||
| 2026-02-11 | 13F | Capital Research Global Investors | 18.247.457 | -0,62 | 1.344.655 | -11,06 | ||||
| 2025-11-14 | 13F | Point72 Asia (Singapore) Pte. Ltd. | 6.637 | 982,71 | 547 | 1.086,96 | ||||
| 2026-01-23 | 13F | Westside Investment Management, Inc. | 170 | -57,82 | 12 | -63,64 | ||||
| 2025-11-13 | 13F | Prudent Man Advisors, LLC | 7.622 | -10,17 | 628 | -2,34 | ||||
| 2026-02-10 | 13F | Tidemark, LLC | 74 | 1,37 | 5 | -16,67 | ||||
| 2026-02-17 | 13F | NorthRock Partners, LLC | 0 | -100,00 | 0 | |||||
| 2026-01-27 | 13F | Revisor Wealth Management LLC | 19.042 | 54,12 | 1.444 | 48,76 | ||||
| 2026-01-27 | 13F | Asset Management One Co., Ltd. | 207.181 | 1,47 | 15.424 | -8,26 | ||||
| 2026-03-13 | 13F/A | Pensionmark Financial Group, Llc | 10.670 | 20,39 | 786 | 7,82 | ||||
| 2026-04-21 | 13F | Old National Bancorp /in/ | 17.060 | -5,71 | 1.217 | -8,78 | ||||
| 2026-02-17 | 13F | Jones Financial Companies Lllp | 85.342 | 4,69 | 6.289 | -5,88 | ||||
| 2025-11-07 | 13F | Beacon Capital Management, LLC | 0 | -100,00 | 0 | |||||
| 2026-04-20 | 13F | YANKCOM Partnership | 897 | 2,87 | 64 | -1,56 | ||||
| 2026-04-13 | 13F | Mather Group, Llc. | 4.721 | -11,19 | 337 | -14,07 | ||||
| 2026-02-12 | 13F | Jane Street Group, Llc | 37.205 | -82,65 | 2.742 | -84,48 | ||||
| 2026-02-12 | 13F | Jane Street Group, Llc | Put | 37.000 | 293,62 | 2.727 | 252,65 | |||
| 2026-02-12 | 13F | Jane Street Group, Llc | Call | 842.800 | 12,46 | 62.106 | 0,65 | |||
| 2026-02-17 | 13F | Beacon Investment Advisors Llc | 21.669 | -0,51 | 1.597 | -10,99 | ||||
| 2026-02-13 | 13F | Centiva Capital, LP | 5.846 | 431 | ||||||
| 2026-04-16 | 13F | Uhlmann Price Securities, Llc | 3.762 | 310 | ||||||
| 2026-02-05 | 13F | North Dakota State Investment Board | 16.647 | 1.227 | ||||||
| 2026-02-06 | 13F | Marble Harbor Investment Counsel, LLC | 6.030 | 0,00 | 444 | -10,48 | ||||
| 2026-02-04 | 13F | Securian Asset Management, Inc | 13.021 | -43,53 | 960 | -49,47 | ||||
| 2026-02-09 | 13F | Roundview Capital LLC | 25.218 | -10,87 | 1.858 | -20,22 | ||||
| 2026-04-23 | 13F | Farmers & Merchants Trust Co of Chambersburg PA | 2.545 | 0,00 | 0 | |||||
| 2025-11-10 | 13F/A | Flaharty Asset Management, LLC | 0 | -100,00 | 0 | |||||
| 2026-02-13 | 13F | Boyar Asset Management Inc. | 20.049 | -3,83 | 1.477 | -13,93 | ||||
| 2025-11-14 | 13F | Voloridge Investment Management, Llc | 0 | -100,00 | 0 | |||||
| 2026-04-07 | 13F | Jacobs & Co/ca | 118.676 | -2,03 | 8 | 0,00 | ||||
| 2025-11-05 | 13F | Burt Wealth Advisors | 3.400 | 0,00 | 280 | 8,56 | ||||
| 2026-04-22 | 13F | Paul Damon & Associates, Inc. | 4.706 | 6,66 | 336 | 3,08 | ||||
| 2026-04-17 | 13F | Legacy Wealth Partners, LLC | 6.787 | -1,57 | 484 | -4,72 | ||||
| 2026-04-20 | 13F | City State Bank | 120 | -89,29 | 9 | -90,24 | ||||
| 2026-02-12 | 13F | Bank of Jackson Hole Trust | 0 | -100,00 | 0 | |||||
| 2026-02-02 | 13F | Guardian Wealth Advisors, LLC | 6.372 | -4,24 | 470 | -14,26 | ||||
| 2026-02-13 | 13F | Parkside Financial Bank & Trust | 2.077 | 5,43 | 153 | -5,56 | ||||
| 2026-02-02 | 13F | Tevis Investment Management | 12.590 | 0,00 | 1.037 | 0,00 | ||||
| 2026-02-04 | 13F | Independent Advisor Alliance | 17.887 | -5,11 | 1.318 | -15,08 | ||||
| 2026-02-03 | 13F | Credit Industriel Et Commercial | 12.126 | 65,72 | 894 | 48,34 | ||||
| 2026-02-03 | 13F | Credit Industriel Et Commercial | Put | 24.000 | 0,00 | 1.769 | -10,53 | |||
| 2026-02-17 | 13F | Evercore Wealth Management, LLC | 21.760 | 0,00 | 1.603 | -10,50 | ||||
| 2026-01-05 | 13F | Chesapeake Asset Management Llc | 5 | 0,00 | 0 | |||||
| 2026-04-14 | 13F | Perpetual Ltd | 2.820 | 201 | ||||||
| 2026-02-13 | 13F | 1832 Asset Management L.P. | 0 | -100,00 | 0 | |||||
| 2025-11-12 | 13F | Total Clarity Wealth Management, Inc. | 0 | -100,00 | 0 | |||||
| 2026-02-10 | 13F | Foundations Investment Advisors, LLC | 10.203 | 6,34 | 752 | -4,94 | ||||
| 2026-02-12 | 13F | Financial Engines Advisors L.L.C. | 0 | -100,00 | 0 | |||||
| 2026-02-13 | 13F | Kestra Advisory Services, LLC | 0 | -100,00 | 0 | |||||
| 2026-04-24 | 13F | Twin City Private Wealth, Llc | 18.075 | 19,65 | 1.289 | 15,81 | ||||
| 2026-02-20 | 13F | Sunbelt Securities, Inc. | 194 | 44,78 | 14 | 27,27 | ||||
| 2026-04-21 | 13F | Capital Investment Counsel, Inc | 17.637 | -44,15 | 1.258 | -45,94 | ||||
| 2025-11-10 | 13F | Bridgewater Advisors Inc. | 0 | -100,00 | 0 | |||||
| 2026-04-23 | 13F | Rexford Capital Inc | 7.970 | 0,00 | 568 | -3,24 | ||||
| 2026-02-17 | 13F | Capstone Investment Advisors, Llc | Call | 0 | -100,00 | 0 | -100,00 | |||
| 2026-02-13 | 13F | Allianz Se | 18.275 | -0,24 | 1.347 | -10,74 | ||||
| 2026-02-17 | 13F | Capstone Investment Advisors, Llc | 0 | -100,00 | 0 | -100,00 | ||||
| 2025-11-14 | 13F | Wolverine Trading, Llc | 3.477 | -75,50 | 285 | -73,31 | ||||
| 2026-02-17 | 13F | Capstone Investment Advisors, Llc | Put | 0 | -100,00 | 0 | -100,00 | |||
| 2025-11-14 | 13F | Wolverine Trading, Llc | Call | 139.900 | 8,20 | 11.449 | 18,06 | |||
| 2025-11-14 | 13F | Wolverine Trading, Llc | Put | 51.300 | 111,98 | 4.198 | 131,29 | |||
| 2026-02-13 | 13F | Ubs Asset Management Americas Inc | 4.711.050 | -4,07 | 347.157 | -14,15 | ||||
| 2026-02-09 | 13F | Old Republic International Corp | 620.200 | 0,00 | 46 | -11,76 | ||||
| 2026-03-04 | 13F | SHP Wealth Management | 35.407 | 2.609 | ||||||
| 2026-04-13 | 13F | Salem Investment Counselors Inc | 44.589 | -1,11 | 3.181 | -4,27 | ||||
| 2026-01-22 | 13F | Bfsg, Llc | 1 | 0,00 | 0 | |||||
| 2026-02-06 | 13F | Kingdom Financial Group LLC. | 43 | 3 | ||||||
| 2026-02-13 | 13F | Integrated Wealth Concepts LLC | 13.890 | 15,72 | 1.024 | 3,54 | ||||
| 2026-02-17 | 13F | Point72 Asset Management, L.P. | 554.156 | 107,40 | 40.836 | 85,61 | ||||
| 2026-02-03 | 13F | Capstone Triton Financial Group, LLC | 16.245 | 2,97 | 1.197 | -7,85 | ||||
| 2026-02-17 | 13F | Point72 Asset Management, L.P. | Put | 88.200 | -11,71 | 6.499 | -20,98 | |||
| 2026-02-17 | 13F | Point72 Asset Management, L.P. | Call | 103.200 | 21,41 | 7.605 | 8,66 | |||
| 2026-01-12 | 13F | Rialto Wealth Management, LLC | 365 | -1,35 | 27 | -13,33 | ||||
| 2026-02-13 | 13F | Capula Management Ltd | 6.534 | 90,00 | 481 | 69,96 | ||||
| 2026-02-13 | 13F | Capula Management Ltd | Put | 9.600 | 4,35 | 707 | -6,61 | |||
| 2026-02-11 | 13F | GW&K Investment Management, LLC | 320 | 0 | ||||||
| 2026-02-13 | 13F | Victory Capital Management Inc | 1.525.400 | 4,98 | 112.407 | -6,05 | ||||
| 2026-04-22 | 13F | Caldwell Trust Co | 13.485 | 0,00 | 962 | -3,22 | ||||
| 2026-02-06 | 13F | Ironwood Investment Counsel, LLC | 117.568 | 1,79 | 8.664 | -8,91 | ||||
| 2026-02-11 | 13F | Nicollet Investment Management, Inc. | 26.620 | -5,56 | 2 | -50,00 | ||||
| 2026-02-06 | 13F | Empirical Asset Management, LLC | 5.583 | 0,34 | 411 | -10,26 | ||||
| 2026-01-07 | 13F | Corsicana & Co. | 162 | 0,00 | 12 | -15,38 | ||||
| 2026-04-24 | 13F | Sumitomo Mitsui DS Asset Management Company, Ltd | 72.544 | 11,20 | 5.175 | 7,63 | ||||
| 2026-02-09 | 13F | Employees Retirement System of Texas | 0 | -100,00 | 0 | |||||
| 2026-04-17 | 13F | Fifth Third Wealth Advisors LLC | 6.843 | 49,38 | 488 | 44,81 | ||||
| 2026-04-20 | 13F | First PREMIER Bank | 6.150 | 0,00 | 0 | |||||
| 2026-02-17 | 13F | Capital Fund Management S.a. | Put | 16.200 | 1.194 | |||||
| 2026-04-17 | 13F | Tectonic Advisors Llc | 5.744 | -4,92 | 410 | -8,09 | ||||
| 2026-02-17 | 13F | Capital Fund Management S.a. | Call | 33.700 | 129,25 | 2.483 | 105,21 | |||
| 2026-02-02 | 13F | Alliance Wealth Advisors, LLC /UT | 7.471 | 0,00 | 551 | -10,57 | ||||
| 2026-04-14 | 13F | Moisand Fitzgerald Tamayo, LLC | 570 | 0,00 | 41 | -2,44 | ||||
| 2026-02-03 | 13F | Costello Asset Management, INC | 409 | 0,00 | 30 | -9,09 | ||||
| 2026-02-02 | 13F | Cornerstone Planning Group LLC | 135 | -81,58 | 11 | -95,05 | ||||
| 2026-02-05 | 13F | DnB Asset Management AS | 93.140 | 4,40 | 6.863 | -6,58 | ||||
| 2026-02-17 | 13F | VestGen Advisors, LLC | 7.330 | 0,00 | 540 | -10,45 | ||||
| 2026-02-02 | 13F | Fifth Third Bancorp | 192.598 | 1,34 | 14.193 | -9,31 | ||||
| 2026-02-10 | 13F | CIBC Asset Management Inc | 249.685 | 206,77 | 18.399 | 174,57 | ||||
| 2026-01-27 | 13F | Latitude Advisors, LLC | 3.298 | -0,99 | 243 | -11,31 | ||||
| 2026-01-22 | 13F | Accordant Advisory Group Inc | 150 | 0,00 | 11 | -8,33 | ||||
| 2026-02-09 | 13F | HBK Sorce Advisory LLC | 12.232 | -1,92 | 1.058 | 6,01 | ||||
| 2026-04-16 | 13F | Telos Capital Management, Inc. | 7.100 | 0,00 | 506 | -3,25 | ||||
| 2026-02-17 | 13F | Shellback Capital, LP | 0 | -100,00 | 0 | -100,00 | ||||
| 2026-04-15 | 13F | Horizon Financial Services, Llc | 73 | 180,77 | 5 | 400,00 | ||||
| 2026-02-24 | 13F | MidFirst Bank | 1.959 | 144 | ||||||
| 2026-02-13 | 13F | Fayez Sarofim & Co | 17.134 | -13,62 | 1.263 | -22,72 | ||||
| 2026-02-11 | 13F | TruNorth Capital Management, LLC | 0 | -100,00 | 0 | |||||
| 2026-02-13 | 13F | Generation Capital Management LLC | 7.793 | 0,00 | 574 | -10,45 | ||||
| 2026-01-20 | 13F | Stratos Wealth Advisors, LLC | 7.631 | 0,04 | 562 | -10,51 | ||||
| 2026-02-10 | 13F | Gulf International Bank (UK) Ltd | 24.205 | 0,00 | 2 | 0,00 | ||||
| 2026-04-08 | 13F | E Fund Management (Hong Kong) Co., Ltd. | 3 | 0,00 | 0 | |||||
| 2026-04-10 | 13F | Field & Main Bank | 6.460 | 1,97 | 461 | -1,29 | ||||
| 2026-04-23 | 13F | McMillan Office, Inc. | 2.600 | 0,00 | 185 | -3,14 | ||||
| 2026-02-09 | 13F | Arq Wealth Advisors, Llc | 4.820 | -22,20 | 355 | -30,39 | ||||
| 2026-04-21 | 13F | Robeco Institutional Asset Management B.V. | 91.597 | 99,29 | 6.534 | 92,94 | ||||
| 2026-04-21 | 13F | First United Bank Trust/ | 350 | 0,00 | 25 | -4,00 | ||||
| 2026-04-13 | 13F | Cyndeo Wealth Partners, LLC | 3.498 | 3,31 | 250 | 0,00 | ||||
| 2026-02-17 | 13F | Suvretta Capital Management, Llc | 1.083.790 | 79.864 | ||||||
| 2026-01-27 | 13F | Checchi Capital Advisers, LLC | 5.045 | -11,49 | 372 | -20,90 | ||||
| 2026-02-10 | 13F | MUFG Securities EMEA plc | 19.598 | -22,04 | 1.444 | -30,24 | ||||
| 2026-04-13 | 13F | Stockman Wealth Management, Inc. | 132.774 | 7,64 | 9.471 | 4,19 | ||||
| 2026-04-23 | 13F | Ellenbecker Investment Group | 10.397 | 0,00 | 742 | -3,26 | ||||
| 2026-02-10 | 13F | Beaton Management Co. Inc. | 7.247 | -4,81 | 1 | |||||
| 2026-02-17 | 13F | ISAM Funds (UK) Ltd | 34.807 | -18,92 | 2.565 | -27,45 | ||||
| 2026-04-21 | 13F | Columbus Macro, LLC | 133.703 | 3,52 | 9.537 | 0,21 | ||||
| 2026-01-27 | 13F | Seeds Investor Llc | 5.825 | -4,96 | 429 | -14,88 | ||||
| 2026-02-11 | 13F | Empowered Funds, LLC | 55.508 | 51,54 | 4.060 | 34,62 | ||||
| 2026-01-26 | 13F | La Banque Postale Asset Management SA | 35.366 | 320,82 | 2.606 | 277,13 | ||||
| 2026-01-09 | 13F | Appleton Partners Inc/ma | 29.438 | 0,34 | 2 | 0,00 | ||||
| 2026-02-17 | 13F | Schonfeld Strategic Advisors LLC | 83.999 | 83,83 | 6.190 | 64,51 | ||||
| 2026-04-16 | 13F | Capital Investment Advisors, LLC | 9.397 | -2,57 | 670 | -5,63 | ||||
| 2026-02-11 | 13F | Primecap Management Co/ca/ | 3.685.129 | -0,55 | 271.557 | -11,00 | ||||
| 2026-02-23 | 13F | Monetary Solutions, Ltd | 183 | 14 | ||||||
| 2026-01-28 | 13F | B. Metzler seel. Sohn & Co. AG | 53.293 | 16,49 | 3.936 | 4,51 |