Grundlæggende statistik
| Porteføljeværdi | $ 1.158.313.502 |
| Nuværende stillinger | 170 |
Seneste beholdninger, ydeevne, AUM (fra 13F, 13D)
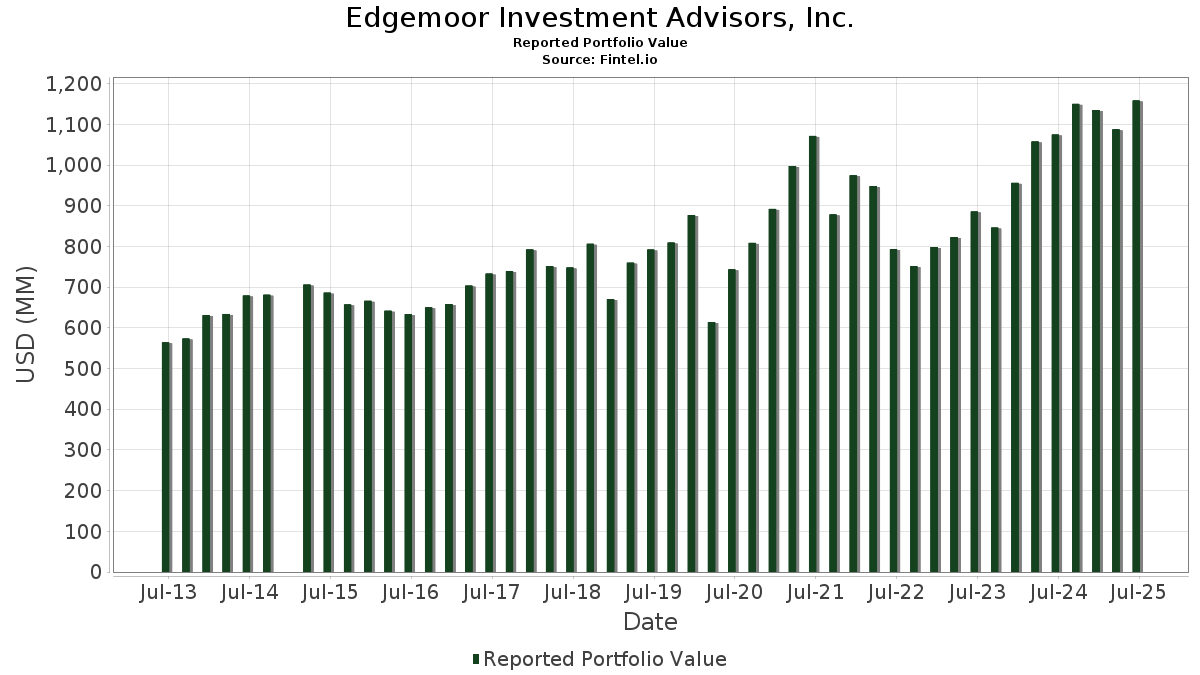
Edgemoor Investment Advisors, Inc. har afsløret 170 samlede besiddelser i deres seneste SEC-arkivering. Den seneste porteføljeværdi er beregnet til at være $ 1.158.313.502 USD. Faktiske aktiver under forvaltning (AUM) er denne værdi plus kontanter (som ikke er oplyst). Edgemoor Investment Advisors, Inc.s største beholdninger er Microsoft Corporation (US:MSFT) , Berkshire Hathaway Inc. (US:BRK.A) , Apple Inc. (US:AAPL) , United Rentals, Inc. (US:URI) , and Broadcom Inc. (US:AVGO) . Edgemoor Investment Advisors, Inc.s nye stillinger omfatter Millrose Properties, Inc. (US:MRP) , First Solar, Inc. (US:FSLR) , U.S. Bancorp (US:USB) , Invesco QQQ Trust, Series 1 (US:QQQ) , and Palo Alto Networks, Inc. (US:PANW) .
Top øger dette kvartal
Vi bruger ændringen i porteføljeallokeringen, fordi dette er den mest meningsfulde metrik. Ændringer kan skyldes handler eller ændringer i aktiekurser.
| Sikkerhed | Aktier (MM) |
Værdi (MM$) |
Portefølje % | ΔPortefølje % |
|---|---|---|---|---|
| 0,21 | 104,95 | 9,0608 | 1,6169 | |
| 0,17 | 46,89 | 4,0479 | 1,3658 | |
| 0,17 | 27,11 | 2,3403 | 0,6333 | |
| 0,07 | 53,98 | 4,6600 | 0,4142 | |
| 0,15 | 27,53 | 2,3768 | 0,3299 | |
| 0,07 | 15,34 | 1,3247 | 0,2951 | |
| 0,19 | 19,99 | 1,7257 | 0,2627 | |
| 0,18 | 39,56 | 3,4149 | 0,2306 | |
| 0,09 | 2,49 | 0,2151 | 0,2151 | |
| 0,04 | 5,05 | 0,4361 | 0,1758 |
Top falder i dette kvartal
Vi bruger ændringen i porteføljeallokeringen, fordi dette er den mest meningsfulde metrik. Ændringer kan skyldes handler eller ændringer i aktiekurser.
| Sikkerhed | Aktier (MM) |
Værdi (MM$) |
Portefølje % | ΔPortefølje % |
|---|---|---|---|---|
| 0,15 | 74,84 | 6,4613 | -1,3000 | |
| 0,35 | 71,73 | 6,1929 | -1,1741 | |
| 0,20 | 44,28 | 3,8232 | -0,5041 | |
| 0,06 | 24,94 | 2,1533 | -0,3788 | |
| 0,20 | 22,41 | 1,9347 | -0,2491 | |
| 0,04 | 7,50 | 0,6474 | -0,2013 | |
| 0,68 | 15,04 | 1,2984 | -0,1744 | |
| 0,12 | 12,76 | 1,1019 | -0,1728 | |
| 0,05 | 3,81 | 0,3286 | -0,1706 | |
| 0,18 | 29,32 | 2,5308 | -0,1640 |
13F og Fondsarkivering
Denne formular blev indsendt den 2025-08-11 for rapporteringsperioden 2025-06-30. Klik på linkikonet for at se den fulde transaktionshistorik.
Opgrader for at låse op for premium-data og eksportere til Excel ![]() .
.
| Sikkerhed | Type | Gennemsnitlig aktiekurs | Aktier (MM) |
Δ Aktier (%) |
Δ Aktier (%) |
Værdi ($MM) |
Portefølje (%) |
ΔPortefølje (%) |
|
|---|---|---|---|---|---|---|---|---|---|
| MSFT / Microsoft Corporation | 0,21 | -2,15 | 104,95 | 29,65 | 9,0608 | 1,6169 | |||
| BRK.A / Berkshire Hathaway Inc. | 0,15 | -2,78 | 74,84 | -11,33 | 6,4613 | -1,3000 | |||
| AAPL / Apple Inc. | 0,35 | -3,06 | 71,73 | -10,46 | 6,1929 | -1,1741 | |||
| URI / United Rentals, Inc. | 0,07 | -2,75 | 53,98 | 16,91 | 4,6600 | 0,4142 | |||
| AVGO / Broadcom Inc. | 0,17 | -2,36 | 46,89 | 60,75 | 4,0479 | 1,3658 | |||
| LOW / Lowe's Companies, Inc. | 0,20 | -1,07 | 44,28 | -5,89 | 3,8232 | -0,5041 | |||
| AMZN / Amazon.com, Inc. | 0,18 | -0,94 | 39,56 | 14,23 | 3,4149 | 0,2306 | |||
| GOOG / Alphabet Inc. | 0,22 | -5,70 | 38,44 | 7,07 | 3,3190 | 0,0173 | |||
| WSM / Williams-Sonoma, Inc. | 0,18 | -3,19 | 29,32 | 0,03 | 2,5308 | -0,1640 | |||
| AMAT / Applied Materials, Inc. | 0,15 | -1,96 | 27,53 | 23,68 | 2,3768 | 0,3299 | |||
| GOOGL / Alphabet Inc. | 0,16 | -0,37 | 27,36 | 13,54 | 2,3624 | 0,1461 | |||
| NVDA / NVIDIA Corporation | 0,17 | 0,18 | 27,11 | 46,03 | 2,3403 | 0,6333 | |||
| VRTX / Vertex Pharmaceuticals Incorporated | 0,06 | -1,36 | 24,94 | -9,42 | 2,1533 | -0,3788 | |||
| BX / Blackstone Inc. | 0,15 | -0,54 | 22,71 | 6,43 | 1,9609 | -0,0016 | |||
| LEN / Lennar Corporation | 0,20 | -2,07 | 22,41 | -5,63 | 1,9347 | -0,2491 | |||
| V / Visa Inc. | 0,06 | -2,49 | 21,42 | -1,21 | 1,8496 | -0,1447 | |||
| JCI / Johnson Controls International plc | 0,19 | -4,70 | 19,99 | 25,65 | 1,7257 | 0,2627 | |||
| BLK / BlackRock, Inc. | 0,02 | -5,37 | 19,23 | 4,91 | 1,6606 | -0,0254 | |||
| GD / General Dynamics Corporation | 0,06 | -2,50 | 16,52 | 4,33 | 1,4262 | -0,0299 | |||
| SCHW / The Charles Schwab Corporation | 0,18 | 0,95 | 16,41 | 17,66 | 1,4171 | 0,1342 | |||
| TSM / Taiwan Semiconductor Manufacturing Company Limited - Depositary Receipt (Common Stock) | 0,07 | 0,45 | 15,34 | 37,05 | 1,3247 | 0,2951 | |||
| ARCC / Ares Capital Corporation | 0,68 | -5,24 | 15,04 | -6,09 | 1,2984 | -0,1744 | |||
| NVS / Novartis AG - Depositary Receipt (Common Stock) | 0,11 | -1,42 | 13,40 | 7,00 | 1,1569 | 0,0053 | |||
| DE / Deere & Company | 0,03 | 0,31 | 12,84 | 8,69 | 1,1084 | 0,0221 | |||
| AEP / American Electric Power Company, Inc. | 0,12 | -3,04 | 12,76 | -7,93 | 1,1019 | -0,1728 | |||
| C / Citigroup Inc. - Corporate Bond/Note | 0,14 | -0,23 | 12,22 | 19,62 | 1,0554 | 0,1157 | |||
| ICSH / iShares U.S. ETF Trust - iShares Ultra Short Duration Bond Active ETF | 0,23 | 1,79 | 11,89 | 1,81 | 1,0265 | -0,0474 | |||
| SPG / Simon Property Group, Inc. | 0,07 | 0,52 | 11,25 | -2,71 | 0,9711 | -0,0920 | |||
| SHEL / Shell plc - Depositary Receipt (Common Stock) | 0,16 | 1,06 | 11,24 | -2,89 | 0,9705 | -0,0940 | |||
| O / Realty Income Corporation | 0,18 | 1,97 | 10,43 | 1,26 | 0,9002 | -0,0467 | |||
| ETR / Entergy Corporation | 0,12 | -2,38 | 10,04 | -5,09 | 0,8672 | -0,1060 | |||
| VZ / Verizon Communications Inc. | 0,23 | 1,41 | 9,75 | -3,27 | 0,8415 | -0,0851 | |||
| EPD / Enterprise Products Partners L.P. - Limited Partnership | 0,31 | -1,45 | 9,49 | -10,48 | 0,8197 | -0,1557 | |||
| CCI / Crown Castle Inc. | 0,09 | 2,36 | 9,36 | 0,89 | 0,8084 | -0,0451 | |||
| TMO / Thermo Fisher Scientific Inc. | 0,02 | 25,80 | 9,29 | 2,50 | 0,8024 | -0,0314 | |||
| T / AT&T Inc. | 0,29 | -1,33 | 8,47 | 0,98 | 0,7313 | -0,0402 | |||
| PSA / Public Storage | 0,03 | 0,48 | 8,28 | -1,49 | 0,7146 | -0,0581 | |||
| JEPI / J.P. Morgan Exchange-Traded Fund Trust - JPMorgan Equity Premium Income ETF | 0,14 | 3,98 | 8,13 | 3,45 | 0,7023 | -0,0208 | |||
| XPRO / Expro Group Holdings N.V. | 0,04 | 4,06 | 7,50 | -18,76 | 0,6474 | -0,2013 | |||
| NEE / NextEra Energy, Inc. | 0,11 | -1,53 | 7,32 | -3,56 | 0,6319 | -0,0661 | |||
| DLR / Digital Realty Trust, Inc. | 0,04 | -2,75 | 7,16 | 18,30 | 0,6178 | 0,0616 | |||
| SO / The Southern Company | 0,08 | -10,65 | 7,09 | -10,77 | 0,6122 | -0,1186 | |||
| CNP / CenterPoint Energy, Inc. | 0,17 | -1,02 | 6,43 | 0,37 | 0,5548 | -0,0339 | |||
| FCT / First Trust Senior Floating Rate Income Fund II | 0,63 | -1,62 | 6,39 | -1,42 | 0,5514 | -0,0444 | |||
| CWENA / Clearway Energy Inc - Class A | 0,21 | -0,20 | 6,30 | 6,11 | 0,5443 | -0,0021 | |||
| BKNG / Booking Holdings Inc. | 0,00 | 2,39 | 6,21 | 28,68 | 0,5358 | 0,0922 | |||
| EVRG / Evergy, Inc. | 0,09 | 5,30 | 5,88 | 5,26 | 0,5080 | -0,0060 | |||
| PFE / Pfizer Inc. | 0,24 | 10,77 | 5,73 | 5,97 | 0,4951 | -0,0026 | |||
| VRT / Vertiv Holdings Co | 0,04 | 0,32 | 5,05 | 78,42 | 0,4361 | 0,1758 | |||
| KMI / Kinder Morgan, Inc. | 0,17 | -2,52 | 4,88 | 0,45 | 0,4215 | -0,0254 | |||
| IVV / iShares Trust - iShares Core S&P 500 ETF | 0,01 | 0,01 | 4,53 | 10,51 | 0,3913 | 0,0142 | |||
| ATO / Atmos Energy Corporation | 0,03 | -3,80 | 4,29 | -4,09 | 0,3707 | -0,0410 | |||
| ES / Eversource Energy | 0,07 | 4,96 | 4,22 | 7,51 | 0,3646 | 0,0034 | |||
| STWD / Starwood Property Trust, Inc. | 0,19 | 0,75 | 3,88 | 2,30 | 0,3345 | -0,0139 | |||
| ARE / Alexandria Real Estate Equities, Inc. | 0,05 | -10,70 | 3,81 | -29,90 | 0,3286 | -0,1706 | |||
| OKE / ONEOK, Inc. | 0,05 | -1,35 | 3,72 | -18,84 | 0,3213 | -0,1004 | |||
| WFC.PRL / Wells Fargo & Company - Preferred Stock | 0,00 | -3,26 | 3,66 | -5,40 | 0,3163 | -0,0399 | |||
| MRK / Merck & Co., Inc. | 0,04 | -6,12 | 3,47 | -17,22 | 0,2994 | -0,0858 | |||
| KO / The Coca-Cola Company | 0,05 | 1,91 | 3,32 | 0,67 | 0,2863 | -0,0166 | |||
| PBA / Pembina Pipeline Corporation | 0,09 | -2,73 | 3,28 | -8,84 | 0,2831 | -0,0477 | |||
| BTZ / BlackRock Credit Allocation Income Trust | 0,27 | -0,75 | 2,91 | 1,08 | 0,2512 | -0,0135 | |||
| EMO / ClearBridge Energy Midstream Opportunity Fund Inc | 0,05 | 13,98 | 2,51 | 10,18 | 0,2168 | 0,0072 | |||
| MRP / Millrose Properties, Inc. | 0,09 | 2,49 | 0,2151 | 0,2151 | |||||
| WELL / Welltower Inc. | 0,02 | -1,86 | 2,47 | -1,52 | 0,2133 | -0,0174 | |||
| FRA / BlackRock Floating Rate Income Strategies Fund, Inc. | 0,19 | 9,10 | 2,47 | 10,93 | 0,2131 | 0,0085 | |||
| XEL / Xcel Energy Inc. | 0,04 | -2,19 | 2,43 | -5,92 | 0,2099 | -0,0277 | |||
| NZF / Nuveen Municipal Credit Income Fund | 0,20 | 5,03 | 2,38 | 2,36 | 0,2057 | -0,0083 | |||
| UBER / Uber Technologies, Inc. | 0,03 | 75,86 | 2,36 | 125,33 | 0,2035 | 0,1072 | |||
| KYN / Kayne Anderson Energy Infrastructure Fund, Inc. | 0,18 | 16,02 | 2,23 | 15,00 | 0,1926 | 0,0142 | |||
| AGG / iShares Trust - iShares Core U.S. Aggregate Bond ETF | 0,02 | -2,69 | 2,23 | -2,41 | 0,1922 | -0,0176 | |||
| BRK.A / Berkshire Hathaway Inc. | 0,00 | 0,00 | 2,19 | -8,73 | 0,1888 | -0,0315 | |||
| JPM / JPMorgan Chase & Co. | 0,01 | 3,26 | 2,10 | 22,05 | 0,1816 | 0,0231 | |||
| ORCL / Oracle Corporation | 0,01 | 0,84 | 1,97 | 57,77 | 0,1700 | 0,0552 | |||
| SLB / Schlumberger Limited | 0,06 | -1,33 | 1,94 | -20,21 | 0,1671 | -0,0560 | |||
| BAC.PRL / Bank of America Corporation - Preferred Stock | 0,00 | -0,50 | 1,93 | -2,28 | 0,1666 | -0,0149 | |||
| CI / The Cigna Group | 0,01 | 0,56 | 1,89 | 1,07 | 0,1631 | -0,0088 | |||
| ACN / Accenture plc | 0,01 | 1,63 | 1,88 | -2,64 | 0,1623 | -0,0153 | |||
| RLJ.PRA / RLJ Lodging Trust - Preferred Stock | 0,07 | 0,00 | 1,76 | -3,03 | 0,1518 | -0,0150 | |||
| BEPC / Brookfield Renewable Corporation | 0,05 | 18,17 | 1,75 | 38,75 | 0,1512 | 0,0351 | |||
| BK / The Bank of New York Mellon Corporation | 0,02 | 0,00 | 1,71 | 8,67 | 0,1472 | 0,0029 | |||
| JNJ / Johnson & Johnson | 0,01 | -0,98 | 1,66 | -8,79 | 0,1434 | -0,0241 | |||
| BEP / Brookfield Renewable Partners L.P. - Limited Partnership | 0,06 | -2,50 | 1,64 | 12,30 | 0,1419 | 0,0072 | |||
| IWF / iShares Trust - iShares Russell 1000 Growth ETF | 0,00 | 0,00 | 1,60 | 17,60 | 0,1379 | 0,0130 | |||
| DHR / Danaher Corporation | 0,01 | 0,99 | 1,45 | -2,69 | 0,1248 | -0,0118 | |||
| MMC / Marsh & McLennan Companies, Inc. | 0,01 | 0,36 | 1,42 | -10,04 | 0,1222 | -0,0226 | |||
| SHV / iShares Trust - iShares Short Treasury Bond ETF | 0,01 | -16,20 | 1,26 | -16,23 | 0,1087 | -0,0295 | |||
| XOM / Exxon Mobil Corporation | 0,01 | 3,39 | 1,25 | -6,32 | 0,1076 | -0,0147 | |||
| WMT / Walmart Inc. | 0,01 | 0,16 | 1,23 | 11,58 | 0,1065 | 0,0048 | |||
| VOO / Vanguard Index Funds - Vanguard S&P 500 ETF | 0,00 | 0,00 | 1,18 | 10,49 | 0,1019 | 0,0037 | |||
| IJH / iShares Trust - iShares Core S&P Mid-Cap ETF | 0,02 | 0,64 | 1,14 | 6,95 | 0,0983 | 0,0004 | |||
| ADBE / Adobe Inc. | 0,00 | 10,45 | 1,08 | 11,40 | 0,0928 | 0,0041 | |||
| NVO / Novo Nordisk A/S - Depositary Receipt (Common Stock) | 0,02 | -3,41 | 1,05 | -4,03 | 0,0905 | -0,0099 | |||
| HD / The Home Depot, Inc. | 0,00 | 10,99 | 1,02 | 11,09 | 0,0882 | 0,0036 | |||
| GBDC / Golub Capital BDC, Inc. | 0,07 | -1,42 | 1,01 | -4,61 | 0,0875 | -0,0102 | |||
| ED / Consolidated Edison, Inc. | 0,01 | 0,00 | 0,98 | -9,25 | 0,0847 | -0,0147 | |||
| WY / Weyerhaeuser Company | 0,04 | -9,33 | 0,94 | -20,49 | 0,0815 | -0,0276 | |||
| SUB / iShares Trust - iShares Short-Term National Muni Bond ETF | 0,01 | 196,58 | 0,94 | 198,73 | 0,0813 | 0,0523 | |||
| CSX / CSX Corporation | 0,03 | 0,00 | 0,91 | 10,91 | 0,0782 | 0,0031 | |||
| ADP / Automatic Data Processing, Inc. | 0,00 | -0,41 | 0,83 | 0,61 | 0,0716 | -0,0043 | |||
| CVX / Chevron Corporation | 0,01 | 0,00 | 0,82 | -14,39 | 0,0704 | -0,0172 | |||
| LLY / Eli Lilly and Company | 0,00 | -9,50 | 0,81 | -14,57 | 0,0699 | -0,0173 | |||
| COST / Costco Wholesale Corporation | 0,00 | 16,47 | 0,78 | 21,79 | 0,0671 | 0,0085 | |||
| MUB / iShares Trust - iShares National Muni Bond ETF | 0,01 | -25,35 | 0,77 | -25,99 | 0,0664 | -0,0292 | |||
| IJR / iShares Trust - iShares Core S&P Small-Cap ETF | 0,01 | -14,30 | 0,77 | -10,42 | 0,0661 | -0,0125 | |||
| GJR / Strats Trust For Procter & Gambel Security - Preferred Security | 0,00 | 1,28 | 0,72 | -5,41 | 0,0620 | -0,0077 | |||
| META / Meta Platforms, Inc. | 0,00 | 2,82 | 0,70 | 31,83 | 0,0605 | 0,0116 | |||
| USIG / iShares Trust - iShares Broad USD Investment Grade Corporate Bond ETF | 0,01 | 1,88 | 0,70 | 2,65 | 0,0602 | -0,0023 | |||
| CSCO / Cisco Systems, Inc. | 0,01 | -0,60 | 0,67 | 11,83 | 0,0580 | 0,0027 | |||
| IVE / iShares Trust - iShares S&P 500 Value ETF | 0,00 | 0,00 | 0,66 | 2,63 | 0,0572 | -0,0022 | |||
| RTX / RTX Corporation | 0,00 | 1,28 | 0,66 | 11,69 | 0,0569 | 0,0026 | |||
| KKR / KKR & Co. Inc. | 0,00 | 1,20 | 0,65 | 16,46 | 0,0563 | 0,0048 | |||
| UPS / United Parcel Service, Inc. | 0,01 | 0,62 | 0,0533 | 0,0533 | |||||
| FSLR / First Solar, Inc. | 0,00 | 0,61 | 0,0526 | 0,0526 | |||||
| JFR / Nuveen Floating Rate Income Fund | 0,07 | -3,95 | 0,61 | -3,96 | 0,0523 | -0,0057 | |||
| ORLY / O'Reilly Automotive, Inc. | 0,01 | 1.400,00 | 0,60 | -5,66 | 0,0518 | -0,0067 | |||
| LMT / Lockheed Martin Corporation | 0,00 | -1,16 | 0,59 | 2,43 | 0,0511 | -0,0020 | |||
| PEP / PepsiCo, Inc. | 0,00 | 1,44 | 0,59 | -10,65 | 0,0507 | -0,0098 | |||
| SYK / Stryker Corporation | 0,00 | 8,91 | 0,57 | 15,85 | 0,0493 | 0,0039 | |||
| IWR / iShares Trust - iShares Russell Mid-Cap ETF | 0,01 | 0,00 | 0,55 | 8,09 | 0,0473 | 0,0007 | |||
| AMGN / Amgen Inc. | 0,00 | -0,10 | 0,53 | -10,46 | 0,0459 | -0,0087 | |||
| IWD / iShares Trust - iShares Russell 1000 Value ETF | 0,00 | 0,00 | 0,49 | 3,18 | 0,0420 | -0,0013 | |||
| PM / Philip Morris International Inc. | 0,00 | 0,00 | 0,48 | 14,69 | 0,0419 | 0,0030 | |||
| NOW / ServiceNow, Inc. | 0,00 | 0,00 | 0,47 | 29,32 | 0,0408 | 0,0071 | |||
| EMR / Emerson Electric Co. | 0,00 | 0,00 | 0,47 | 21,65 | 0,0408 | 0,0051 | |||
| ABBV / AbbVie Inc. | 0,00 | 4,79 | 0,45 | -7,20 | 0,0389 | -0,0058 | |||
| ABT / Abbott Laboratories | 0,00 | 5,30 | 0,44 | 7,90 | 0,0378 | 0,0005 | |||
| TXN / Texas Instruments Incorporated | 0,00 | 0,00 | 0,43 | 15,73 | 0,0375 | 0,0029 | |||
| MCD / McDonald's Corporation | 0,00 | 26,54 | 0,43 | 18,38 | 0,0367 | 0,0037 | |||
| ET / Energy Transfer LP - Limited Partnership | 0,02 | 0,00 | 0,37 | -2,61 | 0,0323 | -0,0030 | |||
| SPLG / SPDR Series Trust - SPDR Portfolio S&P 500 ETF | 0,01 | 0,00 | 0,37 | 10,39 | 0,0322 | 0,0012 | |||
| USB / U.S. Bancorp | 0,01 | 0,37 | 0,0321 | 0,0321 | |||||
| GSCE / GS Connect S&P GSCI Enhanced Commodity Total Return ETN | 0,00 | 0,00 | 0,37 | 29,89 | 0,0315 | 0,0056 | |||
| IPAC / iShares Trust - iShares Core MSCI Pacific ETF | 0,01 | 0,00 | 0,36 | 10,30 | 0,0315 | 0,0011 | |||
| QCOM / QUALCOMM Incorporated | 0,00 | 0,00 | 0,36 | 3,43 | 0,0313 | -0,0009 | |||
| PAYX / Paychex, Inc. | 0,00 | 5,59 | 0,34 | -0,58 | 0,0297 | -0,0021 | |||
| MO / Altria Group, Inc. | 0,01 | 0,00 | 0,33 | -2,37 | 0,0285 | -0,0026 | |||
| PFF / iShares Trust - iShares Preferred and Income Securities ETF | 0,01 | 5,95 | 0,33 | 5,83 | 0,0283 | -0,0002 | |||
| VTR / Ventas, Inc. | 0,01 | 0,00 | 0,32 | -8,26 | 0,0278 | -0,0044 | |||
| SPY / SPDR S&P 500 ETF | 0,00 | 19,48 | 0,31 | 31,91 | 0,0268 | 0,0052 | |||
| VO / Vanguard Index Funds - Vanguard Mid-Cap ETF | 0,00 | 0,00 | 0,31 | 8,54 | 0,0263 | 0,0004 | |||
| ETN / Eaton Corporation plc | 0,00 | 2,04 | 0,30 | 34,51 | 0,0263 | 0,0054 | |||
| MKL / Markel Group Inc. | 0,00 | 0,00 | 0,30 | 6,79 | 0,0259 | 0,0001 | |||
| AXP / American Express Company | 0,00 | 1,85 | 0,30 | 21,05 | 0,0258 | 0,0030 | |||
| IGSB / iShares Trust - iShares 1-5 Year Investment Grade Corporate Bond ETF | 0,01 | 4,62 | 0,30 | 5,30 | 0,0258 | -0,0003 | |||
| IBM / International Business Machines Corporation | 0,00 | 0,00 | 0,29 | 18,78 | 0,0252 | 0,0026 | |||
| YUM / Yum! Brands, Inc. | 0,00 | 0,00 | 0,28 | -5,98 | 0,0245 | -0,0032 | |||
| IEFA / iShares Trust - iShares Core MSCI EAFE ETF | 0,00 | 6,04 | 0,28 | 17,37 | 0,0239 | 0,0021 | |||
| QQQ / Invesco QQQ Trust, Series 1 | 0,00 | 0,26 | 0,0226 | 0,0226 | |||||
| NTCT / NetScout Systems, Inc. | 0,01 | 0,00 | 0,25 | 18,10 | 0,0214 | 0,0021 | |||
| PANW / Palo Alto Networks, Inc. | 0,00 | 0,25 | 0,0214 | 0,0214 | |||||
| VLTO / Veralto Corporation | 0,00 | 0,00 | 0,25 | 3,38 | 0,0212 | -0,0006 | |||
| CEG / Constellation Energy Corporation | 0,00 | 0,25 | 0,0212 | 0,0212 | |||||
| NFLX / Netflix, Inc. | 0,00 | 0,24 | 0,0211 | 0,0211 | |||||
| IEMG / iShares, Inc. - iShares Core MSCI Emerging Markets ETF | 0,00 | 5,16 | 0,24 | 16,83 | 0,0210 | 0,0019 | |||
| IVW / iShares Trust - iShares S&P 500 Growth ETF | 0,00 | 0,24 | 0,0205 | 0,0205 | |||||
| CRWD / CrowdStrike Holdings, Inc. | 0,00 | 0,23 | 0,0202 | 0,0202 | |||||
| WFC / Wells Fargo & Company | 0,00 | 0,62 | 0,23 | 12,50 | 0,0202 | 0,0010 | |||
| IWS / iShares Trust - iShares Russell Mid-Cap Value ETF | 0,00 | 0,00 | 0,23 | 4,93 | 0,0202 | -0,0003 | |||
| COP / ConocoPhillips | 0,00 | 2,52 | 0,23 | -12,41 | 0,0201 | -0,0043 | |||
| CARR / Carrier Global Corporation | 0,00 | 0,00 | 0,23 | 15,50 | 0,0200 | 0,0015 | |||
| MAR / Marriott International, Inc. | 0,00 | 0,23 | 0,0199 | 0,0199 | |||||
| XLK / The Select Sector SPDR Trust - The Technology Select Sector SPDR Fund | 0,00 | 0,23 | 0,0196 | 0,0196 | |||||
| AZO / AutoZone, Inc. | 0,00 | 0,00 | 0,22 | -2,63 | 0,0192 | -0,0018 | |||
| SYY / Sysco Corporation | 0,00 | 0,63 | 0,22 | 1,40 | 0,0188 | -0,0009 | |||
| AMLP / ALPS ETF Trust - Alerian MLP ETF | 0,00 | 0,00 | 0,22 | -6,06 | 0,0188 | -0,0025 | |||
| HON / Honeywell International Inc. | 0,00 | -25,02 | 0,22 | -17,56 | 0,0187 | -0,0055 | |||
| XLV / The Select Sector SPDR Trust - The Health Care Select Sector SPDR Fund | 0,00 | 0,00 | 0,22 | -7,73 | 0,0186 | -0,0029 | |||
| IWP / iShares Trust - iShares Russell Mid-Cap Growth ETF | 0,00 | 0,21 | 0,0181 | 0,0181 | |||||
| DD / DuPont de Nemours, Inc. | 0,00 | 0,50 | 0,21 | -7,66 | 0,0178 | -0,0027 | |||
| WEC / WEC Energy Group, Inc. | 0,00 | 0,00 | 0,20 | -4,25 | 0,0176 | -0,0020 | |||
| UNH / UnitedHealth Group Incorporated | 0,00 | -100,00 | 0,00 | 0,0000 | |||||
| FTV / Fortive Corporation | 0,00 | -100,00 | 0,00 | 0,0000 | |||||
| BOTZ / Global X Funds - Global X Robotics & Artificial Intelligence ETF | 0,00 | -100,00 | 0,00 | 0,0000 | |||||
| BCE / BCE Inc. | 0,00 | -100,00 | 0,00 | 0,0000 |