Grundlæggende statistik
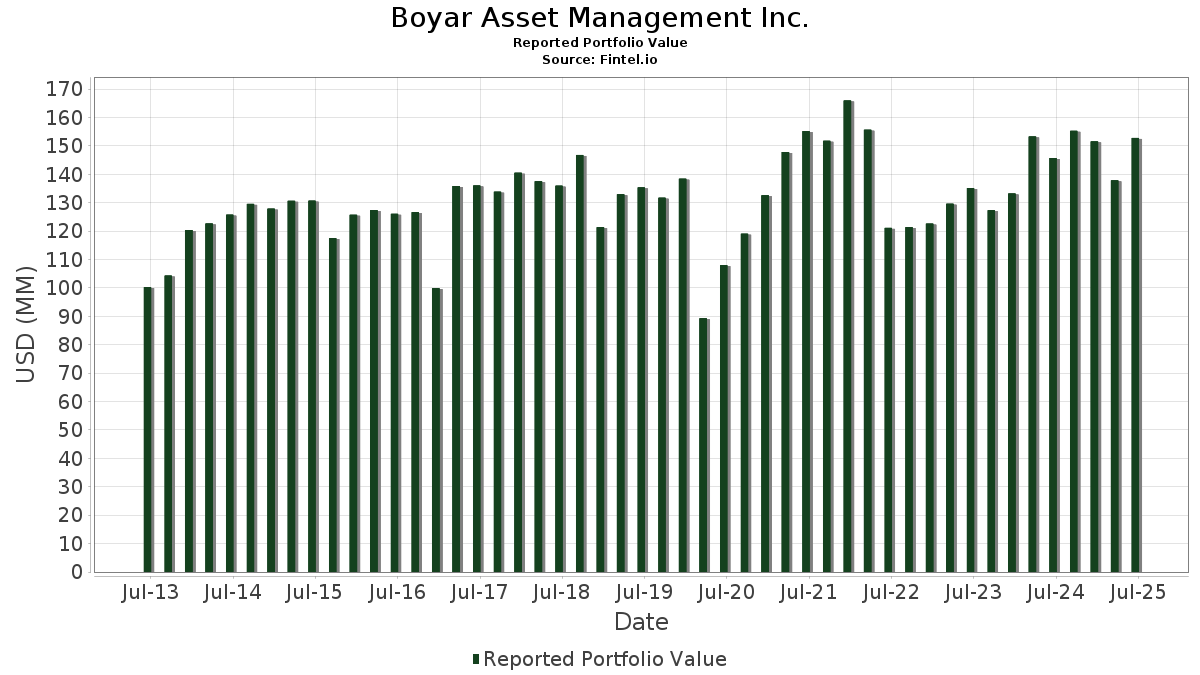
| Porteføljeværdi | $ 152.816.773 |
| Nuværende stillinger | 79 |
Seneste beholdninger, ydeevne, AUM (fra 13F, 13D)
Boyar Asset Management Inc. har afsløret 79 samlede besiddelser i deres seneste SEC-arkivering. Den seneste porteføljeværdi er beregnet til at være $ 152.816.773 USD. Faktiske aktiver under forvaltning (AUM) er denne værdi plus kontanter (som ikke er oplyst). Boyar Asset Management Inc.s største beholdninger er Microsoft Corporation (US:MSFT) , JPMorgan Chase & Co. (US:JPM) , Ameriprise Financial, Inc. (US:AMP) , The Home Depot, Inc. (US:HD) , and Uber Technologies, Inc. (US:UBER) . Boyar Asset Management Inc.s nye stillinger omfatter Citizens Financial Group, Inc. (US:CFG) , Dave & Buster's Entertainment, Inc. (US:PLAY) , .
Top øger dette kvartal
Vi bruger ændringen i porteføljeallokeringen, fordi dette er den mest meningsfulde metrik. Ændringer kan skyldes handler eller ændringer i aktiekurser.
| Sikkerhed | Aktier (MM) |
Værdi (MM$) |
Portefølje % | ΔPortefølje % |
|---|---|---|---|---|
| 0,04 | 20,90 | 13,6769 | 2,0983 | |
| 0,09 | 8,39 | 5,4901 | 0,6935 | |
| 0,05 | 14,73 | 9,6385 | 0,5705 | |
| 0,03 | 3,79 | 2,4795 | 0,2873 | |
| 0,15 | 7,17 | 4,6936 | 0,2071 | |
| 0,04 | 1,80 | 1,1760 | 0,1785 | |
| 0,00 | 0,27 | 0,1771 | 0,1771 | |
| 0,00 | 0,24 | 0,1600 | 0,1600 | |
| 0,00 | 0,96 | 0,6287 | 0,1514 | |
| 0,01 | 0,23 | 0,1511 | 0,1511 |
Top falder i dette kvartal
Vi bruger ændringen i porteføljeallokeringen, fordi dette er den mest meningsfulde metrik. Ændringer kan skyldes handler eller ændringer i aktiekurser.
| Sikkerhed | Aktier (MM) |
Værdi (MM$) |
Portefølje % | ΔPortefølje % |
|---|---|---|---|---|
| 0,02 | 9,15 | 5,9853 | -0,6815 | |
| 0,02 | 1,07 | 0,7017 | -0,4039 | |
| 0,02 | 2,56 | 1,6778 | -0,3411 | |
| 0,09 | 3,21 | 2,1024 | -0,3098 | |
| 0,02 | 1,54 | 1,0077 | -0,2734 | |
| 0,09 | 2,19 | 1,4323 | -0,2335 | |
| 0,05 | 3,10 | 2,0283 | -0,2333 | |
| 0,01 | 1,56 | 1,0219 | -0,1891 | |
| 0,01 | 0,98 | 0,6395 | -0,1531 | |
| 0,00 | 0,96 | 0,6313 | -0,1474 |
13F og Fondsarkivering
Denne formular blev indsendt den 2025-07-21 for rapporteringsperioden 2025-06-30. Klik på linkikonet for at se den fulde transaktionshistorik.
Opgrader for at låse op for premium-data og eksportere til Excel ![]() .
.
| Sikkerhed | Type | Gennemsnitlig aktiekurs | Aktier (MM) |
Δ Aktier (%) |
Δ Aktier (%) |
Værdi ($MM) |
Portefølje (%) |
ΔPortefølje (%) |
|
|---|---|---|---|---|---|---|---|---|---|
| MSFT / Microsoft Corporation | 0,04 | -1,19 | 20,90 | 30,92 | 13,6769 | 2,0983 | |||
| JPM / JPMorgan Chase & Co. | 0,05 | -0,32 | 14,73 | 17,81 | 9,6385 | 0,5705 | |||
| AMP / Ameriprise Financial, Inc. | 0,02 | -0,63 | 10,76 | 9,56 | 7,0441 | -0,0822 | |||
| HD / The Home Depot, Inc. | 0,02 | -0,53 | 9,15 | -0,49 | 5,9853 | -0,6815 | |||
| UBER / Uber Technologies, Inc. | 0,09 | -0,93 | 8,39 | 26,86 | 5,4901 | 0,6935 | |||
| BAC / Bank of America Corporation | 0,15 | 2,26 | 7,17 | 15,96 | 4,6936 | 0,2071 | |||
| BK / The Bank of New York Mellon Corporation | 0,05 | -1,68 | 4,52 | 6,80 | 2,9602 | -0,1117 | |||
| MSGS / Madison Square Garden Sports Corp. | 0,02 | 1,89 | 4,31 | 9,33 | 2,8220 | -0,0387 | |||
| CSCO / Cisco Systems, Inc. | 0,06 | -1,03 | 3,94 | 11,28 | 2,5758 | 0,0102 | |||
| DIS / The Walt Disney Company | 0,03 | -0,23 | 3,79 | 25,38 | 2,4795 | 0,2873 | |||
| CMCSA / Comcast Corporation | 0,09 | -0,12 | 3,21 | -3,40 | 2,1024 | -0,3098 | |||
| MDLZ / Mondelez International, Inc. | 0,05 | 0,01 | 3,10 | -0,61 | 2,0283 | -0,2333 | |||
| JNJ / Johnson & Johnson | 0,02 | 0,01 | 2,56 | -7,91 | 1,6778 | -0,3411 | |||
| BATRK / Atlanta Braves Holdings, Inc. | 0,05 | 4,24 | 2,37 | 21,82 | 1,5495 | 0,1401 | |||
| MAR / Marriott International, Inc. | 0,01 | 0,00 | 2,27 | 14,71 | 1,4851 | 0,0500 | |||
| PFE / Pfizer Inc. | 0,09 | -0,37 | 2,19 | -4,70 | 1,4323 | -0,2335 | |||
| SMG / The Scotts Miracle-Gro Company | 0,03 | 1,04 | 1,85 | 21,43 | 1,2131 | 0,1057 | |||
| MSGE / Madison Square Garden Entertainment Corp. | 0,05 | 2,85 | 1,82 | 25,53 | 1,1942 | 0,1400 | |||
| SPHR / Sphere Entertainment Co. | 0,04 | 2,29 | 1,80 | 30,69 | 1,1760 | 0,1785 | |||
| GOOGL / Alphabet Inc. | 0,01 | 7,39 | 1,76 | 22,38 | 1,1486 | 0,1083 | |||
| BR / Broadridge Financial Solutions, Inc. | 0,01 | 0,01 | 1,75 | 0,23 | 1,1421 | -0,1207 | |||
| SYY / Sysco Corporation | 0,02 | -0,36 | 1,66 | 0,61 | 1,0878 | -0,1111 | |||
| MCD / McDonald's Corporation | 0,01 | 0,00 | 1,56 | -6,47 | 1,0219 | -0,1891 | |||
| UPS / United Parcel Service, Inc. | 0,02 | -5,00 | 1,54 | -12,85 | 1,0077 | -0,2734 | |||
| MWA / Mueller Water Products, Inc. | 0,06 | 3,37 | 1,54 | -2,23 | 1,0056 | -0,1345 | |||
| KO / The Coca-Cola Company | 0,02 | -0,34 | 1,53 | -1,55 | 0,9998 | -0,1258 | |||
| AXP / American Express Company | 0,00 | 0,00 | 1,52 | 18,52 | 0,9932 | 0,0647 | |||
| SSNC / SS&C Technologies Holdings, Inc. | 0,02 | 2,06 | 1,42 | 1,14 | 0,9308 | -0,0890 | |||
| WM / Waste Management, Inc. | 0,01 | -2,47 | 1,35 | -3,64 | 0,8851 | -0,1326 | |||
| C / Citigroup Inc. | 0,02 | -13,52 | 1,35 | 3,76 | 0,8841 | -0,0609 | |||
| CVS / CVS Health Corporation | 0,02 | 1,87 | 1,30 | 3,77 | 0,8477 | -0,0582 | |||
| GOLF / Acushnet Holdings Corp. | 0,02 | 3,37 | 1,17 | 9,64 | 0,7666 | -0,0084 | |||
| BMY / Bristol-Myers Squibb Company | 0,02 | -7,31 | 1,07 | -29,66 | 0,7017 | -0,4039 | |||
| MTCH / Match Group, Inc. | 0,03 | 0,51 | 1,05 | -0,57 | 0,6890 | -0,0784 | |||
| LH / Labcorp Holdings Inc. | 0,00 | 2,78 | 1,05 | 15,93 | 0,6859 | 0,0301 | |||
| GPN / Global Payments Inc. | 0,01 | 32,93 | 0,98 | 8,65 | 0,6417 | -0,0129 | |||
| TGT / Target Corporation | 0,01 | -5,40 | 0,98 | -10,53 | 0,6395 | -0,1531 | |||
| BRK.B / Berkshire Hathaway Inc. | 0,00 | -1,49 | 0,96 | -10,16 | 0,6313 | -0,1474 | |||
| MKL / Markel Group Inc. | 0,00 | 36,65 | 0,96 | 45,90 | 0,6287 | 0,1514 | |||
| MODG / Topgolf Callaway Brands Corp. | 0,12 | 5,00 | 0,93 | 28,31 | 0,6083 | 0,0826 | |||
| TRIP / Tripadvisor, Inc. | 0,06 | -1,20 | 0,79 | -9,02 | 0,5153 | -0,1124 | |||
| INTC / Intel Corporation | 0,03 | -6,05 | 0,77 | -7,31 | 0,5062 | -0,0993 | |||
| CB / Chubb Limited | 0,00 | 0,47 | 0,75 | -3,62 | 0,4884 | -0,0732 | |||
| HHH / Howard Hughes Holdings Inc. | 0,01 | -3,93 | 0,74 | -12,47 | 0,4824 | -0,1284 | |||
| WBD / Warner Bros. Discovery, Inc. | 0,06 | -12,59 | 0,72 | -6,72 | 0,4730 | -0,0886 | |||
| PRGO / Perrigo Company plc | 0,03 | 2,78 | 0,72 | -2,04 | 0,4706 | -0,0620 | |||
| MGM / MGM Resorts International | 0,02 | 0,00 | 0,69 | 16,10 | 0,4487 | 0,0201 | |||
| EBAY / eBay Inc. | 0,01 | -3,62 | 0,65 | 6,01 | 0,4274 | -0,0197 | |||
| IAC / IAC Inc. | 0,02 | 5,40 | 0,63 | -14,34 | 0,4143 | -0,1217 | |||
| AAPL / Apple Inc. | 0,00 | 0,00 | 0,63 | -7,62 | 0,4123 | -0,0825 | |||
| KVUE / Kenvue Inc. | 0,03 | 0,78 | 0,62 | -12,04 | 0,4065 | -0,1057 | |||
| MDT / Medtronic plc | 0,01 | 8,94 | 0,54 | 5,71 | 0,3519 | -0,0172 | |||
| NWSA / News Corporation | 0,02 | 15,41 | 0,52 | 26,09 | 0,3418 | 0,0412 | |||
| IBM / International Business Machines Corporation | 0,00 | 0,00 | 0,48 | 18,38 | 0,3166 | 0,0206 | |||
| GLW / Corning Incorporated | 0,01 | 3,44 | 0,46 | 18,77 | 0,3026 | 0,0203 | |||
| NDAQ / Nasdaq, Inc. | 0,00 | -8,42 | 0,44 | 7,90 | 0,2865 | -0,0077 | |||
| VZ / Verizon Communications Inc. | 0,01 | 0,00 | 0,42 | -4,54 | 0,2758 | -0,0447 | |||
| GD / General Dynamics Corporation | 0,00 | 3,29 | 0,42 | 10,50 | 0,2758 | -0,0008 | |||
| GEHC / GE HealthCare Technologies Inc. | 0,01 | 5,83 | 0,42 | -2,78 | 0,2746 | -0,0388 | |||
| MRK / Merck & Co., Inc. | 0,00 | -1,32 | 0,37 | -13,05 | 0,2447 | -0,0669 | |||
| GOOG / Alphabet Inc. | 0,00 | 0,00 | 0,35 | 13,46 | 0,2322 | 0,0055 | |||
| SCHW / The Charles Schwab Corporation | 0,00 | -1,90 | 0,35 | 14,24 | 0,2314 | 0,0071 | |||
| TSQ / Townsquare Media, Inc. | 0,04 | 17,67 | 0,34 | 14,29 | 0,2202 | 0,0067 | |||
| WEN / The Wendy's Company | 0,03 | 0,02 | 0,32 | -21,87 | 0,2083 | -0,0874 | |||
| ANGI / Angi Inc. | 0,02 | 34,64 | 0,31 | 33,33 | 0,2047 | 0,0345 | |||
| AIG / American International Group, Inc. | 0,00 | 0,00 | 0,30 | -1,34 | 0,1931 | -0,0243 | |||
| KMB / Kimberly-Clark Corporation | 0,00 | 0,00 | 0,28 | -9,18 | 0,1814 | -0,0404 | |||
| BEN / Franklin Resources, Inc. | 0,01 | -21,38 | 0,27 | -2,87 | 0,1779 | -0,0245 | |||
| IBKR / Interactive Brokers Group, Inc. | 0,00 | 0,27 | 0,1771 | 0,1771 | |||||
| SO / The Southern Company | 0,00 | 0,00 | 0,25 | -0,39 | 0,1662 | -0,0182 | |||
| FTXP / Foothills Exploration, Inc. | 0,00 | 0,24 | 0,1600 | 0,1600 | |||||
| CFG / Citizens Financial Group, Inc. | 0,01 | 0,23 | 0,1511 | 0,1511 | |||||
| LEVI / Levi Strauss & Co. | 0,01 | 3,72 | 0,21 | 23,26 | 0,1392 | 0,0138 | |||
| GXO / GXO Logistics, Inc. | 0,00 | 0,21 | 0,1382 | 0,1382 | |||||
| PLAY / Dave & Buster's Entertainment, Inc. | 0,01 | 0,21 | 0,1343 | 0,1343 | |||||
| STKL / SunOpta Inc. | 0,03 | 15,06 | 0,20 | 37,24 | 0,1305 | 0,0252 | |||
| HBI / Hanesbrands Inc. | 0,04 | -4,98 | 0,16 | -24,42 | 0,1075 | -0,0505 | |||
| CNDT / Conduent Incorporated | 0,05 | 0,00 | 0,13 | -2,34 | 0,0822 | -0,0110 | |||
| NWL / Newell Brands Inc. | 0,02 | -14,58 | 0,12 | -25,79 | 0,0775 | -0,0380 | |||
| EPC / Edgewell Personal Care Company | 0,00 | -100,00 | 0,00 | 0,0000 | |||||
| QVCGA / QVC Group Inc. | 0,00 | -100,00 | 0,00 | 0,0000 | |||||
| ENR / Energizer Holdings, Inc. | 0,00 | -100,00 | 0,00 | 0,0000 |