Grundlæggende statistik
| Institutionelle aktier (lange) | 314.073.089 - 62,69% (ex 13D/G) - change of -52,14MM shares -14,24% MRQ |
| Institutionel værdi (lang) | $ 49.883.303 USD ($1000) |
Institutionelt ejerskab og aktionærer
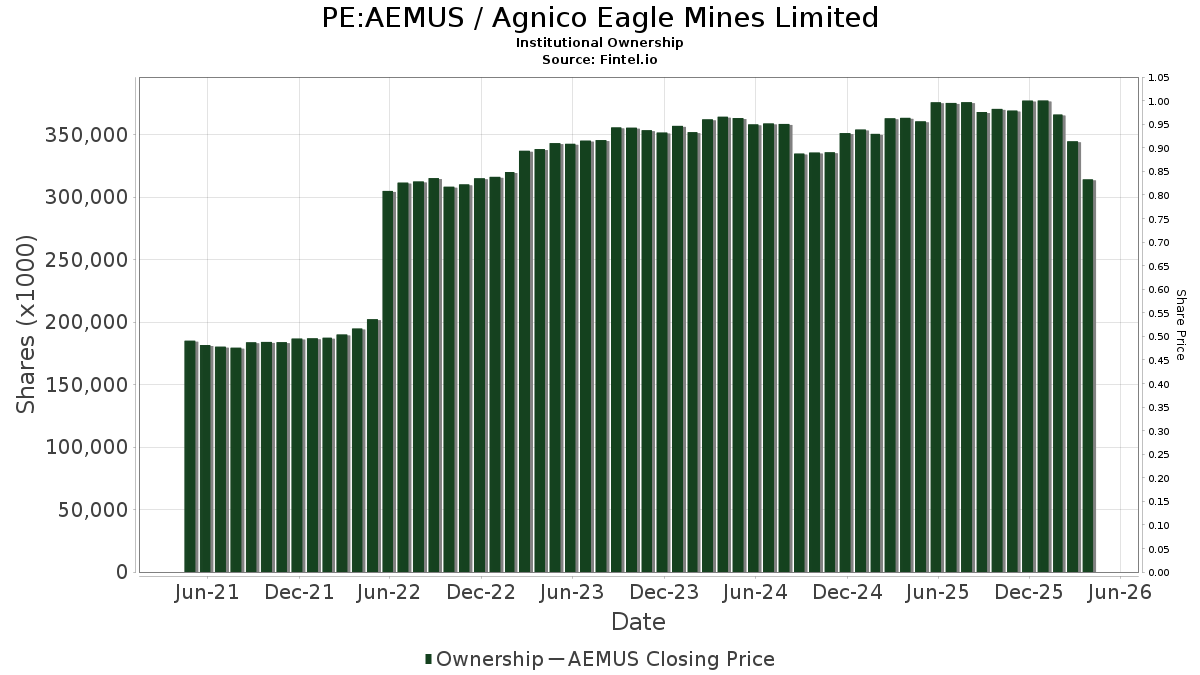
Agnico Eagle Mines Limited (PE:AEMUS) har 1094 institutionelle ejere og aktionærer, der har indsendt 13D/G- eller 13F-formularer til Securities Exchange Commission (SEC). Disse institutioner har i alt 314,073,089 aktier. Største aktionærer omfatter Capital World Investors, Vanguard Group Inc, Fmr Llc, Van Eck Associates Corp, Royal Bank Of Canada, FIL Ltd, Massachusetts Financial Services Co /ma/, Td Asset Management Inc, Bank Of Montreal /can/, and Mackenzie Financial Corp .
Agnico Eagle Mines Limited (BVL:AEMUS) institutionel ejerskabsstruktur viser aktuelle positioner i virksomheden efter institutioner og fonde, samt seneste ændringer i positionsstørrelse. Større aktionærer kan omfatte individuelle investorer, investeringsforeninger, hedgefonde eller institutioner. Skema 13D angiver, at investoren besidder (eller besidder) mere end 5 % af virksomheden og har til hensigt (eller har til hensigt at) aktivt at forfølge en ændring i forretningsstrategi. Skema 13G indikerer en passiv investering på over 5%.
Fondens stemningsscore
Fund Sentiment Score (fka Ownership Accumulation Score) finder de aktier, der bliver mest købt af fonde. Det er resultatet af en sofistikeret, multi-faktor kvantitativ model, der identificerer virksomheder med de højeste niveauer af institutionel akkumulering. Scoringsmodellen bruger en kombination af den samlede stigning i oplyste ejere, ændringerne i porteføljeallokeringer i disse ejere og andre målinger. Tallet går fra 0 til 100, hvor højere tal indikerer et højere niveau af akkumulering for sine jævnaldrende, og 50 er gennemsnittet.
Opdateringsfrekvens: Dagligt
Se Ownership Explorer, som giver en liste over højest rangerende virksomheder.
AI+ Ask Fintel’s AI assistant about Agnico Eagle Mines Limited.
Select a question to share a public post with an AI-crafted answer.
Thinking of good questions…
13F og NPORT arkivering
Detaljer om 13F-arkivering er gratis. Detaljer om NP-ansøgninger kræver et premium-medlemskab. Grønne rækker angiver nye positioner. Røde rækker angiver lukkede positioner. Klik på linket ikon for at se den fulde transaktionshistorik.
Opgrader
for at låse premium-data op og eksportere til Excel ![]() .
.
Important Note
In an effort to reduce load times for our mobile users, we are testing some ways to deliver lighter pages.
In this first test, we will deliver only the most recent 750 transactions (out of 1314 for this stock). If you are interested in loading *all* the transactions for this company, click the "load all" button below. This is just a test and if you don't like it, please let us know by submitting some gentle feedback via the link at the bottom of this page.
Load All| Fil dato | Kilde | Investor | Type | Gennemsnitlig pris (Øst) |
Aktier | Δ Aktier (%) |
Rapporteret Værdi ($1000) |
Δ Værdi (%) |
Port Alloc (%) |
|
|---|---|---|---|---|---|---|---|---|---|---|
| 2026-02-17 | 13F | Polymer Capital Management (US) LLC | 8.800 | 0,00 | 1.492 | 0,54 | ||||
| 2026-04-22 | 13F | Oak Harvest Investment Services | 75.564 | -2,80 | 15.338 | 16,37 | ||||
| 2026-01-15 | 13F | Royal Fund Management, LLC | 18.800 | 1,34 | 3.187 | 1,92 | ||||
| 2026-02-13 | 13F | Public Sector Pension Investment Board | 0 | -100,00 | 0 | |||||
| 2026-02-12 | 13F | Altiora Financial Group, LLC | 1.311 | 222 | ||||||
| 2026-02-17 | 13F | Jain Global LLC | 1.705 | 289 | ||||||
| 2026-02-11 | 13F | Simplex Trading, Llc | Put | 76.700 | -39,75 | 13.003 | 61.814,29 | |||
| 2026-02-11 | 13F | Simplex Trading, Llc | 10.646 | 1.805 | ||||||
| 2026-02-17 | 13F | Nissay Asset Management Corp /japan/ /adv | 12.082 | -20,91 | 2.048 | -20,44 | ||||
| 2026-02-11 | 13F | Simplex Trading, Llc | Call | 167.800 | -49,62 | 28.447 | 50.698,21 | |||
| 2026-04-17 | 13F | Worth Asset Management, LLC | 0 | -100,00 | 0 | |||||
| 2026-02-17 | 13F | Quadrature Capital Ltd | 838.500 | 106,43 | 142.381 | 107,96 | ||||
| 2026-04-13 | 13F | Artemis Investment Management LLP | 759.712 | 32,99 | 154.238 | 59,21 | ||||
| 2026-03-12 | 13F/A | Peak6 Llc | Put | 2.100 | -58,82 | 356 | -58,56 | |||
| 2026-02-11 | 13F | CLARET ASSET MANAGEMENT Corp | 10.739 | -0,19 | 2 | 0,00 | ||||
| 2026-02-13 | 13F | Epoch Investment Partners, Inc. | 0 | -100,00 | 0 | -100,00 | ||||
| 2026-02-13 | 13F | Rhumbline Advisers | 913 | -6,26 | 155 | -6,10 | ||||
| 2026-03-12 | 13F/A | Peak6 Llc | Call | 80.000 | -41,99 | 13.562 | -41,65 | |||
| 2026-02-17 | 13F | Cape Investment Advisory, Inc. | 24 | 4 | ||||||
| 2026-03-12 | 13F/A | Peak6 Llc | 36.183 | 6.134 | ||||||
| 2026-02-05 | 13F | Avantax Planning Partners, Inc. | 2.787 | 0,00 | 472 | 0,64 | ||||
| 2026-04-29 | 13F | Geneva Partners, LLC | 0 | -100,00 | 0 | |||||
| 2026-02-17 | 13F | Equitable Holdings, Inc. | 9.106 | 72,72 | 1.544 | 73,76 | ||||
| 2026-01-30 | 13F | Jennison Associates Llc | 272.648 | -11,48 | 46.222 | -10,97 | ||||
| 2026-02-13 | 13F | Walleye Capital LLC | Put | 126.200 | 9,26 | 21.395 | 9,89 | |||
| 2026-02-13 | 13F | Walleye Capital LLC | 1 | -99,94 | 0 | -100,00 | ||||
| 2026-02-13 | 13F | Ausdal Financial Partners, Inc. | 1.960 | -7,55 | 332 | -7,00 | ||||
| 2026-02-13 | 13F | Walleye Capital LLC | Call | 117.700 | 114,00 | 19.954 | 115,24 | |||
| 2026-02-13 | 13F | Lord, Abbett & Co. Llc | 0 | -100,00 | 0 | |||||
| 2026-04-16 | 13F | Blue Zone Wealth Advisors, LLC | 1.794 | -1,59 | 364 | 17,80 | ||||
| 2026-04-21 | 13F | Fruth Investment Management | 7.475 | 0,00 | 2 | 0,00 | ||||
| 2026-01-13 | 13F | Argentarii, LLC | 71.120 | 898,60 | 1.207 | 0,50 | ||||
| 2026-04-09 | 13F | Pacifica Partners Inc. | 176 | 36 | ||||||
| 2026-02-02 | 13F | Nkcfo Llc | 312.133 | 0,00 | 53 | 0,00 | ||||
| 2026-04-23 | 13F | Grand Central Investment Group | 35.845 | 1,21 | 7.276 | 21,17 | ||||
| 2026-01-16 | 13F | Crewe Advisors LLC | 27 | 28,57 | 5 | 33,33 | ||||
| 2026-02-12 | 13F | Ankerstar Wealth, LLC | 1 | 0 | ||||||
| 2025-11-03 | 13F | Trifecta Capital Advisors, LLC | 0 | -100,00 | 0 | |||||
| 2026-04-29 | 13F | Nichols & Pratt Advisers Llp /ma | 1.050 | 213 | ||||||
| 2026-04-13 | 13F | 5T Wealth, LLC | 1.653 | 2,80 | 336 | 23,16 | ||||
| 2026-02-06 | 13F | Pnc Financial Services Group, Inc. | 14.284 | 0,44 | 2.422 | 1,00 | ||||
| 2026-02-17 | 13F | Progeny 3, Inc. | 284.925 | 0,00 | 48.303 | 0,58 | ||||
| 2026-01-30 | 13F | Laurel Wealth Advisors LLC | 258 | 44 | ||||||
| 2026-02-09 | 13F | Hartland & Co., LLC | 94 | 840,00 | 16 | 1.400,00 | ||||
| 2026-02-12 | 13F | UniSuper Management Pty Ltd | 9.700 | 14,12 | 2.258 | 13,30 | ||||
| 2026-02-13 | 13F | Aviso Financial Inc. | 0 | -100,00 | 0 | |||||
| 2026-02-23 | 13F | Mv Capital Management, Inc. | 6 | 1 | ||||||
| 2026-04-24 | 13F | Triasima Portfolio Management inc. | 20.833 | -1,71 | 4.215 | 17,12 | ||||
| 2026-02-10 | 13F | B&l Asset Management Llc | 34.507 | 9,82 | 5.850 | 10,44 | ||||
| 2025-11-14 | 13F | SummitTX Capital, L.P. | 0 | -100,00 | 0 | |||||
| 2026-02-13 | 13F | Sumitomo Life Insurance Co | 20.166 | 287,29 | 3.420 | 289,85 | ||||
| 2025-11-03 | 13F | Principle Wealth Partners Llc | 0 | -100,00 | 0 | |||||
| 2026-04-13 | 13F | JCIC Asset Management Inc. | 54.076 | 10.954 | ||||||
| 2026-02-17 | 13F | Ninepoint Partners LP | 69.770 | -0,01 | 11.828 | 0,57 | ||||
| 2026-02-24 | 13F | MidFirst Bank | 2.000 | 339 | ||||||
| 2025-11-06 | 13F | Claudia M.p. Batlle, Crp (r) Llc | 0 | -100,00 | 0 | |||||
| 2026-04-15 | 13F | Occidental Asset Management, LLC | 1.694 | 1,74 | 344 | 21,63 | ||||
| 2026-02-17 | 13F | State Of Wisconsin Investment Board | 196.119 | 33.302 | ||||||
| 2025-11-14 | 13F | AXA Investment Managers S.A. | 426.671 | 71.920 | ||||||
| 2026-02-17 | 13F | Harvey Capital Management Inc | 33.579 | -0,36 | 5.693 | 0,21 | ||||
| 2025-11-10 | 13F | Bleakley Financial Group, LLC | 0 | -100,00 | 0 | |||||
| 2026-02-12 | 13F | DJE Kapital AG | 524.869 | -36,35 | 89.666 | -7,09 | ||||
| 2026-02-13 | 13F | Nfj Investment Group, Llc | 8.883 | -8,99 | 2.067 | -9,62 | ||||
| 2026-02-17 | 13F | Fmr Llc | 20.354.843 | -3,91 | 3.451.328 | -3,29 | ||||
| 2026-04-14 | 13F | Banque Pictet & Cie Sa | 18.181 | 3.679 | ||||||
| 2026-02-05 | 13F | Bank Julius Baer & Co. Ltd, Zurich | 701 | 0,14 | 119 | 0,85 | ||||
| 2026-01-28 | 13F | West Michigan Advisors, Llc | 3.194 | -8,98 | 541 | -8,46 | ||||
| 2025-10-30 | 13F | Traub Capital Management LLC | 0 | -100,00 | 0 | -100,00 | ||||
| 2026-04-08 | 13F | Wealth Science Advisors LLC | 10 | 2 | ||||||
| 2026-04-20 | 13F | Sowell Financial Services LLC | 1.328 | -2,99 | 270 | 15,95 | ||||
| 2026-02-11 | 13F | Fiera Capital Corp | 17.482 | -11,63 | 2.966 | -10,96 | ||||
| 2026-02-17 | 13F | Capital Fund Management S.a. | Call | 120.300 | -59,60 | 20.394 | -59,37 | |||
| 2026-04-24 | 13F | Profund Advisors Llc | 54.206 | 5,01 | 11.003 | 25,72 | ||||
| 2026-02-17 | 13F | Capital Fund Management S.a. | Put | 161.300 | -39,93 | 27.345 | -39,58 | |||
| 2026-04-07 | 13F | Howard Financial Services, Ltd. | 1.545 | 14,02 | 314 | 36,68 | ||||
| 2026-02-18 | 13F | Papamarkou Wellner Asset Management inc. | 0 | -100,00 | 0 | |||||
| 2026-04-24 | 13F | Old Peak Finance LLC | 2.982 | 0,00 | 605 | 19,80 | ||||
| 2026-02-17 | 13F | Russell Investments Group, Ltd. | 317.358 | 3,09 | 54.135 | 4,62 | ||||
| 2026-02-13 | 13F | Delos Wealth Advisors, LLC | 39.095 | -2,69 | 6.628 | -2,13 | ||||
| 2026-04-16 | 13F | Lee Johnson Capital Management, Llc | 0 | -100,00 | 0 | |||||
| 2026-04-16 | 13F | Capital Investment Advisors, LLC | 0 | -100,00 | 0 | |||||
| 2026-02-13 | 13F | Baird Financial Group, Inc. | 209.640 | 4,01 | 35.540 | 4,61 | ||||
| 2026-02-12 | 13F | Triumph Capital Management | 3 | 1 | ||||||
| 2026-02-13 | 13F | First Trust Advisors Lp | 161.067 | -10,41 | 27.310 | -9,85 | ||||
| 2026-02-17 | 13F | Credit Agricole S A | 49.136 | 0,25 | 8.330 | 0,84 | ||||
| 2026-02-10 | 13F | Peapack Gladstone Financial Corp | 1.698 | -10,54 | 0 | |||||
| 2026-02-05 | 13F | Elyxium Wealth, LLC | 14 | 2 | ||||||
| 2026-02-13 | 13F | Virtus ETF Advisers LLC | 1.696 | 276,89 | 316 | 200,95 | ||||
| 2026-01-12 | 13F | Castleview Partners, Llc | 1.400 | 237 | ||||||
| 2026-02-17 | 13F | Asset One Wealth Management LLC | 5.549 | 1.059 | ||||||
| 2026-02-17 | 13F | Nokomis Capital, L.L.C. | 0 | -100,00 | 0 | |||||
| 2026-02-12 | 13F | Cibc World Markets Corp | Call | 18.800 | -1,05 | 3.187 | 41,08 | |||
| 2026-02-13 | 13F | Healthcare Of Ontario Pension Plan Trust Fund | 78.000 | -54,91 | 13.229 | -54,59 | ||||
| 2026-02-13 | 13F | OMERS ADMINISTRATION Corp | 0 | -100,00 | 0 | |||||
| 2026-01-26 | 13F | Cwm, Llc | 6.964 | 5,95 | 1 | 0,00 | ||||
| 2026-02-10 | 13F | Godfrey Financial Associates, Inc. | 11 | 2 | ||||||
| 2026-02-19 | 13F | CI Private Wealth, LLC | 51.939 | 17,88 | 7.720 | 25,68 | ||||
| 2026-02-17 | 13F | Ancora Advisors, LLC | 360 | 7,46 | 61 | 8,93 | ||||
| 2026-04-22 | 13F | Nicholson Meyer Capital Management, Inc. | 2.889 | -21,09 | 586 | -5,48 | ||||
| 2026-02-17 | 13F | Cresset Asset Management, LLC | 2.424 | 23,30 | 411 | 23,87 | ||||
| 2026-02-13 | 13F | Kestra Advisory Services, LLC | 0 | -100,00 | 0 | |||||
| 2026-02-13 | 13F | Stifel Financial Corp | 259.822 | 0,25 | 44.048 | 0,83 | ||||
| 2026-02-17 | 13F | Knoll Capital Management, LLC | 52.750 | 0,00 | 8.943 | 0,57 | ||||
| 2025-11-05 | 13F | Anthracite Investment Company, Inc. | 0 | -100,00 | 0 | |||||
| 2026-02-05 | 13F | Cambridge Investment Research Advisors, Inc. | 42.050 | -14,69 | 7 | -12,50 | ||||
| 2026-02-13 | 13F | Pathstone Holdings, LLC | 29.465 | 12,35 | 4.995 | 13,01 | ||||
| 2026-02-11 | 13F | Zions Bancorporation, National Association /ut/ | 100 | 4,17 | 17 | 0,00 | ||||
| 2026-04-21 | 13F | Venturi Wealth Management, LLC | 1.426 | 289 | ||||||
| 2025-12-10 | 13F | Mainstay Capital Management Llc /adv | 0 | -100,00 | 0 | |||||
| 2026-04-16 | 13F | Baron Wealth Management LLC | 1.991 | 5,96 | 404 | 27,04 | ||||
| 2026-03-20 | 13F | Purpose Unlimited Inc. | 3.427 | 581 | ||||||
| 2026-04-07 | 13F | Farther Finance Advisors, LLC | 18.226 | 90,83 | 3.829 | 136,44 | ||||
| 2026-04-15 | 13F | Archford Capital Strategies, LLC | 1.000 | 203 | ||||||
| 2026-02-10 | 13F | Argent Trust Co | 5.865 | 0,00 | 994 | 0,61 | ||||
| 2026-02-11 | 13F | Buckingham Strategic Partners | 2.702 | 30,66 | 458 | 31,61 | ||||
| 2026-02-13 | 13F | Schroder Investment Management Group | 446.499 | 14,10 | 76.726 | 17,56 | ||||
| 2026-04-28 | 13F | Astoria Portfolio Advisors LLC. | 1.322 | -10,37 | 262 | -26,27 | ||||
| 2025-11-14 | 13F | Eqis Capital Management, Inc. | 0 | -100,00 | 0 | |||||
| 2026-02-13 | 13F | Sienna Gestion | 84.400 | 0,00 | 14.442 | 11,41 | ||||
| 2026-01-14 | 13F | Global View Capital Management LLC | 4.735 | -1,80 | 803 | -1,23 | ||||
| 2026-04-23 | 13F | MQS Management LLC | 0 | -100,00 | 0 | |||||
| 2026-02-18 | 13F | Garton & Associates Financial Advisors LLC | 314 | 53 | ||||||
| 2026-04-28 | 13F | Private Wealth Partners, LLC | 1.720 | 0,00 | 349 | 19,93 | ||||
| 2026-04-22 | 13F | Red Door Wealth Management, LLC | 1.760 | 0,00 | 357 | 19,80 | ||||
| 2026-04-23 | 13F | Oppenheimer & Co Inc | 33.033 | 6.705 | ||||||
| 2026-01-16 | 13F | Legacy Capital Wealth Partners, LLC | 1.412 | 239 | ||||||
| 2026-02-19 | 13F | Mcguire Capital Advisors Inc | 692 | 117 | ||||||
| 2026-04-16 | 13F | Toth Financial Advisory Corp | 7 | -46,15 | 1 | -50,00 | ||||
| 2026-02-13 | 13F | Dai-Ichi Life Insurance Company, Ltd | 5.200 | 62,50 | 882 | 63,45 | ||||
| 2026-02-13 | 13F | Bay Colony Advisory Group, Inc d/b/a Bay Colony Advisors | 4.335 | -9,65 | 735 | -9,16 | ||||
| 2026-02-12 | 13F | Hollencrest Capital Management | 55.906 | -6,86 | 9.478 | -6,33 | ||||
| 2026-04-15 | 13F | Client 1st Advisory Group, Llc | 1.138 | -16,81 | 231 | -0,43 | ||||
| 2026-02-11 | 13F | Tradition Wealth Management, LLC | 2.880 | 0,00 | 488 | 0,62 | ||||
| 2026-02-13 | 13F | Aigen Investment Management, Lp | 0 | -100,00 | 0 | |||||
| 2026-02-17 | 13F | GAM Holding AG | 1.800 | -30,77 | 306 | -30,37 | ||||
| 2026-02-17 | 13F | Wealth Watch Advisors, INC | 0 | -100,00 | 0 | |||||
| 2026-02-17 | 13F | Two Sigma Advisers, Lp | 5.746 | -72,14 | 974 | -71,98 | ||||
| 2026-04-24 | 13F | Financial Life Planners | 80 | 16 | ||||||
| 2026-01-20 | 13F | Cromwell Holdings LLC | 1.280 | 0,00 | 217 | 0,47 | ||||
| 2026-04-27 | 13F | Sound Income Strategies, LLC | 123 | 0,00 | 26 | 4,17 | ||||
| 2026-02-12 | 13F | Amitell Capital Pte Ltd | 0 | -100,00 | 0 | |||||
| 2026-02-17 | 13F | Jones Financial Companies Lllp | 12.405 | 34,22 | 2.103 | 39,27 | ||||
| 2025-11-13 | 13F | Jefferies Financial Group Inc. | 0 | -100,00 | 0 | |||||
| 2026-04-16 | 13F | Davis Capital Management | 8 | 0,00 | 2 | 0,00 | ||||
| 2025-11-14 | 13F | Ion Asset Management Ltd. | 10.530 | -4,88 | 1.775 | 34,80 | ||||
| 2026-02-09 | 13F | Arista Wealth Management, LLC | 1.800 | 305 | ||||||
| 2025-11-14 | 13F | Sagard Holdings Management Inc. | 0 | -100,00 | 0 | |||||
| 2026-01-26 | 13F | AE Wealth Management LLC | 1.391 | 2,58 | 236 | 3,07 | ||||
| 2026-02-09 | 13F | Knights of Columbus Asset Advisors LLC | 1.862 | -11,75 | 316 | -11,27 | ||||
| 2026-02-13 | 13F | Integrated Wealth Concepts LLC | 3.798 | -39,25 | 644 | -38,94 | ||||
| 2026-02-10 | 13F | Bruce G. Allen Investments, LLC | 647 | -1,22 | 110 | -0,91 | ||||
| 2026-02-13 | 13F | American Century Companies Inc | 997.625 | -2,34 | 169.146 | -1,74 | ||||
| 2026-02-06 | 13F | Larson Financial Group LLC | 764 | 5,23 | 130 | 5,74 | ||||
| 2026-03-04 | 13F | SHP Wealth Management | 34 | 6 | ||||||
| 2026-02-12 | 13F | Xponance, Inc. | 4.776 | 811 | ||||||
| 2026-04-23 | 13F | SevenBridge Financial Group, LLC | 1.865 | -9,77 | 381 | -14,61 | ||||
| 2026-04-13 | 13F | St Germain D J Co Inc | 44 | 0,00 | 9 | 14,29 | ||||
| 2026-02-05 | 13F | Atria Investments Llc | 4.167 | 87,03 | 706 | 88,27 | ||||
| 2026-04-07 | 13F | CoreCap Advisors, LLC | 1.764 | -49,02 | 358 | -38,91 | ||||
| 2026-02-05 | 13F | Plante Moran Financial Advisors, LLC | 300 | 0,00 | 51 | 0,00 | ||||
| 2026-02-09 | 13F | GeoSphere Capital Management | Put | 14.300 | 2.424 | |||||
| 2026-02-12 | 13F | Andra AP-fonden | 130.487 | 18,82 | 30.372 | 17,99 | ||||
| 2026-04-20 | 13F | Dagco, Inc. | 340 | 0,00 | 69 | 21,05 | ||||
| 2026-04-07 | 13F | Comprehensive Financial Planning, Inc./PA | 19 | 0,00 | 4 | 0,00 | ||||
| 2026-04-20 | 13F | Assenagon Asset Management S.A. | 16.811 | -52,99 | 3.401 | -43,99 | ||||
| 2026-02-09 | 13F | Investors Portfolio Services LLC | 200 | 34 | ||||||
| 2026-04-22 | 13F | Traveka Wealth, LLC | 1.051 | 213 | ||||||
| 2026-02-17 | 13F | Clear Street Markets Llc | 500 | 85 | ||||||
| 2026-02-13 | 13F | AlTi Global, Inc. | 9.230 | 2,66 | 1.565 | 3,23 | ||||
| 2026-04-15 | 13F | Corundum Trust Company, INC | 2.000 | 0,00 | 406 | 19,47 | ||||
| 2026-02-13 | 13F | Walleye Trading LLC | Call | 82.300 | -0,96 | 13.952 | -0,39 | |||
| 2026-02-13 | 13F | Walleye Trading LLC | 117.766 | 2,45 | 19.965 | 3,04 | ||||
| 2026-02-13 | 13F | Quarry LP | 120 | 160,87 | 20 | 185,71 | ||||
| 2026-02-13 | 13F | Walleye Trading LLC | Put | 107.500 | 14,48 | 18.224 | 15,15 | |||
| 2026-04-01 | 13F | Bangor Savings Bank | 0 | -100,00 | 0 | |||||
| 2026-02-12 | 13F | Hohimer Wealth Management, Llc | 0 | -100,00 | 0 | |||||
| 2026-02-10 | 13F | Bnp Paribas Arbitrage, Sa | 35.559 | 0,88 | 6.028 | 1,46 | ||||
| 2026-01-08 | 13F | GSG Advisors LLC | 6.000 | 0,00 | 1.017 | -0,39 | ||||
| 2026-02-10 | 13F | Bnp Paribas Arbitrage, Sa | Put | 491 | -28,94 | 8.324 | -28,54 | |||
| 2026-04-27 | 13F | Ethic Inc. | 2.010 | 58,27 | 408 | 89,30 | ||||
| 2026-02-10 | 13F | Bnp Paribas Arbitrage, Sa | Call | 258 | 44,13 | 4.374 | 44,95 | |||
| 2026-02-05 | 13F | Chase Investment Counsel Corp | 47.589 | -1,88 | 8 | 0,00 | ||||
| 2026-02-11 | 13F | Explore Capital Management, LLC | 35.400 | 0,00 | 6.001 | 0,57 | ||||
| 2026-04-07 | 13F | Estate Planners Group, LLC | 100 | 17 | ||||||
| 2026-02-14 | 13F | Whipplewood Advisors, LLC | 250 | 0,00 | 42 | 0,00 | ||||
| 2026-01-20 | 13F | Steel Peak Wealth Management LLC | 12.968 | 2.198 | ||||||
| 2025-11-06 | 13F | Blume Capital Management, Inc. | 0 | -100,00 | 0 | |||||
| 2026-04-09 | 13F | DHJJ Financial Advisors, Ltd. | 7 | 0,00 | 1 | 0,00 | ||||
| 2026-01-28 | 13F | Rather & Kittrell, Inc. | 2.415 | 0,12 | 409 | 0,74 | ||||
| 2026-02-11 | 13F | Doheny Asset Management /ca | 28.804 | 97,13 | 5 | 100,00 | ||||
| 2026-04-23 | 13F | Glass Jacobson Investment Advisors llc | 1.375 | 0,00 | 279 | 19,74 | ||||
| 2026-02-09 | 13F | Rhl Group, Llc | 19 | 3 | ||||||
| 2026-02-13 | 13F | Meixler Investment Management, Ltd. | 5.369 | -15,94 | 910 | -15,43 | ||||
| 2026-04-07 | 13F | Retirement Wealth Solutions LLC | 9 | 0,00 | 2 | 0,00 | ||||
| 2026-02-09 | 13F | Wellington Shields Capital Management, LLC | 3.800 | 0,00 | 644 | 0,63 | ||||
| 2026-04-13 | 13F | Fractal Investments LLC | 4.809 | 0,00 | 976 | 19,75 | ||||
| 2026-02-17 | 13F | Old Mission Capital Llc | 8.236 | 1.396 | ||||||
| 2026-02-11 | 13F | Capital Analysts, Inc. | 16.878 | -30,48 | 3 | -50,00 | ||||
| 2026-02-03 | 13F | Generali Asset Management SPA SGR | 333.174 | -4,72 | 65.055 | -3,61 | ||||
| 2026-02-13 | 13F | National Bank Of Canada /fi/ | Put | 1.110 | 33,57 | 18.822 | 34,46 | |||
| 2026-01-29 | 13F | Concurrent Investment Advisors, LLC | Put | 0 | -100,00 | 0 | -100,00 | |||
| 2026-04-15 | 13F | Hatch Cove Capital, Llc | 81.300 | -8,03 | 16.502 | 10,12 | ||||
| 2025-11-14 | 13F | Knightsbridge Asset Management, Llc | 1.985 | -9,65 | 335 | 27,97 | ||||
| 2026-02-17 | 13F | Zurich Insurance Group Ltd/FI | 214.886 | -47,05 | 36.475 | -46,59 | ||||
| 2026-04-10 | 13F | Perfromance Wealth Partners, LLC | 10.344 | 0,00 | 2.100 | 19,74 | ||||
| 2026-04-27 | 13F | Truist Financial Corp | 37.893 | -22,49 | 7.691 | -7,19 | ||||
| 2026-01-28 | 13F | Legacy Capital Group California, Inc. | 3.246 | 2,62 | 550 | 3,19 | ||||
| 2026-04-21 | 13F | Red Tortoise LLC | 7.269 | 0,00 | 1.475 | 19,72 | ||||
| 2026-02-17 | 13F | LaSalle St. Investment Advisors, LLC | 1.886 | 22,31 | 0 | |||||
| 2026-02-05 | 13F | Leuthold Group, Llc | 30.075 | -35,79 | 5.099 | -35,42 | ||||
| 2026-02-17 | 13F | Hollow Brook Wealth Management LLC | 0 | -100,00 | 0 | |||||
| 2025-11-07 | 13F | Beacon Capital Management, LLC | 0 | -100,00 | 0 | |||||
| 2026-02-11 | 13F | Capital International Inc /ca/ | 88.378 | 119,88 | 14.994 | 121,51 | ||||
| 2026-04-07 | 13F/A | Round Rock Advisors, LLC | 8.800 | -16,19 | 1.492 | -15,72 | ||||
| 2026-04-10 | 13F | Pure Financial Advisors, Inc. | 2.503 | 18,63 | 508 | 42,30 | ||||
| 2026-02-11 | 13F | Tiaa Trust, National Association | 1.180 | 200 | ||||||
| 2026-02-12 | 13F | Te Ahumairangi Investment Management Ltd | 27.940 | -7,14 | 4.744 | -6,39 | ||||
| 2026-04-06 | 13F | Highline Wealth Partners Llc | 36 | 38,46 | 7 | 75,00 | ||||
| 2026-01-21 | 13F | Portside Wealth Group, LLC | 16.027 | 8,83 | 2.717 | 9,47 | ||||
| 2026-02-13 | 13F | National Bank Of Canada /fi/ | Call | 1.053 | 51,73 | 17.855 | 52,75 | |||
| 2025-11-04 | 13F | Winnow Wealth Llc | 0 | -100,00 | 0 | |||||
| 2026-02-13 | 13F | Blueshift Asset Management, LLC | 0 | -100,00 | 0 | |||||
| 2026-01-28 | 13F | Cadinha & Co Llc | 11.211 | 249,14 | 1.901 | 251,20 | ||||
| 2026-02-12 | 13F | SWAN Capital LLC | 82 | 9,33 | 14 | 8,33 | ||||
| 2026-01-20 | 13F | Sanibel Captiva Trust Company, Inc. | 3.429 | 0,00 | 581 | 0,69 | ||||
| 2026-03-06 | 13F | Hsbc Holdings Plc | 14.779 | -98,20 | 2.522 | -98,18 | ||||
| 2025-11-14 | 13F | ICONIQ Capital, LLC | 0 | -100,00 | 0 | |||||
| 2026-01-21 | 13F | Azzad Asset Management Inc /adv | 32.363 | -0,58 | 5.486 | 0,00 | ||||
| 2026-04-22 | 13F | Skylands Capital, LLC | 24.255 | -0,61 | 4.923 | 19,00 | ||||
| 2026-02-10 | 13F | Connor, Clark & Lunn Investment Management Ltd. | 6.529.513 | 2,14 | 1.107.301 | 2,87 | ||||
| 2026-04-07 | 13F | U.S. Capital Wealth Advisors, LLC | 1.649 | -11,25 | 335 | 6,37 | ||||
| 2026-04-27 | 13F | Keating Investment Counselors Inc | 100.002 | -0,44 | 20.298 | 19,20 | ||||
| 2026-02-10 | 13F | Td Asset Management Inc | 9.665.456 | 1,74 | 1.641.239 | 2,55 | ||||
| 2026-04-16 | 13F | TB Alternative Assets Ltd. | 100.073 | -56,42 | 20.313 | -47,82 | ||||
| 2026-01-22 | 13F | Harwood Advisory Group, LLC | 100 | 0,00 | 17 | 0,00 | ||||
| 2026-02-17 | 13F | Engineers Gate Manager LP | 42.253 | 403,91 | 7.163 | 406,94 | ||||
| 2026-02-02 | 13F | Varma Mutual Pension Insurance Co | 141.252 | -10,35 | 23.985 | -9,63 | ||||
| 2025-11-07 | 13F | Cumberland Partners Ltd | 0 | -100,00 | 0 | |||||
| 2026-02-09 | 13F | Harbour Investments, Inc. | 4.049 | 16,32 | 686 | 17,06 | ||||
| 2026-02-13 | 13F | Resources Investment Advisors, LLC. | 4.980 | 6,50 | 844 | 7,11 | ||||
| 2026-02-11 | 13F | Gwn Securities Inc. | 5.087 | 52,26 | 863 | 52,57 | ||||
| 2026-02-17 | 13F | Laird Norton Trust Company, Llc | 13.404 | 2.272 | ||||||
| 2026-02-13 | 13F | Ridge Creek Global, Inc | 20.872 | 3.538 | ||||||
| 2026-04-27 | 13F | Y-Intercept (Hong Kong) Ltd | 56.962 | 11.562 | ||||||
| 2025-11-14 | 13F | Balyasny Asset Management Llc | Put | 0 | -100,00 | 0 | -100,00 | |||
| 2026-02-09 | 13F | Huntington National Bank | 351 | -28,95 | 60 | -28,92 | ||||
| 2026-04-24 | 13F | Vision Financial Markets Llc | 11 | 0,00 | 2 | 100,00 | ||||
| 2026-04-21 | 13F | Fulcrum Wealth Advisors, Llc | 1.024 | 208 | ||||||
| 2026-02-17 | 13F | Advisor Group Holdings, Inc. | Call | 1 | 0,00 | 6 | 50,00 | |||
| 2026-02-12 | 13F | APG Asset Management N.V. | 299.021 | -29,72 | 43.233 | -29,13 | ||||
| 2026-02-17 | 13F | Price T Rowe Associates Inc /md/ | 848.243 | 0,65 | 144 | 0,70 | ||||
| 2026-02-13 | 13F | Brown Advisory Inc | 3.598 | 4,20 | 610 | 4,64 | ||||
| 2026-01-26 | 13F | Private Trust Co Na | 411 | 30,06 | 70 | 30,19 | ||||
| 2026-02-02 | 13F | Cornerstone Planning Group LLC | 69 | -13,75 | 15 | 200,00 | ||||
| 2026-04-16 | 13F | CogentBlue Wealth Advisors, LLC | 1.027 | 208 | ||||||
| 2026-02-13 | 13F | Essex Investment Management Co Llc | 40.022 | -2,01 | 6.785 | -1,45 | ||||
| 2026-02-10 | 13F | Natixis Advisors, L.p. | 85.125 | 0,43 | 14 | 0,00 | ||||
| 2026-02-17 | 13F | Utah Retirement Systems | 55.950 | 0,00 | 9.501 | 0,80 | ||||
| 2026-01-23 | 13F | Rsm Us Wealth Management Llc | 10.381 | 8,06 | 1.784 | 10,13 | ||||
| 2026-02-11 | 13F | Erste Asset Management GmbH | 124.249 | 21.305 | ||||||
| 2026-02-13 | 13F | MAI Capital Management | 236 | 80,15 | 40 | 81,82 | ||||
| 2026-01-28 | 13F | Chicago Partners Investment Group LLC | 3.305 | 23,83 | 709 | 69,62 | ||||
| 2026-02-13 | 13F | Victory Capital Management Inc | 54.893 | 67,81 | 9.306 | 68,80 | ||||
| 2026-01-15 | 13F | Mn Services Vermogensbeheer B.V. | 81.100 | -11,46 | 14 | -13,33 | ||||
| 2026-02-10 | 13F | Phillips Wealth Planners LLC | 1.577 | 324 | ||||||
| 2026-01-13 | 13F | Stephens Consulting, LLC | 500 | 0,00 | 85 | 0,00 | ||||
| 2026-04-29 | 13F | Staley Capital Advisers Inc | 63.400 | -0,78 | 12.869 | 18,80 | ||||
| 2026-02-10 | 13F | David R. Rahn & Associates Inc. | 14.981 | 0,00 | 2.540 | 0,55 | ||||
| 2026-01-21 | 13F | Newbridge Financial Services Group, Inc. | 104 | -97,02 | 18 | -97,11 | ||||
| 2026-01-22 | 13F | Hager Investment Management Services, Llc | 200 | 0,00 | 34 | 0,00 | ||||
| 2026-02-13 | 13F | Change Path, LLC | 0 | -100,00 | 0 | |||||
| 2026-02-17 | 13F | Blair William & Co/il | 14.793 | -14,25 | 2.508 | -13,76 | ||||
| 2026-02-11 | 13F | Capital International Ltd /ca/ | 74.842 | -0,65 | 12.694 | 0,05 | ||||
| 2026-02-10 | 13F | Hillsdale Investment Management Inc. | 414.943 | 1,65 | 70.492 | 2,55 | ||||
| 2025-10-30 | 13F | Twin Peaks Wealth Advisors, LLC | 0 | -100,00 | 0 | |||||
| 2026-04-13 | 13F | Bank of New Hampshire | 314 | 64 | ||||||
| 2026-02-12 | 13F | Skandinaviska Enskilda Banken AB (publ) | 106.332 | -2,40 | 18.075 | -1,56 | ||||
| 2026-04-29 | 13F | Montag A & Associates Inc | 500 | 0,00 | 101 | 20,24 | ||||
| 2026-02-02 | 13F | Avidian Wealth Solutions, LLC | 5.069 | -0,78 | 859 | -0,23 | ||||
| 2026-02-12 | 13F | BlackRock, Inc. | 664.055 | 6,65 | 112.577 | 7,26 | ||||
| 2026-02-17 | 13F | First Manhattan Co | 1.405 | 11,07 | 238 | 11,74 | ||||
| 2026-02-10 | 13F | Greenwich Wealth Management LLC | 0 | -100,00 | 0 | |||||
| 2026-02-10 | 13F | Foundations Investment Advisors, LLC | 1.800 | 34,83 | 305 | 35,56 | ||||
| 2026-02-04 | 13F | Valeo Financial Advisors, LLC | 2.210 | 27,38 | 375 | 28,08 | ||||
| 2026-02-17 | 13F | Old West Investment Management, LLC | 107.152 | 4,00 | 18.166 | 4,60 | ||||
| 2026-04-08 | 13F | Sapient Capital Llc | 9.143 | -4,33 | 1.856 | 13,18 | ||||
| 2026-02-13 | 13F | Pinpoint Asset Management (Singapore) Pte. Ltd. | 3.217 | 545 | ||||||
| 2026-02-13 | 13F | Lansdowne Partners (uk) Llp | 4.553 | 0,00 | 772 | 0,52 | ||||
| 2026-02-13 | 13F | Citigroup Inc | 311.401 | 5,85 | 52.877 | 6,69 | ||||
| 2026-04-23 | 13F | Sawyer & Company, Inc | 190 | 0,00 | 39 | 18,75 | ||||
| 2026-02-17 | 13F | Raymond James Financial Inc | 650.951 | 4,42 | 110.356 | 5,02 | ||||
| 2026-02-13 | 13F | Beutel, Goodman & Co Ltd. | 40.337 | -12,44 | 7 | -14,29 | ||||
| 2026-02-09 | 13F | Williamson Legacy Group, LLC | 14.875 | 16,52 | 2.522 | 17,20 | ||||
| 2026-04-13 | 13F | Nvest Wealth Strategies, Inc. | 5 | 1 | ||||||
| 2026-02-13 | 13F | Citigroup Inc | Call | 170.000 | 17,24 | 28.867 | 18,17 | |||
| 2026-02-13 | 13F | Citigroup Inc | Put | 225.000 | 0,00 | 38.206 | 0,80 | |||
| 2026-02-12 | 13F | Insigneo Advisory Services, Llc | 1.918 | -5,14 | 325 | -4,41 | ||||
| 2026-02-13 | 13F | Charles Schwab Investment Management Inc | 1.201.617 | 3,19 | 204.040 | 4,02 | ||||
| 2026-02-02 | 13F | Principal Financial Group Inc | 64.089 | 8,17 | 10.883 | 9,04 | ||||
| 2026-02-10 | 13F/A | Northwestern Mutual Wealth Management Co | 2.570 | -6,75 | 436 | -6,25 | ||||
| 2026-02-13 | 13F | Gts Securities Llc | 0 | -100,00 | 0 | |||||
| 2025-11-24 | 13F | Greenfield Seitz Capital Management, LLC | 0 | -100,00 | 0 | |||||
| 2026-04-28 | 13F | ORG Wealth Partners, LLC | 156 | 20,00 | 32 | 40,91 | ||||
| 2026-04-27 | 13F | Td Private Client Wealth Llc | 16 | 77,78 | 3 | 200,00 | ||||
| 2026-04-29 | 13F | Clare Market Investments LLC | 11.285 | 5,47 | 2.291 | 27,01 | ||||
| 2026-02-13 | 13F | Motiv8 Investments LLC | 9 | 0 | ||||||
| 2026-03-05 | 13F | Gunpowder Capital Management, LLC dba Oliver Wealth Management | 58 | 10 | ||||||
| 2026-02-17 | 13F | SageView Advisory Group, LLC | 217 | 37 | ||||||
| 2026-02-12 | 13F | Philadelphia Trust Co | 4.001 | -6,89 | 1 | |||||
| 2026-02-09 | 13F | Smithfield Trust Co | 2.368 | 0,00 | 0 | |||||
| 2026-02-12 | 13F | Barings Llc | 45.029 | 0,00 | 7.636 | 0,71 | ||||
| 2026-02-17 | 13F | FIL Ltd | 12.880.609 | -19,82 | 2.184.311 | -19,28 | ||||
| 2026-02-13 | 13F | Macquarie Group Ltd | 0 | -100,00 | 0 | |||||
| 2026-02-18 | 13F | Guardian Capital Lp | 1.024.503 | 8,91 | 173.820 | 9,68 | ||||
| 2026-02-11 | 13F | Saturna Capital CORP | 25.731 | 4.362 | ||||||
| 2026-02-05 | 13F | AustralianSuper Pty Ltd | 145.079 | 1,97 | 24.603 | 2,69 | ||||
| 2025-11-13 | 13F | Riggs Asset Managment Co. Inc. | 0 | -100,00 | 0 | |||||
| 2026-04-10 | 13F | Salvus Wealth Management, LLC | 3.528 | -44,01 | 716 | -32,96 | ||||
| 2026-04-08 | 13F | Miracle Mile Advisors, LLC | 4.235 | 13,39 | 860 | 35,70 | ||||
| 2026-02-17 | 13F | ION Fund Management Ltd | 10.000 | 1.695 | ||||||
| 2026-02-13 | 13F | FORA Capital, LLC | 0 | -100,00 | 0 | |||||
| 2026-02-17 | 13F | Guardian Partners Inc. | 0 | -100,00 | 0 | |||||
| 2026-02-17 | 13F | Nearwater Capital Markets, Ltd | 0 | -100,00 | 0 | |||||
| 2026-02-12 | 13F | Great Valley Advisor Group, Inc. | 2.862 | -9,32 | 486 | -8,83 | ||||
| 2026-04-08 | 13F | Cadent Capital Advisors, LLC | 0 | -100,00 | 0 | |||||
| 2026-02-04 | 13F | Aubrey Capital Management Ltd | 5.294 | 908 | ||||||
| 2026-02-17 | 13F | Susquehanna Fundamental Investments, Llc | 54.900 | 46,01 | 9.307 | 46,87 | ||||
| 2026-04-17 | 13F | Essex Savings Bank | 1.352 | 1,58 | 274 | 21,78 | ||||
| 2026-04-23 | 13F | First Pacific Financial | 90 | 18 | ||||||
| 2026-01-28 | 13F | DekaBank Deutsche Girozentrale | 1.317.039 | 0,00 | 95 | -56,28 | ||||
| 2025-11-12 | 13F | Creekmur Asset Management LLC | 2 | 0,00 | 0 | |||||
| 2025-11-14 | 13F | SIG North Trading, ULC | 0 | -100,00 | 0 | -100,00 | ||||
| 2026-02-12 | 13F | Callan Family Office, LLC | 1.328 | 225 | ||||||
| 2026-04-22 | 13F | Quattro Financial Advisors Llc | 0 | -100,00 | 0 | |||||
| 2026-02-04 | 13F | Plato Investment Management Ltd | 11.510 | -40,94 | 1.964 | -39,75 | ||||
| 2026-02-17 | 13F | Bamco Inc /ny/ | 14.922 | -30,49 | 2.530 | -30,10 | ||||
| 2026-04-29 | 13F | IAG Wealth Partners, LLC | 254 | -10,88 | 52 | 6,25 | ||||
| 2026-02-17 | 13F | Bramshill Investments, LLC | 6.168 | 0,52 | 1.046 | 1,06 | ||||
| 2026-02-10 | 13F | Private Wealth Asset Management, LLC | 16 | 0,00 | 3 | 0,00 | ||||
| 2026-04-22 | 13F | Louisbourg Investments Inc. | 800 | -44,25 | 162 | -33,33 | ||||
| 2026-02-27 | 13F | Strategic Investment Solutions, Inc. /IL | 900 | 153 | ||||||
| 2026-01-15 | 13F | Nisa Investment Advisors, Llc | 580 | 98 | ||||||
| 2026-02-17 | 13F | WFA of San Diego, LLC | 0 | -100,00 | 0 | |||||
| 2026-04-16 | 13F | Diversified Trust Co | 1.027 | 208 | ||||||
| 2026-02-04 | 13F | St. James Investment Company, LLC | 240.693 | -1,41 | 40.805 | -0,84 | ||||
| 2026-02-06 | 13F/A | Rathbone Brothers plc | 57.910 | 7,43 | 9.831 | 8,25 | ||||
| 2026-02-13 | 13F | Apriem Advisors | 55.230 | 0,00 | 9.363 | 0,58 | ||||
| 2026-04-14 | 13F | Jeppson Wealth Management, Llc | 2.120 | 0,00 | 430 | 19,78 | ||||
| 2026-04-27 | 13F | PFG Investments, LLC | 4.205 | 0,33 | 853 | 20,14 | ||||
| 2026-02-11 | 13F | Investors Towarzystwo Funduszy Inwestycyjnych Spolka Akcyjna | 2.745 | 466 | ||||||
| 2026-02-13 | 13F | Smartleaf Asset Management LLC | 1.230 | 85,52 | 211 | 91,82 | ||||
| 2026-02-13 | 13F | Visionary Wealth Advisors | 31.836 | 0,64 | 5.397 | 1,22 | ||||
| 2026-04-17 | 13F | Vermillion Wealth Management, Inc. | 32 | -36,00 | 6 | -25,00 | ||||
| 2026-02-09 | 13F | Keating Financial Advisory Services, Inc. | 70 | 12 | ||||||
| 2026-01-29 | 13F | Vanguard Group Inc | 20.979.666 | 1,50 | 3.557.772 | 2,19 | ||||
| 2026-03-03 | 13F/A | Caitong International Asset Management Co., Ltd | 5.619 | 953 | ||||||
| 2026-02-13 | 13F | Pin Oak Investment Advisors Inc | 5.995 | -0,61 | 1 | -99,90 | ||||
| 2025-11-14 | 13F | Sofos Investments, Inc. | 0 | -100,00 | 0 | |||||
| 2026-02-13 | 13F | BNP Paribas Asset Management Holding S.A. | 491.315 | 9.018,69 | 109 | |||||
| 2026-04-27 | 13F | La Banque Postale Asset Management SA | 92.929 | -27,69 | 18.863 | -13,42 | ||||
| 2026-02-17 | 13F | Millennium Management Llc | Call | 55.300 | 77,24 | 9.375 | 78,27 | |||
| 2026-02-17 | 13F | Millennium Management Llc | Put | 26.300 | 721,88 | 4.459 | 727,09 | |||
| 2026-02-17 | 13F | Millennium Management Llc | 255.734 | -48,40 | 43.369 | -48,08 | ||||
| 2026-04-21 | 13F | PDS Planning, Inc | 2.158 | -0,14 | 438 | 19,67 | ||||
| 2026-02-11 | 13F | Parallel Advisors, LLC | 1.921 | 2,07 | 326 | 2,52 | ||||
| 2026-02-12 | 13F | Resurgent Financial Advisors LLC | 1.587 | 0,00 | 269 | 0,75 | ||||
| 2026-02-13 | 13F | Arrowstreet Capital, Limited Partnership | 8.629.935 | 0,47 | 1.463.166 | 1,08 | ||||
| 2026-04-15 | 13F | Steadtrust LLC | 73.379 | -4,25 | 14.894 | 14,65 | ||||
| 2026-01-21 | 13F | Modera Wealth Management, LLC | 3.564 | 6,17 | 604 | 6,90 | ||||
| 2026-02-10 | 13F | Bnp Paribas | 225 | 0,00 | 38 | 2,70 | ||||
| 2026-02-13 | 13F | 1832 Asset Management L.P. | 3.711.480 | 118,52 | 629.207 | 119,78 | ||||
| 2026-04-24 | 13F | Sumitomo Mitsui DS Asset Management Company, Ltd | 5.389 | 2,34 | 1.094 | 22,53 | ||||
| 2026-04-09 | 13F | Wealth Alliance Advisory Group, LLC | 2.055 | -0,19 | 417 | 19,48 | ||||
| 2026-02-12 | 13F | Quadrant Capital Group Llc | 10.285 | -0,26 | 1.744 | 0,29 | ||||
| 2026-02-13 | 13F | Inspire Advisors, LLC | 5.369 | 0,77 | 910 | 1,34 | ||||
| 2026-04-20 | 13F | Provenance Wealth Advisors, LLC | 1.840 | 0,00 | 373 | 19,94 | ||||
| 2026-04-16 | 13F | Annex Advisory Services, LLC | 17.012 | -16,66 | 3.453 | -0,20 | ||||
| 2026-01-27 | 13F | Journey Advisory Group, LLC | 25.627 | -3,36 | 4.345 | -2,80 | ||||
| 2026-02-12 | 13F | Bank Of Nova Scotia Trust Co | 23.559 | 0,26 | 3.994 | 0,83 | ||||
| 2026-02-13 | 13F | Bank Of Nova Scotia | 1.084.889 | -47,59 | 183.971 | -47,22 | ||||
| 2026-03-06 | 13F | Hsbc Holdings Plc | Call | 0 | -100,00 | 0 | ||||
| 2026-03-06 | 13F | Hsbc Holdings Plc | Put | 0 | -100,00 | 0 | ||||
| 2026-02-09 | 13F | Fidelis Capital Partners, LLC | 7.217 | -6,21 | 1.223 | -5,71 | ||||
| 2026-02-18 | 13F | Achmea Investment Management B.V. | 0 | -100,00 | 0 | |||||
| 2026-02-17 | 13F | Ameriflex Group, Inc. | 8 | -50,00 | 1 | -50,00 | ||||
| 2026-01-27 | 13F | Evergreen Capital Management Llc | 7.886 | 4,85 | 1.337 | 5,45 | ||||
| 2026-02-17 | 13F | Prelude Capital Management, Llc | 1.622 | -51,25 | 275 | -51,07 | ||||
| 2026-01-28 | 13F | Arizona State Retirement System | 0 | -100,00 | 0 | |||||
| 2026-02-05 | 13F | Financial Security Advisor, Inc. | 1.386 | 0,00 | 235 | 0,43 | ||||
| 2026-04-08 | 13F | Sfm, Llc | 1.073 | 218 | ||||||
| 2026-01-20 | 13F | Cigna Investments Inc /new | 9.054 | -0,57 | 2 | 0,00 | ||||
| 2026-04-24 | 13F | United Community Bank | 867 | -38,60 | 176 | -26,78 | ||||
| 2026-02-18 | 13F | VGI Partners Ltd | 87.096 | -48,44 | 14.765 | -48,14 | ||||
| 2026-04-28 | 13F | Kingswood Wealth Advisors, Llc | 2.617 | 2,63 | 531 | 22,92 | ||||
| 2026-01-14 | 13F | ORG Partners LLC | 140 | 0,00 | 24 | 0,00 | ||||
| 2026-01-27 | 13F | Zurcher Kantonalbank (Zurich Cantonalbank) | 290.913 | 25,96 | 49.399 | 26,97 | ||||
| 2026-04-16 | 13F | Brookstone Capital Management | 1.740 | 8,28 | 353 | 29,78 | ||||
| 2026-01-29 | 13F | Advisors Capital Management, LLC | 126.471 | 3,26 | 21.441 | 3,86 | ||||
| 2026-02-13 | 13F | Ubs Asset Management Americas Inc | 69.254 | -15,21 | 11.741 | -14,72 | ||||
| 2026-04-24 | 13F | Keybank National Association/oh | 5.330 | 15,52 | 1.082 | 38,24 | ||||
| 2026-01-06 | 13F | E Six Thirteen, Llc | 3.432 | 582 | ||||||
| 2026-04-10 | 13F | Magnus Financial Group LLC | 1.037 | 210 | ||||||
| 2026-02-03 | 13F | Ballentine Partners, LLC | 1.502 | -13,13 | 255 | -12,71 | ||||
| 2026-02-13 | 13F | PCM Encore, LLC | 3.954 | 670 | ||||||
| 2026-04-23 | 13F | Capital Management Corp /va | 130.166 | -2,88 | 26.421 | 16,29 | ||||
| 2026-04-09 | 13F | Towarzystwo Funduszy Inwestycyjnych Allianz Polska S.A. | 29.726 | 44,12 | 6.021 | 69,80 | ||||
| 2026-04-21 | 13F | Vanguard Capital Wealth Advisors This fund is a listed as child fund of Vanguard Group Inc and if that institution has disclosed ownership in this security, then these positions will not be double counted when calculating total shares and total value | 0 | -100,00 | 0 | |||||
| 2026-04-23 | 13F | North Star Investment Management Corp. | 32 | 14,29 | 6 | 50,00 | ||||
| 2026-04-22 | 13F | Caldwell Trust Co | 370 | 0,00 | 75 | 20,97 | ||||
| 2026-04-06 | 13F | GAMMA Investing LLC | 128 | 0,00 | 26 | 19,05 | ||||
| 2026-02-10 | 13F | CIBC World Markets Inc. | 3.539.924 | 12,46 | 600.371 | 13,27 | ||||
| 2026-02-10 | 13F | CIBC World Markets Inc. | Put | 20.000 | 0,00 | 3.392 | 0,74 | |||
| 2026-04-17 | 13F | Cidel Asset Management Inc | 13.740 | 3,32 | 2.780 | 23,12 | ||||
| 2026-02-13 | 13F | Wexford Capital Lp | 4.693 | 202,97 | 796 | 204,60 | ||||
| 2026-04-17 | 13F | 55 North Private Wealth, LLC | 1.085 | -45,17 | 220 | -34,33 | ||||
| 2026-02-17 | 13F | Hilltop Holdings Inc. | 4.297 | -14,20 | 728 | -13,74 | ||||
| 2026-02-10 | 13F | CIBC World Markets Inc. | Call | 2.600 | -97,84 | 441 | -97,83 | |||
| 2026-02-11 | 13F | Strategic Advocates LLC | 2 | 0,00 | 0 | |||||
| 2026-01-23 | 13F | Bridgewater Advisors Inc. | 2.448 | -3,36 | 503 | 24,57 | ||||
| 2026-04-20 | 13F | Longview Financial Advisors, Inc. | 32 | 6 | ||||||
| 2026-02-13 | 13F | Arete Wealth Advisors, LLC | 2.143 | -22,80 | 0 | |||||
| 2026-04-07 | 13F | Eastern Bank | 908 | -29,67 | 184 | -15,60 | ||||
| 2026-02-17 | 13F | XTX Topco Ltd | 0 | -100,00 | 0 | |||||
| 2026-04-27 | 13F | Pensionmark Financial Group, Llc | 5.098 | -5,40 | 1.035 | 13,25 | ||||
| 2026-01-16 | 13F | Trust Co Of Vermont | 133 | 0,00 | 23 | 0,00 | ||||
| 2026-02-18 | 13F | EP Wealth Advisors, Inc. | 3.922 | 44,56 | 665 | 106,21 | ||||
| 2026-02-13 | 13F | Dynamic Technology Lab Private Ltd | 11.590 | 209,89 | 1.965 | 211,41 | ||||
| 2026-02-23 | 13F | Beaird Harris Wealth Management, LLC | 120 | 0,00 | 20 | 0,00 | ||||
| 2026-02-09 | 13F | Kingsview Wealth Management, LLC | 2.042 | -54,53 | 346 | -54,29 | ||||
| 2026-02-04 | 13F | Ameritas Advisory Services, LLC | 0 | -100,00 | 0 | -100,00 | ||||
| 2026-02-17 | 13F | Driehaus Capital Management Llc | 209.200 | -37,31 | 35.477 | -36,88 | ||||
| 2026-01-30 | 13F | New Harbor Financial Group, LLC | 2.080 | 10,93 | 353 | 11,39 | ||||
| 2026-02-02 | 13F | Hussman Strategic Advisors, Inc. | 12.200 | -52,16 | 2.068 | -51,88 | ||||
| 2026-02-17 | 13F | Two Sigma Securities, Llc | 0 | -100,00 | 0 | |||||
| 2026-04-22 | 13F | Union Bancaire Privee, UBP SA | 19.454 | 226,52 | 2.468 | 174,42 | ||||
| 2026-02-11 | 13F | HC Advisors, LLC | 0 | -100,00 | 0 | |||||
| 2026-02-11 | 13F | Franklin Resources Inc | 993.996 | -2,92 | 168.531 | -3,14 | ||||
| 2026-02-12 | 13F | Integrated Quantitative Investments LLC | 8.038 | 0,00 | 1.363 | 0,59 | ||||
| 2026-01-22 | 13F | Massachusetts Financial Services Co /ma/ | 11.672.706 | -0,34 | 1.978.874 | 0,23 | ||||
| 2025-11-13 | 13F | Wealth High Governance Capital Ltda | 0 | -100,00 | 0 | |||||
| 2026-02-13 | 13F | Diametric Capital, LP | 0 | -100,00 | 0 | |||||
| 2026-04-29 | 13F | Cvfg Llc | 10.808 | 2.194 | ||||||
| 2026-04-27 | 13F | Turtle Creek Wealth Advisors, LLC | 1.650 | 0,00 | 335 | 19,71 | ||||
| 2026-02-13 | 13F | Financial Sense Advisors, Inc. | 35.767 | 2,22 | 6.064 | 2,80 | ||||
| 2026-02-17 | 13F | Keebeck Alpha, LP | 1.622 | -30,98 | 275 | -30,81 | ||||
| 2026-02-13 | 13F | Mariner, LLC | 76.262 | 41,20 | 12.933 | 42,05 | ||||
| 2026-02-12 | 13F | Commonwealth Equity Services, Llc | 40.287 | -14,38 | 6.830 | 97.457,14 | ||||
| 2026-02-17 | 13F | Condire Management, LP | 95.186 | 0,00 | 16.137 | 0,57 | ||||
| 2026-01-29 | 13F | Quadcap Wealth Management, LLC | 9.031 | 6,18 | 1.531 | 6,84 | ||||
| 2026-04-24 | 13F | Greystone Financial Group, LLC | 1.084 | -74,67 | 220 | -69,66 | ||||
| 2026-01-29 | 13F | IMC-Chicago, LLC | 10.726 | 1.818 | ||||||
| 2026-02-13 | 13F | Prospector Partners Llc | 21.100 | -46,01 | 3.577 | -45,70 | ||||
| 2026-01-29 | 13F | IMC-Chicago, LLC | Put | 356.900 | 19,48 | 60.505 | 20,17 | |||
| 2026-01-30 | 13F/A | M&t Bank Corp | 15.517 | -0,88 | 2.631 | -0,30 | ||||
| 2026-02-12 | 13F | JPL Wealth Management, LLC | 0 | -100,00 | 0 | |||||
| 2026-01-29 | 13F | IMC-Chicago, LLC | Call | 445.100 | 11,08 | 75.458 | 11,72 | |||
| 2026-02-12 | 13F | Marex Group plc | 42.943 | -5,58 | 7.280 | -5,04 | ||||
| 2026-02-13 | 13F | Royal London Asset Management Ltd | 689.171 | 3,34 | 116.835 | 3,94 | ||||
| 2026-02-12 | 13F | Jane Street Group, Llc | Call | 530.600 | -16,74 | 89.953 | -16,26 | |||
| 2026-02-12 | 13F | Jane Street Group, Llc | Put | 174.300 | -6,44 | 29.549 | -5,90 | |||
| 2026-04-29 | 13F | Frank, Rimerman Advisors LLC | 1.274 | 259 | ||||||
| 2026-02-12 | 13F | Jane Street Group, Llc | 86.119 | -86,35 | 14.600 | -86,27 | ||||
| 2026-02-09 | 13F | Beck Bode, LLC | 3.070 | -10,21 | 520 | -9,72 | ||||
| 2026-02-10 | 13F | CIBC Asset Management Inc | 4.838.011 | -3,45 | 822.797 | -2,64 | ||||
| 2026-02-12 | 13F | Chilton Capital Management Llc | 3.191 | 0,00 | 541 | 0,56 | ||||
| 2026-02-06 | 13F | Global Retirement Partners, LLC | 2.799 | -48,90 | 475 | -48,65 | ||||
| 2026-02-04 | 13F | Muhlenkamp & Co Inc | 151.269 | -0,03 | 25.645 | 0,55 | ||||
| 2026-04-15 | 13F | Optivise Advisory Services LLC | 1.202 | -8,59 | 244 | 9,91 | ||||
| 2026-02-18 | 13F | Caitlin John, LLC | 332 | 54,42 | 56 | 55,56 | ||||
| 2025-11-12 | 13F | Ci Investments Inc. | 0 | -100,00 | 0 | |||||
| 2026-02-13 | 13F | Kcm Investment Advisors Llc | 1.677 | 284 | ||||||
| 2026-02-06 | 13F | Gsa Capital Partners Llp | 2.978 | -7,05 | 1 | |||||
| 2026-01-29 | 13F | J.P. Marvel Investment Advisors, LLC | 14.377 | 0,00 | 2.437 | 0,58 | ||||
| 2026-02-17 | 13F | Amundi | 3.378.692 | -6,08 | 572.790 | -6,56 | ||||
| 2026-02-17 | 13F | Liontrust Investment Partners LLP | 151.869 | 0,00 | 25.746 | 0,57 | ||||
| 2026-01-26 | 13F | KBC Group NV | 10.518 | -9,16 | 2 | 0,00 | ||||
| 2026-04-20 | 13F | Cardinal Point Capital Management, ULC | 69.101 | -0,41 | 13.998 | 18,80 | ||||
| 2026-01-27 | 13F | Werba Rubin Papier Wealth Management | 0 | -100,00 | 0 | -100,00 | ||||
| 2026-04-08 | 13F | Wealth Enhancement Trust Services, Inc. | 1.747 | -14,36 | 355 | 2,61 | ||||
| 2026-02-11 | 13F | Deutsche Bank Ag\ | 8.570.961 | 4,20 | 1.453.035 | 4,80 | ||||
| 2026-02-13 | 13F | Dixon Mitchell Investment Counsel Inc. | 3.024 | 513 | ||||||
| 2026-02-13 | 13F | Entropy Technologies, LP | 9.493 | 1.609 | ||||||
| 2026-04-21 | 13F | Pflug Koory, LLC | 1.723 | 0,00 | 350 | 19,52 | ||||
| 2026-01-29 | 13F | Munich Reinsurance Co Stock Corp in Munich | 6.011 | 577,68 | 1.034 | 593,29 | ||||
| 2026-02-13 | 13F | Ossiam | 14.877 | -59,72 | 2.526 | -59,40 | ||||
| 2026-04-23 | 13F | Ewa, Llc | 1.330 | 0,99 | 270 | 20,63 | ||||
| 2026-04-10 | 13F | Baker Tilly Financial, Llc | 1.419 | 8,90 | 288 | 30,91 | ||||
| 2026-02-09 | 13F | Green Square Capital Advisors Llc | 7.130 | -0,70 | 1.209 | 41,62 | ||||
| 2026-02-12 | 13F | Brinker Capital Investments, LLC | 29.251 | 57,21 | 4.959 | 58,10 | ||||
| 2026-02-17 | 13F | Paulson & Co. Inc. | 783.561 | 0,00 | 132.837 | 0,58 | ||||
| 2026-02-03 | 13F | Cheviot Value Management, LLC | 425.853 | -8,01 | 94.961 | 30,83 | ||||
| 2026-04-27 | 13F | Counterpoint Mutual Funds LLC | 20.744 | 4.211 | ||||||
| 2026-02-05 | 13F | Mount Lucas Management LP | 9.621 | -1,67 | 1.631 | -1,09 | ||||
| 2026-02-17 | 13F | Quantessence Capital LLC | 0 | -100,00 | 0 | |||||
| 2026-01-23 | 13F | Gibbs Wealth Management | 10.387 | -20,69 | 1.985 | -10,06 | ||||
| 2026-01-16 | 13F | Tower Wealth Partners, Inc. | 0 | -100,00 | 0 | |||||
| 2026-04-23 | 13F | SJS Investment Consulting Inc. | 99 | -22,05 | 20 | -4,76 | ||||
| 2026-02-17 | 13F | Canada Pension Plan Investment Board | 3.635.686 | 47,83 | 616.560 | 48,88 | ||||
| 2026-04-23 | 13F | Spinnaker Trust | 3.446 | 0,00 | 699 | 19,69 | ||||
| 2026-02-17 | 13F | Advisory Services Network, LLC | 21.535 | 3,98 | 3.651 | 4,55 | ||||
| 2026-02-17 | 13F | Dauntless Investment Group, LLC | 320 | -98,77 | 54 | -98,77 | ||||
| 2026-02-17 | 13F | Bank Of America Corp /de/ | 5.474.453 | -2,87 | 928.084 | -2,31 | ||||
| 2026-01-30 | 13F | Valued Wealth Advisors LLC | 40 | 0,00 | 7 | 0,00 | ||||
| 2026-02-17 | 13F | Citadel Advisors Llc | Put | 819.400 | -10,19 | 138.913 | -9,68 | |||
| 2026-02-17 | 13F | Citadel Advisors Llc | Call | 764.600 | -32,16 | 129.623 | -31,77 | |||
| 2026-01-21 | 13F | Prime Capital Investment Advisors, LLC | 1.721 | 1,12 | 292 | 1,75 | ||||
| 2025-11-06 | 13F | Wealthstream Advisors, Inc. | 1.220 | 206 | ||||||
| 2026-02-10 | 13F | Hazlett, Burt & Watson, Inc. | 60 | 0 | ||||||
| 2026-02-13 | 13F | Marshall Wace, Llp | Put | 100 | 17 | |||||
| 2026-02-13 | 13F | Marshall Wace, Llp | 5.555 | 942 | ||||||
| 2026-02-17 | 13F | Citadel Advisors Llc | 203.892 | 29,06 | 34.566 | 29,80 | ||||
| 2026-02-09 | 13F | Expressive Wealth LLC | 2.012 | 341 | ||||||
| 2025-11-10 | 13F | Everstar Asset Management, LLC | 0 | -100,00 | 0 | -100,00 | ||||
| 2026-04-10 | 13F | Abound Wealth Management | 209 | 0,00 | 42 | 20,00 | ||||
| 2026-04-21 | 13F | Wedbush Securities Inc | 6.453 | 5,80 | 1 | 0,00 | ||||
| 2026-02-13 | 13F | Eschler Asset Management LLP | 0 | -100,00 | 0 | -100,00 | ||||
| 2026-02-17 | 13F | Investment Management Corp of Ontario | 89.814 | 84,24 | 15.226 | 85,30 | ||||
| 2026-04-01 | 13F | Beacon Financial Group | 10.249 | -9,87 | 1.738 | -9,34 | ||||
| 2026-01-30 | 13F | Delta Investment Management, LLC | 15.824 | 864,29 | 2.683 | 871,74 | ||||
| 2026-04-29 | 13F | Cary Street Partner Investment Advisory Llc | 414 | -1,66 | 84 | 18,31 | ||||
| 2026-04-28 | 13F | Belpointe Asset Management LLC | 5.650 | 1.147 | ||||||
| 2026-02-04 | 13F | Dogwood Wealth Management LLC | 71 | 0,00 | 12 | 9,09 | ||||
| 2026-02-13 | 13F | Squarepoint Ops LLC | Call | 17.100 | -63,38 | 2.899 | -63,18 | |||
| 2026-02-13 | 13F | Wells Fargo & Company/mn | Put | 10.000 | 0,00 | 1.695 | 0,59 | |||
| 2026-02-13 | 13F | Squarepoint Ops LLC | Put | 236.600 | 2,78 | 40.111 | 3,37 | |||
| 2026-04-23 | 13F | Element Squared LLC | 10.937 | 2.220 | ||||||
| 2026-01-27 | 13F | First Horizon Corp | 17.104 | 2,34 | 2.900 | 2,91 | ||||
| 2026-02-13 | 13F | Squarepoint Ops LLC | 16.630 | -64,86 | 2.819 | -64,66 | ||||
| 2026-02-13 | 13F | Wells Fargo & Company/mn | 609.830 | 20,06 | 103.384 | 20,75 | ||||
| 2026-02-13 | 13F | Allianz Se | 81.105 | 0,93 | 13.772 | 1,74 | ||||
| 2026-02-13 | 13F | Wells Fargo & Company/mn | Call | 25.000 | 0,00 | 4.238 | 0,57 | |||
| 2026-02-11 | 13F | J.Safra Asset Management Corp | 4.402 | 746 | ||||||
| 2026-02-13 | 13F | Aptus Capital Advisors, LLC | 5.350 | 41,83 | 907 | 42,68 | ||||
| 2026-02-11 | 13F | O'shaughnessy Asset Management, Llc | 134.082 | 2,60 | 22.735 | 3,28 | ||||
| 2026-02-11 | 13F | Manchester Capital Management LLC | 420 | 71 | ||||||
| 2026-02-11 | 13F | Capital International Sarl | 114.700 | 5,55 | 19.477 | 6,39 | ||||
| 2026-02-06 | 13F | Kingdom Financial Group LLC. | 37 | 6 | ||||||
| 2026-04-17 | 13F | Fifth Third Wealth Advisors LLC | 1.093 | 222 | ||||||
| 2026-04-28 | 13F | SBI Securities Co., Ltd. | 2.850 | -5,44 | 578 | 13,33 | ||||
| 2026-04-09 | 13F | Wedmont Private Capital | 1.289 | 2,79 | 278 | 21,49 | ||||
| 2026-02-11 | 13F | United Financial Planning Group LLC | 1.010 | 0,00 | 171 | 0,59 | ||||
| 2026-02-06 | 13F | Harvest Portfolios Group Inc. | 137.292 | 45,68 | 23.282 | 46,69 | ||||
| 2026-01-30 | 13F | Simplicity Wealth,LLC | 1.622 | 1,12 | 275 | 1,48 | ||||
| 2026-02-13 | 13F | University Of Texas/texas Am Investment Managment Co | 229 | 64,75 | 39 | 65,22 | ||||
| 2026-04-22 | 13F | Viewpoint Investment Partners Corp | 10.994 | 2.018 | ||||||
| 2026-02-17 | 13F | Greenline Partners, LLC | 3.287 | -8,41 | 557 | -7,78 | ||||
| 2026-02-12 | 13F | CoreCommodity Management, LLC | 6.588 | -19,77 | 1.117 | -19,23 | ||||
| 2026-01-26 | 13F | Asset Dedication, LLC | 13 | 0,00 | 2 | 0,00 | ||||
| 2026-02-17 | 13F | Westwood Holdings Group Inc | 0 | -100,00 | 0 | |||||
| 2026-02-11 | 13F | Jessup Wealth Management, Inc | 207 | 35 | ||||||
| 2026-04-24 | 13F | Root Financial Partners, LLC | 17 | -29,17 | 3 | -25,00 | ||||
| 2026-02-17 | 13F | Agf Management Ltd | 892.110 | -9,12 | 151.286 | -8,50 | ||||
| 2026-02-13 | 13F | Barclays Plc | Call | 0 | -100,00 | 0 | -100,00 | |||
| 2026-02-06 | 13F | Resolute Wealth Strategies, LLC | 3.562 | 0,00 | 604 | 0,50 | ||||
| 2026-04-20 | 13F | Columbia Asset Management | 2.030 | 0,00 | 412 | 19,77 | ||||
| 2026-04-13 | 13F | E Fund Management Co., Ltd. | 17.588 | 3.570 | ||||||
| 2025-10-31 | 13F | Whittier Trust Co Of Nevada Inc | 0 | -100,00 | 0 | -100,00 | ||||
| 2026-04-24 | 13F | UMA Financial Services, Inc. | 562 | 0,00 | 114 | 20,00 | ||||
| 2026-02-17 | 13F | Northern Trust Corp | 485.121 | 2,77 | 82.243 | 3,36 | ||||
| 2026-02-11 | 13F | Capital Group Investment Management Pte. Ltd. | 15.333 | 1,83 | 2.604 | 2,64 | ||||
| 2025-11-12 | 13F | RiverGlades Family Offices LLC | 3.000 | 0,00 | 506 | 41,85 | ||||
| 2026-02-11 | 13F | Everett Harris & Co /ca/ | 1.800 | -5,26 | 305 | -4,69 | ||||
| 2026-02-19 | 13F | Invesco Ltd. | 3.284.923 | -7,09 | 556.893 | -6,55 | ||||
| 2026-02-13 | 13F | Merk Investments LLC | 80.000 | -42,86 | 13.562 | -42,53 | ||||
| 2026-02-03 | 13F | Morse Asset Management, Inc | 3.800 | 8,57 | 644 | 9,34 | ||||
| 2026-02-11 | 13F | Winton Capital Group Ltd | 5.000 | 848 | ||||||
| 2026-02-12 | 13F | Pembroke Management, LTD | 4.483 | 0,00 | 760 | 0,66 | ||||
| 2026-02-10 | 13F | Daiwa Securities Group Inc. | 4.900 | 562,16 | 1 | |||||
| 2026-02-03 | 13F | International Assets Investment Management, Llc | 1.389 | 236 | ||||||
| 2026-01-28 | 13F | Ruffer LLP | 5.791 | 983 | ||||||
| 2026-02-17 | 13F | Game Creek Capital, LP | 13.625 | -13,35 | 2.310 | -12,87 | ||||
| 2026-02-13 | 13F | Satovsky Asset Management Llc | 1.725 | 293 | ||||||
| 2026-02-17 | 13F | Cetera Investment Advisers | 86.360 | 3,25 | 14.641 | 3,84 | ||||
| 2026-02-12 | 13F | Moneta Group Investment Advisors Llc | 1.906 | -3,10 | 323 | -2,42 | ||||
| 2026-02-10 | 13F | Jupiter Asset Management Ltd | 27.566 | -94,68 | 4.681 | -94,64 | ||||
| 2026-04-06 | 13F | Rosenberg Matthew Hamilton | 626 | 0,00 | 127 | 19,81 | ||||
| 2026-01-29 | 13F | Calamos Wealth Management LLC | 1.865 | 316 | ||||||
| 2026-02-02 | 13F | Horizon Investments, LLC | 7.038 | 2.737,90 | 1.193 | 2.809,76 | ||||
| 2026-01-29 | 13F | Ashton Thomas Private Wealth, LLC | 8.275 | -67,83 | 1.403 | -67,66 | ||||
| 2026-02-05 | 13F | Thrivent Financial For Lutherans | 2.127 | 0 | ||||||
| 2026-02-17 | 13F | Pinnacle Financial Partners, Inc. | 1.820 | 309 | ||||||
| 2026-02-17 | 13F | Wiley Bros.-aintree Capital, Llc | 22.354 | 10,70 | 3.790 | 11,64 | ||||
| 2026-01-20 | 13F | Savvy Advisors, Inc. | 1.627 | 2,59 | 276 | 3,00 | ||||
| 2026-02-05 | 13F | May Hill Capital, LLC | 5.096 | 83,24 | 864 | 84,40 | ||||
| 2026-04-20 | 13F | Hoxton Planning & Management, LLC | 1.481 | 2,92 | 301 | 23,46 | ||||
| 2026-04-14 | 13F | Thurston, Springer, Miller, Herd & Titak, Inc. | 2.300 | -20,08 | 467 | -4,31 | ||||
| 2026-02-05 | 13F | Gabelli Funds Llc | 193.839 | -10,20 | 32.862 | -9,69 | ||||
| 2026-04-28 | 13F | BW Gestao de Investimentos Ltda. | 25.000 | 5.074 | ||||||
| 2026-01-26 | 13F | Reyes Financial Architecture, Inc. | 1.241 | -29,17 | 210 | -28,81 | ||||
| 2026-04-08 | 13F | Canandaigua National Corp | 2.600 | 528 | ||||||
| 2026-02-12 | 13F | Bradley Foster & Sargent Inc/ct | 1.054.251 | -3,49 | 178.727 | -2,93 | ||||
| 2026-02-09 | 13F | Strategic Financial Concepts, LLC | 0 | -100,00 | 0 | -100,00 | ||||
| 2025-11-07 | 13F | Shell Asset Management Co | 22.427 | -80,47 | 4 | -76,92 | ||||
| 2026-04-28 | 13F | Flagship Harbor Advisors, Llc | 0 | -100,00 | 0 | |||||
| 2025-11-21 | 13F/A | CIBC Bancorp USA Inc. | Call | 41.800 | 7.046 | |||||
| 2026-02-06 | 13F | Bare Financial Services, Inc | 33 | -56,58 | 6 | -58,33 | ||||
| 2026-02-18 | 13F | Vident Advisory, LLC | 47.333 | 126,80 | 8.025 | 128,18 | ||||
| 2026-04-28 | 13F | Golden State Equity Partners | 5.242 | 101,62 | 1.064 | 141,82 | ||||
| 2026-02-13 | 13F | Financial Network Wealth Advisors LLC | 227 | -17,15 | 38 | -17,39 | ||||
| 2026-04-22 | 13F | Gemmer Asset Management LLC | 20.474 | 4.156 | ||||||
| 2026-02-13 | 13F | Wealth Alliance | 2.661 | 100,53 | 451 | 102,24 | ||||
| 2026-04-14 | 13F | Nbc Securities, Inc. | 3 | 0,00 | 1 | |||||
| 2026-02-02 | 13F | Access Investment Management LLC | 40.000 | 0,00 | 6.742 | 0,00 | ||||
| 2026-02-13 | 13F | Cohen & Steers, Inc. | 90.119 | -18,16 | 15 | -16,67 | ||||
| 2026-04-17 | 13F | RFG Advisory, LLC | 6.870 | 3,81 | 1.394 | 24,35 | ||||
| 2026-04-27 | 13F | Oxbow Advisors, LLC | 87.269 | 1,02 | 17.714 | 20,95 | ||||
| 2026-04-14 | 13F | Kozak & Associates, Inc. | 1.000 | 0,00 | 217 | 13,61 | ||||
| 2026-02-13 | 13F | Mufg Securities (canada), Ltd. | 765.186 | -8,03 | 129.791 | -7,37 | ||||
| 2026-02-17 | 13F | DZ BANK AG Deutsche Zentral Genossenschafts Bank, Frankfurt am Main | 3.340.792 | -25,27 | 566.372 | -24,84 | ||||
| 2025-11-04 | 13F | High Note Wealth, LLC | 0 | -100,00 | 0 | |||||
| 2026-02-10 | 13F | Acadian Asset Management Llc | 270.568 | -11,64 | 46 | -11,76 | ||||
| 2026-02-09 | 13F | Genus Capital Management Inc. | 61.367 | -37,83 | 10.420 | -37,33 | ||||
| 2026-04-23 | 13F | Kohmann Bosshard Financial Services, LLC | 0 | -100,00 | 0 | |||||
| 2026-01-27 | 13F | Magnolia Capital Management Ltd | 3.680 | 1 | ||||||
| 2026-02-11 | 13F | Empowered Funds, LLC | 70.231 | -14,77 | 11.906 | -14,28 | ||||
| 2026-02-13 | 13F | Parkside Financial Bank & Trust | 114 | 442,86 | 19 | 533,33 | ||||
| 2026-02-04 | 13F | Atlantic Union Bankshares Corp | 11.094 | -5,90 | 1.881 | -5,39 | ||||
| 2026-04-28 | 13F | Stratos Wealth Partners, LTD. | 11.495 | -17,39 | 2.333 | -1,10 | ||||
| 2026-02-13 | 13F | Altrafin AG | 0 | -100,00 | 0 | |||||
| 2026-02-12 | 13F | Kovack Advisors, Inc. | 3.339 | 19,98 | 524 | 11,73 | ||||
| 2026-02-10 | 13F | Goldman Sachs Group Inc | Call | 135.600 | 0,00 | 22.988 | 0,58 | |||
| 2026-02-10 | 13F | Goldman Sachs Group Inc | Put | 185.600 | 0,00 | 31.465 | 0,58 | |||
| 2026-04-17 | 13F | Bell Investment Advisors, Inc | 60 | 130,77 | 12 | 200,00 | ||||
| 2025-11-13 | 13F | Glenmede Investment Management, LP | 12.586 | -12,59 | 2.121 | 23,89 | ||||
| 2026-02-10 | 13F | Goldman Sachs Group Inc | 3.877.145 | 24,32 | 657.292 | 25,03 | ||||
| 2026-02-13 | 13F | Extract Advisors LLC | 30.410 | 5.155 | ||||||
| 2026-04-14 | 13F | Pinnacle Wealth Management Group, Inc. | 26.312 | 1,98 | 5.341 | 22,09 | ||||
| 2026-02-17 | 13F | Two Sigma Investments, Lp | 0 | -100,00 | 0 | |||||
| 2026-02-05 | 13F | Arbejdsmarkedets Tillaegspension | 139.878 | 23.714 | ||||||
| 2026-02-17 | 13F | Spears Abacus Advisors LLC | 509.073 | -9,05 | 86.303 | -8,53 | ||||
| 2026-02-13 | 13F | Wright Wealth Llc | 1.322 | 224 | ||||||
| 2026-02-11 | 13F | Tacita Capital Inc | 5.068 | -0,04 | 860 | 0,59 | ||||
| 2026-03-03 | 13F | Employees Provident Fund Board | 1.079.713 | 183.341 | ||||||
| 2026-04-21 | 13F | Sunpointe, LLC | 1.079 | 219 | ||||||
| 2026-02-12 | 13F | Penserra Capital Management LLC | 8.918 | -28,61 | 2 | -50,00 | ||||
| 2026-02-12 | 13F | Aviva Plc | 427.640 | 6,89 | 72.577 | 7,80 | ||||
| 2026-02-17 | 13F | Captrust Financial Advisors | 5.718 | 7,89 | 969 | 8,51 | ||||
| 2026-04-13 | 13F | True Wealth Design, LLC | 154 | 0,00 | 31 | 19,23 | ||||
| 2026-01-13 | 13F | Stonehage Fleming Financial Services Holdings Ltd | 344 | 0,00 | 58 | 1,75 | ||||
| 2026-02-17 | 13F | Van Den Berg Management I, Inc | 4.797 | -1,03 | 813 | -0,49 | ||||
| 2026-02-12 | 13F | Rossby Financial, LCC | 7.061 | 1,06 | 1.197 | 0,67 | ||||
| 2026-02-03 | 13F | Legacy Wealth Managment, LLC/ID | 4 | 0,00 | 1 | |||||
| 2026-02-05 | 13F | Allworth Financial LP | 89.417 | 1.781,67 | 15.159 | 1.794,75 | ||||
| 2026-04-15 | 13F | Avanza Fonder AB | 56.529 | 14,01 | 15.962 | 38,31 | ||||
| 2026-02-09 | 13F | Annis Gardner Whiting Capital Advisors, LLC | 752 | 0,00 | 127 | 0,79 | ||||
| 2026-02-12 | 13F | Swiss Re Ltd | 284 | 48 | ||||||
| 2026-04-17 | 13F | A. D. Beadell Investment Counsel, Inc. | 4.270 | -7,78 | 1 | |||||
| 2026-01-29 | 13F | Concurrent Investment Advisors, LLC | 6.405 | 298,82 | 1.086 | 302,22 | ||||
| 2026-04-22 | 13F | Pictet Asset Management Holding SA | 361.794 | 0,24 | 73.133 | 19,31 | ||||
| 2026-02-04 | 13F | Midwest Trust Co | 4.348 | -1,05 | 737 | -0,41 | ||||
| 2026-02-13 | 13F | Evelyn Partners Investment Management LLP | 131.375 | -15,83 | 22.280 | -15,23 | ||||
| 2026-02-17 | 13F | Coastal Bridge Advisors, LLC | 2.299 | 0,00 | 390 | 0,52 | ||||
| 2026-02-12 | 13F | Riverwater Partners LLC | 4.026 | -1,40 | 683 | -0,87 | ||||
| 2026-02-17 | 13F | Discovery Capital Management, Llc / Ct | 50.400 | -3,08 | 8.544 | -2,52 | ||||
| 2026-04-16 | 13F | Generate Investment Management Ltd | 95.000 | 19.283 | ||||||
| 2026-04-28 | 13F | Integrated Advisors Network LLC | 1.714 | -74,52 | 348 | -69,56 | ||||
| 2026-02-10 | 13F | Fort Sheridan Advisors Llc | 2.060 | 17,78 | 349 | 18,71 | ||||
| 2026-02-12 | 13F | Tocqueville Asset Management L.p. | 27.489 | -3,00 | 4.660 | -2,43 | ||||
| 2026-04-23 | 13F | Lansforsakringar Fondforvaltning AB (publ) | 114.965 | 0,85 | 23.261 | 20,17 | ||||
| 2026-04-28 | 13F | O'Domhnaill Enterprises, Inc. | 5.692 | 1.155 | ||||||
| 2026-01-15 | 13F | J. Safra Sarasin Holding AG | 46.141 | 36,12 | 7.822 | 36,92 | ||||
| 2026-04-23 | 13F | Harbor Investment Advisory, Llc | 19.223 | 7,25 | 3.902 | 28,41 | ||||
| 2026-02-12 | 13F | Steward Partners Investment Advisory, Llc | 7.381 | -1,86 | 1.251 | -1,26 | ||||
| 2026-01-22 | 13F | Vista Investment Partners Ii, Llc | 0 | -100,00 | 0 | |||||
| 2026-02-10 | 13F | Gulf International Bank (UK) Ltd | 25.187 | 0,00 | 4 | -20,00 | ||||
| 2026-02-10 | 13F | Forsta Ap-fonden | 173.800 | 62,58 | 29.512 | 63,88 | ||||
| 2026-02-13 | 13F | Alliance Private Wealth, LLC | 5.102 | 1.007 | ||||||
| 2026-04-17 | 13F | AdvisorNet Financial, Inc | 944 | 21,81 | 192 | 45,80 | ||||
| 2026-01-27 | 13F | TD Waterhouse Canada Inc. | 1.061.709 | -6,32 | 179.892 | -6,77 | ||||
| 2026-02-05 | 13F | IMG Wealth Management, Inc. | 36 | 0,00 | 6 | 0,00 | ||||
| 2026-01-30 | 13F | Us Bancorp \de\ | 20.955 | 47,60 | 3.553 | 48,43 | ||||
| 2026-02-03 | 13F | We Are One Seven, LLC | 8.563 | 42,05 | 1.452 | 42,81 | ||||
| 2026-02-17 | 13F | Altrinsic Global Advisors Llc | 636.105 | -4,96 | 107.839 | -4,41 | ||||
| 2026-02-13 | 13F | BRITISH COLUMBIA INVESTMENT MANAGEMENT Corp | 755.833 | -15,92 | 128.178 | -15,33 | ||||
| 2026-02-13 | 13F | Rodgers Brothers Inc. | 1.500 | 0,00 | 254 | 0,79 | ||||
| 2026-02-26 | 13F | TD Capital Management LLC | 2.000 | 0,00 | 339 | 0,59 | ||||
| 2026-02-17 | 13F | IHT Wealth Management, LLC | 14.541 | -16,97 | 2.465 | -16,50 | ||||
| 2026-02-03 | 13F | Sequoia Financial Advisors, LLC | 10.978 | 8,64 | 1.861 | 9,28 | ||||
| 2026-02-17 | 13F | Clark Capital Management Group, Inc. | 2.832 | 27,91 | 480 | 28,69 | ||||
| 2026-02-04 | 13F | Summit Wealth Group Llc / Co | 0 | -100,00 | 0 | |||||
| 2026-04-22 | 13F | Atlantic Edge Private Wealth Management, LLC | 1.031 | 3,51 | 209 | 24,40 | ||||
| 2026-04-22 | 13F | Atlantic Edge Private Wealth Management, LLC | Put | 101 | 20,24 | |||||
| 2025-11-17 | 13F | FSA Wealth Management LLC | 607 | 0,00 | 102 | 41,67 | ||||
| 2026-02-05 | 13F | Phoenix Holdings Ltd. | 4.393 | -12,09 | 743 | -11,76 | ||||
| 2026-04-28 | 13F | Atticus Wealth Management, Llc | 2.269 | 0,75 | 461 | 20,73 | ||||
| 2026-04-16 | 13F | Uhlmann Price Securities, Llc | 9.761 | -10,74 | 1.981 | 6,91 | ||||
| 2026-04-21 | 13F | GHP Investment Advisors, Inc. | 821 | -40,64 | 167 | -29,06 | ||||
| 2026-04-14 | 13F | Murphy Pohlad Asset Management LLC | 45.939 | -7,53 | 9.325 | 10,71 | ||||
| 2026-04-10 | 13F | Auto-Owners Insurance Co | 5.400 | 0,00 | 1.096 | 19,78 | ||||
| 2026-02-17 | 13F | Edmond De Rothschild Holding S.a. | 127.311 | 16,99 | 21.630 | 18,02 | ||||
| 2025-11-12 | 13F | Fox Run Management, L.l.c. | 0 | -100,00 | 0 | |||||
| 2026-02-17 | 13F | Worldquant Millennium Advisors Llc | 20.932 | -11,89 | 3.551 | -11,25 | ||||
| 2026-02-12 | 13F | Qtron Investments LLC | 0 | -100,00 | 0 | |||||
| 2026-02-17 | 13F | Empyrean Capital Partners, LP | 27.700 | -68,09 | 4.696 | -67,91 | ||||
| 2026-02-13 | 13F | Morgan Stanley | 3.052.065 | 18,28 | 517.417 | 18,96 | ||||
| 2025-11-07 | 13F | Berkshire Asset Management Llc/pa | 0 | -100,00 | 0 | |||||
| 2026-01-23 | 13F | Diversify Advisory Services, LLC | 6.737 | 2,76 | 1.330 | 24,88 | ||||
| 2026-02-12 | 13F | Tiemann Investment Advisors, Llc | 1.356 | 0,00 | 230 | 0,44 | ||||
| 2025-11-07 | 13F | M&G Plc | 0 | -100,00 | 0 | |||||
| 2026-02-09 | 13F | Ellerson Group Inc /adv | 2.831 | 0,00 | 480 | 0,42 | ||||
| 2026-04-13 | 13F | Creative Financial Designs Inc /adv | 510 | -55,11 | 104 | -46,35 | ||||
| 2026-02-13 | 13F | Independent Family Office, LLC | 0 | -100,00 | 0 | |||||
| 2026-02-17 | 13F | Wellington Management Group Llp | 164.593 | -34,34 | 27.949 | -33,84 | ||||
| 2026-02-13 | 13F | Commerce Bank | 1.515 | 257 | ||||||
| 2026-01-15 | 13F | Lodestone Wealth Management LLC | 206 | 35 | ||||||
| 2026-02-13 | 13F | McAdam, LLC | 1.830 | -1,08 | 310 | -0,32 | ||||
| 2026-02-03 | 13F | Costello Asset Management, INC | 350 | 0,00 | 59 | 1,72 | ||||
| 2026-02-12 | 13F | DRW Securities, LLC | 15.000 | -16,83 | 2.543 | -16,27 | ||||
| 2026-01-29 | 13F | Beirne Wealth Consulting Services, LLC | 9.747 | 0,12 | 1.652 | 0,73 | ||||
| 2026-02-13 | 13F | Osmosis Investment Management UK Ltd | 93.573 | 15.887 | ||||||
| 2026-04-29 | 13F | Lmcg Investments, Llc | 168.516 | -7,28 | 34.205 | 11,01 | ||||
| 2026-02-06 | 13F | Marble Harbor Investment Counsel, LLC | 1.500 | 0,00 | 254 | 0,79 | ||||
| 2026-01-27 | 13F | Brighton Jones Llc | 0 | -100,00 | 0 | -100,00 | ||||
| 2026-04-23 | 13F | Chelsea Counsel Co | 66.036 | 0,00 | 11.195 | 0,00 | ||||
| 2026-02-17 | 13F | Aqr Capital Management Llc | 855.547 | 1.509,62 | 145.084 | 1.519,42 | ||||
| 2026-04-22 | 13F | Stone House Investment Management, LLC | 48 | 0,00 | 10 | 12,50 | ||||
| 2026-02-18 | 13F | Beacon Pointe Advisors, LLC | 59.756 | -5,31 | 10.130 | -4,77 | ||||
| 2026-02-18 | 13F | Beacon Pointe Advisors, LLC | Call | 15.400 | 40,00 | 2.611 | 40,78 | |||
| 2026-02-17 | 13F | Safe Harbor Fiduciary, LLC | 0 | -100,00 | 0 | |||||
| 2026-04-27 | 13F | Moran Wealth Management, LLC | 15.985 | 14,06 | 3.245 | 36,59 | ||||
| 2026-02-12 | 13F | Federated Hermes, Inc. | 510.710 | -17,15 | 86.581 | -16,68 | ||||
| 2026-03-02 | 13F | Tobam | 0 | -100,00 | 0 | |||||
| 2026-04-07 | 13F | Cardinal Capital Management, Inc. | 1.455 | -7,03 | 294 | -19,23 | ||||
| 2026-04-20 | 13F | Apella Capital, LLC | 997 | 220 | ||||||
| 2026-04-28 | 13F | LGT Group Foundation | 3.044 | 0,00 | 618 | 18,43 | ||||
| 2026-01-08 | 13F | Sound View Wealth Advisors Group, LLC | 2.090 | 0,00 | 354 | 0,57 | ||||
| 2026-02-17 | 13F | Tudor Investment Corp Et Al | Call | 9.000 | -83,96 | 1.526 | -83,87 | |||
| 2026-02-13 | 13F | Glen Eagle Advisors, LLC | 42 | 0,00 | 7 | 0,00 | ||||
| 2026-02-13 | 13F/A | Ontario Teachers Pension Plan Board | 0 | -100,00 | 0 | -100,00 | ||||
| 2026-02-02 | 13F | Alliance Wealth Advisors, LLC /UT | 2.358 | -27,82 | 400 | -27,45 | ||||
| 2026-04-13 | 13F | IFP Advisors, Inc | 7.592 | -3,42 | 1.541 | 15,69 | ||||
| 2026-04-17 | 13F | Baker Ellis Asset Management LLC | 7.050 | -6,62 | 1.431 | 11,88 | ||||
| 2026-02-17 | 13F | Tudor Investment Corp Et Al | Put | 5.600 | -79,49 | 949 | -79,37 | |||
| 2026-04-21 | 13F | Ground Swell Capital, LLC | 0 | -100,00 | 0 | |||||
| 2026-01-09 | 13F | 180 Wealth Advisors, Llc | 5.793 | 184,11 | 982 | 186,30 | ||||
| 2026-01-28 | 13F | CAPROCK Group, Inc. | 137.358 | -1,87 | 23.286 | 15,39 | ||||
| 2026-02-04 | 13F | KLCM Advisors, Inc. | 10.018 | -0,99 | 1.698 | -0,41 | ||||
| 2026-02-04 | 13F | KLCM Advisors, Inc. | Put | 10.000 | 0 | |||||
| 2026-04-21 | 13F | Pinnacle Associates Ltd | 4.755 | 0,08 | 965 | 19,88 | ||||
| 2026-02-17 | 13F | Murchinson Ltd. | Put | 15.000 | -60,32 | 2.543 | -60,10 | |||
| 2026-02-17 | 13F | Murchinson Ltd. | Call | 15.000 | -60,32 | 2.543 | -60,10 | |||
| 2026-04-15 | 13F | Addenda Capital Inc. | 628.844 | -5,76 | 177.567 | 14,33 | ||||
| 2026-04-28 | 13F | Dean, Jacobson Financial Services, LLC | 1.544 | -23,94 | 313 | -9,01 | ||||
| 2026-02-09 | 13F | Employees Retirement System of Texas | 34.471 | -20,77 | 6 | -28,57 | ||||
| 2026-02-17 | 13F | United Capital Financial Advisers, Llc | 1.759 | -3,83 | 298 | -3,25 | ||||
| 2026-04-28 | 13F | Baxter Bros Inc | 0 | -100,00 | 0 | |||||
| 2026-01-26 | 13F | Roman Butler Fullerton & Co | 2.063 | 0,00 | 441 | 36,22 | ||||
| 2026-02-17 | 13F | D. E. Shaw & Co., Inc. | Put | 45.500 | 51,67 | 7.714 | 52,55 | |||
| 2026-02-04 | 13F | Rock Point Advisors, LLC | 4.780 | -4,11 | 810 | -3,57 | ||||
| 2026-02-12 | 13F | Voya Investment Management Llc | 7.955 | -1,63 | 1.351 | -0,88 |