Grundlæggende statistik
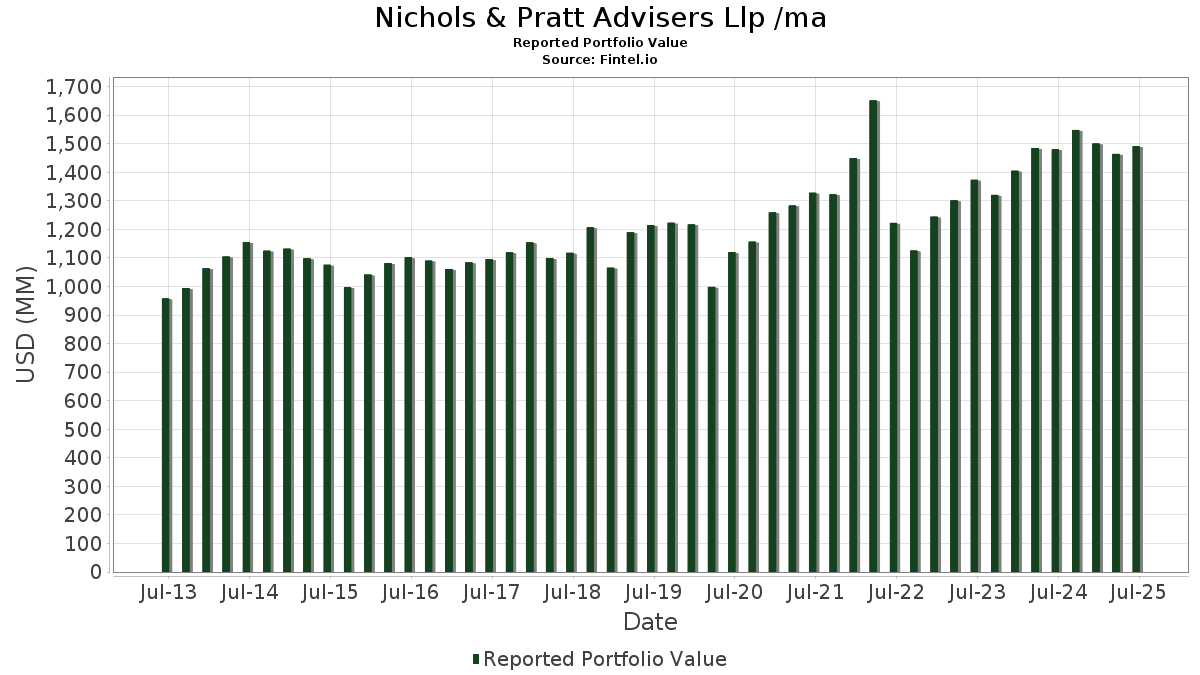
| Porteføljeværdi | $ 1.490.782.698 |
| Nuværende stillinger | 104 |
Seneste beholdninger, ydeevne, AUM (fra 13F, 13D)
Nichols & Pratt Advisers Llp /ma har afsløret 104 samlede besiddelser i deres seneste SEC-arkivering. Den seneste porteføljeværdi er beregnet til at være $ 1.490.782.698 USD. Faktiske aktiver under forvaltning (AUM) er denne værdi plus kontanter (som ikke er oplyst). Nichols & Pratt Advisers Llp /mas største beholdninger er Apple Inc. (US:AAPL) , Automatic Data Processing, Inc. (US:ADP) , Microsoft Corporation (US:MSFT) , Alphabet Inc. (US:GOOG) , and Mastercard Incorporated (US:MA) . Nichols & Pratt Advisers Llp /mas nye stillinger omfatter iShares Trust - iShares Core S&P Small-Cap ETF (US:IJR) , BlackRock, Inc. (US:BLK) , Palo Alto Networks, Inc. (US:PANW) , Meta Platforms, Inc. (US:META) , and iShares Trust - iShares Core S&P Mid-Cap ETF (US:IJH) .
Top øger dette kvartal
Vi bruger ændringen i porteføljeallokeringen, fordi dette er den mest meningsfulde metrik. Ændringer kan skyldes handler eller ændringer i aktiekurser.
| Sikkerhed | Aktier (MM) |
Værdi (MM$) |
Portefølje % | ΔPortefølje % |
|---|---|---|---|---|
| 0,19 | 92,08 | 5,7415 | 0,9932 | |
| 0,20 | 43,05 | 2,8875 | 0,3644 | |
| 0,05 | 38,87 | 2,4239 | 0,3487 | |
| 0,48 | 84,42 | 5,2639 | 0,2229 | |
| 1,14 | 47,98 | 3,2185 | 0,2096 | |
| 0,04 | 6,22 | 0,3876 | 0,1704 | |
| 0,07 | 27,30 | 1,7021 | 0,1277 | |
| 0,01 | 6,71 | 0,4187 | 0,1160 | |
| 0,17 | 26,33 | 1,7663 | 0,0933 | |
| 0,02 | 6,61 | 0,4433 | 0,0720 |
Top falder i dette kvartal
Vi bruger ændringen i porteføljeallokeringen, fordi dette er den mest meningsfulde metrik. Ændringer kan skyldes handler eller ændringer i aktiekurser.
| Sikkerhed | Aktier (MM) |
Værdi (MM$) |
Portefølje % | ΔPortefølje % |
|---|---|---|---|---|
| 0,33 | 56,61 | 3,5298 | -1,3948 | |
| 0,54 | 111,18 | 6,9328 | -1,2387 | |
| 0,36 | 47,02 | 2,9317 | -0,6574 | |
| 0,37 | 59,54 | 3,7123 | -0,6205 | |
| 0,45 | 35,61 | 2,2205 | -0,5180 | |
| 0,51 | 77,47 | 5,1966 | -0,4706 | |
| 0,07 | 32,60 | 2,0326 | -0,4101 | |
| 0,14 | 81,41 | 5,0763 | -0,3592 | |
| 0,06 | 19,07 | 1,1889 | -0,2588 | |
| 0,40 | 49,28 | 3,0727 | -0,2369 |
13F og Fondsarkivering
Denne formular blev indsendt den 2025-08-05 for rapporteringsperioden 2025-06-30. Klik på linkikonet for at se den fulde transaktionshistorik.
Opgrader for at låse op for premium-data og eksportere til Excel ![]() .
.
| Sikkerhed | Type | Gennemsnitlig aktiekurs | Aktier (MM) |
Δ Aktier (%) |
Δ Aktier (%) |
Værdi ($MM) |
Portefølje (%) |
ΔPortefølje (%) |
|
|---|---|---|---|---|---|---|---|---|---|
| AAPL / Apple Inc. | 0,54 | 0,54 | 111,18 | -7,07 | 6,9328 | -1,2387 | |||
| ADP / Automatic Data Processing, Inc. | 0,31 | -0,39 | 96,60 | 0,56 | 6,4801 | -0,0809 | |||
| MSFT / Microsoft Corporation | 0,19 | 0,33 | 92,08 | 32,44 | 5,7415 | 0,9932 | |||
| GOOG / Alphabet Inc. | 0,48 | 0,93 | 84,42 | 14,38 | 5,2639 | 0,2229 | |||
| MA / Mastercard Incorporated | 0,14 | -0,27 | 81,41 | 2,29 | 5,0763 | -0,3592 | |||
| JNJ / Johnson & Johnson | 0,51 | 0,80 | 77,47 | -6,64 | 5,1966 | -0,4706 | |||
| GJR / Strats Trust For Procter & Gambel Security - Preferred Security | 0,37 | 0,29 | 59,54 | -6,15 | 3,7123 | -0,6205 | |||
| FI / Fiserv, Inc. | 0,33 | 0,61 | 56,61 | -21,49 | 3,5298 | -1,3948 | |||
| KMI / Kinder Morgan, Inc. | 1,81 | 0,46 | 53,17 | 3,35 | 3,3155 | -0,1984 | |||
| TJX / The TJX Companies, Inc. | 0,40 | 0,25 | 49,28 | 1,69 | 3,0727 | -0,2369 | |||
| FAST / Fastenal Company | 1,14 | 100,73 | 47,98 | 8,91 | 3,2185 | 0,2096 | |||
| PEP / PepsiCo, Inc. | 0,36 | 1,41 | 47,02 | -10,53 | 2,9317 | -0,6574 | |||
| AMZN / Amazon.com, Inc. | 0,20 | 1,10 | 43,05 | 16,52 | 2,8875 | 0,3644 | |||
| INTU / Intuit Inc. | 0,05 | -0,19 | 38,87 | 27,94 | 2,4239 | 0,3487 | |||
| MRK / Merck & Co., Inc. | 0,45 | 0,24 | 35,61 | -11,19 | 2,2205 | -0,5180 | |||
| NVO / Novo Nordisk A/S - Depositary Receipt (Common Stock) | 0,49 | 2,23 | 33,99 | 1,84 | 2,1194 | -0,1600 | |||
| VZ / Verizon Communications Inc. | 0,78 | 1,58 | 33,63 | -3,04 | 2,2556 | -0,1131 | |||
| BRK.B / Berkshire Hathaway Inc. | 0,07 | -0,08 | 32,60 | -8,85 | 2,0326 | -0,4101 | |||
| KO / The Coca-Cola Company | 0,44 | 0,18 | 31,38 | -1,02 | 1,9570 | -0,2087 | |||
| LIN / Linde plc | 0,06 | 0,67 | 27,32 | 1,45 | 1,8325 | -0,0066 | |||
| CAT / Caterpillar Inc. | 0,07 | 0,60 | 27,30 | 18,42 | 1,7021 | 0,1277 | |||
| QCOM / QUALCOMM Incorporated | 0,17 | 3,66 | 26,33 | 7,50 | 1,7663 | 0,0933 | |||
| SYK / Stryker Corporation | 0,05 | 0,57 | 20,07 | 6,88 | 1,2517 | -0,0310 | |||
| RTO / Rentokil Initial plc - Depositary Receipt (Common Stock) | 0,82 | 2,89 | 19,78 | 7,89 | 1,2333 | -0,0187 | |||
| ACN / Accenture plc | 0,06 | -6,11 | 19,07 | -10,05 | 1,1889 | -0,2588 | |||
| IQV / IQVIA Holdings Inc. | 0,11 | 1,56 | 17,83 | -8,85 | 1,1120 | -0,2243 | |||
| SO / The Southern Company | 0,19 | 0,73 | 17,09 | 0,60 | 1,1465 | -0,0139 | |||
| ALC / Alcon Inc. | 0,18 | 0,86 | 15,54 | -5,79 | 0,9692 | -0,1577 | |||
| APD / Air Products and Chemicals, Inc. | 0,05 | 3,38 | 14,03 | -0,87 | 0,8749 | -0,0918 | |||
| MDT / Medtronic plc | 0,16 | 0,88 | 13,78 | -1,79 | 0,8593 | -0,0991 | |||
| CSCO / Cisco Systems, Inc. | 0,19 | -1,96 | 13,06 | 10,23 | 0,8146 | 0,0051 | |||
| TMO / Thermo Fisher Scientific Inc. | 0,03 | 5,19 | 11,85 | -14,21 | 0,7387 | -0,2045 | |||
| XOM / Exxon Mobil Corporation | 0,08 | -0,52 | 8,24 | -9,83 | 0,5138 | -0,1104 | |||
| GPN / Global Payments Inc. | 0,09 | -7,68 | 7,38 | -24,50 | 0,4950 | -0,1725 | |||
| CVS / CVS Health Corporation | 0,10 | 0,11 | 7,07 | 1,95 | 0,4406 | -0,0328 | |||
| SNPS / Synopsys, Inc. | 0,01 | 26,81 | 6,71 | 51,52 | 0,4187 | 0,1160 | |||
| JPM / JPMorgan Chase & Co. | 0,02 | 2,87 | 6,61 | 21,58 | 0,4433 | 0,0720 | |||
| NVDA / NVIDIA Corporation | 0,04 | 34,08 | 6,22 | 95,50 | 0,3876 | 0,1704 | |||
| GE / General Electric Company | 0,02 | -2,44 | 6,04 | 25,47 | 0,3769 | 0,0479 | |||
| STT / State Street Corporation | 0,05 | -1,31 | 5,20 | 17,22 | 0,3240 | 0,0212 | |||
| COST / Costco Wholesale Corporation | 0,01 | 6,75 | 5,09 | 11,73 | 0,3172 | 0,0062 | |||
| EMR / Emerson Electric Co. | 0,04 | -0,76 | 4,68 | 20,70 | 0,3141 | 0,0491 | |||
| ABBV / AbbVie Inc. | 0,02 | -2,37 | 4,60 | -13,41 | 0,2868 | -0,0760 | |||
| ABT / Abbott Laboratories | 0,03 | -0,74 | 4,55 | 1,79 | 0,3054 | -0,0001 | |||
| ECL / Ecolab Inc. | 0,02 | 0,07 | 4,10 | 6,35 | 0,2753 | 0,0117 | |||
| MKC / McCormick & Company, Incorporated | 0,05 | 3,96 | 3,56 | -4,04 | 0,2221 | -0,0314 | |||
| BHP / BHP Group Limited - Depositary Receipt (Common Stock) | 0,07 | 0,52 | 3,50 | -0,40 | 0,2180 | -0,0217 | |||
| SHW / The Sherwin-Williams Company | 0,01 | 2,48 | 3,21 | 1,26 | 0,2151 | -0,0012 | |||
| RTX / RTX Corporation | 0,02 | 0,00 | 3,10 | 10,23 | 0,1935 | 0,0012 | |||
| V / Visa Inc. | 0,01 | 17,44 | 3,09 | 19,00 | 0,1926 | 0,0153 | |||
| WAT / Waters Corporation | 0,01 | -3,34 | 2,88 | -8,40 | 0,1794 | -0,0351 | |||
| QSR / Restaurant Brands International Inc. | 0,04 | 16,74 | 2,78 | 16,19 | 0,1733 | 0,0099 | |||
| MMM / 3M Company | 0,02 | -0,40 | 2,45 | 3,24 | 0,1531 | -0,0093 | |||
| WDS / Woodside Energy Group Ltd - Depositary Receipt (Common Stock) | 0,15 | -5,92 | 2,29 | 0,13 | 0,1429 | -0,0134 | |||
| IBM / International Business Machines Corporation | 0,01 | -4,40 | 2,24 | 13,35 | 0,1504 | 0,0153 | |||
| NVS / Novartis AG - Depositary Receipt (Common Stock) | 0,02 | -1,06 | 2,09 | 7,36 | 0,1399 | 0,0073 | |||
| GEV / GE Vernova Inc. | 0,00 | -0,51 | 2,08 | 72,41 | 0,1298 | 0,0474 | |||
| INTC / Intel Corporation | 0,08 | -0,34 | 1,74 | -1,70 | 0,1166 | -0,0042 | |||
| KEYS / Keysight Technologies, Inc. | 0,01 | 6,22 | 1,72 | 16,29 | 0,1154 | 0,0143 | |||
| DHR / Danaher Corporation | 0,01 | 17,43 | 1,60 | 13,11 | 0,0996 | 0,0032 | |||
| EXPD / Expeditors International of Washington, Inc. | 0,01 | -4,15 | 1,60 | -8,96 | 0,1070 | -0,0126 | |||
| SPGI / S&P Global Inc. | 0,00 | 0,00 | 1,56 | 3,79 | 0,0974 | -0,0054 | |||
| GOOGL / Alphabet Inc. | 0,01 | 0,00 | 1,50 | 14,01 | 0,0933 | 0,0036 | |||
| UNP / Union Pacific Corporation | 0,01 | 37,46 | 1,44 | 33,86 | 0,0895 | 0,0163 | |||
| CB / Chubb Limited | 0,00 | 16,98 | 1,43 | 12,20 | 0,0890 | 0,0021 | |||
| SYY / Sysco Corporation | 0,02 | -2,01 | 1,29 | -1,07 | 0,0804 | -0,0086 | |||
| IJR / iShares Trust - iShares Core S&P Small-Cap ETF | 0,01 | 1,01 | 0,0681 | 0,0681 | |||||
| SPY / SPDR S&P 500 ETF | 0,00 | 0,00 | 0,92 | 10,47 | 0,0572 | 0,0005 | |||
| AMGN / Amgen Inc. | 0,00 | -1,20 | 0,85 | -11,46 | 0,0530 | -0,0126 | |||
| CRM / Salesforce, Inc. | 0,00 | 34,56 | 0,85 | 36,71 | 0,0530 | 0,0105 | |||
| PFE / Pfizer Inc. | 0,03 | -29,15 | 0,82 | -32,18 | 0,0514 | -0,0317 | |||
| MS / Morgan Stanley | 0,01 | 179,95 | 0,77 | 238,94 | 0,0514 | 0,0359 | |||
| IEFA / iShares Trust - iShares Core MSCI EAFE ETF | 0,01 | 0,75 | 0,0468 | 0,0468 | |||||
| AVGO / Broadcom Inc. | 0,00 | -10,08 | 0,74 | 47,99 | 0,0495 | 0,0155 | |||
| CL / Colgate-Palmolive Company | 0,01 | -5,18 | 0,72 | -8,01 | 0,0486 | -0,0052 | |||
| LOW / Lowe's Companies, Inc. | 0,00 | 0,63 | 0,0424 | 0,0424 | |||||
| T / AT&T Inc. | 0,02 | 20,46 | 0,61 | 23,23 | 0,0409 | 0,0071 | |||
| CVX / Chevron Corporation | 0,00 | 0,00 | 0,60 | -14,43 | 0,0402 | -0,0076 | |||
| ADBE / Adobe Inc. | 0,00 | 0,00 | 0,58 | 0,87 | 0,0390 | -0,0004 | |||
| BMY / Bristol-Myers Squibb Company | 0,01 | 0,00 | 0,56 | -24,05 | 0,0351 | -0,0155 | |||
| SHOP / Shopify Inc. | 0,00 | 0,00 | 0,54 | 20,90 | 0,0336 | 0,0031 | |||
| WFC / Wells Fargo & Company | 0,01 | -8,06 | 0,46 | 2,47 | 0,0285 | -0,0019 | |||
| HD / The Home Depot, Inc. | 0,00 | 0,00 | 0,45 | 0,00 | 0,0304 | -0,0005 | |||
| BLK / BlackRock, Inc. | 0,00 | 0,44 | 0,0292 | 0,0292 | |||||
| ETN / Eaton Corporation plc | 0,00 | 0,42 | 0,0262 | 0,0262 | |||||
| PANW / Palo Alto Networks, Inc. | 0,00 | 0,42 | 0,0262 | 0,0262 | |||||
| ASO / Academy Sports and Outdoors, Inc. | 0,01 | 5,95 | 0,41 | 5,43 | 0,0255 | -0,0010 | |||
| MCD / McDonald's Corporation | 0,00 | 0,00 | 0,38 | -6,65 | 0,0255 | -0,0023 | |||
| ALNY / Alnylam Pharmaceuticals, Inc. | 0,00 | 0,00 | 0,34 | 21,00 | 0,0228 | 0,0036 | |||
| NOW / ServiceNow, Inc. | 0,00 | 0,00 | 0,34 | 29,39 | 0,0212 | 0,0032 | |||
| IWM / iShares Trust - iShares Russell 2000 ETF | 0,00 | -12,27 | 0,32 | -4,99 | 0,0202 | -0,0031 | |||
| SOLV / Solventum Corporation | 0,00 | -1,00 | 0,32 | -1,23 | 0,0217 | -0,0007 | |||
| CTAS / Cintas Corporation | 0,00 | 0,00 | 0,32 | 8,56 | 0,0198 | -0,0002 | |||
| MMC / Marsh & McLennan Companies, Inc. | 0,00 | 0,00 | 0,28 | -10,29 | 0,0174 | -0,0039 | |||
| UNM / Unum Group | 0,00 | 0,00 | 0,26 | -0,75 | 0,0165 | -0,0017 | |||
| META / Meta Platforms, Inc. | 0,00 | 0,26 | 0,0173 | 0,0173 | |||||
| AFL / Aflac Incorporated | 0,00 | 0,00 | 0,26 | -5,17 | 0,0173 | -0,0013 | |||
| IJH / iShares Trust - iShares Core S&P Mid-Cap ETF | 0,00 | 0,25 | 0,0166 | 0,0166 | |||||
| ITW / Illinois Tool Works Inc. | 0,00 | 0,00 | 0,23 | -0,43 | 0,0158 | -0,0003 | |||
| IVV / iShares Trust - iShares Core S&P 500 ETF | 0,00 | 0,00 | 0,23 | 10,90 | 0,0146 | 0,0001 | |||
| GIS / General Mills, Inc. | 0,00 | -26,03 | 0,23 | -35,96 | 0,0153 | -0,0090 | |||
| GWW / W.W. Grainger, Inc. | 0,00 | 0,00 | 0,22 | 5,29 | 0,0137 | -0,0005 | |||
| NEE / NextEra Energy, Inc. | 0,00 | -8,99 | 0,21 | -11,02 | 0,0141 | -0,0020 | |||
| AXP / American Express Company | 0,00 | 0,21 | 0,0139 | 0,0139 | |||||
| SLB / Schlumberger Limited | 0,00 | -100,00 | 0,00 | 0,0000 |