Grundlæggende statistik
| Institutionelle ejere | 432 total, 409 long only, 4 short only, 19 long/short - change of -24,08% MRQ |
| Del pris | 53,03 |
| Gennemsnitlig porteføljeallokering | 0.5089 % - change of -8,86% MRQ |
| Institutionelle aktier (lange) | 164.521.757 (ex 13D/G) - change of -44,55MM shares -21,31% MRQ |
| Institutionel værdi (lang) | $ 11.413.139 USD ($1000) |
Institutionelt ejerskab og aktionærer
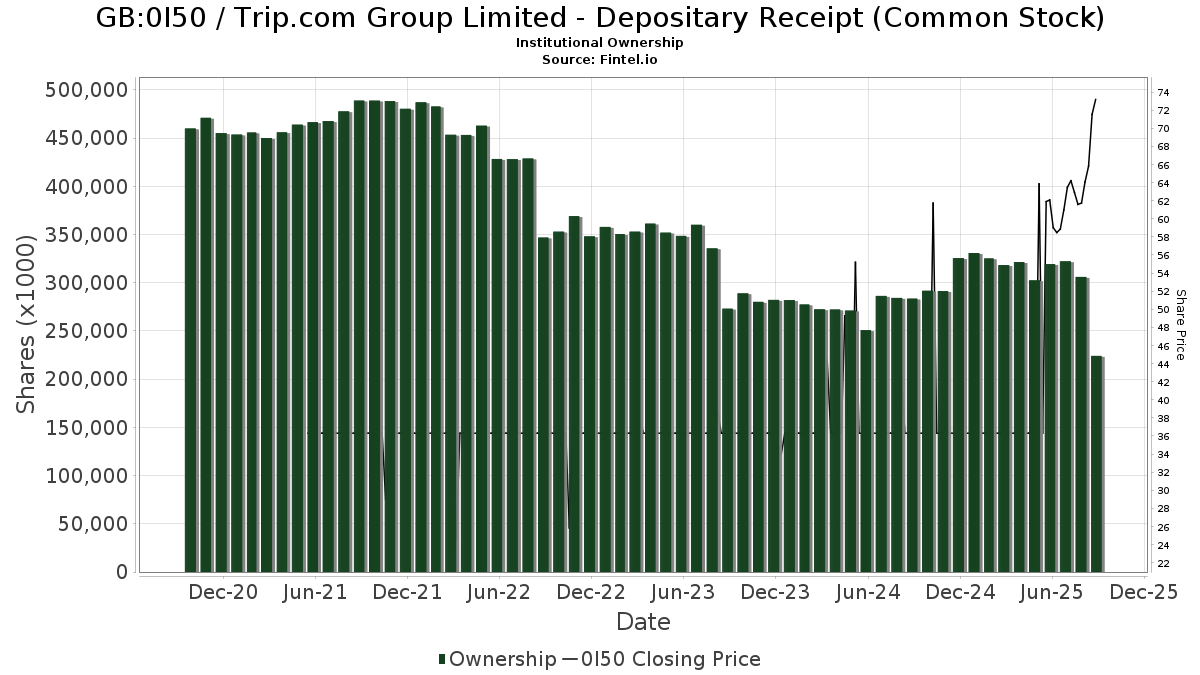
Trip.com Group Limited - Depositary Receipt (Common Stock) (GB:0I50) har 432 institutionelle ejere og aktionærer, der har indsendt 13D/G- eller 13F-formularer til Securities Exchange Commission (SEC). Disse institutioner har i alt 164,803,028 aktier. Største aktionærer omfatter Capital World Investors, Morgan Stanley, Sanders Capital, LLC, NEWFX - NEW WORLD FUND INC Class A, Capital International Investors, Davis Selected Advisers, Cantillon Capital Management Llc, Jpmorgan Chase & Co, ARGA Investment Management, LP, and Fmr Llc .
Trip.com Group Limited - Depositary Receipt (Common Stock) (LSE:0I50) institutionel ejerskabsstruktur viser aktuelle positioner i virksomheden efter institutioner og fonde, samt seneste ændringer i positionsstørrelse. Større aktionærer kan omfatte individuelle investorer, investeringsforeninger, hedgefonde eller institutioner. Skema 13D angiver, at investoren besidder (eller besidder) mere end 5 % af virksomheden og har til hensigt (eller har til hensigt at) aktivt at forfølge en ændring i forretningsstrategi. Skema 13G indikerer en passiv investering på over 5%.
The share price as of March 18, 2026 is 53,03 / share. Previously, on March 20, 2025, the share price was 36,30 / share. This represents an increase of 46,10% over that period.
Fondens stemningsscore
Fund Sentiment Score (fka Ownership Accumulation Score) finder de aktier, der bliver mest købt af fonde. Det er resultatet af en sofistikeret, multi-faktor kvantitativ model, der identificerer virksomheder med de højeste niveauer af institutionel akkumulering. Scoringsmodellen bruger en kombination af den samlede stigning i oplyste ejere, ændringerne i porteføljeallokeringer i disse ejere og andre målinger. Tallet går fra 0 til 100, hvor højere tal indikerer et højere niveau af akkumulering for sine jævnaldrende, og 50 er gennemsnittet.
Opdateringsfrekvens: Dagligt
Se Ownership Explorer, som giver en liste over højest rangerende virksomheder.
AI+ Ask Fintel’s AI assistant about Trip.com Group Limited - Depositary Receipt (Common Stock).
Select a question to share a public post with an AI-crafted answer.
Thinking of good questions…
13F og NPORT arkivering
Detaljer om 13F-arkivering er gratis. Detaljer om NP-ansøgninger kræver et premium-medlemskab. Grønne rækker angiver nye positioner. Røde rækker angiver lukkede positioner. Klik på linket ikon for at se den fulde transaktionshistorik.
Opgrader
for at låse premium-data op og eksportere til Excel ![]() .
.
| Fil dato | Kilde | Investor | Type | Gennemsnitlig pris (Øst) |
Aktier | Δ Aktier (%) |
Rapporteret Værdi ($1000) |
Δ Værdi (%) |
Port Alloc (%) |
|
|---|---|---|---|---|---|---|---|---|---|---|
| 2025-11-04 | 13F | State of Wyoming | 0 | -100,00 | 0 | |||||
| 2026-01-23 | 13F | Assetmark, Inc | 61.355 | 13,72 | 4.412 | 8,75 | ||||
| 2026-02-05 | 13F | Abacus Wealth Partners, LLC | 9.153 | 658 | ||||||
| 2025-09-25 | NP | DFA INVESTMENT DIMENSIONS GROUP INC - Emerging Markets Sustainability Core 1 Portfolio Institutional Class This fund is a listed as child fund of Dimensional Fund Advisors Lp and if that institution has disclosed ownership in this security, then these positions will not be double counted when calculating total shares and total value | 38.258 | 0,00 | 2.370 | 5,05 | ||||
| 2025-09-24 | NP | EMFIX - Ashmore Emerging Markets Equity Fund INSTITUTIONAL CLASS | 0 | -100,00 | 0 | -100,00 | ||||
| 2026-02-13 | 13F | 1832 Asset Management L.P. | 164.170 | 11.805 | ||||||
| 2026-01-29 | 13F | Sanctuary Advisors, LLC | 3.362 | 8,45 | 242 | 3,43 | ||||
| 2026-02-17 | 13F | Credit Agricole S A | 8.372 | 51,26 | 602 | 44,71 | ||||
| 2026-02-02 | 13F | Wolverine Asset Management Llc | Put | 100 | 0,00 | 7 | 0,00 | |||
| 2025-09-26 | NP | FDCAX - Fidelity Capital Appreciation Fund This fund is a listed as child fund of Fmr Llc and if that institution has disclosed ownership in this security, then these positions will not be double counted when calculating total shares and total value | 0 | -100,00 | 0 | -100,00 | ||||
| 2025-09-26 | NP | DILAX - Davis International Fund Class A | 132.750 | 0,00 | 8.224 | 5,02 | ||||
| 2026-02-11 | 13F | Clearbridge Investments, LLC | 1.103.710 | -3,76 | 79.368 | -7,97 | ||||
| 2026-02-17 | 13F | Tower Research Capital LLC (TRC) | 1.086 | -98,89 | 78 | -98,94 | ||||
| 2026-02-06 | 13F | Tredje AP-fonden | 84.019 | 6.042 | ||||||
| 2025-09-26 | NP | RAZAX - Multi-Asset Growth Strategy Fund Class A | 8.026 | 34,28 | 497 | 41,19 | ||||
| 2025-11-06 | 13F | Haven Private, LLC | 0 | -100,00 | 0 | |||||
| 2026-01-14 | 13F | Generali Investments CEE, investicni spolecnost, a.s. | 7.863 | 0,00 | 565 | -4,40 | ||||
| 2026-01-22 | 13F | Maseco Llp | 18 | 0,00 | 1 | 0,00 | ||||
| 2025-09-26 | NP | SPECX - Alger Spectra Fund Class A | 111.800 | -86,33 | 6.926 | -79,36 | ||||
| 2026-02-11 | 13F | Franklin Resources Inc | 3.410 | -95,56 | 245 | -95,76 | ||||
| 2026-02-11 | 13F | O'shaughnessy Asset Management, Llc | 44.468 | 4,99 | 3.198 | 0,38 | ||||
| 2026-02-10 | 13F | Guardcap Asset Management Ltd | 31.130 | -12,38 | 2.239 | -16,21 | ||||
| 2026-02-13 | 13F | Flow Traders U.s. Llc | 19.972 | 1 | ||||||
| 2025-11-14 | 13F | Aspex Management (HK) Ltd | 0 | -100,00 | 0 | |||||
| 2026-02-17 | 13F/A | Northwest & Ethical Investments L.P. | 26.077 | -13,71 | 1.875 | -17,47 | ||||
| 2025-09-26 | NP | RMYAX - Multi-Strategy Income Fund Class A | 1.824 | 20,87 | 113 | 25,84 | ||||
| 2025-11-14 | 13F | KEYWISE CAPITAL MANAGEMENT (HK) Ltd | 0 | -100,00 | 0 | |||||
| 2026-01-16 | 13F | Standard Life Aberdeen plc | 26.819 | 0,00 | 1.929 | -4,37 | ||||
| 2026-01-26 | 13F | PDS Planning, Inc | 4.877 | 1,27 | 351 | -3,31 | ||||
| 2025-09-26 | NP | NYVTX - Davis New York Venture Fund Class A | 1.167.300 | 0,00 | 72.314 | 5,02 | ||||
| 2026-01-23 | 13F | Factory Mutual Insurance Co | 15.496 | 50,87 | 1.114 | 44,30 | ||||
| 2026-02-12 | 13F | M&G Plc | 221.183 | 42,28 | 15.925 | 36,60 | ||||
| 2025-11-14 | 13F | AXA Investment Managers S.A. | 495.520 | 37.263 | ||||||
| 2026-02-10 | 13F | Bank of New York Mellon Corp | 36.431 | 1,43 | 2.620 | -3,00 | ||||
| 2026-02-17 | 13F | Bayesian Capital Management, LP | 0 | -100,00 | 0 | |||||
| 2026-01-27 | 13F | First Horizon Corp | 361 | 0,00 | 26 | -7,41 | ||||
| 2026-02-17 | 13F | Tudor Investment Corp Et Al | Put | 22.200 | 2,78 | 1.596 | -1,72 | |||
| 2026-02-12 | 13F | DRW Securities, LLC | 25.400 | 1.827 | ||||||
| 2026-02-13 | 13F | BNP Paribas Asset Management Holding S.A. | 442.545 | 32 | ||||||
| 2026-02-17 | 13F | Tudor Investment Corp Et Al | 15.661 | 1.126 | ||||||
| 2026-02-17 | 13F | DZ BANK AG Deutsche Zentral Genossenschafts Bank, Frankfurt am Main | 0 | -100,00 | 0 | |||||
| 2026-02-11 | 13F | Jpmorgan Chase & Co | 4.261.265 | -3,93 | 306.428 | -8,14 | ||||
| 2026-02-13 | 13F | Dodge & Cox | 19.250 | 0,00 | 1.384 | -4,35 | ||||
| 2025-09-24 | NP | SNTKX - Steward International Enhanced Index Fund Class A | 8.602 | 49,68 | 533 | 56,93 | ||||
| 2026-01-08 | 13F | Nordea Investment Management Ab | 580.964 | -8,34 | 41.742 | -12,66 | ||||
| 2026-01-20 | 13F | Signaturefd, Llc | 9.230 | 2,92 | 664 | -1,63 | ||||
| 2026-02-02 | 13F | Strs Ohio | 87.039 | -32,41 | 6.259 | -35,38 | ||||
| 2026-02-13 | 13F | Motiv8 Investments LLC | 30 | 0 | ||||||
| 2026-02-11 | 13F | Axiom International Investors Llc /de | 0 | -100,00 | 0 | |||||
| 2025-11-14 | 13F | Gluskin Sheff & Assoc Inc | 0 | -100,00 | 0 | |||||
| 2026-01-05 | 13F | GAMMA Investing LLC | 39 | 0,00 | 3 | 0,00 | ||||
| 2026-01-21 | 13F | Aaron Wealth Advisors LLC | 5.644 | 27,92 | 406 | 22,36 | ||||
| 2026-02-12 | 13F | BRYN MAWR TRUST Co | 0 | -100,00 | 0 | -100,00 | ||||
| 2026-02-02 | 13F | Davis Selected Advisers | 5.053.389 | 2,27 | 363.389 | -2,21 | ||||
| 2026-01-26 | 13F | Cwm, Llc | 2.443 | 8,00 | 0 | |||||
| 2026-01-29 | 13F | WT Asset Management Ltd | 0 | -100,00 | 0 | |||||
| 2026-02-17 | 13F | Quadrature Capital Ltd | 23.800 | 1.711 | ||||||
| 2025-09-26 | NP | FSSGX - Fidelity SAI Sustainable Emerging Markets Equity Fund | 6.064 | 88,26 | 376 | 97,37 | ||||
| 2025-11-14 | 13F | Mount Yale Investment Advisors, LLC | 0 | -100,00 | 0 | -100,00 | ||||
| 2026-02-06 | 13F | Global Retirement Partners, LLC | 5.835 | 1.998,92 | 420 | 1.995,00 | ||||
| 2026-02-13 | 13F | Cornerstone Financial Management LLC | 37 | 3 | ||||||
| 2025-09-23 | NP | IEMGX - Voya Multi-Manager Emerging Markets Equity Fund Class I | 6.433 | -55,07 | 399 | -52,84 | ||||
| 2026-02-11 | 13F | Vise Technologies, Inc. | 7.699 | 8,84 | 554 | 4,14 | ||||
| 2026-02-13 | 13F | Solstein Capital, LLC | 28.400 | 0,00 | 2.042 | -4,36 | ||||
| 2026-02-03 | 13F | Denali Advisors Llc | 5.805 | -2,12 | 417 | -6,50 | ||||
| 2026-02-13 | 13F | Verition Fund Management LLC | 41.288 | -39,97 | 2.969 | -42,59 | ||||
| 2026-02-17 | 13F | Trexquant Investment LP | 40.678 | -66,95 | 2.925 | -68,40 | ||||
| 2026-02-04 | 13F | Legacy Financial Advisors, Inc. | 0 | -100,00 | 0 | |||||
| 2026-02-09 | 13F | Key FInancial Inc | 265 | 0,00 | 19 | 0,00 | ||||
| 2026-01-27 | 13F | Financial Management Professionals, Inc. | 241 | 49,69 | 17 | 41,67 | ||||
| 2026-02-17 | 13F | Hbk Investments L P | Put | 123.600 | 0,00 | 8.888 | -4,37 | |||
| 2025-09-25 | NP | VWNFX - Vanguard Windsor II Fund Investor Shares | 399.359 | 0,00 | 24.740 | 5,02 | ||||
| 2026-02-17 | 13F | Amundi | 308.690 | -1,65 | 22.198 | -0,93 | ||||
| 2026-02-17 | 13F | Polar Capital Holdings Plc | 999.029 | -1,53 | 71.840 | -5,84 | ||||
| 2026-02-13 | 13F | Verition Fund Management LLC | Put | 121.200 | 78,76 | 8.715 | 70,95 | |||
| 2026-02-13 | 13F | Verition Fund Management LLC | Call | 90.500 | 86,98 | 6.508 | 78,81 | |||
| 2026-02-12 | 13F | Comgest Global Investors S.a.s. | 11.137 | -9,52 | 801 | -13,51 | ||||
| 2026-02-17 | 13F | Engineers Gate Manager LP | 44.580 | 3.206 | ||||||
| 2026-01-13 | 13F | Dakota Wealth Management | 7.895 | 6,04 | 568 | 1,43 | ||||
| 2026-02-12 | 13F | Rossby Financial, LCC | 37 | 0,00 | 3 | 0,00 | ||||
| 2025-09-25 | NP | DFEM - Dimensional Emerging Markets Core Equity 2 ETF | 22.000 | 61,17 | 1.363 | 69,19 | ||||
| 2026-02-13 | 13F | Kestra Advisory Services, LLC | 2.391 | 172 | ||||||
| 2026-02-17 | 13F | Royal Bank Of Canada | 51.917 | 63,11 | 3.732 | 55,82 | ||||
| 2026-02-10 | 13F | Bnp Paribas Arbitrage, Sa | 14.315 | -22,49 | 1.029 | -25,86 | ||||
| 2026-02-17 | 13F | D. E. Shaw & Co., Inc. | Put | 0 | -100,00 | 0 | ||||
| 2025-11-06 | 13F | Whipplewood Advisors, LLC | 0 | -100,00 | 0 | -100,00 | ||||
| 2026-02-13 | 13F | Citigroup Inc | 264.218 | 116,35 | 19.000 | 106,89 | ||||
| 2026-02-13 | 13F | Citigroup Inc | Call | 20.000 | 0,00 | 1.438 | -4,39 | |||
| 2026-02-17 | 13F | CoreView Capital Management Ltd | 1.928.590 | 0,00 | 138.685 | -4,37 | ||||
| 2026-02-11 | 13F | Lyell Wealth Management, Lp | 5.145 | 3,46 | 370 | -1,07 | ||||
| 2026-02-13 | 13F | Citigroup Inc | Put | 30.000 | 0,00 | 2.157 | -4,39 | |||
| 2026-02-17 | 13F | LMR Partners LLP | Call | 2.900 | 0,00 | 209 | -4,59 | |||
| 2026-01-27 | 13F | Zurcher Kantonalbank (Zurich Cantonalbank) | 0 | -100,00 | 0 | |||||
| 2026-02-13 | 13F | JustInvest LLC | 17.810 | 11,16 | 1.281 | 6,31 | ||||
| 2025-09-29 | NP | AIM INVESTMENT FUNDS (INVESCO INVESTMENT FUNDS) - Invesco Oppenheimer Developing Markets Fund Class R6 | 0 | -100,00 | 0 | -100,00 | ||||
| 2026-02-11 | 13F | OneAscent Investment Solutions LLC | 8.932 | 0,00 | 642 | -4,32 | ||||
| 2026-02-17 | 13F | Guggenheim Capital Llc | 5.886 | -36,37 | 423 | -39,14 | ||||
| 2026-02-17 | 13F | SRS Investment Management, LLC | 756.185 | 0,00 | 54.377 | -4,38 | ||||
| 2025-09-26 | NP | ALGAX - Alger International Focus Fund Class A | 68.759 | -2,55 | 4.260 | 2,33 | ||||
| 2026-02-17 | 13F | Lazard Asset Management Llc | 819.943 | 20,87 | 58.962 | 15,58 | ||||
| 2026-02-11 | 13F | Cantillon Capital Management Llc | 4.669.778 | 1,38 | 335.804 | -3,05 | ||||
| 2026-01-28 | 13F | CAPROCK Group, Inc. | 7.689 | -1,35 | 553 | -3,83 | ||||
| 2026-02-02 | 13F | Oppenheimer Asset Management Inc. | 2.906 | 209 | ||||||
| 2025-09-26 | NP | FNDMX - Fidelity Series Sustainable Non-U.S. Developed Markets Fund | 0 | -100,00 | 0 | -100,00 | ||||
| 2026-02-10 | 13F | Bnp Paribas Arbitrage, Sa | Put | 342 | 2.459 | |||||
| 2026-01-16 | 13F | TB Alternative Assets Ltd. | 90.320 | -9,05 | 6.495 | -13,04 | ||||
| 2026-02-10 | 13F | Bnp Paribas Arbitrage, Sa | Call | 140 | 1.007 | |||||
| 2026-02-13 | 13F | MAI Capital Management | 89 | 0,00 | 6 | 0,00 | ||||
| 2026-02-12 | 13F | Qtron Investments LLC | 0 | -100,00 | 0 | |||||
| 2026-02-13 | 13F | Walleye Trading LLC | Call | 150.600 | 168,93 | 10.830 | 157,16 | |||
| 2026-01-29 | 13F | Nbc Securities, Inc. | 13 | 1 | ||||||
| 2026-02-11 | 13F | Ramirez Asset Management, Inc. | 57.480 | 4.133 | ||||||
| 2026-02-13 | 13F | Walleye Trading LLC | 18.667 | -84,85 | 1.342 | -85,51 | ||||
| 2025-11-14 | 13F | Centiva Capital, LP | 0 | -100,00 | 0 | |||||
| 2026-02-12 | 13F | BlackRock, Inc. | 2.421.784 | 69,73 | 174.151 | 62,31 | ||||
| 2026-02-13 | 13F | Walleye Trading LLC | Put | 182.200 | 58,85 | 13.102 | 51,91 | |||
| 2026-02-13 | 13F | Walleye Capital LLC | Put | 12.300 | 151,02 | 884 | 140,22 | |||
| 2026-02-18 | 13F | GWM Advisors LLC | 6.938 | 26,74 | 499 | 21,17 | ||||
| 2026-02-13 | 13F | Walleye Capital LLC | 12.213 | 878 | ||||||
| 2026-02-17 | 13F | Par Capital Management Inc | 4.500 | 324 | ||||||
| 2026-02-13 | 13F | Walleye Capital LLC | Call | 71.800 | 1.004,62 | 5.163 | 957,99 | |||
| 2026-02-13 | 13F | Wells Fargo & Company/mn | 40.107 | 3,91 | 2.884 | -0,62 | ||||
| 2025-09-26 | NP | AAEMX - Alger Emerging Markets Fund Class A | 4.700 | -29,79 | 291 | -26,14 | ||||
| 2026-02-12 | 13F | Ci Investments Inc. | 107.201 | -9,26 | 7.709 | 96.250,00 | ||||
| 2026-01-30 | 13F | Mitsubishi UFJ Trust & Banking Corp | 0 | -100,00 | 0 | |||||
| 2026-02-17 | 13F | Two Sigma Advisers, Lp | 655.400 | 48,08 | 47.130 | 41,60 | ||||
| 2025-11-14 | 13F | Maverick Capital Ltd | 0 | -100,00 | 0 | |||||
| 2026-02-10 | 13F | Main Management ETF Advisors, LLC | 18.009 | 1,03 | 1 | 0,00 | ||||
| 2026-02-12 | 13F | Renaissance Technologies Llc | 236.712 | -2,55 | 17.022 | -6,82 | ||||
| 2026-02-13 | 13F | Sculptor Capital LP | Put | 88.700 | 0,00 | 6.378 | -4,38 | |||
| 2026-02-13 | 13F | Schroder Investment Management Group | 1.244.742 | -12,18 | 89.509 | -16,02 | ||||
| 2026-02-02 | 13F | Truist Financial Corp | 9.306 | -13,48 | 669 | -17,20 | ||||
| 2025-11-14 | 13F | Scientech Research LLC | 0 | -100,00 | 0 | |||||
| 2026-02-02 | 13F | CENTRAL TRUST Co | 86 | 0,00 | 6 | 0,00 | ||||
| 2026-01-30 | 13F/A | M&t Bank Corp | 36.018 | 2.590 | ||||||
| 2026-02-13 | 13F | SRS Capital Advisors, Inc. | 1.559 | 850,61 | 112 | 833,33 | ||||
| 2026-02-02 | 13F | Wolverine Asset Management Llc | Call | 23.200 | 1.668 | |||||
| 2026-01-08 | 13F | True Wealth Design, LLC | 44 | 12,82 | 3 | 50,00 | ||||
| 2026-02-13 | 13F | Macquarie Group Ltd | 51.419 | -94,33 | 3.698 | -94,58 | ||||
| 2026-02-11 | 13F | LPL Financial LLC | 56.241 | 6,11 | 4.044 | 1,48 | ||||
| 2026-02-17 | 13F | Price T Rowe Associates Inc /md/ | 8.188 | -18,12 | 1 | |||||
| 2026-01-12 | 13F | Legacy Wealth Asset Management, LLC | 9.060 | 1,01 | 652 | -3,41 | ||||
| 2026-02-03 | 13F | Manning & Napier Advisors Llc | 0 | -100,00 | 0 | |||||
| 2026-02-06 | 13F | Profund Advisors Llc | 37.006 | -9,72 | 2.661 | -13,66 | ||||
| 2026-02-17 | 13F | Janus Henderson Group Plc | 1.592.109 | -2,59 | 114.456 | -6,87 | ||||
| 2025-09-26 | NP | SPEDX - Alger Dynamic Opportunities Fund Class A | 0 | -100,00 | 0 | -100,00 | ||||
| 2025-09-26 | NP | FEMSX - Fidelity Series Emerging Markets Opportunities Fund This fund is a listed as child fund of Fmr Llc and if that institution has disclosed ownership in this security, then these positions will not be double counted when calculating total shares and total value | 2.240.551 | 0,00 | 138.802 | 5,02 | ||||
| 2025-12-18 | 13F | Danske Bank A/s | 0 | -100,00 | 0 | |||||
| 2026-01-23 | 13F | Bridgewater Advisors Inc. | 3.821 | -0,39 | 237 | -11,57 | ||||
| 2026-01-09 | 13F | SG Americas Securities, LLC | Call | 120.000 | 0,00 | 0 | ||||
| 2026-02-17 | 13F | Wellington Management Group Llp | 0 | -100,00 | 0 | |||||
| 2026-01-23 | 13F | Sumitomo Mitsui Trust Holdings, Inc. | 6.936 | -34,60 | 499 | -37,52 | ||||
| 2026-02-13 | 13F | Clarity Asset Management, Inc. | 1.835 | 0,00 | 132 | -5,07 | ||||
| 2026-02-13 | 13F | QVT Financial LP | 2.867 | 0,00 | 206 | -4,19 | ||||
| 2026-02-17 | 13F | Mercer Global Advisors Inc /adv | 6.248 | -3,00 | 449 | -7,23 | ||||
| 2026-02-12 | 13F | Hrt Financial Lp | 0 | -100,00 | 0 | |||||
| 2026-02-13 | 13F | Rhumbline Advisers | 4.179 | -5,45 | 301 | -9,64 | ||||
| 2025-10-09 | 13F | Voya Investment Management Llc | 0 | -100,00 | 0 | |||||
| 2025-11-14 | 13F | Atom Investors LP | 0 | -100,00 | 0 | |||||
| 2026-02-05 | 13F | Bank Julius Baer & Co. Ltd, Zurich | 14.460 | 721,59 | 1.040 | 687,12 | ||||
| 2026-01-16 | 13F | DiNuzzo Private Wealth, Inc. | 15 | 0,00 | 0 | |||||
| 2025-11-18 | 13F | Dorsey Wright & Associates | 0 | -100,00 | 0 | |||||
| 2026-02-17 | 13F | Ameriprise Financial Inc | 724.843 | -8,62 | 52.124 | -12,59 | ||||
| 2025-11-14 | 13F | Wolverine Trading, Llc | 4.853 | -24,58 | 370 | -2,12 | ||||
| 2025-11-14 | 13F | Wolverine Trading, Llc | Call | 31.000 | 7,64 | 2.360 | 39,73 | |||
| 2026-02-03 | 13F | Mitsubishi UFJ Kokusai Asset Management Co., Ltd. | 14.950 | 0,00 | 1.114 | -0,98 | ||||
| 2025-11-14 | 13F | Wolverine Trading, Llc | Put | 19.000 | -51,53 | 1.447 | -37,10 | |||
| 2026-02-09 | 13F | Huntington National Bank | 1 | 0,00 | 0 | |||||
| 2026-02-13 | 13F | Parkside Financial Bank & Trust | 27 | 0,00 | 2 | -50,00 | ||||
| 2026-02-06 | 13F | Fairtree Asset Management (Pty) Ltd | 25.189 | 65,33 | 1.811 | 58,17 | ||||
| 2026-02-17 | 13F | D. E. Shaw & Co., Inc. | Call | 69.400 | 1.635,00 | 4.991 | 1.563,33 | |||
| 2026-02-17 | 13F | Amussen Hunsaker Associates Llc | 2.830 | 0,00 | 204 | -4,69 | ||||
| 2026-01-30 | 13F | Us Bancorp \de\ | 13.341 | -7,51 | 959 | -11,53 | ||||
| 2025-09-25 | NP | DFSE - Dimensional Emerging Markets Sustainability Core 1 ETF | 5.650 | 0,00 | 350 | 5,11 | ||||
| 2026-02-12 | 13F | Advisors Asset Management, Inc. | 3.523 | 20,28 | 253 | 15,00 | ||||
| 2026-02-17 | 13F | Two Sigma Securities, Llc | 3.079 | -37,70 | 221 | -40,43 | ||||
| 2026-02-17 | 13F | Quantinno Capital Management LP | 47.952 | 20,95 | 3.448 | 15,67 | ||||
| 2026-01-29 | 13F | Matthews International Capital Management Llc | 271.342 | -30,09 | 19.512 | -33,15 | ||||
| 2026-02-13 | 13F | Fairman Group, LLC | 112 | 0,00 | 8 | 0,00 | ||||
| 2026-02-17 | 13F | Sig Brokerage, Lp | 3.501 | 16,82 | 252 | 11,56 | ||||
| 2025-09-25 | NP | EMRSX - JPMorgan Emerging Markets Research Enhanced Equity Fund Class R6 | 0 | -100,00 | 0 | -100,00 | ||||
| 2025-11-12 | 13F | NewSquare Capital LLC | 0 | -100,00 | 0 | |||||
| 2026-02-12 | 13F | Dimensional Fund Advisors Lp | 2.378.366 | -0,02 | 171.028 | -4,39 | ||||
| 2026-02-09 | 13F | William Blair Investment Management, Llc | 22.142 | -4,92 | 1.592 | -9,08 | ||||
| 2026-02-12 | 13F | Alps Advisors Inc | 21.915 | -6,96 | 1.576 | -11,07 | ||||
| 2025-11-14 | 13F | Natixis | 0 | -100,00 | 0 | -100,00 | ||||
| 2026-02-17 | 13F | ExodusPoint Capital Management, LP | 0 | -100,00 | 0 | -100,00 | ||||
| 2026-03-12 | 13F/A | Peak6 Llc | Put | 42.400 | 244,72 | 3.049 | 229,87 | |||
| 2026-03-12 | 13F/A | Peak6 Llc | Call | 148.200 | -0,74 | 10.657 | -5,08 | |||
| 2026-02-17 | 13F | Dark Forest Capital Management Lp | 0 | -100,00 | 0 | -100,00 | ||||
| 2026-02-17 | 13F | Northern Trust Corp | 653.851 | 7,33 | 47.018 | 2,63 | ||||
| 2026-02-17 | 13F | D. E. Shaw & Co., Inc. | 849.904 | 25,43 | 61.117 | 19,94 | ||||
| 2025-09-26 | NP | FEMYX - Fidelity Series Sustainable Emerging Markets Fund | 1.428 | 11,48 | 88 | 17,33 | ||||
| 2026-01-28 | 13F | DekaBank Deutsche Girozentrale | 405.000 | 0,00 | 22 | -30,00 | ||||
| 2026-02-13 | 13F | Dymon Asia Capital (singapore) Pte. Ltd. | 0 | -100,00 | 0 | |||||
| 2026-02-05 | 13F | AustralianSuper Pty Ltd | 467.579 | 58,67 | 33.624 | 51,73 | ||||
| 2026-01-27 | 13F | Osborne Partners Capital Management, Llc | 175.820 | 21,93 | 12.643 | 16,60 | ||||
| 2025-11-12 | 13F | Cambridge Investment Research Advisors, Inc. | 0 | -100,00 | 0 | |||||
| 2025-09-26 | NP | RGEAX - Global Equity Fund Class A | 135.116 | 14,59 | 8.370 | 20,35 | ||||
| 2026-01-12 | 13F | Abound Wealth Management | 1.606 | 0,00 | 115 | -4,17 | ||||
| 2026-01-29 | 13F | IMC-Chicago, LLC | Call | 193.000 | -1,63 | 13.879 | -5,94 | |||
| 2026-01-30 | 13F | ARGA Investment Management, LP | 3.944.185 | -14,81 | 283.626 | -18,54 | ||||
| 2026-02-13 | 13F | Pinpoint Asset Management (Singapore) Pte. Ltd. | 206.366 | 14.840 | ||||||
| 2025-11-14 | 13F | Parallax Volatility Advisers, L.P. | Put | 0 | -100,00 | 0 | -100,00 | |||
| 2025-11-14 | 13F | Parallax Volatility Advisers, L.P. | 0 | -100,00 | 0 | -100,00 | ||||
| 2026-02-11 | 13F | Capital International Sarl | 645.243 | -19,70 | 46.399 | -23,21 | ||||
| 2026-02-13 | 13F | American Century Companies Inc | 298.962 | 0,87 | 21.498 | -3,55 | ||||
| 2026-01-29 | 13F | Rakuten Securities, Inc. | 0 | -100,00 | 0 | |||||
| 2026-02-17 | 13F | Persistent Asset Partners Ltd | 2.434 | 175 | ||||||
| 2025-09-24 | NP | EAEMX - Parametric Emerging Markets Fund Investor Class | 2.954 | 0,00 | 183 | 5,17 | ||||
| 2025-09-29 | NP | TMAT - Main Thematic Innovation ETF | 17.112 | 1.060 | ||||||
| 2025-09-25 | NP | WRAAX - Wilmington Global Alpha Equities Fund Class A Shares | 1.494 | 0,00 | 93 | 4,55 | ||||
| 2026-02-17 | 13F | Man Group plc | 341.600 | -65,82 | 24.564 | -67,32 | ||||
| 2026-02-17 | 13F | United Capital Financial Advisers, Llc | 0 | -100,00 | 0 | |||||
| 2026-02-09 | 13F | Hantz Financial Services, Inc. | 11.456 | 44,56 | 1 | |||||
| 2026-02-13 | 13F/A | Alberta Investment Management Corp | 0 | -100,00 | 0 | -100,00 | ||||
| 2026-01-29 | 13F | Pictet Asset Management Holding SA | 73.697 | -1,60 | 5.300 | -5,91 | ||||
| 2026-02-13 | 13F | Ubs Asset Management Americas Inc | 4.105 | 295 | ||||||
| 2026-01-29 | 13F | UMA Financial Services, Inc. | 231 | 2,67 | 17 | 0,00 | ||||
| 2026-01-28 | 13F | U S Global Investors Inc | 113.885 | 8,96 | 8.189 | 4,20 | ||||
| 2025-09-25 | NP | DFAX - Dimensional World ex U.S. Core Equity 2 ETF | 43.366 | 0,00 | 2.687 | 5,00 | ||||
| 2026-01-29 | 13F | UBS Group AG | Put | 92.600 | -77,93 | 6.659 | -78,90 | |||
| 2026-02-03 | 13F | SBI Securities Co., Ltd. | 965 | 1,47 | 69 | -2,82 | ||||
| 2026-01-29 | 13F | UBS Group AG | Call | 212.200 | -27,01 | 15.259 | -30,21 | |||
| 2026-02-13 | 13F | Toroso Investments, LLC | 19.529 | -36,98 | 1.404 | -39,74 | ||||
| 2026-01-29 | 13F | UBS Group AG | 2.094.219 | 3,41 | 150.595 | -1,11 | ||||
| 2026-01-30 | 13F | North Star Investment Management Corp. | 47 | 3 | ||||||
| 2026-02-17 | 13F | Jump Financial, LLC | 173.500 | 297,13 | 12.476 | 279,79 | ||||
| 2026-02-17 | 13F | Linden Advisors Lp | 0 | -100,00 | 0 | -100,00 | ||||
| 2026-02-13 | 13F | Aigen Investment Management, Lp | 0 | -100,00 | 0 | |||||
| 2026-02-12 | 13F | Loomis Sayles & Co L P | 873.787 | -0,81 | 62.834 | -5,15 | ||||
| 2026-02-17 | 13F | HighVista Strategies LLC | 10.646 | 9,12 | 766 | 4,37 | ||||
| 2026-02-09 | 13F | Legal & General Group Plc | 2.666.701 | -14,40 | 191.696 | -18,16 | ||||
| 2026-02-05 | 13F | Baader Bank INC | 30.078 | 2.161 | ||||||
| 2026-02-02 | 13F | Qrg Capital Management, Inc. | 12.867 | 2,82 | 925 | -1,70 | ||||
| 2026-02-14 | 13F | Rockefeller Capital Management L.P. | 233.601 | 4,80 | 16.798 | 0,21 | ||||
| 2026-02-13 | 13F | Neuberger Berman Group LLC | 27.692 | 288,39 | 1.991 | 271,46 | ||||
| 2026-02-17 | 13F | CastleKnight Management LP | 3.500 | 0,00 | 252 | -4,56 | ||||
| 2026-02-17 | 13F | LMR Partners LLP | 0 | -100,00 | 0 | |||||
| 2026-02-13 | 13F | Morgan Stanley | 16.377.936 | -11,80 | 1.177.737 | -15,65 | ||||
| 2026-02-19 | 13F | CI Private Wealth, LLC | 9.783 | -2,46 | 693 | -8,09 | ||||
| 2025-11-14 | 13F | Wetherby Asset Management Inc | 16.263 | -0,26 | 1.223 | 27,82 | ||||
| 2026-02-05 | 13F | Allworth Financial LP | 2.104 | -2,32 | 151 | -6,21 | ||||
| 2026-02-17 | 13F | MIRAE ASSET GLOBAL ETFS HOLDINGS Ltd. | 32.947 | -12,75 | 2.369 | -16,56 | ||||
| 2025-09-24 | NP | IMRFX - Columbia Global Opportunities Fund Class A | 9.411 | -22,50 | 583 | -18,58 | ||||
| 2026-01-27 | 13F | Asset Management One Co., Ltd. | 141.865 | 0,00 | 10.301 | -3,45 | ||||
| 2026-03-06 | 13F | Hsbc Holdings Plc | 73.747 | 544,13 | 5.280 | 513,24 | ||||
| 2025-11-14 | 13F | Arrowpoint Investment Partners (Singapore) Pte. Ltd. | 0 | -100,00 | 0 | -100,00 | ||||
| 2026-01-20 | 13F | Analyst IMS Investment Management Services Ltd. | 36.900 | 0,00 | 3 | 0,00 | ||||
| 2026-02-17 | 13F | Lighthouse Investment Partners, LLC | 46.631 | 3.353 | ||||||
| 2025-09-25 | NP | RPGAX - T. Rowe Price Global Allocation Fund, Inc. This fund is a listed as child fund of Price T Rowe Associates Inc /md/ and if that institution has disclosed ownership in this security, then these positions will not be double counted when calculating total shares and total value | 0 | -100,00 | 0 | -100,00 | ||||
| 2026-02-13 | 13F | Polymer Capital Management (HK) LTD | 65.500 | 4.710 | ||||||
| 2026-02-03 | 13F | Ethic Inc. | 42.193 | 10,09 | 3.034 | 5,27 | ||||
| 2026-02-04 | 13F | Aubrey Capital Management Ltd | 181.200 | 6,28 | 13.030 | 1,62 | ||||
| 2025-11-10 | 13F | Nkcfo Llc | 0 | -100,00 | 0 | |||||
| 2026-02-13 | 13F | Sei Investments Co | 296.780 | 11,60 | 21.341 | 6,72 | ||||
| 2026-02-17 | 13F | Cape Investment Advisory, Inc. | 77 | 1,32 | 6 | 0,00 | ||||
| 2026-01-29 | 13F | China Universal Asset Management Co., Ltd. | 47.685 | 38,22 | 3.429 | 32,19 | ||||
| 2026-02-13 | 13F | Y-Intercept (Hong Kong) Ltd | 37.593 | 2.703 | ||||||
| 2026-02-17 | 13F | Public Employees Retirement System Of Ohio | 135.219 | 0,00 | 9.724 | -4,38 | ||||
| 2026-01-09 | 13F | SG Americas Securities, LLC | 13.470 | -38,88 | 1 | -100,00 | ||||
| 2026-01-22 | 13F | Massachusetts Financial Services Co /ma/ | 31.507 | -8,99 | 2.266 | -12,99 | ||||
| 2026-02-17 | 13F | Voloridge Investment Management, Llc | 190.501 | -70,32 | 13.699 | -71,62 | ||||
| 2025-10-24 | 13F | ORG Wealth Partners, LLC | 0 | -100,00 | 0 | -100,00 | ||||
| 2026-02-19 | 13F | Atomi Financial Group, Inc. | 10.067 | 11,58 | 724 | 6,64 | ||||
| 2026-01-14 | 13F | Spire Wealth Management | 100 | 0,00 | 7 | 0,00 | ||||
| 2026-02-11 | 13F | Brandes Investment Partners, Lp | 29.900 | 2.150 | ||||||
| 2026-02-11 | 13F | Capital World Investors | 32.809.848 | -13,40 | 2.359.416 | -17,19 | ||||
| 2026-01-09 | 13F | Park Place Capital Corp | 194 | 0,00 | 14 | -7,14 | ||||
| 2026-01-08 | 13F | Tuttle Tactical Management LLC | 3.645 | 262 | ||||||
| 2026-02-17 | 13F | Creative Planning | 28.898 | -0,20 | 2.078 | -4,55 | ||||
| 2025-11-13 | 13F | Monolith Management Ltd | 0 | -100,00 | 0 | |||||
| 2026-02-13 | 13F | Sanders Capital, LLC | 9.890.637 | 0,23 | 711.236 | -4,16 | ||||
| 2025-11-04 | 13F | IMC-Chicago, LLC | 0 | -100,00 | 0 | -100,00 | ||||
| 2025-09-25 | NP | JEMSX - JPMorgan Emerging Markets Equity Fund Class I | 1.555.928 | 1,35 | 96.390 | 6,44 | ||||
| 2026-02-13 | 13F | Causeway Capital Management Llc | 0 | -100,00 | 0 | |||||
| 2026-01-26 | 13F | Private Trust Co Na | 16 | 0,00 | 1 | 0,00 | ||||
| 2025-09-25 | NP | TIER - T. Rowe Price International Equity Research ETF | 311 | 19 | ||||||
| 2026-02-09 | 13F | Geode Capital Management, Llc | 206.422 | -8,66 | 14.844 | -12,66 | ||||
| 2026-02-13 | 13F | Acumen Wealth Advisors, LLC | 71 | 5 | ||||||
| 2025-09-26 | NP | SUNAMERICA SERIES TRUST - SA Fidelity Institutional AM International Growth Portfolio Class 1 | 0 | -100,00 | 0 | -100,00 | ||||
| 2026-02-12 | 13F | Campbell & CO Investment Adviser LLC | 88.874 | 6.391 | ||||||
| 2025-09-29 | NP | CVSIX - Calamos Market Neutral Income Fund Class A | Short | -271.600 | 3,82 | -16.826 | 9,03 | |||
| 2026-02-14 | 13F | Triata Capital Ltd | 343.893 | 28,27 | 24.729 | 22,66 | ||||
| 2026-02-13 | 13F | Platinum Investment Management Ltd | 443.718 | -6,41 | 31.908 | -10,51 | ||||
| 2026-02-17 | 13F | Laird Norton Trust Company, Llc | 23.524 | 1.692 | ||||||
| 2026-02-10 | 13F | Goldman Sachs Group Inc | Call | 100.000 | 0,00 | 7.191 | -4,37 | |||
| 2026-02-10 | 13F | Goldman Sachs Group Inc | Put | 100.000 | 0,00 | 7.191 | -4,37 | |||
| 2026-02-10 | 13F | Goldman Sachs Group Inc | 1.215.634 | 13,06 | 87.416 | 8,11 | ||||
| 2025-09-26 | NP | PCEMX - PACE International Emerging Markets Equity Investments Class P | 42.702 | 0,00 | 2.645 | 5,04 | ||||
| 2026-02-11 | 13F | Capital International Investors | 6.220.441 | -2,49 | 447.324 | -6,76 | ||||
| 2026-02-13 | 13F | Allianz Se | 1.825 | 0,00 | 131 | -4,38 | ||||
| 2026-02-17 | 13F | Balyasny Asset Management Llc | Call | 16.200 | 295,12 | 1.165 | 277,92 | |||
| 2026-02-17 | 13F | Bank Of America Corp /de/ | 680.150 | -0,75 | 48.910 | -5,09 | ||||
| 2026-02-17 | 13F | Balyasny Asset Management Llc | Put | 38.100 | 337,93 | 2.740 | 318,81 | |||
| 2026-02-12 | 13F | Brinker Capital Investments, LLC | 10.887 | 64,48 | 783 | 57,34 | ||||
| 2026-02-17 | 13F | Balyasny Asset Management Llc | 61.678 | 4.435 | ||||||
| 2025-09-26 | NP | DWLD - Davis Select Worldwide ETF | 354.390 | 0,00 | 21.954 | 5,02 | ||||
| 2025-11-04 | 13F | Allianz Asset Management GmbH | 0 | -100,00 | 0 | |||||
| 2025-11-10 | 13F | Greenwoods Asset Management Hong Kong Ltd. | 0 | -100,00 | 0 | |||||
| 2026-02-17 | 13F | GAM Holding AG | 32.024 | 67,39 | 2.303 | 60,08 | ||||
| 2026-01-15 | 13F | Nisa Investment Advisors, Llc | 367 | 22,33 | 26 | 18,18 | ||||
| 2026-01-26 | 13F | Mirae Asset Global Investments Co., Ltd. | 97.856 | -9,49 | 7.037 | -13,46 | ||||
| 2026-02-13 | 13F | National Bank Of Canada /fi/ | 178.889 | -61,48 | 12.864 | -63,16 | ||||
| 2026-02-13 | 13F | Wealth Alliance | 3.391 | -6,92 | 244 | -10,99 | ||||
| 2026-02-17 | 13F | Ancora Advisors, LLC | 22 | 2 | ||||||
| 2025-09-26 | NP | BLACKROCK GLOBAL ALLOCATION FUND, INC. - BLACKROCK GLOBAL ALLOCATION FUND, INC. Investor A This fund is a listed as child fund of BlackRock, Inc. and if that institution has disclosed ownership in this security, then these positions will not be double counted when calculating total shares and total value | 0 | -100,00 | 0 | -100,00 | ||||
| 2025-11-13 | 13F | Total Investment Management Inc | 0 | -100,00 | 0 | |||||
| 2026-02-12 | 13F | Commonwealth Equity Services, Llc | 3.826 | 2,33 | 275 | |||||
| 2026-02-18 | 13F | Vident Advisory, LLC | 19.593 | 13,91 | 1.409 | 8,89 | ||||
| 2026-01-22 | 13F | BOCHK Asset Management Ltd | 13.563 | 473,97 | 975 | 450,85 | ||||
| 2026-02-13 | 13F | Mml Investors Services, Llc | 13.293 | 7,70 | 956 | 2,91 | ||||
| 2025-09-26 | NP | FHKFX - Fidelity Series Emerging Markets Fund This fund is a listed as child fund of Fmr Llc and if that institution has disclosed ownership in this security, then these positions will not be double counted when calculating total shares and total value | 664.092 | 29,38 | 41.140 | 35,87 | ||||
| 2026-02-10 | 13F | Daiwa Securities Group Inc. | 13.800 | -23,69 | 1 | -100,00 | ||||
| 2025-09-25 | NP | DFAE - Dimensional Emerging Core Equity Market ETF | 71.678 | 27,36 | 4.440 | 33,78 | ||||
| 2026-02-17 | 13F | XTX Topco Ltd | 27.365 | 47,16 | 1.968 | 40,70 | ||||
| 2026-02-13 | 13F | First Trust Advisors Lp | 5.989 | -4,34 | 431 | -8,51 | ||||
| 2026-02-13 | 13F | Vontobel Holding Ltd. | 1.265.598 | -3,05 | 91.009 | -7,29 | ||||
| 2025-10-31 | 13F | Whittier Trust Co | 0 | -100,00 | 0 | |||||
| 2026-01-05 | 13F | Park Avenue Securities Llc | 2.997 | 5,19 | 0 | |||||
| 2026-02-13 | 13F | Ambassador Advisors, LLC | 52.241 | 3,71 | 3.757 | -0,82 | ||||
| 2026-01-28 | 13F | Migdal Insurance & Financial Holdings Ltd. | 1.765 | 0,00 | 0 | |||||
| 2026-02-12 | 13F | Barometer Capital Management Inc. | 0 | -100,00 | 0 | |||||
| 2025-11-14 | 13F | Peak6 Llc | 0 | -100,00 | 0 | -100,00 | ||||
| 2025-10-28 | 13F | Richardson Financial Services Inc. | 0 | -100,00 | 0 | |||||
| 2026-02-17 | 13F | Raymond James Financial Inc | 59.592 | 14,72 | 4.289 | 9,81 | ||||
| 2026-02-17 | 13F | Advisor Group Holdings, Inc. | 11.542 | -48,79 | 830 | -50,65 | ||||
| 2026-02-13 | 13F | Atlas Capital Advisors Llc | 3.322 | 0,24 | 239 | 22,68 | ||||
| 2025-09-25 | NP | DFCEX - Emerging Markets Core Equity Portfolio - Institutional Class This fund is a listed as child fund of Dimensional Fund Advisors Lp and if that institution has disclosed ownership in this security, then these positions will not be double counted when calculating total shares and total value | 913.870 | 0,00 | 56.614 | 5,02 | ||||
| 2025-11-14 | 13F | Qube Research & Technologies Ltd | Call | 0 | -100,00 | 0 | -100,00 | |||
| 2025-09-30 | 13F | Cullen Capital Management, LLC | 0 | -100,00 | 0 | |||||
| 2026-02-17 | 13F | Russell Investments Group, Ltd. | 2.042.570 | -4,14 | 146.887 | -8,34 | ||||
| 2026-02-18 | 13F | VGI Partners Ltd | 0 | -100,00 | 0 | |||||
| 2026-02-13 | 13F | Hel Ved Capital Management Ltd | 0 | -100,00 | 0 | |||||
| 2025-09-26 | NP | DGFAX - Davis Global Fund Class A | 673.210 | 0,00 | 41.705 | 5,02 | ||||
| 2026-01-15 | 13F | Highline Wealth Partners Llc | 5 | 0,00 | 0 | |||||
| 2026-02-13 | 13F | Marshall Wace, Llp | 0 | -100,00 | 0 | |||||
| 2026-02-17 | 13F | SIH Partners, LLLP | 317.850 | -2,59 | 22.857 | -6,85 | ||||
| 2026-02-11 | 13F | Trivest Advisors Ltd | 507.000 | -53,91 | 36.458 | -55,93 | ||||
| 2026-02-13 | 13F | Mariner, LLC | 12.295 | 5,02 | 885 | 0,45 | ||||
| 2026-02-13 | 13F | Marshall Wace, Llp | Put | 0 | -100,00 | 0 | ||||
| 2025-10-21 | 13F | Steel Peak Wealth Management LLC | 0 | -100,00 | 0 | |||||
| 2026-01-16 | 13F | Ronald Blue Trust, Inc. | 243 | -42,14 | 17 | -45,16 | ||||
| 2026-02-09 | 13F | Wcm Investment Management, Llc | 3.285 | 3,11 | 238 | -2,07 | ||||
| 2026-02-09 | 13F | Frazier Financial Advisors, LLC | 100 | 7 | ||||||
| 2026-01-15 | 13F | Allspring Global Investments Holdings, LLC | 3.786 | 282 | ||||||
| 2026-01-30 | 13F | Jennison Associates Llc | 369.952 | -26,30 | 26.603 | -29,52 | ||||
| 2026-02-10 | 13F | Nomura Asset Management Co Ltd | 41.360 | 0,00 | 2.974 | -4,37 | ||||
| 2026-02-17 | 13F | Optiver Holding B.V. | 5 | 0 | ||||||
| 2025-10-21 | 13F | Jarislowsky, Fraser Ltd | 166.860 | -2,49 | 12.548 | 25,04 | ||||
| 2025-11-12 | 13F | Group One Trading, L.p. | 0 | -100,00 | 0 | -100,00 | ||||
| 2025-09-26 | NP | FIFNX - Fidelity Founders Fund This fund is a listed as child fund of Fmr Llc and if that institution has disclosed ownership in this security, then these positions will not be double counted when calculating total shares and total value | 17.096 | 0,00 | 1.059 | 5,06 | ||||
| 2025-11-14 | 13F | Squarepoint Ops LLC | Call | 0 | -100,00 | 0 | -100,00 | |||
| 2026-01-21 | 13F | Capital Advisory Group Advisory Services, LLC | 4.545 | -1,07 | 327 | -5,51 | ||||
| 2025-10-20 | 13F | Virginia Retirement Systems Et Al | 0 | -100,00 | 0 | |||||
| 2025-09-23 | NP | VVIFX - Voya VACS Series EME Fund | 9.331 | -56,46 | 578 | -54,27 | ||||
| 2026-02-12 | 13F | Callan Family Office, LLC | 10.688 | 60,53 | 769 | 53,60 | ||||
| 2026-02-05 | 13F/A | Delta Accumulation, LLC | 20 | 0,00 | 1 | 0,00 | ||||
| 2026-02-12 | 13F | Federation des caisses Desjardins du Quebec | 14.062 | -3,40 | 1.011 | -7,67 | ||||
| 2026-02-06 | 13F | Cullen/frost Bankers, Inc. | 4 | 0,00 | 0 | |||||
| 2026-02-09 | 13F | Harbour Investments, Inc. | 249 | 0,00 | 18 | -5,56 | ||||
| 2026-02-11 | 13F | Empowered Funds, LLC | 181 | 13 | ||||||
| 2026-02-05 | 13F | Atria Investments Llc | 4.136 | -4,21 | 297 | -8,33 | ||||
| 2026-02-10 | 13F | Natixis Advisors, L.p. | 67.335 | 17,76 | 5 | 0,00 | ||||
| 2026-02-06 | 13F | HighTower Advisors, LLC | 73.983 | 1,92 | 5.320 | -2,53 | ||||
| 2025-09-25 | NP | DFA INVESTMENT DIMENSIONS GROUP INC - Emerging Markets Social Core Equity Portfolio Shares | 34.794 | 0,00 | 2.155 | 5,02 | ||||
| 2025-11-12 | 13F | CIBC Bancorp USA Inc. | 757.695 | 56.979 | ||||||
| 2026-02-13 | 13F | State Street Corp | 19.925 | -77,57 | 1.433 | -78,57 | ||||
| 2026-01-27 | 13F | Bayforest Capital Ltd | 4.042 | -2,34 | 291 | -6,75 | ||||
| 2026-02-11 | 13F | Deutsche Bank Ag\ | 29.652 | -0,69 | 2.132 | -5,03 | ||||
| 2026-02-17 | 13F | Point72 Asset Management, L.P. | Put | 28.100 | 0,00 | 2.021 | -4,40 | |||
| 2026-02-10 | 13F | Root Financial Partners, LLC | 12 | 1 | ||||||
| 2026-02-17 | 13F | Two Sigma Investments, Lp | 377.363 | 4.931,51 | 27.136 | 4.711,35 | ||||
| 2025-11-07 | 13F | Gf Fund Management Co. Ltd. | 0 | -100,00 | 0 | -100,00 | ||||
| 2025-11-12 | 13F | Bellwether Advisors, LLC | 0 | -100,00 | 0 | |||||
| 2026-02-10 | 13F | Envestnet Asset Management Inc | 131.950 | -1,69 | 9.488 | -5,99 | ||||
| 2026-02-23 | 13F | Virtu Financial LLC | 0 | -100,00 | 0 | |||||
| 2026-01-28 | 13F | B. Metzler seel. Sohn & Co. AG | 26.526 | 53,93 | 1.907 | 47,26 | ||||
| 2025-09-25 | NP | Dfa Investment Trust Co - The Emerging Markets Series This fund is a listed as child fund of Dimensional Fund Advisors Lp and if that institution has disclosed ownership in this security, then these positions will not be double counted when calculating total shares and total value | 293.024 | 0,00 | 18.153 | 5,02 | ||||
| 2026-02-17 | 13F | Edmond De Rothschild Holding S.a. | 44.772 | 0,00 | 3.220 | -4,37 | ||||
| 2026-02-13 | 13F | Baldwin Investment Management, LLC | 9.442 | 0,00 | 679 | -4,51 | ||||
| 2026-02-13 | 13F | Van Eck Associates Corp | 77.228 | 91,47 | 6 | 66,67 | ||||
| 2026-02-13 | 13F | Ieq Capital, Llc | 6.181 | 12,14 | 444 | 7,25 | ||||
| 2026-01-14 | 13F | Jfs Wealth Advisors, Llc | 230 | 0,00 | 17 | -5,88 | ||||
| 2025-09-29 | NP | EBIZ - Global X E-commerce ETF This fund is a listed as child fund of Mirae Asset Global Investments Co., Ltd. and if that institution has disclosed ownership in this security, then these positions will not be double counted when calculating total shares and total value | 43.936 | 6,88 | 2.722 | 12,25 | ||||
| 2026-02-10 | 13F | Fideuram Asset Management (Ireland) dac | 2.839 | 186 | ||||||
| 2026-01-22 | 13F | Financial Consulate, Inc | 8 | 1 | ||||||
| 2026-02-14 | 13F | Taikang Asset Management (Hong Kong) Co Ltd | 80.000 | 54,40 | 5.753 | 47,64 | ||||
| 2026-02-17 | 13F | Henry James International Management Inc. | 0 | -100,00 | 0 | |||||
| 2026-02-12 | 13F | Skopos Labs, Inc. | 18.461 | 393,61 | 1.340 | 511,87 | ||||
| 2026-02-17 | 13F | Point72 Asset Management, L.P. | 66.766 | 4.801 | ||||||
| 2026-02-17 | 13F | Point72 Asset Management, L.P. | Call | 21.000 | 0,00 | 1.510 | -4,37 | |||
| 2026-01-30 | 13F | Mizuho Securities Co. Ltd. | 66.740 | 5,33 | 4.799 | 0,71 | ||||
| 2025-11-14 | 13F | Axa S.a. | 0 | -100,00 | 0 | |||||
| 2026-02-10 | 13F | Quantbot Technologies LP | 404 | -93,64 | 29 | -93,92 | ||||
| 2025-09-25 | NP | NEWFX - NEW WORLD FUND INC Class A | 8.264.921 | -1,22 | 512.012 | 3,74 | ||||
| 2025-09-26 | NP | AAICX - Alger AI Enablers & Adopters Fund Class C | 148 | 9 | ||||||
| 2026-02-11 | 13F | Prudential Plc | 12.531 | 46,75 | 901 | 40,34 | ||||
| 2026-02-11 | 13F | Ovata Capital Management Ltd | 111.412 | 35,34 | 7.930 | 25,75 | ||||
| 2026-02-12 | 13F | CIBC Private Wealth Group, LLC | 796.100 | 4,70 | 57.248 | 0,12 | ||||
| 2025-09-26 | NP | ATVPX - Alger 35 Fund Class P | 0 | -100,00 | 0 | -100,00 | ||||
| 2025-09-26 | NP | DINT - Davis Select International ETF | 183.615 | 7,47 | 11.375 | 12,86 | ||||
| 2025-09-29 | NP | AIM INVESTMENT FUNDS (INVESCO INVESTMENT FUNDS) - Invesco Oppenheimer Global Allocation Fund Class R | 0 | -100,00 | 0 | -100,00 | ||||
| 2026-02-17 | 13F | Tudor Investment Corp Et Al | Call | 0 | -100,00 | 0 | -100,00 | |||
| 2026-02-13 | 13F | Thornburg Investment Management Inc | 176.758 | -2,83 | 12.711 | -7,08 | ||||
| 2026-02-12 | 13F | Quadrant Capital Group Llc | 31.741 | -0,49 | 2.282 | -4,84 | ||||
| 2026-02-04 | 13F | C WorldWide Group Holding A/S | 613.469 | -16,35 | 44 | -20,00 | ||||
| 2026-02-09 | 13F | Fisher Asset Management, LLC | 2.431.248 | -3,20 | 174.831 | -7,44 | ||||
| 2026-02-17 | 13F | Ardmore Road Asset Management LP | 0 | -100,00 | 0 | |||||
| 2025-10-15 | 13F | Net Worth Advisory Group | 0 | -100,00 | 0 | |||||
| 2025-09-25 | NP | JADE - JPMorgan Active Developing Markets Equity ETF | 1.313 | 0,00 | 81 | 5,19 | ||||
| 2026-02-11 | 13F | Parallel Advisors, LLC | 5.762 | 33,04 | 414 | 27,38 | ||||
| 2026-02-17 | 13F | Elequin Capital Lp | 449 | 32 | ||||||
| 2026-02-13 | 13F | Squarepoint Ops LLC | Put | 53.600 | -4,96 | 3.854 | -9,13 | |||
| 2026-02-13 | 13F | Caitong International Asset Management Co., Ltd | 697 | 25,81 | 50 | 21,95 | ||||
| 2026-02-13 | 13F | Bridgefront Capital, LLC | 10.903 | 238,50 | 784 | 223,97 | ||||
| 2026-02-13 | 13F | Squarepoint Ops LLC | 3.876 | -20,66 | 279 | -24,25 | ||||
| 2026-02-17 | 13F | Delaware Management Holdings, Inc. | 870.137 | 62.571 | ||||||
| 2025-11-14 | 13F | Binnacle Investments Inc | 118 | 0,00 | 9 | 33,33 | ||||
| 2026-02-03 | 13F | AnglePoint Asset Management Ltd | 31.999 | 0,00 | 2.301 | -4,36 | ||||
| 2026-02-11 | 13F | Capital International Ltd /ca/ | 371.377 | -23,68 | 26.706 | -27,02 | ||||
| 2025-09-26 | NP | FSYNX - Fidelity Sustainable Emerging Markets Equity Fund Fidelity Advisor Sustainable Emerging Markets Equity Fund: Class M | 724 | 74,46 | 45 | 83,33 | ||||
| 2026-02-17 | 13F | Fred Alger Management, Llc | 9.492 | -94,29 | 683 | -94,54 | ||||
| 2025-09-26 | NP | RINYX - International Developed Markets Fund Class Y | 133.195 | 12,23 | 8.251 | 17,85 | ||||
| 2026-02-17 | 13F | SummitTX Capital, L.P. | 9.659 | 695 | ||||||
| 2026-02-10 | 13F | Eurizon Capital SGR S.p.A. | 6 | 0 | ||||||
| 2026-02-10 | 13F | Jupiter Asset Management Ltd | 65.484 | -1,53 | 4.709 | -5,84 | ||||
| 2026-02-06 | 13F | IFP Advisors, Inc | 0 | -100,00 | 0 | -100,00 | ||||
| 2025-09-25 | NP | SEMVX - Hartford Schroders Emerging Markets Equity Fund Class A | 0 | -100,00 | 0 | -100,00 | ||||
| 2025-09-26 | NP | REMSX - Emerging Markets Fund Class S | 24.867 | -50,97 | 1.541 | -48,51 | ||||
| 2026-02-10 | 13F | Td Asset Management Inc | 36.340 | 25,45 | 2.613 | 19,97 | ||||
| 2026-02-17 | 13F | Maytus Capital Management, LLC | 0 | -100,00 | 0 | |||||
| 2026-02-17 | 13F | SageView Advisory Group, LLC | 100 | 7 | ||||||
| 2026-02-17 | 13F | Boothbay Fund Management, Llc | 3.100 | 223 | ||||||
| 2026-02-06 | 13F | Abn Amro Investment Solutions | 257.971 | 191,05 | 18.551 | 178,32 | ||||
| 2025-09-26 | NP | PNQI - Invesco NASDAQ Internet ETF This fund is a listed as child fund of Invesco Ltd. and if that institution has disclosed ownership in this security, then these positions will not be double counted when calculating total shares and total value | 62.351 | -18,55 | 3.863 | -14,46 | ||||
| 2026-02-11 | 13F | Cerity Partners LLC | 17.539 | 3,73 | 1.261 | -0,79 | ||||
| 2025-11-12 | 13F | Victory Capital Management Inc | 0 | -100,00 | 0 | |||||
| 2026-02-11 | 13F | West Family Investments, Inc. | 6.192 | 0,00 | 445 | -4,30 | ||||
| 2026-02-12 | 13F | Brown Brothers Harriman & Co | 398 | 237,29 | 29 | 250,00 | ||||
| 2025-09-24 | NP | AAARX - Strategic Allocation: Aggressive Fund R Class This fund is a listed as child fund of American Century Companies Inc and if that institution has disclosed ownership in this security, then these positions will not be double counted when calculating total shares and total value | 7.037 | 0,00 | 436 | 4,82 | ||||
| 2026-02-03 | 13F | Ballentine Partners, LLC | 9.379 | 9,59 | 674 | 4,82 | ||||
| 2026-02-12 | 13F | Principal Securities, Inc. | 0 | -100,00 | 0 | -100,00 | ||||
| 2025-09-26 | NP | PASIX - PACE Alternative Strategies Investments Class A | Short | -9.671 | 12,10 | -599 | 17,91 | |||
| 2026-02-13 | 13F | Transamerica Financial Advisors, Inc. | 6 | 0 | ||||||
| 2026-02-17 | 13F | Liontrust Investment Partners LLP | 87.610 | -34,10 | 6.300 | -36,97 | ||||
| 2026-02-13 | 13F | Smartleaf Asset Management LLC | 2.882 | 10,89 | 208 | 5,58 | ||||
| 2026-02-10 | 13F | Acadian Asset Management Llc | 128.163 | 0,00 | 9 | 0,00 | ||||
| 2026-02-06 | 13F | True Light Capital Pte. Ltd. | 373.751 | 26.876 | ||||||
| 2026-02-17 | 13F | Jones Financial Companies Lllp | 496 | -41,92 | 36 | -45,31 | ||||
| 2026-02-17 | 13F | Advisory Services Network, LLC | 6.999 | -0,04 | 503 | -4,37 | ||||
| 2026-01-29 | 13F | Deltec Asset Management Llc | 5.500 | -15,38 | 396 | -19,06 | ||||
| 2026-02-09 | 13F | Intermede Investment Partners Ltd | 1.065.153 | -3,80 | 77 | -8,43 | ||||
| 2025-11-13 | 13F | FIL Ltd | 0 | -100,00 | 0 | |||||
| 2026-02-06 | 13F | EverSource Wealth Advisors, LLC | 909 | 15,80 | 65 | 10,17 | ||||
| 2026-02-13 | 13F | Caxton Associates Llp | 12.734 | -9,99 | 916 | -13,92 | ||||
| 2026-01-27 | 13F | TD Waterhouse Canada Inc. | 1.029 | -16,07 | 74 | -19,78 | ||||
| 2026-02-02 | 13F | Advisors Preferred, LLC | 866 | 65 | ||||||
| 2026-02-17 | 13F | Susquehanna International Group, Llp | Call | 746.600 | -20,11 | 53.688 | -23,60 | |||
| 2026-02-17 | 13F | Susquehanna International Group, Llp | 18.418 | 371,17 | 1.324 | 351,88 | ||||
| 2026-02-17 | 13F | Driehaus Capital Management Llc | 1.072.741 | 4,98 | 77.141 | 0,38 | ||||
| 2026-02-17 | 13F | Susquehanna International Group, Llp | Put | 368.300 | -3,38 | 26.484 | -7,61 | |||
| 2026-02-18 | 13F | Mackenzie Financial Corp | 137.440 | -0,05 | 9.920 | -4,06 | ||||
| 2026-02-17 | 13F | Magnetar Financial LLC | 924 | 66 | ||||||
| 2026-02-13 | 13F | Dynamic Technology Lab Private Ltd | 0 | -100,00 | 0 | |||||
| 2026-01-23 | 13F | Robeco Institutional Asset Management B.V. | 1.022.009 | 10,59 | 73.493 | 5,75 | ||||
| 2025-09-24 | NP | TWSMX - Strategic Allocation: Moderate Fund Investor Class This fund is a listed as child fund of American Century Companies Inc and if that institution has disclosed ownership in this security, then these positions will not be double counted when calculating total shares and total value | 6.600 | 0,00 | 409 | 4,88 | ||||
| 2026-02-13 | 13F | Sequoia China Equity Partners (Hong Kong) Ltd | 0 | -100,00 | 0 | |||||
| 2025-09-26 | NP | FHKCX - Fidelity China Region Fund This fund is a listed as child fund of Fmr Llc and if that institution has disclosed ownership in this security, then these positions will not be double counted when calculating total shares and total value | 177.436 | -30,51 | 10.992 | -27,02 | ||||
| 2025-10-30 | 13F | Twin Peaks Wealth Advisors, LLC | 0 | -100,00 | 0 | |||||
| 2026-02-13 | 13F | Pinnacle Wealth Planning Services, Inc. | 483 | 35 | ||||||
| 2026-02-12 | 13F | Cowa, Llc | 3.361 | 242 | ||||||
| 2025-11-14 | 13F | Cubist Systematic Strategies, LLC | Call | 0 | -100,00 | 0 | ||||
| 2026-02-10 | 13F | Norges Bank | 164.868 | 11.856 | ||||||
| 2026-02-11 | 13F | Capital Group Investment Management Pte. Ltd. | 79.189 | -24,01 | 5.694 | -27,34 | ||||
| 2026-02-13 | 13F | Pathstone Holdings, LLC | 19.976 | 2,94 | 1.436 | -1,58 | ||||
| 2025-11-13 | 13F | Connor, Clark & Lunn Investment Management Ltd. | 0 | -100,00 | 0 | |||||
| 2026-02-11 | 13F | Simplex Trading, Llc | 9.268 | -56,37 | 666 | 66.500,00 | ||||
| 2025-09-25 | NP | Dimensional Emerging Markets Value Fund - Dimensional Emerging Markets Value Fund This fund is a listed as child fund of Dimensional Fund Advisors Lp and if that institution has disclosed ownership in this security, then these positions will not be double counted when calculating total shares and total value | 686.188 | 10,02 | 42.509 | 15,54 | ||||
| 2026-02-17 | 13F | Quantitative Investment Management, LLC | 0 | -100,00 | 0 | |||||
| 2026-02-05 | 13F | Bessemer Group Inc | 32 | 0,00 | 0 | |||||
| 2026-02-10 | 13F/A | Northwestern Mutual Wealth Management Co | 4.094 | 11,58 | 294 | 6,91 | ||||
| 2025-09-25 | NP | DFA INVESTMENT DIMENSIONS GROUP INC - World ex U.S. Core Equity Portfolio Institutional Class Shares | 4.100 | 57,69 | 254 | 65,36 | ||||
| 2026-02-11 | 13F | Simplex Trading, Llc | Call | 54.300 | -27,89 | 3.905 | 77.980,00 | |||
| 2026-02-17 | 13F | Temasek Holdings (Private) Ltd | 2.239.671 | 67,11 | 161.055 | 59,80 | ||||
| 2026-02-05 | 13F | WIM INVESTMENT MANAGEMENT Ltd | 258.550 | 0,00 | 18.592 | -4,37 | ||||
| 2025-11-14 | 13F | Maxi Investments CY Ltd | 0 | -100,00 | 0 | |||||
| 2026-01-08 | 13F | Wealth Enhancement Advisory Services, Llc | 6.146 | 0,64 | 468 | 6,86 | ||||
| 2026-02-12 | 13F | Jane Street Group, Llc | Call | 254.100 | 4,22 | 18.272 | -0,33 | |||
| 2026-02-12 | 13F | Jane Street Group, Llc | 623.566 | -19,76 | 44.841 | -23,27 | ||||
| 2026-02-12 | 13F | Jane Street Group, Llc | Put | 345.600 | -8,40 | 24.852 | -12,41 | |||
| 2025-09-26 | NP | FBCG - Fidelity Blue Chip Growth ETF This fund is a listed as child fund of Fmr Llc and if that institution has disclosed ownership in this security, then these positions will not be double counted when calculating total shares and total value | 0 | -100,00 | 0 | -100,00 | ||||
| 2026-02-20 | 13F | Sunbelt Securities, Inc. | 52 | 0,00 | 4 | 0,00 | ||||
| 2026-02-17 | 13F | Anson Funds Management LP | 10.000 | 0,00 | 719 | -4,39 | ||||
| 2025-09-26 | NP | UGPIX - UltraChina ProFund Investor Class | 15.663 | 14,25 | 970 | 20,05 | ||||
| 2026-02-19 | 13F | Invesco Ltd. | 374.459 | 11,44 | 26.927 | 6,57 | ||||
| 2025-09-26 | NP | FFLG - Fidelity Growth Opportunities ETF | 0 | -100,00 | 0 | -100,00 | ||||
| 2026-02-17 | 13F | Cetera Investment Advisers | 19.898 | 3,51 | 1.431 | -1,04 | ||||
| 2026-02-06 | 13F | Larson Financial Group LLC | 85 | -32,00 | 6 | -33,33 | ||||
| 2026-01-23 | 13F | Westside Investment Management, Inc. | 137 | 0,00 | 10 | 0,00 | ||||
| 2026-02-12 | 13F | Federated Hermes, Inc. | 1.621.454 | 6,46 | 116.599 | 1,80 | ||||
| 2026-02-17 | 13F | Blackstone Group Inc | 0 | -100,00 | 0 | |||||
| 2025-11-12 | 13F | APG Asset Management N.V. | 0 | -100,00 | 0 | |||||
| 2025-11-12 | 13F | Picton Mahoney Asset Management | 0 | -100,00 | 0 | |||||
| 2026-02-03 | 13F | Sequoia Financial Advisors, LLC | 15.111 | 2,67 | 1.087 | -1,81 | ||||
| 2026-02-17 | 13F | Financial Avengers, Inc. | 150 | 0,00 | 11 | 0,00 | ||||
| 2026-02-13 | 13F | OMERS ADMINISTRATION Corp | 12.489 | 15,11 | 898 | 10,18 | ||||
| 2026-02-06 | 13F | Gsa Capital Partners Llp | 19.970 | -50,71 | 1 | -66,67 | ||||
| 2025-09-26 | NP | UUPIX - Ultraemerging Markets Profund Investor Class | 2.616 | 21,00 | 162 | 27,56 | ||||
| 2026-01-16 | 13F | Empirical Financial Services, LLC d.b.a. Empirical Wealth Management | 7.227 | 37,71 | 520 | 31,73 | ||||
| 2026-02-09 | 13F | AIA Group Ltd | 133.765 | -41,34 | 9.619 | -43,91 | ||||
| 2026-02-17 | 13F | Blair William & Co/il | 5.352 | 5,09 | 385 | 0,52 | ||||
| 2026-01-28 | 13F | Financial Perspectives, Inc | 434 | 0,00 | 31 | -3,12 | ||||
| 2026-02-10 | 13F | Green Court Capital Management Ltd | 426.108 | 0,00 | 29.793 | -7,02 | ||||
| 2026-02-12 | 13F | XY Capital Ltd | 0 | -100,00 | 0 | |||||
| 2026-02-12 | 13F | New York State Common Retirement Fund | 509.324 | -28,47 | 36.625 | -31,60 | ||||
| 2026-02-06 | 13F | Handelsbanken Fonder AB | 412.000 | -2,37 | 30 | -6,45 | ||||
| 2026-02-12 | 13F | Sit Investment Associates Inc | 0 | -100,00 | 0 | |||||
| 2026-01-26 | 13F | KBC Group NV | 166.651 | 0,27 | 12 | -8,33 | ||||
| 2026-01-23 | 13F | Farther Finance Advisors, LLC | 1.858 | 59,21 | 134 | 52,87 | ||||
| 2026-02-17 | 13F | Fwl Investment Management, Llc | 0 | -100,00 | 0 | |||||
| 2026-02-19 | 13F/A | Headwater Capital Co Ltd | 325.000 | -12,16 | 23.371 | -16,01 | ||||
| 2026-02-13 | 13F | Stifel Financial Corp | 3.819 | 12,36 | 275 | 7,45 | ||||
| 2025-11-05 | 13F | BI Asset Management Fondsmaeglerselskab A/S | 0 | -100,00 | 0 | |||||
| 2026-01-21 | 13F | Yousif Capital Management, Llc | 10.776 | 0,00 | 652 | -19,63 | ||||
| 2026-02-10 | 13F | Parametrica Management Ltd | 16.100 | 1.158 | ||||||
| 2026-02-09 | 13F | Jefferies Financial Group Inc. | 0 | -100,00 | 0 | |||||
| 2026-01-15 | 13F | Frank, Rimerman Advisors LLC | 10.975 | 0,20 | 789 | -4,13 | ||||
| 2025-09-24 | NP | ESIGX - Ashmore Emerging Markets Equity ESG Fund Institutional Class | 0 | -100,00 | 0 | -100,00 | ||||
| 2025-11-06 | 13F | Ameritas Advisory Services, LLC | 0 | -100,00 | 0 | |||||
| 2026-01-23 | 13F | Ritholtz Wealth Management | 15.304 | 0,09 | 1.100 | -4,26 | ||||
| 2026-01-23 | 13F | TT International Asset Management LTD | 45.163 | 50,21 | 3 | -99,87 | ||||
| 2026-02-24 | 13F | Bell Investment Advisors, Inc | 61 | 45,24 | 4 | 33,33 | ||||
| 2026-02-13 | 13F | Barclays Plc | Call | 22.900 | 0,00 | 1.647 | -4,41 | |||
| 2026-02-13 | 13F | Tairen Capital Ltd | 483.010 | 384,46 | 34.733 | 363,29 | ||||
| 2026-02-17 | 13F | Qube Research & Technologies Ltd | 325.865 | -38,68 | 23.433 | -41,36 | ||||
| 2025-09-24 | NP | AACRX - Strategic Allocation: Conservative Fund R Class This fund is a listed as child fund of American Century Companies Inc and if that institution has disclosed ownership in this security, then these positions will not be double counted when calculating total shares and total value | 1.689 | 0,00 | 105 | 5,05 | ||||
| 2025-11-07 | 13F | Sierra Ocean, Llc | 0 | -100,00 | 0 | |||||
| 2026-02-17 | 13F | Millennium Management Llc | Put | 32.200 | -58,88 | 2.316 | -60,68 | |||
| 2026-02-11 | 13F | Fox Run Management, L.l.c. | 5.920 | -72,45 | 426 | -73,68 | ||||
| 2026-02-17 | 13F | Millennium Management Llc | Call | 18.000 | -56,10 | 1.294 | -58,03 | |||
| 2026-01-30 | 13F | Flossbach Von Storch Ag | 45.000 | 0,00 | 3.236 | -4,40 | ||||
| 2026-02-17 | 13F | Millennium Management Llc | 210.104 | 47,37 | 15.109 | 40,92 | ||||
| 2026-02-18 | 13F | Wahed Invest LLC | 11.268 | 6,83 | 810 | 2,14 | ||||
| 2026-01-15 | 13F | Boston Common Asset Management, LLC | 335.934 | 104,12 | 24.157 | 95,19 | ||||
| 2026-02-13 | 13F | Gts Securities Llc | 35.586 | -67,53 | 2.559 | -68,96 | ||||
| 2026-02-10 | 13F | CIBC Asset Management Inc | 8.522 | 15,87 | 613 | 10,67 | ||||
| 2025-09-26 | NP | RTNAX - Tax-Managed International Equity Fund Class A | 315.860 | 7,14 | 19.568 | 12,52 | ||||
| 2026-02-11 | 13F | Capital International Inc /ca/ | 425.722 | -8,57 | 30.614 | -12,57 | ||||
| 2025-09-25 | NP | VTRIX - Vanguard International Value Fund Investor Shares This fund is a listed as child fund of Vanguard Group Inc and if that institution has disclosed ownership in this security, then these positions will not be double counted when calculating total shares and total value | 1.774.467 | 153,40 | 109.928 | 166,11 | ||||
| 2026-01-30 | 13F | Ares Financial Consulting, LLC | 22 | 2 | ||||||
| 2026-02-17 | 13F | Fmr Llc | 3.316.420 | -52,25 | 238.484 | -54,34 | ||||
| 2026-02-05 | 13F | Td Private Client Wealth Llc | 433 | 31 | ||||||
| 2026-02-11 | 13F | IMA Wealth, Inc. | 37 | 3 | ||||||
| 2025-12-15 | 13F/A | Hudson Bay Capital Management LP | 0 | -100,00 | 0 | -100,00 | ||||
| 2026-02-13 | 13F | Barclays Plc | Put | 60.000 | 0,00 | 4.315 | -4,39 | |||
| 2026-02-13 | 13F | Barclays Plc | 153.377 | 29,84 | 11.029 | 24,16 | ||||
| 2025-11-14 | 13F | Evelyn Partners Investment Management Services Ltd | 0 | -100,00 | 0 | |||||
| 2025-09-29 | NP | MMCFX - AMG Managers Emerging Opportunities Fund Class N | 0 | -100,00 | 0 | -100,00 | ||||
| 2026-02-10 | 13F | PARUS FINANCE (UK) Ltd | 97.785 | 0,77 | 7.032 | -3,65 | ||||
| 2026-02-09 | 13F | Coldstream Capital Management Inc | 8.195 | -16,74 | 589 | -20,41 | ||||
| 2026-02-13 | 13F | Evelyn Partners Asset Management Ltd | 4.912 | 0,00 | 353 | -4,34 | ||||
| 2026-02-03 | 13F | Crossmark Global Holdings, Inc. | 37.776 | 1,47 | 2.716 | -2,97 | ||||
| 2026-02-17 | 13F | Nomura Holdings Inc | 70.116 | 59,75 | 5.042 | 52,79 | ||||
| 2026-02-11 | 13F | Group One Trading, L.p. | Call | 189.200 | 4,13 | 13.605 | -0,42 | |||
| 2026-02-06 | 13F | Leonteq Securities AG | 11.123 | 9,38 | 800 | 4,58 | ||||
| 2025-10-17 | 13F | E Six Thirteen, Llc | 0 | -100,00 | 0 | |||||
| 2026-02-10 | 13F | AdvisorShares Investments LLC | 2.294 | 17,82 | 165 | 12,33 | ||||
| 2026-01-20 | 13F | AdvisorNet Financial, Inc | 35 | 16,67 | 3 | 0,00 | ||||
| 2025-09-25 | NP | PDEAX - PGIM JENNISON EMERGING MARKETS EQUITY OPPORTUNITIES FUND Class A | 233.035 | -10,39 | 14.437 | -5,89 | ||||
| 2026-02-17 | 13F | Citadel Advisors Llc | Put | 158.000 | 30,69 | 11.362 | 24,97 | |||
| 2026-02-17 | 13F | Citadel Advisors Llc | Call | 97.400 | -30,58 | 7.004 | -33,61 | |||
| 2026-02-02 | 13F | Fifth Third Bancorp | 290 | 346,15 | 21 | 400,00 | ||||
| 2026-02-06 | 13F | Pnc Financial Services Group, Inc. | 7.989 | -0,55 | 575 | -4,97 | ||||
| 2026-01-23 | 13F | Hardman Johnston Global Advisors LLC | 5.750 | 0,00 | 413 | -4,40 | ||||
| 2026-02-17 | 13F | Citadel Advisors Llc | 940.771 | 181,64 | 67.651 | 169,32 | ||||
| 2026-02-17 | 13F | Limestone Investment Advisors LP | 44.600 | 0,00 | 3.207 | -4,35 | ||||
| 2025-09-29 | NP | TRFM - AAM Transformers ETF | 6.508 | 50,30 | 403 | 58,04 | ||||
| 2026-01-23 | 13F | Lester Murray Antman dba SimplyRich | 8.464 | -18,73 | 1 | |||||
| 2026-02-11 | 13F | Harvest Fund Management Co., Ltd | 90.000 | 0,00 | 6 | 0,00 | ||||
| 2026-02-13 | 13F | Marshall Wace, Llp | Call | 0 | -100,00 | 0 | ||||
| 2026-02-17 | 13F | Schonfeld Strategic Advisors LLC | 13.432 | -61,71 | 966 | -63,42 | ||||
| 2026-02-17 | 13F | DV Trading LLC | 8 | 1 | ||||||
| 2025-11-13 | 13F | Clear Street Markets Llc | 0 | -100,00 | 0 | -100,00 |