Grundlæggende statistik
| Institutionelle ejere | 514 total, 497 long only, 1 short only, 16 long/short - change of -13,30% MRQ |
| Gennemsnitlig porteføljeallokering | 0.2834 % - change of -35,47% MRQ |
| Institutionelle aktier (lange) | 60.321.975 (ex 13D/G) - change of -8,73MM shares -12,64% MRQ |
| Institutionel værdi (lang) | $ 7.888.392 USD ($1000) |
Institutionelt ejerskab og aktionærer
NetEase, Inc. - Depositary Receipt (Common Stock) (US:NTES) har 514 institutionelle ejere og aktionærer, der har indsendt 13D/G- eller 13F-formularer til Securities Exchange Commission (SEC). Disse institutioner har i alt 60,324,371 aktier. Største aktionærer omfatter Ubs Asset Management Americas Inc, Ninety One UK Ltd, Orbis Allan Gray Ltd, Greenwoods Asset Management Hong Kong Ltd., Harding Loevner Lp, Dodge & Cox, Fmr Llc, Capital World Investors, AIM INVESTMENT FUNDS (INVESCO INVESTMENT FUNDS) - Invesco Oppenheimer Developing Markets Fund Class R6, and Invesco Ltd. .
NetEase, Inc. - Depositary Receipt (Common Stock) (NasdaqGS:NTES) institutionel ejerskabsstruktur viser aktuelle positioner i virksomheden efter institutioner og fonde, samt seneste ændringer i positionsstørrelse. Større aktionærer kan omfatte individuelle investorer, investeringsforeninger, hedgefonde eller institutioner. Skema 13D angiver, at investoren besidder (eller besidder) mere end 5 % af virksomheden og har til hensigt (eller har til hensigt at) aktivt at forfølge en ændring i forretningsstrategi. Skema 13G indikerer en passiv investering på over 5%.
The share price as of March 6, 2026 is 117,82 / share. Previously, on March 10, 2025, the share price was 102,40 / share. This represents an increase of 15,06% over that period.

Fondens stemningsscore
Fund Sentiment Score (fka Ownership Accumulation Score) finder de aktier, der bliver mest købt af fonde. Det er resultatet af en sofistikeret, multi-faktor kvantitativ model, der identificerer virksomheder med de højeste niveauer af institutionel akkumulering. Scoringsmodellen bruger en kombination af den samlede stigning i oplyste ejere, ændringerne i porteføljeallokeringer i disse ejere og andre målinger. Tallet går fra 0 til 100, hvor højere tal indikerer et højere niveau af akkumulering for sine jævnaldrende, og 50 er gennemsnittet.
Opdateringsfrekvens: Dagligt
Se Ownership Explorer, som giver en liste over højest rangerende virksomheder.
AI+ Ask Fintel’s AI assistant about NetEase, Inc. - Depositary Receipt (Common Stock).
Select a question to share a public post with an AI-crafted answer.
Thinking of good questions…
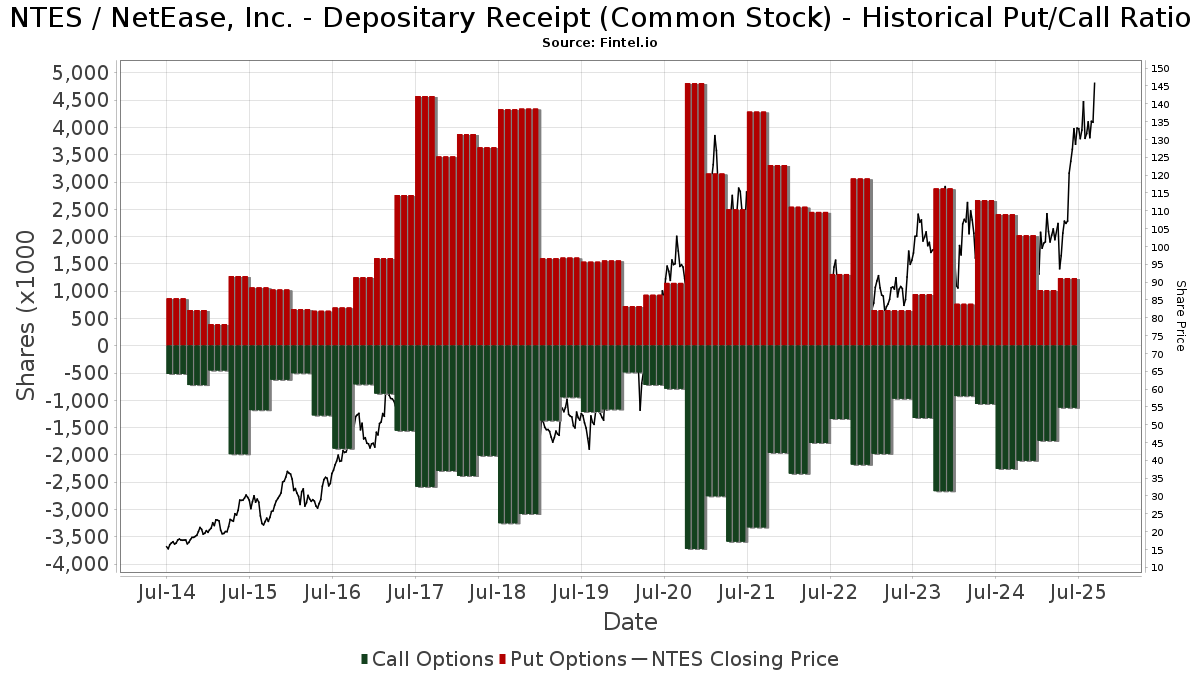
Institutionel Put/Call-forhold
Ud over at indberette standardaktie- og gældsudstedelser skal institutter med mere end 100 mill. aktiver under forvaltning også oplyse deres put- og call-optionsbeholdninger. Da salgsoptioner generelt indikerer negativ stemning, og købsoptioner indikerer positiv stemning, kan vi få en fornemmelse af den overordnede institutionelle stemning ved at plotte forholdet mellem put og kald. Diagrammet til højre viser det historiske put/call-forhold for dette instrument.
Brug af Put/Call Ratio som en indikator for investorernes stemning overvinder en af de vigtigste mangler ved at bruge totalt institutionelt ejerskab, som er, at en betydelig mængde af aktiver under forvaltning investeres passivt for at spore indekser. Passivt forvaltede fonde køber typisk ikke optioner, så indikatoren for put/call-forholdet følger mere nøje følelsen af aktivt forvaltede fonde.
13F og NPORT arkivering
Detaljer om 13F-arkivering er gratis. Detaljer om NP-ansøgninger kræver et premium-medlemskab. Grønne rækker angiver nye positioner. Røde rækker angiver lukkede positioner. Klik på linket ikon for at se den fulde transaktionshistorik.
Opgrader
for at låse premium-data op og eksportere til Excel ![]() .
.
| Fil dato | Kilde | Investor | Type | Gennemsnitlig pris (Øst) |
Aktier | Δ Aktier (%) |
Rapporteret Værdi ($1000) |
Δ Værdi (%) |
Port Alloc (%) |
|
|---|---|---|---|---|---|---|---|---|---|---|
| 2026-02-13 | 13F | Wells Fargo & Company/mn | 52.041 | 18,70 | 7.162 | 7,47 | ||||
| 2026-01-07 | 13F | Sagespring Wealth Partners, Llc | 1.555 | 1,24 | 214 | -8,15 | ||||
| 2026-02-13 | 13F | Aurora Investment Counsel | 16.406 | -14,52 | 2.258 | -22,63 | ||||
| 2026-02-12 | 13F | Hollencrest Capital Management | 0 | -100,00 | 0 | |||||
| 2025-09-26 | NP | FOKFX - Fidelity OTC K6 Portfolio This fund is a listed as child fund of Fmr Llc and if that institution has disclosed ownership in this security, then these positions will not be double counted when calculating total shares and total value | 1.176 | -1,34 | 153 | 20,47 | ||||
| 2026-02-17 | 13F | D. E. Shaw & Co., Inc. | 115.674 | 89,65 | 15.919 | 71,73 | ||||
| 2026-01-23 | 13F | Westside Investment Management, Inc. | 347 | 5,15 | 51 | 4,08 | ||||
| 2026-02-17 | 13F | GAM Holding AG | 10.903 | 35,58 | 1.500 | 22,75 | ||||
| 2026-02-12 | 13F | Renaissance Technologies Llc | 1.088.688 | 0,52 | 149.825 | -8,99 | ||||
| 2026-01-08 | 13F | Pine Haven Investment Counsel, Inc | 2.000 | 0,00 | 275 | -9,24 | ||||
| 2026-02-13 | 13F | Pinnacle Wealth Planning Services, Inc. | 232 | 32 | ||||||
| 2026-02-13 | 13F | Caitong International Asset Management Co., Ltd | 132 | -59,76 | 18 | -63,27 | ||||
| 2026-02-06 | 13F | Banque Cantonale Vaudoise | 4.621 | 4,57 | 636 | |||||
| 2026-02-12 | 13F | Marex Group plc | 1.826 | 251 | ||||||
| 2026-02-17 | 13F | Wellington Management Group Llp | 555.948 | -2,63 | 76.510 | -11,84 | ||||
| 2026-02-10 | 13F | Daiwa Securities Group Inc. | 5.700 | 29,55 | 1 | |||||
| 2026-02-12 | 13F | Penserra Capital Management LLC | 7.955 | -3,29 | 1 | 0,00 | ||||
| 2025-11-13 | 13F | Mark Sheptoff Financial Planning, Llc | 0 | -100,00 | 0 | |||||
| 2026-01-15 | 13F | Highline Wealth Partners Llc | 588 | 0,86 | 81 | -9,09 | ||||
| 2026-02-03 | 13F | NewEdge Wealth, LLC | 22.434 | 5,08 | 3.087 | 3,97 | ||||
| 2026-02-03 | 13F | Manning & Napier Advisors Llc | 39.607 | -2,29 | 5.563 | -9,72 | ||||
| 2026-02-09 | 13F | Atlantic Trust, LLC | 0 | -100,00 | 0 | |||||
| 2026-01-13 | 13F | Guerra Pan Advisors, Llc | 9.555 | 0,00 | 1.315 | -9,50 | ||||
| 2025-10-30 | 13F | Ridgewood Investments LLC | Call | 0 | -100,00 | 0 | -100,00 | |||
| 2026-02-05 | 13F | Atria Investments Llc | 8.134 | 44,12 | 1.119 | 30,57 | ||||
| 2026-01-23 | 13F | Ritholtz Wealth Management | 9.473 | 35,44 | 1.304 | 22,58 | ||||
| 2026-01-27 | 13F | WealthCollab, LLC | 54 | 0,00 | 7 | -12,50 | ||||
| 2026-02-13 | 13F | Verition Fund Management LLC | 1.674 | -12,77 | 230 | -20,96 | ||||
| 2026-01-16 | 13F | Ronald Blue Trust, Inc. | 3.341 | -6,52 | 460 | -15,47 | ||||
| 2026-02-10 | 13F | Guardcap Asset Management Ltd | 16.415 | -16,72 | 2.259 | -24,57 | ||||
| 2026-02-13 | 13F | Verition Fund Management LLC | Put | 15.000 | -53,56 | 2.064 | -57,95 | |||
| 2026-02-13 | 13F | Verition Fund Management LLC | Call | 7.400 | -50,34 | 1.018 | -55,04 | |||
| 2026-01-20 | 13F | Signaturefd, Llc | 4.294 | 3,35 | 591 | -6,50 | ||||
| 2025-11-14 | 13F | Boothbay Fund Management, Llc | Call | 0 | -100,00 | 0 | -100,00 | |||
| 2025-10-03 | 13F | West Oak Capital, LLC | 0 | -100,00 | 0 | |||||
| 2025-11-14 | 13F | Strategic Wealth Partners, Ltd. | 37 | 6 | ||||||
| 2026-02-13 | 13F | Prudential Financial Inc | 4.400 | -6,38 | 606 | -15,27 | ||||
| 2026-02-17 | 13F | Millennium Management Llc | Call | 47.400 | -81,47 | 6.523 | -83,22 | |||
| 2026-02-17 | 13F | Millennium Management Llc | Put | 5.000 | 0,00 | 688 | -9,35 | |||
| 2026-01-12 | 13F | Abound Wealth Management | 4 | 0,00 | 1 | |||||
| 2026-02-11 | 13F | Simplex Trading, Llc | Put | 17.800 | -56,05 | 2.450 | 40.716,67 | |||
| 2026-02-11 | 13F | Simplex Trading, Llc | Call | 12.600 | -28,00 | 1.734 | 86.600,00 | |||
| 2026-02-12 | 13F | BRYN MAWR TRUST Co | 0 | -100,00 | 0 | -100,00 | ||||
| 2026-02-17 | 13F | Millennium Management Llc | 386.811 | 156,75 | 53.233 | 132,47 | ||||
| 2026-01-30 | 13F | Mitsubishi UFJ Trust & Banking Corp | 67.211 | 22,12 | 9.250 | 10,57 | ||||
| 2026-02-02 | 13F | Qrg Capital Management, Inc. | 6.723 | 7,77 | 925 | -2,43 | ||||
| 2026-02-05 | 13F | Allworth Financial LP | 199 | -72,28 | 27 | -75,23 | ||||
| 2026-01-28 | 13F | DekaBank Deutsche Girozentrale | 9.200 | 0,00 | 1 | -100,00 | ||||
| 2026-02-13 | 13F | Mariner, LLC | 47.277 | -0,51 | 6.508 | -9,89 | ||||
| 2026-01-30 | 13F | BancorpSouth Bank | 8.255 | 0,00 | 1.136 | -9,41 | ||||
| 2026-02-13 | 13F | SRS Capital Advisors, Inc. | 594 | 607,14 | 82 | 575,00 | ||||
| 2025-09-26 | NP | FHKFX - Fidelity Series Emerging Markets Fund This fund is a listed as child fund of Fmr Llc and if that institution has disclosed ownership in this security, then these positions will not be double counted when calculating total shares and total value | 297.212 | 80,69 | 38.727 | 119,91 | ||||
| 2025-11-14 | 13F | Wetherby Asset Management Inc | 10.739 | -1,10 | 1.632 | 11,70 | ||||
| 2026-03-04 | 13F | Rehmann Capital Advisory Group | 2.538 | 24,47 | 352 | 13,92 | ||||
| 2025-09-25 | NP | Dfa Investment Trust Co - The Emerging Markets Series This fund is a listed as child fund of Dimensional Fund Advisors Lp and if that institution has disclosed ownership in this security, then these positions will not be double counted when calculating total shares and total value | 135.669 | -2,54 | 17.678 | 18,61 | ||||
| 2026-02-12 | 13F | Skopos Labs, Inc. | 16.256 | 170,98 | 2.265 | 184,91 | ||||
| 2025-11-12 | 13F | CIBC Bancorp USA Inc. | 1.566 | 238 | ||||||
| 2026-01-21 | 13F | Hartford Financial Management Inc. | 30 | 4 | ||||||
| 2026-01-15 | 13F | Lodestone Wealth Management LLC | 6 | 1 | ||||||
| 2026-02-11 | 13F | Capital World Investors | 1.507.792 | -2,91 | 207.502 | -12,09 | ||||
| 2026-02-05 | 13F | Elyxium Wealth, LLC | 37 | 5 | ||||||
| 2026-02-17 | 13F | Tower Research Capital LLC (TRC) | 3.184 | 148,56 | 438 | 125,77 | ||||
| 2026-02-18 | 13F | GWM Advisors LLC | 0 | -100,00 | 0 | |||||
| 2026-01-27 | 13F | Zurcher Kantonalbank (Zurich Cantonalbank) | 1.119 | 10,68 | 154 | 0,00 | ||||
| 2026-01-20 | 13F | Arta Finance Wealth Management LLC | 2.113 | 291 | ||||||
| 2026-02-13 | 13F | Keystone Investors Pte Ltd | 4.546 | 626 | ||||||
| 2026-02-17 | 13F | Orbis Allan Gray Ltd | 3.389.449 | -18,47 | 466.456 | -26,18 | ||||
| 2026-01-15 | 13F | Gunderson Capital Management Inc. | 0 | -100,00 | 0 | |||||
| 2026-01-26 | 13F | Reyes Financial Architecture, Inc. | 65 | -16,67 | 9 | -27,27 | ||||
| 2025-11-13 | 13F | Hsbc Holdings Plc | Put | 0 | -100,00 | 0 | -100,00 | |||
| 2025-11-13 | 13F | Hsbc Holdings Plc | Call | 0 | -100,00 | 0 | -100,00 | |||
| 2026-02-11 | 13F | Capital International Investors | 260.368 | 1,27 | 36.054 | -7,61 | ||||
| 2025-09-26 | NP | FEMYX - Fidelity Series Sustainable Emerging Markets Fund | 414 | 16,95 | 54 | 43,24 | ||||
| 2025-09-26 | NP | JHAAX - Multi-Asset Absolute Return Fund Class A | 1.947 | -18,09 | 254 | -0,39 | ||||
| 2026-02-05 | 13F | LGT Fund Management Co Ltd. | 14.900 | 2.093 | ||||||
| 2026-02-13 | 13F | Acumen Wealth Advisors, LLC | 78 | 11 | ||||||
| 2025-09-26 | NP | REMSX - Emerging Markets Fund Class S | 16.711 | 31,34 | 2.177 | 59,84 | ||||
| 2026-02-02 | 13F | Fifth Third Bancorp | 16.844 | 14,24 | 2.318 | 3,48 | ||||
| 2025-11-14 | 13F | Boothbay Fund Management, Llc | Put | 0 | -100,00 | 0 | -100,00 | |||
| 2025-11-14 | 13F | Main Management ETF Advisors, LLC | 0 | -100,00 | 0 | |||||
| 2026-02-05 | 13F | Abacus Wealth Partners, LLC | 2.927 | 403 | ||||||
| 2026-01-14 | 13F | TrueMark Investments, LLC | 3.246 | 447 | ||||||
| 2026-02-18 | 13F/A | Empowered Funds, LLC | 1.586 | 218 | ||||||
| 2026-02-10 | 13F | Bank of New York Mellon Corp | 5.833 | -2,18 | 803 | -11,48 | ||||
| 2026-02-10 | 13F/A | Guinness Atkinson Asset Management Inc | 15.860 | 10,96 | 2.210 | 2,13 | ||||
| 2025-09-26 | NP | Voya Prime Rate Trust | Short | -2.396 | -0,00 | -312 | 21,88 | |||
| 2026-02-13 | 13F | Heron Bay Capital Management | 5.302 | -0,56 | 730 | -10,00 | ||||
| 2026-02-11 | 13F | Axiom International Investors Llc /de | 60.162 | -23,82 | 8.279 | -31,03 | ||||
| 2026-02-17 | 13F | Snowden Capital Advisors LLC | 0 | -100,00 | 0 | |||||
| 2025-11-14 | 13F | Price T Rowe Associates Inc /md/ | 0 | -100,00 | 0 | |||||
| 2026-02-13 | 13F | Dodge & Cox | 2.154.376 | -6,03 | 296.485 | -14,91 | ||||
| 2026-02-13 | 13F | Ieq Capital, Llc | 5.464 | 7,14 | 752 | -3,10 | ||||
| 2026-02-04 | 13F | Legacy Financial Advisors, Inc. | 0 | -100,00 | 0 | |||||
| 2026-02-04 | 13F | MONECO Advisors, LLC | 1.497 | 206 | ||||||
| 2026-02-13 | 13F | Brown Advisory Inc | 4.325 | 595 | ||||||
| 2026-01-21 | 13F | Rathbone Brothers plc | 0 | -100,00 | 0 | |||||
| 2026-02-13 | 13F/A | Alberta Investment Management Corp | 0 | -100,00 | 0 | -100,00 | ||||
| 2026-01-15 | 13F | Allspring Global Investments Holdings, LLC | 2.310 | 49,42 | 341 | 47,19 | ||||
| 2026-01-27 | 13F | First Horizon Corp | 320 | 8,47 | 44 | 0,00 | ||||
| 2026-01-14 | 13F | Jfs Wealth Advisors, Llc | 131 | 0,00 | 18 | -5,26 | ||||
| 2026-02-18 | 13F | Beacon Pointe Advisors, LLC | Call | 5.000 | 127,27 | 688 | 105,99 | |||
| 2026-02-04 | 13F | Pacer Advisors, Inc. | 0 | -100,00 | 0 | |||||
| 2026-01-22 | 13F | Massachusetts Financial Services Co /ma/ | 1.217.124 | -2,72 | 167.501 | -11,92 | ||||
| 2026-01-08 | 13F | Sanders Morris Harris Llc | 0 | -100,00 | 0 | -100,00 | ||||
| 2026-01-26 | 13F | PDS Planning, Inc | 2.055 | 2,24 | 283 | -7,54 | ||||
| 2026-02-13 | 13F | Panagora Asset Management Inc | 13.655 | -0,91 | 1.879 | -10,27 | ||||
| 2026-02-17 | 13F | Public Employees Retirement System Of Ohio | 105.480 | 0,00 | 14.516 | -9,45 | ||||
| 2026-02-17 | 13F | Harding Loevner Lp | 2.476.401 | -2,57 | 340.840 | -11,77 | ||||
| 2026-02-17 | 13F | Polar Capital Holdings Plc | 1.750 | 0,00 | 241 | -9,43 | ||||
| 2026-01-05 | 13F | GAMMA Investing LLC | 32 | 0,00 | 4 | 0,00 | ||||
| 2026-02-19 | 13F | Mcguire Capital Advisors Inc | 912 | 126 | ||||||
| 2025-09-25 | NP | WINAX - Wilmington International Fund Class A Shares | 8.865 | -63,94 | 1.155 | -56,12 | ||||
| 2025-09-26 | NP | UUPIX - Ultraemerging Markets Profund Investor Class | 1.669 | 13,31 | 217 | 38,22 | ||||
| 2026-01-30 | 13F | Ares Financial Consulting, LLC | 8 | 1 | ||||||
| 2026-01-13 | 13F | Trust Point Inc. | 3.214 | -5,02 | 442 | -14,01 | ||||
| 2026-01-29 | 13F | WT Asset Management Ltd | 0 | -100,00 | 0 | |||||
| 2026-01-08 | 13F | Wealth Enhancement Advisory Services, Llc | 7.519 | 11,24 | 1.099 | 8,61 | ||||
| 2026-01-28 | 13F | Old National Bancorp /in/ | 2.582 | 31,13 | 355 | 18,73 | ||||
| 2026-02-11 | 13F | Stirlingshire Investments, Inc. | 3.122 | 430 | ||||||
| 2026-02-11 | 13F | Prestige Wealth Management Group LLC | 10 | 0,00 | 1 | 0,00 | ||||
| 2026-01-14 | 13F | Generali Investments CEE, investicni spolecnost, a.s. | 11.525 | -29,83 | 1.586 | -36,46 | ||||
| 2026-02-05 | 13F | May Hill Capital, LLC | 5.746 | 112,42 | 791 | 92,21 | ||||
| 2025-09-26 | NP | FSSGX - Fidelity SAI Sustainable Emerging Markets Equity Fund | 3.187 | 100,31 | 415 | 144,12 | ||||
| 2026-01-23 | 13F | LOM Asset Management Ltd | 230 | 0,00 | 32 | -11,43 | ||||
| 2026-01-21 | 13F | Greenleaf Trust | 2.000 | 3,04 | 275 | -6,78 | ||||
| 2026-02-02 | 13F | Davis Selected Advisers | 426.164 | -28,34 | 58.649 | -35,12 | ||||
| 2026-01-07 | 13F | Harbor Investment Advisory, Llc | 8.819 | -0,34 | 1.214 | -9,75 | ||||
| 2026-01-22 | 13F | Maseco Llp | 2.017 | 0,40 | 278 | -9,18 | ||||
| 2026-01-27 | 13F | Ninety One UK Ltd | 6.295.537 | -0,01 | 866.392 | -9,46 | ||||
| 2026-02-18 | 13F | Beacon Pointe Advisors, LLC | 122 | -52,90 | 17 | -58,97 | ||||
| 2026-02-06 | 13F | Gsa Capital Partners Llp | 0 | -100,00 | 0 | |||||
| 2026-02-10 | 13F | Parametrica Management Ltd | 0 | -100,00 | 0 | |||||
| 2025-09-29 | NP | CRLSX - CATHOLIC RESPONSIBLE INVESTMENTS INTERNATIONAL EQUITY FUND Institutional Shares | 23.989 | 68,52 | 3.126 | 134,96 | ||||
| 2025-11-13 | 13F | Connor, Clark & Lunn Investment Management Ltd. | 0 | -100,00 | 0 | |||||
| 2026-02-17 | 13F | Tiger Pacific Capital LP | 0 | -100,00 | 0 | |||||
| 2026-02-13 | 13F | Resources Investment Advisors, LLC. | 2.088 | -2,20 | 287 | -11,42 | ||||
| 2026-02-13 | 13F | Arkadios Wealth Advisors | 1.859 | 5,87 | 256 | -4,14 | ||||
| 2026-01-22 | 13F | Venturi Wealth Management, LLC | 1.689 | 232 | ||||||
| 2026-02-13 | 13F | Integrated Wealth Concepts LLC | 0 | -100,00 | 0 | |||||
| 2026-01-27 | 13F | Evergreen Capital Management Llc | 0 | -100,00 | 0 | |||||
| 2025-09-25 | NP | PQEMX - PGIM QMA Emerging Markets Equity Fund Class R6 | 1.300 | 0,00 | 169 | 21,58 | ||||
| 2025-09-25 | NP | DFCEX - Emerging Markets Core Equity Portfolio - Institutional Class This fund is a listed as child fund of Dimensional Fund Advisors Lp and if that institution has disclosed ownership in this security, then these positions will not be double counted when calculating total shares and total value | 103.456 | 27,37 | 13.480 | 55,03 | ||||
| 2026-02-19 | 13F | Atomi Financial Group, Inc. | 14.041 | 15,96 | 1.932 | 5,00 | ||||
| 2026-02-10 | 13F | Acadian Asset Management Llc | 16.665 | -23,44 | 2 | -33,33 | ||||
| 2025-09-25 | NP | AMECX - INCOME FUND OF AMERICA Class A | 1.198.161 | -44,15 | 156.120 | -32,02 | ||||
| 2026-01-12 | 13F | Byrne Asset Management LLC | 220 | 0,00 | 30 | -9,09 | ||||
| 2026-02-17 | 13F | RMB Capital Management, LLC | 4.757 | -17,21 | 655 | -25,09 | ||||
| 2026-01-22 | 13F | Harwood Advisory Group, LLC | 15 | 0,00 | 2 | 0,00 | ||||
| 2026-02-13 | 13F | MAI Capital Management | 3.079 | 0,00 | 424 | -9,42 | ||||
| 2026-02-09 | 13F | Geode Capital Management, Llc | 71.004 | -4,27 | 9.772 | -13,32 | ||||
| 2026-02-17 | 13F | Boothbay Fund Management, Llc | 2.420 | 10,40 | 333 | 0,00 | ||||
| 2026-02-02 | 13F | Ativo Capital Management LLC | 37.086 | -10,28 | 5.104 | -18,77 | ||||
| 2026-02-17 | 13F | Cape Investment Advisory, Inc. | 11 | 2 | ||||||
| 2026-02-12 | 13F | New York State Common Retirement Fund | 97.386 | -30,31 | 13.402 | -36,90 | ||||
| 2025-10-29 | 13F | Stegent Equity Advisors, Inc. | 0 | -100,00 | 0 | |||||
| 2026-02-11 | 13F | Erste Asset Management GmbH | 0 | 0 | ||||||
| 2026-01-22 | 13F | Financial Consulate, Inc | 6 | 1 | ||||||
| 2026-02-09 | 13F | Expressive Wealth LLC | 2.764 | 380 | ||||||
| 2026-02-11 | 13F | Capital Wealth Planning, LLC | 105.551 | 37,52 | 15.575 | 33,52 | ||||
| 2026-02-13 | 13F | Transamerica Financial Advisors, Inc. | 21 | -97,11 | 3 | -98,18 | ||||
| 2026-01-16 | 13F | Compagnie Lombard Odier SCmA | 800 | 0,00 | 110 | -9,09 | ||||
| 2026-02-12 | 13F | Pitcairn Co | 0 | -100,00 | 0 | |||||
| 2026-01-29 | 13F | Kestra Private Wealth Services, Llc | 0 | -100,00 | 0 | |||||
| 2026-02-12 | 13F | Wealthspire Advisors, LLC | 0 | -100,00 | 0 | |||||
| 2025-11-06 | 13F | Financial Advocates Investment Management | 0 | -100,00 | 0 | |||||
| 2026-02-19 | 13F | Invesco Ltd. | 1.219.347 | -9,75 | 167.807 | -18,29 | ||||
| 2026-02-05 | 13F | Bank Julius Baer & Co. Ltd, Zurich | 6.900 | 950 | ||||||
| 2025-09-25 | NP | EEMGX - MFS Emerging Markets Equity Research Fund R4 | 422 | 2,18 | 55 | 22,73 | ||||
| 2025-11-04 | 13F | IMC-Chicago, LLC | 0 | -100,00 | 0 | -100,00 | ||||
| 2026-01-28 | 13F | Salomon & Ludwin, LLC | 3 | 0,00 | 0 | |||||
| 2026-01-27 | 13F | TD Waterhouse Canada Inc. | 856 | 91,93 | 118 | 77,27 | ||||
| 2026-02-11 | 13F | West Family Investments, Inc. | 3.114 | 0,00 | 429 | -9,51 | ||||
| 2026-02-09 | 13F | Choate Investment Advisors | 1.718 | 0,00 | 236 | -9,58 | ||||
| 2026-02-11 | 13F | Group One Trading, L.p. | Put | 7.100 | -28,28 | 977 | -35,04 | |||
| 2026-02-17 | 13F | Bank Of America Corp /de/ | 626.999 | 18,73 | 86.288 | 7,50 | ||||
| 2026-02-11 | 13F | Group One Trading, L.p. | Call | 62.700 | 3,12 | 8.629 | -6,62 | |||
| 2026-02-17 | 13F | Jones Financial Companies Lllp | 6.468 | -1,93 | 890 | -8,53 | ||||
| 2026-02-09 | 13F | Todd Asset Management Llc | 336.485 | -1,01 | 46.308 | -10,37 | ||||
| 2025-09-26 | NP | FSYNX - Fidelity Sustainable Emerging Markets Equity Fund Fidelity Advisor Sustainable Emerging Markets Equity Fund: Class M | 380 | 87,19 | 50 | 133,33 | ||||
| 2026-02-11 | 13F | Simplex Trading, Llc | 0 | -100,00 | 0 | -100,00 | ||||
| 2026-02-13 | 13F | Lavaca Capital Llc | 210 | 0,00 | 29 | -9,68 | ||||
| 2026-02-03 | 13F | Crossmark Global Holdings, Inc. | 123.275 | -0,01 | 16.965 | -9,46 | ||||
| 2026-02-05 | 13F | Thrivent Financial For Lutherans | 77.502 | -6,94 | 11 | -16,67 | ||||
| 2026-02-06 | 13F | Greenwoods Asset Management Hong Kong Ltd. | 3.212.200 | 0,00 | 442.063 | -9,45 | ||||
| 2026-02-17 | 13F | BTG Pactual Asset Management US LLC | 1.457 | 201 | ||||||
| 2026-01-16 | 13F | FNY Investment Advisers, LLC | 6.500 | 1 | ||||||
| 2026-02-02 | 13F | Truist Financial Corp | 33.539 | 7,89 | 4.616 | -2,31 | ||||
| 2026-02-13 | 13F | Causeway Capital Management Llc | 0 | -100,00 | 0 | |||||
| 2026-02-10 | 13F | Bnp Paribas Arbitrage, Sa | Call | 0 | -100,00 | 0 | -100,00 | |||
| 2026-02-12 | 13F | Alps Advisors Inc | 5.725 | -2,40 | 788 | -11,67 | ||||
| 2026-02-13 | 13F | Atlas Capital Advisors Llc | 338 | 0,00 | 47 | 2,22 | ||||
| 2025-11-14 | 13F | Arrowpoint Investment Partners (Singapore) Pte. Ltd. | 0 | -100,00 | 0 | |||||
| 2026-02-11 | 13F | IMA Wealth, Inc. | 17 | 2 | ||||||
| 2026-02-17 | 13F | Balyasny Asset Management Llc | Call | 1.600 | -5,88 | 220 | -14,73 | |||
| 2025-11-14 | 13F | Arrowpoint Investment Partners (Singapore) Pte. Ltd. | Put | 0 | -100,00 | 0 | ||||
| 2026-02-17 | 13F | Balyasny Asset Management Llc | 119.303 | 16.418 | ||||||
| 2026-02-10 | 13F | Fideuram Asset Management (Ireland) dac | 5.367 | 544 | ||||||
| 2026-02-11 | 13F | OPTIMAS CAPITAL Ltd | 30.477 | -50,92 | 4.194 | -55,56 | ||||
| 2025-09-25 | NP | TWAAX - Thrivent International Allocation Fund Class A | 8.410 | 1.162,76 | 1.096 | 1.966,04 | ||||
| 2026-02-02 | 13F | One Wealth Advisors, LLC | 3.497 | 19,64 | 481 | 8,33 | ||||
| 2025-09-25 | NP | DFA INVESTMENT DIMENSIONS GROUP INC - Emerging Markets Social Core Equity Portfolio Shares | 19.776 | -28,35 | 2.577 | -12,80 | ||||
| 2025-09-25 | NP | Thrivent Core Funds - Thrivent Core Emerging Markets Equity Fund | 62.026 | 940,53 | 8.082 | 1.587,06 | ||||
| 2026-01-13 | 13F | Mather Group, Llc. | 0 | -100,00 | 0 | |||||
| 2026-01-28 | 13F | Loring Wolcott & Coolidge Fiduciary Advisors Llp/ma | 700 | 0,00 | 92 | -9,80 | ||||
| 2026-01-27 | 13F | Bayforest Capital Ltd | 87 | -98,22 | 12 | -98,52 | ||||
| 2025-09-29 | NP | TIIV - AAM Todd International Intrinsic Value ETF | 2.319 | 302 | ||||||
| 2026-01-29 | 13F | Calamos Advisors LLC | Call | 0 | -100,00 | 0 | ||||
| 2025-11-14 | 13F | Point72 Asset Management, L.P. | 0 | -100,00 | 0 | -100,00 | ||||
| 2026-02-06 | 13F | Larson Financial Group LLC | 54 | 8,00 | 7 | 0,00 | ||||
| 2026-02-05 | 13F | Burford Brothers, Inc. | 2.058 | 0,00 | 283 | -9,29 | ||||
| 2026-02-09 | 13F | Guinness Asset Management LTD | 69.937 | 0,17 | 9.745 | -7,78 | ||||
| 2026-02-10 | 13F | State of Wyoming | 710 | 98 | ||||||
| 2026-01-23 | 13F | Farther Finance Advisors, LLC | 1.777 | 83,95 | 245 | 67,12 | ||||
| 2025-11-13 | 13F/A | Peak6 Llc | 0 | -100,00 | 0 | -100,00 | ||||
| 2025-11-14 | 13F | Squarepoint Ops LLC | Put | 0 | -100,00 | 0 | -100,00 | |||
| 2026-02-17 | 13F | Captrust Financial Advisors | 13.112 | 72,50 | 1.804 | 56,19 | ||||
| 2026-02-10 | 13F | Jupiter Asset Management Ltd | 27.539 | -2,10 | 3.790 | -11,37 | ||||
| 2025-11-14 | 13F | Axa S.a. | 0 | -100,00 | 0 | |||||
| 2026-02-17 | 13F | DZ BANK AG Deutsche Zentral Genossenschafts Bank, Frankfurt am Main | 8 | 0,00 | 1 | 0,00 | ||||
| 2026-02-05 | 13F | Cambridge Investment Research Advisors, Inc. | 4.710 | 2,97 | 1 | |||||
| 2026-02-17 | 13F | Fmr Llc | 1.867.943 | 76,58 | 257.066 | 59,89 | ||||
| 2025-11-14 | 13F | Squarepoint Ops LLC | 0 | -100,00 | 0 | -100,00 | ||||
| 2026-01-30 | 13F | Keybank National Association/oh | 7.338 | 14,75 | 1.010 | 3,91 | ||||
| 2026-01-12 | 13F | Willner & Heller, Llc | 2.983 | 0,00 | 410 | -9,49 | ||||
| 2026-02-02 | 13F | Benjamin Edwards Inc | 0 | -100,00 | 0 | |||||
| 2025-09-29 | NP | ODDS - Pacer BlueStar Digital Entertainment ETF | 1.092 | 117,53 | 142 | 167,92 | ||||
| 2026-02-13 | 13F | Barclays Plc | 14.527 | -29,63 | 1.999 | -36,28 | ||||
| 2026-01-23 | 13F | Robeco Institutional Asset Management B.V. | 145.535 | -14,49 | 20.029 | -22,58 | ||||
| 2026-02-17 | 13F | CWM Advisors, LLC | 9.327 | 1.284 | ||||||
| 2026-02-24 | 13F | MidFirst Bank | 412 | 3 | ||||||
| 2026-02-17 | 13F | Two Sigma Advisers, Lp | 10.100 | 236,67 | 1.390 | 205,27 | ||||
| 2026-02-17 | 13F | Prelude Capital Management, Llc | 3.927 | -36,06 | 540 | -42,12 | ||||
| 2026-02-03 | 13F | SBI Securities Co., Ltd. | 830 | 5,20 | 114 | -4,20 | ||||
| 2026-02-09 | 13F | Morningstar Investment Management LLC | 0 | -100,00 | 0 | |||||
| 2026-02-12 | 13F | Quadrant Capital Group Llc | 2.562 | -3,83 | 353 | -12,87 | ||||
| 2026-02-17 | 13F | Blair William & Co/il | 2.552 | 51,45 | 351 | 37,11 | ||||
| 2026-02-09 | 13F | Main Street Research LLC | 4.000 | -2,08 | 550 | -11,29 | ||||
| 2026-02-11 | 13F | Cookson Peirce & Co Inc | 4.961 | 2,18 | 683 | -7,46 | ||||
| 2025-09-23 | NP | SEKAX - DWS Emerging Markets Equity Fund Class A | 100 | 0,00 | 13 | 30,00 | ||||
| 2026-02-13 | 13F | State Street Corp | 34.956 | -44,58 | 4.811 | -49,82 | ||||
| 2025-09-29 | NP | SOCL - Global X Social Media ETF This fund is a listed as child fund of Mirae Asset Global Investments Co., Ltd. and if that institution has disclosed ownership in this security, then these positions will not be double counted when calculating total shares and total value | 51.117 | -20,88 | 6.661 | -3,70 | ||||
| 2026-02-12 | 13F | Callan Family Office, LLC | 11.446 | 68,10 | 1.575 | 52,32 | ||||
| 2026-02-17 | 13F | Northern Trust Corp | 551.628 | 7,46 | 75.915 | -2,70 | ||||
| 2026-01-15 | 13F | Range Financial Group LLC | 12.781 | 1.759 | ||||||
| 2026-02-11 | 13F | Franklin Resources Inc | 10.339 | -0,03 | 1.423 | -9,48 | ||||
| 2026-02-03 | 13F | Sequoia Financial Advisors, LLC | 6.170 | 0,31 | 849 | -9,10 | ||||
| 2026-02-17 | 13F | Citadel Advisors Llc | 10.405 | 1.432 | ||||||
| 2026-02-17 | 13F | Citadel Advisors Llc | Call | 30.700 | -20,88 | 4.225 | -28,37 | |||
| 2026-01-26 | 13F | KBC Group NV | 42.308 | 0,00 | 6 | -16,67 | ||||
| 2026-01-29 | 13F | Matthews International Capital Management Llc | 23.901 | 0,95 | 3.289 | -8,59 | ||||
| 2025-09-26 | NP | MSTFX - Morningstar International Equity Fund | 26.767 | -2,35 | 3.488 | 18,85 | ||||
| 2026-01-08 | 13F | Maridea Wealth Management LLC | 0 | -100,00 | 0 | |||||
| 2026-01-16 | 13F | TB Alternative Assets Ltd. | 0 | -100,00 | 0 | -100,00 | ||||
| 2026-02-17 | 13F | Citadel Advisors Llc | Put | 32.300 | -31,28 | 4.445 | -37,77 | |||
| 2026-02-10 | 13F | Ilmarinen Mutual Pension Insurance Co | 27.452 | 0,00 | 4 | -25,00 | ||||
| 2026-02-06 | 13F | Leonteq Securities AG | 4.790 | 81,16 | 659 | 64,34 | ||||
| 2026-02-24 | 13F | SG Trading Solutions, LLC | 3.567 | 0 | ||||||
| 2026-02-24 | 13F | Bell Investment Advisors, Inc | 61 | -14,08 | 8 | -20,00 | ||||
| 2026-02-05 | 13F | Bessemer Group Inc | 139 | 178,00 | 0 | |||||
| 2025-11-14 | 13F | Schonfeld Strategic Advisors LLC | 0 | -100,00 | 0 | -100,00 | ||||
| 2026-01-30 | 13F | Valued Wealth Advisors LLC | 4 | 0,00 | 1 | |||||
| 2026-02-03 | 13F | Legacy Wealth Managment, LLC/ID | 17 | 0,00 | 2 | 0,00 | ||||
| 2026-02-17 | 13F | Shelton Capital Management | 5.134 | -31,46 | 707 | -37,96 | ||||
| 2026-02-13 | 13F | Kestra Advisory Services, LLC | 0 | -100,00 | 0 | |||||
| 2026-02-05 | 13F | Td Private Client Wealth Llc | 1.518 | -38,47 | 209 | -44,39 | ||||
| 2026-02-10 | 13F | Mitsubishi UFJ Morgan Stanley Securities Co., Ltd. | 1.575 | 217 | ||||||
| 2026-02-12 | 13F | Aviva Plc | 68.828 | -6,56 | 9.472 | -15,39 | ||||
| 2026-01-08 | 13F | True Wealth Design, LLC | 39 | 105,26 | 5 | 150,00 | ||||
| 2026-01-29 | 13F | China Universal Asset Management Co., Ltd. | 26.100 | 0,00 | 3.592 | -9,46 | ||||
| 2026-02-13 | 13F | Polymer Capital Management (HK) LTD | 30.007 | 39,57 | 4.130 | 26,39 | ||||
| 2026-01-29 | 13F | Nbc Securities, Inc. | 114 | 48,05 | 16 | 36,36 | ||||
| 2026-02-13 | 13F | Stifel Financial Corp | 26.282 | 25,68 | 3.617 | 13,78 | ||||
| 2026-01-08 | 13F | Tuttle Tactical Management LLC | 4.951 | 681 | ||||||
| 2025-10-30 | 13F | Twin Peaks Wealth Advisors, LLC | 0 | -100,00 | 0 | |||||
| 2026-02-02 | 13F | Cornerstone Planning Group LLC | 35 | -84,02 | 5 | -98,32 | ||||
| 2026-02-13 | 13F | Pathstone Holdings, LLC | 5.019 | 35,61 | 691 | 22,78 | ||||
| 2026-01-27 | 13F | Novem Group | 0 | -100,00 | 0 | |||||
| 2025-09-24 | NP | Innovator ETFs Trust - Innovator IBD Breakout Opportunities ETF | 642 | 17,58 | 84 | 43,10 | ||||
| 2026-01-20 | 13F | Hanson & Doremus Investment Management | 1.963 | 0,00 | 0 | |||||
| 2026-02-17 | 13F | FIL Ltd | 0 | -100,00 | 0 | |||||
| 2026-01-20 | 13F | Myriad Asset Management US LP | 1.616 | -80,68 | 222 | -82,53 | ||||
| 2026-02-06 | 13F | Fischer Financial Services, Inc. | 5.000 | 0,00 | 688 | -9,35 | ||||
| 2026-02-12 | 13F | Federation des caisses Desjardins du Quebec | 782 | 18,31 | 108 | 7,00 | ||||
| 2025-09-26 | NP | DWLD - Davis Select Worldwide ETF | 58.600 | 0,00 | 7.636 | 21,71 | ||||
| 2025-11-06 | 13F | Abc Arbitrage Sa | 0 | -100,00 | 0 | |||||
| 2026-01-12 | 13F | Daymark Wealth Partners, Llc | 1.660 | -0,06 | 228 | -9,52 | ||||
| 2026-01-15 | 13F | Nisa Investment Advisors, Llc | 106 | 41,33 | 15 | 27,27 | ||||
| 2026-02-09 | 13F | William Blair Investment Management, Llc | 7.037 | 169,51 | 968 | 144,44 | ||||
| 2026-02-11 | 13F | J.Safra Asset Management Corp | 19 | 3 | ||||||
| 2025-11-13 | 13F | J Hagan Capital, Inc. | 0 | -100,00 | 0 | |||||
| 2026-02-11 | 13F | Outlook Wealth Advisors, LLC | 2.534 | 0,48 | 349 | -9,14 | ||||
| 2026-01-22 | 13F | HHM Wealth Advisors, LLC | 6 | 0,00 | 1 | |||||
| 2026-01-08 | 13F | Fulton Bank, N.a. | 0 | -100,00 | 0 | |||||
| 2026-02-17 | 13F | Old Mission Capital Llc | 19.993 | 2.751 | ||||||
| 2026-01-23 | 13F | Assetmark, Inc | 130.869 | 169,52 | 18.010 | 144,04 | ||||
| 2026-02-11 | 13F | Capital International Sarl | 12.031 | -0,97 | 1.656 | -10,35 | ||||
| 2026-02-10 | 13F | Natixis Advisors, L.p. | 49.552 | -39,42 | 7 | -50,00 | ||||
| 2026-02-12 | 13F | Advisors Asset Management, Inc. | 16.285 | 5,03 | 2.241 | -4,88 | ||||
| 2025-11-14 | 13F | Brandes Investment Partners, Lp | 0 | -100,00 | 0 | -100,00 | ||||
| 2026-01-21 | 13F | Newbridge Financial Services Group, Inc. | 0 | -100,00 | 0 | |||||
| 2025-09-25 | NP | DFSE - Dimensional Emerging Markets Sustainability Core 1 ETF | 11.496 | 1,85 | 1.498 | 23,92 | ||||
| 2025-09-26 | NP | RTNAX - Tax-Managed International Equity Fund Class A | 54.116 | 0,00 | 7.051 | 21,72 | ||||
| 2025-09-24 | NP | EMFIX - Ashmore Emerging Markets Equity Fund INSTITUTIONAL CLASS | 25.724 | 5,17 | 3.352 | 28,00 | ||||
| 2025-09-25 | NP | DFAX - Dimensional World ex U.S. Core Equity 2 ETF | 48.529 | 1,76 | 6.323 | 23,86 | ||||
| 2026-02-11 | 13F | Jpmorgan Chase & Co | 258.790 | 207,21 | 35.615 | 178,17 | ||||
| 2026-02-11 | 13F | Jpmorgan Chase & Co | Put | 15.000 | 0,00 | 2.064 | -9,43 | |||
| 2026-02-03 | 13F | Ballentine Partners, LLC | 4.837 | 9,51 | 666 | -0,89 | ||||
| 2026-02-13 | 13F | Kayne Anderson Rudnick Investment Management Llc | 7 | -98,10 | 1 | -100,00 | ||||
| 2026-02-17 | 13F | Banco Bilbao Vizcaya Argentaria, S.a. | 0 | -100,00 | 0 | |||||
| 2026-01-27 | 13F | Regions Financial Corp | 3.378 | 0,33 | 465 | -9,20 | ||||
| 2026-02-05 | 13F | Park Square Financial Group, LLC | 0 | -100,00 | 0 | |||||
| 2025-09-25 | NP | VEIEX - Vanguard Emerging Markets Stock Index Fund Investor Shares | 2.471 | -99,94 | 322 | -99,92 | ||||
| 2025-11-14 | 13F | ExodusPoint Capital Management, LP | 0 | -100,00 | 0 | |||||
| 2026-02-09 | 13F | Fisher Asset Management, LLC | 1.112.284 | -1,83 | 153.073 | -11,11 | ||||
| 2025-11-14 | 13F | Bayesian Capital Management, LP | 0 | -100,00 | 0 | |||||
| 2026-02-17 | 13F | J. Goldman & Co LP | 0 | -100,00 | 0 | |||||
| 2026-02-06 | 13F | Global Retirement Partners, LLC | 1.368 | -31,36 | 188 | -37,75 | ||||
| 2026-02-02 | 13F | Nkcfo Llc | 2.000 | 0,00 | 0 | |||||
| 2026-02-12 | 13F | Commonwealth Equity Services, Llc | 4.961 | 7,06 | 683 | |||||
| 2026-02-17 | 13F | EFG International AG | 80 | 11 | ||||||
| 2026-02-17 | 13F | Nomura Holdings Inc | 10.428 | -22,83 | 1.435 | -30,10 | ||||
| 2026-02-17 | 13F | Wiley Bros.-aintree Capital, Llc | 6.486 | -27,89 | 893 | -34,70 | ||||
| 2025-10-31 | 13F | Whittier Trust Co | 0 | -100,00 | 0 | |||||
| 2026-02-17 | 13F | Advisor Group Holdings, Inc. | 4.088 | -88,12 | 563 | -88,81 | ||||
| 2025-11-14 | 13F | Binnacle Investments Inc | 61 | 0,00 | 9 | 12,50 | ||||
| 2026-01-23 | 13F | Rsm Us Wealth Management Llc | 5.282 | -19,04 | 742 | -25,23 | ||||
| 2025-10-27 | 13F | RWC Asset Management LLP | 0 | -100,00 | 0 | -100,00 | ||||
| 2026-02-06 | 13F | Profund Advisors Llc | 24.255 | -13,32 | 3.338 | -21,54 | ||||
| 2026-02-13 | 13F | University of Illinois Foundation | 25 | 4 | ||||||
| 2026-02-03 | 13F | Ethic Inc. | 2.035 | 44,94 | 280 | 31,46 | ||||
| 2026-02-10 | 13F | Nomura Asset Management Co Ltd | 1.650 | 0,00 | 227 | -9,20 | ||||
| 2026-02-17 | 13F | CastleKnight Management LP | 7.200 | 0,00 | 991 | -9,51 | ||||
| 2026-02-06 | 13F | Pnc Financial Services Group, Inc. | 10.924 | 3,52 | 1.503 | -6,24 | ||||
| 2026-02-13 | 13F | Marshall Wace, Llp | 79.207 | 10.900 | ||||||
| 2026-02-02 | 13F | Oppenheimer Asset Management Inc. | 17.589 | 4,66 | 2.421 | -5,25 | ||||
| 2026-01-26 | 13F | Cwm, Llc | 845 | 36,51 | 0 | |||||
| 2026-02-13 | 13F | Parkside Financial Bank & Trust | 19 | 0,00 | 3 | 0,00 | ||||
| 2026-02-11 | 13F | Capital International Inc /ca/ | 193.997 | 1,94 | 26.698 | -7,70 | ||||
| 2026-02-13 | 13F | Centiva Capital, LP | 0 | -100,00 | 0 | -100,00 | ||||
| 2026-02-13 | 13F | Strategic Global Advisors, LLC | 51.376 | -3,38 | 7.070 | -12,52 | ||||
| 2026-02-11 | 13F | Deutsche Bank Ag\ | 71.468 | 111,08 | 9.835 | 91,12 | ||||
| 2026-02-13 | 13F | Hel Ved Capital Management Ltd | 0 | -100,00 | 0 | |||||
| 2026-02-13 | 13F | Sei Investments Co | 10.510 | -62,92 | 1.447 | -66,43 | ||||
| 2026-01-05 | 13F | Park Avenue Securities Llc | 2.759 | -69,43 | 0 | -100,00 | ||||
| 2026-01-29 | 13F | Teachers Retirement System Of The State Of Kentucky | 210.900 | 0,00 | 29 | -9,37 | ||||
| 2026-01-30 | 13F | Sigma Planning Corp | 0 | -100,00 | 0 | |||||
| 2026-02-06 | 13F | Envestnet Portfolio Solutions, Inc. | 0 | -100,00 | 0 | |||||
| 2026-02-09 | 13F | Prospera Financial Services Inc | 10.195 | 1.403 | ||||||
| 2026-02-17 | 13F | TCG Advisory Services, LLC | 0 | -100,00 | 0 | |||||
| 2026-01-21 | 13F | Yousif Capital Management, Llc | 3.497 | 0,00 | 480 | -9,79 | ||||
| 2025-11-14 | 13F | M&t Bank Corp | 0 | -100,00 | 0 | |||||
| 2026-02-12 | 13F | Steward Partners Investment Advisory, Llc | 1.157 | 0,00 | 159 | -9,14 | ||||
| 2026-02-13 | 13F | Destination Wealth Management | 2.397 | -7,38 | 330 | -16,28 | ||||
| 2026-01-05 | 13F | Rosenberg Matthew Hamilton | 1.572 | 0,00 | 216 | -9,24 | ||||
| 2026-02-17 | 13F | LMR Partners LLP | 21.080 | 292,33 | 2.901 | 255,51 | ||||
| 2026-02-17 | 13F | Clark Capital Management Group, Inc. | 0 | -100,00 | 0 | |||||
| 2025-11-12 | 13F | Victory Capital Management Inc | 0 | -100,00 | 0 | |||||
| 2026-02-13 | 13F | Smartleaf Asset Management LLC | 536 | 17,29 | 75 | 8,70 | ||||
| 2026-02-10 | 13F | Close Asset Management Ltd | 250 | 0,00 | 0 | |||||
| 2026-02-12 | 13F | Campbell & CO Investment Adviser LLC | 0 | -100,00 | 0 | |||||
| 2025-11-14 | 13F | Point72 Asia (Singapore) Pte. Ltd. | 0 | -100,00 | 0 | |||||
| 2026-01-28 | 13F | Financial Perspectives, Inc | 1.821 | 0,00 | 251 | -9,42 | ||||
| 2026-02-13 | 13F | American Century Companies Inc | 927.633 | 15,47 | 127.661 | 4,55 | ||||
| 2026-02-10 | 13F | AdvisorShares Investments LLC | 2.347 | -2,21 | 323 | -11,54 | ||||
| 2026-02-19 | 13F | CI Private Wealth, LLC | 216.200 | 85,24 | 29.737 | 67,63 | ||||
| 2025-09-25 | NP | DFA INVESTMENT DIMENSIONS GROUP INC - Emerging Markets Sustainability Core 1 Portfolio Institutional Class This fund is a listed as child fund of Dimensional Fund Advisors Lp and if that institution has disclosed ownership in this security, then these positions will not be double counted when calculating total shares and total value | 27.458 | 0,00 | 3.578 | 21,71 | ||||
| 2026-01-28 | 13F | Geneos Wealth Management Inc. | 16 | 77,78 | 2 | 100,00 | ||||
| 2026-02-11 | 13F | PBU - The Pension Fund of Early Childhood & Youth Educators | 321.279 | 44.214 | ||||||
| 2026-02-09 | 13F | Accent Capital Management, LLC | 180 | 0,00 | 25 | -11,11 | ||||
| 2026-01-15 | 13F | Frank, Rimerman Advisors LLC | 6.441 | 0,19 | 886 | -9,31 | ||||
| 2025-11-07 | 13F | Gf Fund Management Co. Ltd. | 0 | -100,00 | 0 | |||||
| 2025-09-26 | NP | PGJ - Invesco Golden Dragon China ETF This fund is a listed as child fund of Invesco Ltd. and if that institution has disclosed ownership in this security, then these positions will not be double counted when calculating total shares and total value | 71.923 | 13,17 | 9.372 | 37,73 | ||||
| 2026-02-17 | 13F | Quantinno Capital Management LP | 27.328 | 49,69 | 3.761 | 35,54 | ||||
| 2026-02-02 | 13F | Horizon Investments, LLC | 726 | 100 | ||||||
| 2025-10-15 | 13F | Pensionmark Financial Group, Llc | 0 | -100,00 | 0 | |||||
| 2026-02-17 | 13F | Limestone Investment Advisors LP | 26.467 | 0,00 | 3.642 | -9,45 | ||||
| 2026-01-27 | 13F | Checchi Capital Advisers, LLC | 2.526 | -0,63 | 348 | -10,10 | ||||
| 2026-02-12 | 13F | Principal Securities, Inc. | 0 | -100,00 | 0 | |||||
| 2026-02-17 | 13F | Amundi | 362.167 | -1,38 | 49.841 | -10,14 | ||||
| 2025-09-10 | NP | Putnam ETF Trust - Putnam PanAgora ESG Emerging Markets Equity ETF - | 10.250 | 9,38 | 1.336 | 33,10 | ||||
| 2026-02-10 | 13F | NINE MASTS CAPITAL Ltd | 4.235 | 584 | ||||||
| 2026-02-13 | 13F | Potomac Fund Management Inc /adv | 4.299 | 592 | ||||||
| 2026-02-17 | 13F | Jain Global LLC | 0 | -100,00 | 0 | |||||
| 2026-02-12 | 13F | Bank Of Montreal /can/ | 17.010 | -97,43 | 2.341 | -97,68 | ||||
| 2026-02-17 | 13F | Royal Bank Of Canada | 70.880 | -61,34 | 9.754 | -65,00 | ||||
| 2025-09-26 | NP | PNQI - Invesco NASDAQ Internet ETF This fund is a listed as child fund of Invesco Ltd. and if that institution has disclosed ownership in this security, then these positions will not be double counted when calculating total shares and total value | 18.141 | -20,58 | 2.364 | -3,35 | ||||
| 2026-02-12 | 13F | Advisory Resource Group | 9.274 | 10,63 | 1.276 | 0,16 | ||||
| 2026-02-11 | 13F | Fox Run Management, L.l.c. | 7.126 | 981 | ||||||
| 2026-02-10 | 13F | Envestnet Asset Management Inc | 145.795 | -34,06 | 20.064 | -40,30 | ||||
| 2025-11-04 | 13F | High Note Wealth, LLC | 0 | -100,00 | 0 | |||||
| 2026-01-20 | 13F | AdvisorNet Financial, Inc | 1.581 | 5,33 | 218 | -4,82 | ||||
| 2026-02-11 | 13F | Ovata Capital Management Ltd | 6.800 | -73,12 | 937 | -75,66 | ||||
| 2026-02-13 | 13F | First Trust Advisors Lp | 46.507 | -35,71 | 6.400 | -41,79 | ||||
| 2026-02-17 | 13F | SIH Partners, LLLP | 263.263 | 5,17 | 36.230 | -4,77 | ||||
| 2025-11-07 | 13F | Sierra Ocean, Llc | 0 | -100,00 | 0 | |||||
| 2026-02-06 | 13F | Hardy Reed LLC | 8.482 | -0,66 | 1.167 | -10,02 | ||||
| 2026-02-11 | 13F | Vise Technologies, Inc. | 7.507 | 4,31 | 1.033 | -5,49 | ||||
| 2026-02-11 | 13F | Greykasell Wealth Strategies, Inc. | 1.396 | 0,00 | 192 | -9,43 | ||||
| 2026-02-12 | 13F | Dimensional Fund Advisors Lp | 923.326 | 9,71 | 127.274 | -0,43 | ||||
| 2026-02-14 | 13F | Rockefeller Capital Management L.P. | 2.176 | 9,73 | 300 | -0,66 | ||||
| 2026-02-17 | 13F | Advisory Services Network, LLC | 0 | -100,00 | 0 | |||||
| 2026-01-12 | 13F | CVA Family Office, LLC | 700 | 0,00 | 96 | -9,43 | ||||
| 2026-01-23 | 13F | Steigerwald, Gordon & Koch Inc. | 250 | 0,00 | 34 | -8,11 | ||||
| 2026-02-17 | 13F | Ancora Advisors, LLC | 159 | -86,75 | 22 | -83,06 | ||||
| 2025-11-14 | 13F | Point72 Hong Kong Ltd | 55.781 | -25,47 | 8.478 | -15,83 | ||||
| 2026-01-15 | 13F | Capital Advisors Inc/ok | 1.500 | 0,00 | 206 | -9,25 | ||||
| 2026-02-17 | 13F | Mercer Global Advisors Inc /adv | 2.177 | 8,96 | 300 | -0,99 | ||||
| 2026-02-04 | 13F | Boston Private Wealth Llc | 19.927 | -25,41 | 2.742 | -32,46 | ||||
| 2026-02-12 | 13F | BlackRock, Inc. | 861.735 | -3,78 | 118.592 | -12,88 | ||||
| 2026-01-16 | 13F | Bangor Savings Bank | 24 | 3 | ||||||
| 2025-11-05 | 13F | SOUTH STATE Corp | 0 | -100,00 | 0 | |||||
| 2026-02-11 | 13F | Havemeyer Place LP | 1.346 | 185 | ||||||
| 2025-11-13 | 13F | Baird Financial Group, Inc. | 0 | -100,00 | 0 | |||||
| 2025-09-18 | NP | ABLG - TrimTabs All Cap International Free-Cash-Flow ETF | 5.902 | -35,66 | 769 | -21,69 | ||||
| 2026-01-14 | 13F | Spire Wealth Management | 436 | 31,33 | 60 | 20,00 | ||||
| 2026-01-12 | 13F | DAVENPORT & Co LLC | 11.539 | 15,53 | 1.588 | 4,55 | ||||
| 2026-02-18 | 13F | Mackenzie Financial Corp | 138.044 | -26,88 | 19.350 | -32,56 | ||||
| 2025-11-14 | 13F | Trexquant Investment LP | 0 | -100,00 | 0 | |||||
| 2026-02-17 | 13F | Hillhouse Capital Advisors, Ltd. | 0 | -100,00 | 0 | |||||
| 2025-09-25 | NP | DFAE - Dimensional Emerging Core Equity Market ETF | 54.252 | 3,95 | 7.069 | 26,53 | ||||
| 2026-02-17 | 13F | Guggenheim Capital Llc | 11.222 | -31,91 | 1.544 | -38,34 | ||||
| 2026-02-17 | 13F | Russell Investments Group, Ltd. | 122.904 | -11,46 | 16.914 | -19,83 | ||||
| 2026-02-06 | 13F | Kilter Group LLC | 0 | -100,00 | 0 | -100,00 | ||||
| 2026-01-14 | 13F | Exchange Traded Concepts, Llc | 39.509 | -21,37 | 5.437 | -28,80 | ||||
| 2026-02-13 | 13F | JustInvest LLC | 9.894 | 8,25 | 1.362 | -2,09 | ||||
| 2026-01-26 | 13F | Asset Dedication, LLC | 1.148 | -13,81 | 158 | -22,28 | ||||
| 2026-02-11 | 13F | LPL Financial LLC | 21.605 | -50,69 | 2.973 | -55,35 | ||||
| 2026-01-23 | 13F | Sumitomo Mitsui Trust Holdings, Inc. | 6.992 | 12,74 | 962 | 2,12 | ||||
| 2026-02-17 | 13F/A | Intesa Sanpaolo S.p.a. | 5.976 | 843 | ||||||
| 2026-02-10 | 13F | Mawer Investment Management Ltd. | 559.896 | 24,02 | 77.053 | 12,30 | ||||
| 2026-02-17 | 13F | Lazard Asset Management Llc | 354.287 | -3,76 | 48.757 | -12,86 | ||||
| 2026-02-17 | 13F | Toronto Dominion Bank | 1.160 | 0,00 | 159 | -9,66 | ||||
| 2026-01-29 | 13F | UBS Group AG | 425.902 | -2,12 | 58.613 | -11,37 | ||||
| 2026-02-18 | 13F | Cim, Llc | 0 | -100,00 | 0 | |||||
| 2026-02-10 | 13F | Goldman Sachs Group Inc | 179.120 | 7,31 | 24.651 | -2,83 | ||||
| 2025-09-25 | NP | IEMFX - T. Rowe Price Institutional Emerging Markets Equity Fund This fund is a listed as child fund of Price T Rowe Associates Inc /md/ and if that institution has disclosed ownership in this security, then these positions will not be double counted when calculating total shares and total value | 0 | -100,00 | 0 | -100,00 | ||||
| 2026-02-13 | 13F | Citigroup Inc | 162.675 | -1,68 | 22.387 | -10,98 | ||||
| 2025-09-26 | NP | DINT - Davis Select International ETF | 56.229 | -1,82 | 7.327 | 19,49 | ||||
| 2026-01-29 | 13F | Sanctuary Advisors, LLC | 18.303 | -3,95 | 2.519 | -13,05 | ||||
| 2026-02-10 | 13F | Norges Bank | 16.712 | 2.300 | ||||||
| 2026-02-13 | 13F | Ubs Asset Management Americas Inc | 8.144.927 | -4,75 | 1.120.905 | -13,76 | ||||
| 2026-02-11 | 13F | O'shaughnessy Asset Management, Llc | 49.617 | 16,71 | 6.828 | 5,68 | ||||
| 2026-02-06 | 13F | Abn Amro Investment Solutions | 16.878 | -12,45 | 2.323 | -20,75 | ||||
| 2026-02-06 | 13F | EverSource Wealth Advisors, LLC | 670 | 2,13 | 92 | -7,07 | ||||
| 2026-02-13 | 13F | Banco Santander, S.A. | 6.484 | 0,00 | 892 | -9,44 | ||||
| 2026-02-17 | 13F | Summit Global Investments | 3.571 | 9,31 | 0 | |||||
| 2026-01-29 | 13F | UBS Group AG | Put | 82.500 | 1,98 | 11.354 | -7,66 | |||
| 2026-01-29 | 13F | UBS Group AG | Call | 121.600 | -7,39 | 16.735 | -16,15 | |||
| 2025-09-23 | NP | KTRAX - DWS Global Income Builder Fund Class A | 1.000 | -87,25 | 130 | -84,49 | ||||
| 2026-01-27 | 13F | Proffitt & Goodson Inc | 50 | 0,00 | 7 | -14,29 | ||||
| 2026-02-13 | 13F | Mml Investors Services, Llc | 4.720 | -40,76 | 650 | -46,41 | ||||
| 2026-02-03 | 13F | Chesapeake Capital Corp /il/ | 4.296 | 0,00 | 591 | -9,36 | ||||
| 2026-02-14 | 13F | Frec Markets, Inc. | 1.603 | 221 | ||||||
| 2026-02-10 | 13F | Bnp Paribas Arbitrage, Sa | Put | 120 | -80,07 | 1.651 | -81,95 | |||
| 2026-02-14 | 13F | Taikang Asset Management (Hong Kong) Co Ltd | 62.000 | 12,73 | 8.532 | 2,07 | ||||
| 2026-02-17 | 13F | Engineers Gate Manager LP | 29.366 | 315,89 | 4.041 | 276,61 | ||||
| 2026-02-10 | 13F | Bnp Paribas Arbitrage, Sa | 194.625 | 30,41 | 26.784 | 18,08 | ||||
| 2026-02-13 | 13F | Headlands Technologies LLC | 15.296 | 2.105 | ||||||
| 2025-11-13 | 13F | Riggs Asset Managment Co. Inc. | 0 | -100,00 | 0 | -100,00 | ||||
| 2026-02-10 | 13F | Root Financial Partners, LLC | 4 | 1 | ||||||
| 2026-01-09 | 13F | Park Place Capital Corp | 80 | -16,67 | 11 | -21,43 | ||||
| 2026-01-29 | 13F | Rakuten Securities, Inc. | 105 | 320,00 | 14 | 366,67 | ||||
| 2026-02-11 | 13F | Myriad Asset Management Advisors LLC | 10.696 | 1.472 | ||||||
| 2026-02-13 | 13F | BNP Paribas Asset Management Holding S.A. | 69.947 | 1.922,17 | 10 | |||||
| 2026-02-10 | 13F | Peapack Gladstone Financial Corp | 2.209 | 8,98 | 0 | |||||
| 2026-02-12 | 13F | Brown Brothers Harriman & Co | 231 | -46,15 | 32 | -52,31 | ||||
| 2026-01-29 | 13F | Dunhill Financial, LLC | 3 | 0,00 | 0 | |||||
| 2026-02-05 | 13F | Central Asset Investments & Management Holdings (HK) Ltd | 0 | -100,00 | 0 | |||||
| 2026-02-17 | 13F | MIRAE ASSET GLOBAL ETFS HOLDINGS Ltd. | 112.498 | -22,64 | 15.482 | -29,96 | ||||
| 2026-02-10 | 13F | CIBC World Markets Inc. | 1.460 | 201 | ||||||
| 2026-02-13 | 13F | Great West Life Assurance Co /can/ | 15.263 | 0,00 | 2 | 0,00 | ||||
| 2026-01-27 | 13F | Institute for Wealth Management, LLC. | 25.370 | 3.491 | ||||||
| 2026-01-28 | 13F | B. Metzler seel. Sohn & Co. AG | 1.980 | 272 | ||||||
| 2026-02-09 | 13F | Legal & General Group Plc | 98.055 | -21,47 | 13.494 | -28,92 | ||||
| 2025-11-07 | 13F | Vanguard Group Inc | 0 | -100,00 | 0 | |||||
| 2026-01-15 | 13F | Trust Co | 2 | 0 | ||||||
| 2025-09-29 | NP | EBIZ - Global X E-commerce ETF This fund is a listed as child fund of Mirae Asset Global Investments Co., Ltd. and if that institution has disclosed ownership in this security, then these positions will not be double counted when calculating total shares and total value | 27.493 | 6,91 | 3.582 | 30,11 | ||||
| 2026-02-17 | 13F | Private Advisor Group, LLC | 30.709 | 48,75 | 4.226 | 34,71 | ||||
| 2026-01-30 | 13F | Us Bancorp \de\ | 41.164 | -31,21 | 5.665 | -37,72 | ||||
| 2025-09-26 | 13F | Capital A Wealth Management, LLC | 0 | -100,00 | 0 | |||||
| 2026-02-13 | 13F | Umb Bank N A/mo | 273 | 21,88 | 38 | 8,82 | ||||
| 2026-02-06 | 13F | Fairtree Asset Management (Pty) Ltd | 3.937 | 542 | ||||||
| 2026-02-03 | 13F | Washington Trust Advisors, Inc. | 62 | 24,00 | 9 | 14,29 | ||||
| 2026-01-09 | 13F | SG Americas Securities, LLC | 6.982 | 837,18 | 1 | |||||
| 2026-02-09 | 13F | Summitry Llc | 2.772 | 40,57 | 381 | 27,42 | ||||
| 2025-09-24 | NP | EAEMX - Parametric Emerging Markets Fund Investor Class | 2.610 | 0,00 | 340 | 21,86 | ||||
| 2026-02-13 | 13F | Gts Securities Llc | 9.392 | 59,73 | 1.293 | 44,68 | ||||
| 2026-02-06 | 13F | True Light Capital Pte. Ltd. | 27.202 | 3.744 | ||||||
| 2026-02-06 | 13F | Handelsbanken Fonder AB | 499.115 | -0,60 | 69 | -10,53 | ||||
| 2026-02-12 | 13F | Perseverance Asset Management International | 0 | -100,00 | 0 | |||||
| 2026-01-22 | 13F | Richardson Financial Services Inc. | 32 | -85,19 | 4 | -87,50 | ||||
| 2026-02-17 | 13F | Royal Capital Wealth Management, LLC | 2.000 | 0,00 | 275 | -9,24 | ||||
| 2026-02-17 | 13F | Edmond De Rothschild Holding S.a. | 40.000 | 6,38 | 5.505 | -3,68 | ||||
| 2026-02-03 | 13F | Cheviot Value Management, LLC | 18 | 0,00 | 2 | 0,00 | ||||
| 2025-11-13 | 13F | Nemes Rush Group LLC | 0 | -100,00 | 0 | |||||
| 2026-02-12 | 13F | XY Capital Ltd | Call | 1.600 | 220 | |||||
| 2026-02-12 | 13F | XY Capital Ltd | Put | 1.600 | 220 | |||||
| 2025-09-26 | NP | DGFAX - Davis Global Fund Class A | 146.360 | -1,55 | 19.071 | 19,82 | ||||
| 2026-02-12 | 13F | XY Capital Ltd | 13.295 | 1.830 | ||||||
| 2026-02-17 | 13F | Raymond James Financial Inc | 22.490 | 24,16 | 3.095 | 12,42 | ||||
| 2026-01-29 | 13F | IMC-Chicago, LLC | Put | 47.300 | -39,59 | 6.509 | -45,30 | |||
| 2026-02-12 | 13F | Polen Capital Management Llc | 0 | -100,00 | 0 | |||||
| 2026-01-29 | 13F | IMC-Chicago, LLC | Call | 71.600 | -7,01 | 9.854 | -15,81 | |||
| 2026-02-04 | 13F | Ameritas Advisory Services, LLC | 6.528 | -21,21 | 898 | -28,67 | ||||
| 2026-02-05 | 13F | Mission Wealth Management, Lp | 2.514 | 0,00 | 346 | -9,69 | ||||
| 2026-02-13 | 13F | Advyzon Investment Management, LLC | 9.618 | 14,54 | 1.324 | 3,68 | ||||
| 2026-02-12 | 13F | Jane Street Group, Llc | Call | 36.900 | 6,65 | 5.078 | -3,42 | |||
| 2026-02-12 | 13F | Jane Street Group, Llc | 192.268 | 39,53 | 26.460 | 26,33 | ||||
| 2025-09-29 | NP | AIM INVESTMENT FUNDS (INVESCO INVESTMENT FUNDS) - Invesco Oppenheimer Developing Markets Fund Class R6 | 1.250.866 | -22,55 | 162.988 | -5,74 | ||||
| 2026-02-09 | 13F/A | Swedbank AB | 192.100 | 35,19 | 26.437 | 22,41 | ||||
| 2026-02-12 | 13F | Jane Street Group, Llc | Put | 65.300 | -50,57 | 8.987 | -55,24 | |||
| 2026-01-23 | 13F | Bridgewater Advisors Inc. | 2.571 | -0,08 | 338 | -5,59 | ||||
| 2025-11-14 | 13F | Wolverine Trading, Llc | Put | 16.000 | -48,72 | 2.422 | -41,49 | |||
| 2025-09-26 | NP | FOCPX - Fidelity OTC Portfolio This fund is a listed as child fund of Fmr Llc and if that institution has disclosed ownership in this security, then these positions will not be double counted when calculating total shares and total value | 14.455 | -0,04 | 1.883 | 21,64 | ||||
| 2026-02-13 | 13F | Natixis | 1.860 | 0,00 | 256 | -9,57 | ||||
| 2026-01-27 | 13F | Ninety One SA (PTY) Ltd | 59.303 | 1,35 | 8.161 | -7,83 | ||||
| 2026-02-12 | 13F | Hrt Financial Lp | 10.400 | 511,76 | 1 | |||||
| 2026-01-29 | 13F | Advisors Capital Management, LLC | 1.552 | 0,71 | 214 | -8,97 | ||||
| 2026-02-13 | 13F | Pin Oak Investment Advisors Inc | 107 | 0,00 | 0 | -100,00 | ||||
| 2026-01-30 | 13F | Bogart Wealth, LLC | 0 | -100,00 | 0 | |||||
| 2025-11-14 | 13F | Scientech Research LLC | 0 | -100,00 | 0 | |||||
| 2025-11-14 | 13F | Wolverine Trading, Llc | 28.951 | 276,57 | 4.382 | 330,03 | ||||
| 2025-09-25 | NP | DFA INVESTMENT DIMENSIONS GROUP INC - World ex U.S. Core Equity Portfolio Institutional Class Shares | 43.586 | 0,00 | 5.679 | 21,71 | ||||
| 2026-02-20 | 13F | Sunbelt Securities, Inc. | 1.967 | 271 | ||||||
| 2025-11-14 | 13F | Wolverine Trading, Llc | Call | 25.700 | -25,51 | 3.890 | -15,01 | |||
| 2025-11-14 | 13F | Two Sigma Investments, Lp | 0 | -100,00 | 0 | |||||
| 2026-02-17 | 13F | Ameriprise Financial Inc | 38.857 | -77,24 | 5.347 | -79,42 | ||||
| 2025-11-12 | 13F | Cresset Asset Management, LLC | 2.020 | -6,39 | 307 | 5,86 | ||||
| 2026-01-22 | 13F | Pinnacle Bancorp, Inc. | 455 | 0,00 | 63 | -10,14 | ||||
| 2026-02-03 | 13F | Mitsubishi UFJ Kokusai Asset Management Co., Ltd. | 5.677 | 0,00 | 838 | -2,90 | ||||
| 2025-09-25 | NP | DEHP - Dimensional Emerging Markets High Profitability ETF | 2.732 | 356 | ||||||
| 2026-01-30 | 13F | FengHe Fund Management Pte. Ltd. | 12.400 | 1.706 | ||||||
| 2026-01-30 | 13F | North Star Investment Management Corp. | 34 | 161,54 | 5 | 300,00 | ||||
| 2026-01-20 | 13F | Moseley Investment Management Inc | 2.000 | 0,00 | 275 | -9,24 | ||||
| 2026-02-04 | 13F | Twin Lakes Capital Management, LLC | 83 | 0,00 | 11 | -8,33 | ||||
| 2026-02-13 | 13F | Tairen Capital Ltd | 0 | -100,00 | 0 | |||||
| 2026-01-14 | 13F | USA Financial Portformulas Corp | 0 | -100,00 | 0 | |||||
| 2026-02-17 | 13F | Laird Norton Trust Company, Llc | 14.565 | 2.004 | ||||||
| 2026-02-12 | 13F | Qtron Investments LLC | 0 | -100,00 | 0 | |||||
| 2026-02-17 | 13F | Dark Forest Capital Management Lp | 0 | -100,00 | 0 | -100,00 | ||||
| 2026-01-16 | 13F | Standard Life Aberdeen plc | 26.682 | 31,02 | 3.672 | 19,50 | ||||
| 2025-09-25 | NP | QLVE - FlexShares Emerging Markets Quality Low Volatility Index Fund | 280 | 16,67 | 36 | 44,00 | ||||
| 2026-01-21 | 13F | Aaron Wealth Advisors LLC | 2.357 | 39,14 | 324 | 26,07 | ||||
| 2026-02-11 | 13F | Allianz Asset Management GmbH | 6.449 | -38,74 | 888 | -44,53 | ||||
| 2026-02-09 | 13F | Huntington National Bank | 1.106 | -6,27 | 152 | -15,08 | ||||
| 2026-01-28 | 13F | HB Wealth Management, LLC | 2.349 | 21,02 | 323 | 9,49 | ||||
| 2026-02-13 | 13F | Walleye Trading LLC | Call | 19.900 | 107,29 | 2.739 | 87,66 | |||
| 2026-02-02 | 13F | Core Alternative Capital | 200 | 0,00 | 28 | -10,00 | ||||
| 2026-02-13 | 13F | Walleye Trading LLC | 15.970 | -42,48 | 2.198 | -47,93 | ||||
| 2026-02-17 | 13F | Boreal Capital Management LLC | 70 | 0,00 | 10 | -10,00 | ||||
| 2026-02-13 | 13F | Walleye Trading LLC | Put | 8.600 | -79,62 | 1.184 | -81,55 | |||
| 2026-02-13 | 13F | Vontobel Holding Ltd. | 21.075 | 0,53 | 2.900 | -8,98 | ||||
| 2026-02-17 | 13F | Temasek Holdings (Private) Ltd | 469.728 | 28,31 | 64.644 | 16,18 | ||||
| 2026-01-27 | 13F | Brighton Jones Llc | 0 | -100,00 | 0 | |||||
| 2026-02-11 | 13F | BI Asset Management Fondsmaeglerselskab A/S | 339.869 | 47 | ||||||
| 2026-02-13 | 13F | National Bank Of Canada /fi/ | 512 | 70 | ||||||
| 2026-02-04 | 13F | LRI Investments, LLC | 60 | 17,65 | 8 | 14,29 | ||||
| 2025-09-25 | NP | DFEM - Dimensional Emerging Markets Core Equity 2 ETF | 37.739 | 30,92 | 4.917 | 59,33 | ||||
| 2026-02-13 | 13F | Flow Traders U.s. Llc | 0 | -100,00 | 0 | |||||
| 2025-10-30 | 13F | Ridgewood Investments LLC | 7.665 | -17,22 | 1.165 | -6,50 | ||||
| 2025-10-31 | 13F | Whittier Trust Co Of Nevada Inc | 0 | -100,00 | 0 | |||||
| 2026-02-17 | 13F | Seldon Capital Lp | 0 | -100,00 | 0 | -100,00 | ||||
| 2026-02-20 | 13F | Kovitz Investment Group Partners, LLC | 0 | -100,00 | 0 | |||||
| 2026-01-23 | 13F | Diversify Advisory Services, LLC | 0 | -100,00 | 0 | |||||
| 2026-01-26 | 13F | Mirae Asset Global Investments Co., Ltd. | 34.483 | -11,37 | 4.746 | -19,75 | ||||
| 2026-01-29 | 13F | UMA Financial Services, Inc. | 13 | 44,44 | 2 | 0,00 | ||||
| 2026-01-29 | 13F | Concurrent Investment Advisors, LLC | 2.740 | 7,45 | 377 | -2,58 | ||||
| 2026-02-13 | 13F | Van Eck Associates Corp | 634.513 | -6,94 | 87 | -15,53 | ||||
| 2026-02-12 | 13F | Ci Investments Inc. | 72.356 | 9,06 | 9.958 | 99.470,00 | ||||
| 2026-02-13 | 13F | Colony Group, LLC | 17.646 | 865,85 | 2.428 | 776,53 | ||||
| 2026-01-05 | 13F | Union Bancaire Privee, UBP SA | 2.410 | 665,08 | 294 | 525,53 | ||||
| 2026-01-27 | 13F | Financial Management Professionals, Inc. | 181 | -4,23 | 25 | -14,29 | ||||
| 2025-11-14 | 13F | Two Sigma Securities, Llc | 0 | -100,00 | 0 | |||||
| 2026-02-17 | 13F | SageView Advisory Group, LLC | 90 | 12 | ||||||
| 2025-09-26 | NP | DILAX - Davis International Fund Class A | 27.940 | -1,41 | 3.641 | 19,97 | ||||
| 2026-02-13 | 13F | PCM Encore, LLC | 2.316 | 319 | ||||||
| 2026-02-17 | 13F | Dv Equities, Llc | 6.785 | 934 | ||||||
| 2025-11-12 | 13F | NewSquare Capital LLC | 0 | -100,00 | 0 | |||||
| 2025-11-06 | 13F | Midwest Trust Co | 0 | -100,00 | 0 | |||||
| 2026-01-08 | 13F | Nordea Investment Management Ab | 269.408 | -3,24 | 37.100 | -11,92 | ||||
| 2026-02-11 | 13F | Janney Montgomery Scott LLC | 15.530 | -84,97 | 2 | -86,67 | ||||
| 2026-01-28 | 13F | Davis Capital Management | 500 | 0,00 | 69 | -9,33 | ||||
| 2026-02-17 | 13F | United Capital Financial Advisers, Llc | 1.660 | 20,38 | 228 | 9,09 | ||||
| 2026-02-10 | 13F/A | Northwestern Mutual Wealth Management Co | 7.372 | 178,08 | 1.015 | 152,24 | ||||
| 2026-02-13 | 13F | Morgan Stanley | 894.440 | 25,37 | 123.093 | 13,52 | ||||
| 2026-02-11 | 13F | TCTC Holdings, LLC | 3.634 | 500 | ||||||
| 2026-01-09 | 13F | Marshall Financial Group LLC | 0 | -100,00 | 0 | |||||
| 2026-01-20 | 13F | Thurston, Springer, Miller, Herd & Titak, Inc. | 20 | 3 | ||||||
| 2026-02-17 | 13F | Optiver Holding B.V. | 160 | 0,00 | 22 | -8,33 | ||||
| 2026-01-12 | 13F | Legacy Wealth Asset Management, LLC | 3.496 | 481 | ||||||
| 2025-10-07 | 13F | Proathlete Wealth Management Llc | 0 | -100,00 | 0 | |||||
| 2025-11-10 | 13F | Everstar Asset Management, LLC | 0 | -100,00 | 0 | |||||
| 2025-11-14 | 13F | AXA Investment Managers S.A. | 31.529 | 4.792 | ||||||
| 2026-02-12 | 13F | Bank of Jackson Hole Trust | 0 | -100,00 | 0 | |||||
| 2025-09-25 | NP | abrdn Funds - abrdn Emerging Markets Dividend Active ETF | 12.871 | -17,60 | 1.677 | 0,30 | ||||
| 2026-02-17 | 13F | Quadrature Capital Ltd | 41.012 | 5.644 | ||||||
| 2026-02-17 | 13F | Cederberg Capital Ltd | 569.475 | 0,00 | 87 | 0,00 | ||||
| 2026-02-13 | 13F | Aspex Management (HK) Ltd | 147.655 | 0,00 | 20 | -9,09 | ||||
| 2026-01-30 | 13F | Flossbach Von Storch Ag | 15.000 | -14,29 | 2.064 | -22,38 | ||||
| 2026-02-09 | 13F | AIA Group Ltd | 6.984 | 961 | ||||||
| 2026-02-17 | 13F | Qube Research & Technologies Ltd | 208.656 | 98,18 | 28.715 | 79,45 | ||||
| 2026-01-26 | 13F | Private Trust Co Na | 16 | -89,40 | 2 | -90,91 | ||||
| 2026-02-12 | 13F | StoneX Group Inc. | 0 | -100,00 | 0 | |||||
| 2026-02-11 | 13F | Cerity Partners LLC | 19.314 | -4,48 | 2.658 | -13,54 | ||||
| 2026-02-17 | 13F | Credit Agricole S A | 23.270 | -16,26 | 3.202 | -24,18 | ||||
| 2026-01-29 | 13F | Pictet Asset Management Holding SA | 12.200 | -0,81 | 1.679 | -10,22 | ||||
| 2026-02-06 | 13F | HighTower Advisors, LLC | 61.616 | -2,27 | 8.480 | -11,51 | ||||
| 2026-02-10 | 13F | Savant Capital, LLC | 3.721 | -5,22 | 512 | -14,09 | ||||
| 2026-02-12 | 13F | DRW Securities, LLC | 8.078 | 1.112 | ||||||
| 2026-02-13 | 13F | Peak6 Llc | Call | 3.400 | -98,69 | 468 | -98,82 | |||
| 2026-02-06 | 13F | Kingdom Financial Group LLC. | 2.120 | 292 | ||||||
| 2026-02-13 | 13F | Peak6 Llc | Put | 400 | 0,00 | 55 | -8,33 | |||
| 2026-02-17 | 13F | Grantham, Mayo, Van Otterloo & Co. LLC | 2.700 | -82,47 | 372 | -84,15 | ||||
| 2026-01-22 | 13F | Bear Mountain Capital, Inc. | 1.778 | -1,28 | 242 | -11,72 | ||||
| 2026-02-10 | 13F | Brookmont Capital Management | 10.072 | 1.386 | ||||||
| 2026-02-02 | 13F | Strs Ohio | 390 | -33,79 | 54 | -40,45 | ||||
| 2026-02-18 | 13F | Vident Advisory, LLC | 19.411 | 117,10 | 2.671 | 96,69 | ||||
| 2026-01-21 | 13F | Sound Income Strategies, LLC | 15 | 0,00 | 2 | 0,00 | ||||
| 2026-02-13 | 13F | Arrowstreet Capital, Limited Partnership | 1.218.256 | -32,65 | 167.656 | -39,02 | ||||
| 2026-02-13 | 13F | Rhumbline Advisers | 6.659 | -0,92 | 916 | -10,28 | ||||
| 2026-01-16 | 13F | Crewe Advisors LLC | 12 | 0,00 | 2 | 0,00 | ||||
| 2025-10-22 | 13F | CoreCap Advisors, LLC | 0 | -100,00 | 0 | |||||
| 2025-09-26 | NP | UGPIX - UltraChina ProFund Investor Class | 10.685 | 32,65 | 1.392 | 61,48 | ||||
| 2026-02-10 | 13F | Bnp Paribas | 120 | 0,00 | 17 | -11,11 | ||||
| 2026-02-17 | 13F | Man Group plc | 874.835 | -17,09 | 120.395 | -24,93 | ||||
| 2025-09-26 | NP | FTLS - First Trust Long/Short Equity ETF This fund is a listed as child fund of First Trust Advisors Lp and if that institution has disclosed ownership in this security, then these positions will not be double counted when calculating total shares and total value | 46.678 | 6.082 | ||||||
| 2026-02-06 | 13F | Vestmark Advisory Solutions, Inc. | 4.214 | 4,23 | 580 | -5,70 | ||||
| 2026-02-17 | 13F | Veritas Asset Management LLP | 32.957 | -24,17 | 4.536 | -31,34 | ||||
| 2026-02-05 | 13F | HighMark Wealth Management LLC | 0 | -100,00 | 0 | |||||
| 2026-02-17 | 13F | Cetera Investment Advisers | 11.433 | -48,93 | 1.573 | -53,76 | ||||
| 2026-02-17 | 13F | Aspen Grove Capital, LLC | 0 | -100,00 | 0 | |||||
| 2026-02-11 | 13F | Renaissance Group Llc | 27.577 | -32,14 | 3.795 | -38,55 | ||||
| 2025-11-13 | 13F | Canada Pension Plan Investment Board | 0 | -100,00 | 0 | -100,00 | ||||
| 2026-02-11 | 13F | Syon Capital Llc | 2.091 | 49,46 | 288 | 35,38 | ||||
| 2026-01-23 | 13F | Lester Murray Antman dba SimplyRich | 4.928 | 0,04 | 1 | |||||
| 2026-02-11 | 13F | Parallel Advisors, LLC | 2.314 | 2,75 | 318 | -7,02 | ||||
| 2026-02-12 | 13F | Mount Yale Investment Advisors, LLC | 0 | -100,00 | 0 | |||||
| 2026-01-27 | 13F | Ninety One North America, Inc. | 500.241 | 3,41 | 68.843 | -6,37 | ||||
| 2026-02-13 | 13F | Neuberger Berman Group LLC | 80.248 | 9,23 | 11.062 | -0,94 | ||||
| 2026-01-14 | 13F | InTrack Investment Management Inc | 5.157 | 15,55 | 710 | 4,57 | ||||
| 2026-02-11 | 13F | Marks Group Wealth Management, Inc | 1.798 | -3,18 | 247 | -12,41 | ||||
| 2026-01-21 | 13F | Sowell Financial Services LLC | 0 | -100,00 | 0 | |||||
| 2025-09-26 | NP | FEMSX - Fidelity Series Emerging Markets Opportunities Fund This fund is a listed as child fund of Fmr Llc and if that institution has disclosed ownership in this security, then these positions will not be double counted when calculating total shares and total value | 387.268 | -8,33 | 50.461 | 11,57 | ||||
| 2026-02-09 | 13F | Hantz Financial Services, Inc. | 11.091 | 27,63 | 2 | 0,00 | ||||
| 2026-02-12 | 13F | CIBC Private Wealth Group, LLC | 1.522 | -2,81 | 209 | -12,18 | ||||
| 2026-02-17 | 13F | Creative Planning | 43.710 | 9,84 | 6.015 | -0,55 | ||||
| 2026-02-12 | 13F | Logan Capital Management Inc | 14.171 | 0,00 | 1.950 | -9,43 | ||||
| 2025-09-26 | NP | HLMIX - Harding Loevner International Equity Portfolio Institutional | 1.182.078 | -5,01 | 154.025 | 15,60 | ||||
| 2026-02-12 | 13F | Brinker Capital Investments, LLC | 9.582 | -2,28 | 1.319 | -11,54 | ||||
| 2026-03-06 | 13F | Hsbc Holdings Plc | 19.392 | 0,04 | 2.668 | -9,41 | ||||
| 2026-02-17 | 13F | Susquehanna International Group, Llp | Put | 194.100 | -29,72 | 26.712 | -36,37 | |||
| 2026-02-12 | 13F | Integrated Quantitative Investments LLC | 21.618 | 21,44 | 2.975 | 9,98 | ||||
| 2026-02-17 | 13F | Susquehanna International Group, Llp | Call | 226.900 | -18,18 | 31.226 | -25,91 | |||
| 2026-02-13 | 13F | Toroso Investments, LLC | 5.687 | -17,57 | 783 | -25,38 | ||||
| 2026-02-09 | 13F | Harbour Investments, Inc. | 379 | 7.480,00 | 52 | |||||
| 2026-02-17 | 13F | Susquehanna International Group, Llp | 73.024 | -8,11 | 10.050 | -16,80 | ||||
| 2026-01-07 | 13F | Baldwin Brothers Inc/ma | 0 | -100,00 | 0 | |||||
| 2026-02-13 | 13F | Ausdal Financial Partners, Inc. | 9.522 | -15,62 | 1.310 | -23,62 | ||||
| 2026-01-28 | 13F | CAPROCK Group, Inc. | 4.700 | 17,53 | 647 | 18,32 | ||||
| 2026-02-12 | 13F | Rossby Financial, LCC | 760 | 5.328,57 | 105 | 5.100,00 | ||||
| 2025-09-24 | NP | SNTKX - Steward International Enhanced Index Fund Class A | 9.295 | 24,92 | 1.211 | 52,14 | ||||
| 2026-02-13 | 13F | Walleye Capital LLC | Put | 1.200 | 165 | |||||
| 2026-02-18 | 13F | VGI Partners Ltd | 0 | -100,00 | 0 | |||||
| 2025-11-14 | 13F | Prosperity Wealth Management, Inc. | 3.100 | 17,87 | 471 | 33,43 | ||||
| 2026-01-26 | 13F | Iams Wealth Management, Llc | 4.499 | 619 | ||||||
| 2026-02-09 | 13F | Hartland & Co., LLC | 59 | 8 | ||||||
| 2026-02-13 | 13F | Walleye Capital LLC | 1 | 0 | ||||||
| 2026-02-13 | 13F | Schroder Investment Management Group | 36.535 | 3,67 | 5.028 | -6,14 | ||||
| 2026-02-17 | 13F | XTX Topco Ltd | 0 | -100,00 | 0 | |||||
| 2026-02-13 | 13F | Walleye Capital LLC | Call | 4.700 | 647 |