Grundlæggende statistik
| Institutionelle aktier (lange) | 532.703.968 - 59,75% (ex 13D/G) - change of -135,10MM shares -20,23% MRQ |
| Institutionel værdi (lang) | $ 65.252.302 USD ($1000) |
Institutionelt ejerskab og aktionærer
KKR & Co. Inc. (US:KKR) har 1397 institutionelle ejere og aktionærer, der har indsendt 13D/G- eller 13F-formularer til Securities Exchange Commission (SEC). Disse institutioner har i alt 532,703,968 aktier. Største aktionærer omfatter Vanguard Group Inc, BlackRock, Inc., Capital International Investors, State Street Corp, Wellington Management Group Llp, Fmr Llc, Massachusetts Financial Services Co /ma/, Principal Financial Group Inc, Geode Capital Management, Llc, and Norges Bank .
KKR & Co. Inc. (NYSE:KKR) institutionel ejerskabsstruktur viser aktuelle positioner i virksomheden efter institutioner og fonde, samt seneste ændringer i positionsstørrelse. Større aktionærer kan omfatte individuelle investorer, investeringsforeninger, hedgefonde eller institutioner. Skema 13D angiver, at investoren besidder (eller besidder) mere end 5 % af virksomheden og har til hensigt (eller har til hensigt at) aktivt at forfølge en ændring i forretningsstrategi. Skema 13G indikerer en passiv investering på over 5%.
The share price as of April 22, 2026 is 105,92 / share. Previously, on April 23, 2025, the share price was 106,81 / share. This represents a decline of 0,83% over that period.

Fondens stemningsscore
Fund Sentiment Score (fka Ownership Accumulation Score) finder de aktier, der bliver mest købt af fonde. Det er resultatet af en sofistikeret, multi-faktor kvantitativ model, der identificerer virksomheder med de højeste niveauer af institutionel akkumulering. Scoringsmodellen bruger en kombination af den samlede stigning i oplyste ejere, ændringerne i porteføljeallokeringer i disse ejere og andre målinger. Tallet går fra 0 til 100, hvor højere tal indikerer et højere niveau af akkumulering for sine jævnaldrende, og 50 er gennemsnittet.
Opdateringsfrekvens: Dagligt
Se Ownership Explorer, som giver en liste over højest rangerende virksomheder.
AI+ Ask Fintel’s AI assistant about KKR & Co. Inc..
Select a question to share a public post with an AI-crafted answer.
Thinking of good questions…
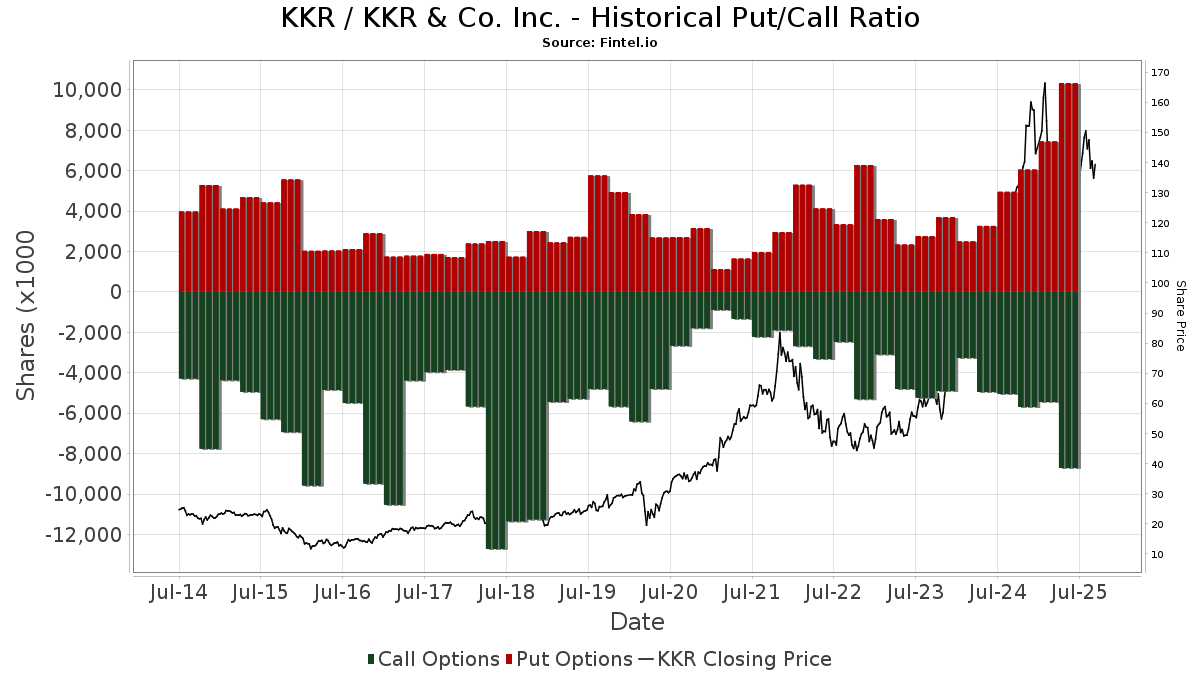
Institutionel Put/Call-forhold
Ud over at indberette standardaktie- og gældsudstedelser skal institutter med mere end 100 mill. aktiver under forvaltning også oplyse deres put- og call-optionsbeholdninger. Da salgsoptioner generelt indikerer negativ stemning, og købsoptioner indikerer positiv stemning, kan vi få en fornemmelse af den overordnede institutionelle stemning ved at plotte forholdet mellem put og kald. Diagrammet til højre viser det historiske put/call-forhold for dette instrument.
Brug af Put/Call Ratio som en indikator for investorernes stemning overvinder en af de vigtigste mangler ved at bruge totalt institutionelt ejerskab, som er, at en betydelig mængde af aktiver under forvaltning investeres passivt for at spore indekser. Passivt forvaltede fonde køber typisk ikke optioner, så indikatoren for put/call-forholdet følger mere nøje følelsen af aktivt forvaltede fonde.
13D/G-arkivering
Vi præsenterer 13D/G ansøgninger separat fra 13F ansøgninger på grund af den forskellige behandling af SEC. 13D/G-ansøgninger kan indgives af grupper af investorer (med én ledende), hvorimod 13F-ansøgninger ikke kan. Dette resulterer i situationer, hvor en investor kan indsende en 13D/G, der rapporterer én værdi for de samlede aktier (der repræsenterer alle de aktier, der ejes af investorgruppen), men derefter indsender en 13F, der rapporterer en anden værdi for de samlede aktier (der udelukkende repræsenterer deres egne) ejendomsret). Det betyder, at aktieejerskab af 13D/G-arkiver og 13F-arkiveringer ofte ikke er direkte sammenlignelige, så vi præsenterer dem separat.
Bemærk: Fra den 16. maj 2021 viser vi ikke længere ejere, der ikke har indsendt en 13D/G inden for det seneste år. Tidligere viste vi den fulde historie af 13D/G-arkiver. Generelt skal enheder, der er forpligtet til at indgive 13D/G-ansøgninger, indgive mindst årligt, før de indsender en afsluttende ansøgning. Dog forlader fonde nogle gange positioner uden at indsende en afsluttende ansøgning (dvs. de afvikler), så visning af den fulde historie resulterede nogle gange i forvirring om det nuværende ejerskab. For at undgå forvirring viser vi nu kun 'aktuelle' ejere - det vil sige - ejere, der har anmeldt inden for det seneste år.
Upgrade to unlock premium data.
| Fil dato | Form | Investor | Forrige Aktier |
Seneste Aktier |
Δ Aktier (Procent) |
Ejendomsret (Procent) |
Δ Ejerskab (Procent) |
|
|---|---|---|---|---|---|---|---|---|
| 2026-01-21 | BlackRock, Inc. | 43,420,058 | 44,890,451 | 3.39 | 5.02 | 2.45 |
13F og NPORT arkivering
Detaljer om 13F-arkivering er gratis. Detaljer om NP-ansøgninger kræver et premium-medlemskab. Grønne rækker angiver nye positioner. Røde rækker angiver lukkede positioner. Klik på linket ikon for at se den fulde transaktionshistorik.
Opgrader
for at låse premium-data op og eksportere til Excel ![]() .
.
Important Note
In an effort to reduce load times for our mobile users, we are testing some ways to deliver lighter pages.
In this first test, we will deliver only the most recent 750 transactions (out of 1769 for this stock). If you are interested in loading *all* the transactions for this company, click the "load all" button below. This is just a test and if you don't like it, please let us know by submitting some gentle feedback via the link at the bottom of this page.
Load All| Fil dato | Kilde | Investor | Type | Gennemsnitlig pris (Øst) |
Aktier | Δ Aktier (%) |
Rapporteret Værdi ($1000) |
Δ Værdi (%) |
Port Alloc (%) |
|
|---|---|---|---|---|---|---|---|---|---|---|
| 2026-04-17 | 13F | Anchyra Partners Llc | 0 | -100,00 | 0 | |||||
| 2026-02-12 | 13F | Advisors Asset Management, Inc. | 6.819 | -2,92 | 869 | -4,71 | ||||
| 2026-02-10 | 13F | Westpac Banking Corp | 7.778 | 62,11 | 992 | 59,07 | ||||
| 2026-01-27 | 13F | Regions Financial Corp | 152.719 | -4,85 | 19.469 | -6,66 | ||||
| 2025-11-14 | 13F | Wallace Capital Management Inc. | 0 | -100,00 | 0 | |||||
| 2026-02-17 | 13F | Russell Investments Group, Ltd. | 235.116 | 9,21 | 30.038 | 6,66 | ||||
| 2026-02-13 | 13F | Centaurus Financial, Inc. | 8.703 | 17,83 | 1 | |||||
| 2026-02-04 | 13F | Swiss Life Asset Management Ltd | 55.116 | -62,90 | 7.026 | -63,60 | ||||
| 2026-01-30 | 13F | Strategic Blueprint, LLC | 53.249 | 1,06 | 6.788 | -0,85 | ||||
| 2026-01-29 | 13F | IMC-Chicago, LLC | Call | 293.500 | 74,49 | 37.415 | 71,18 | |||
| 2026-02-17 | 13F | Parallax Volatility Advisers, L.P. | Call | 80.800 | 57,81 | 10.300 | 54,82 | |||
| 2026-02-17 | 13F | Parallax Volatility Advisers, L.P. | 32.689 | 233,26 | 4.167 | 227,08 | ||||
| 2026-02-17 | 13F | Parallax Volatility Advisers, L.P. | Put | 146.700 | 85,23 | 18.701 | 81,70 | |||
| 2026-04-09 | 13F | Tompkins Financial Corp | 0 | -100,00 | 0 | |||||
| 2026-02-12 | 13F | Capital Counsel Llc/ny | 7.936 | 0,00 | 1.012 | -1,94 | ||||
| 2025-11-14 | 13F | Wetherby Asset Management Inc | 13.094 | 0,91 | 1.702 | -1,45 | ||||
| 2026-02-12 | 13F | M&G Plc | 61.000 | 0,00 | 7.747 | -2,31 | ||||
| 2026-02-17 | 13F | Delta Global Management LP | 106.120 | -14,82 | 13.528 | -16,43 | ||||
| 2026-02-12 | 13F | Penserra Capital Management LLC | 159 | -96,73 | 0 | |||||
| 2026-02-17 | 13F | EFG International AG | 300 | 38 | ||||||
| 2026-01-29 | 13F | State Of Michigan Retirement System | 179.700 | -3,13 | 22.908 | -4,97 | ||||
| 2026-04-13 | 13F | Chickasaw Capital Management Llc | 100.304 | -0,56 | 9 | -25,00 | ||||
| 2026-02-05 | 13F | Thrivent Financial For Lutherans | 38.161 | 29,01 | 5 | 33,33 | ||||
| 2026-02-17 | 13F | Captrust Financial Advisors | 174.973 | 3,95 | 22.306 | 1,98 | ||||
| 2026-04-22 | 13F | Stone House Investment Management, LLC | 0 | -100,00 | 0 | |||||
| 2026-04-14 | 13F | Zrc Wealth Management, Llc | 11 | -99,63 | 1 | -99,73 | ||||
| 2026-04-22 | 13F | JNBA Financial Advisors | 25 | 0,00 | 2 | -33,33 | ||||
| 2026-01-29 | 13F | IMC-Chicago, LLC | Put | 420.200 | 165,28 | 53.567 | 160,24 | |||
| 2026-02-12 | 13F | Federated Hermes, Inc. | 86.397 | -51,68 | 11.014 | -52,60 | ||||
| 2025-11-14 | 13F | SummitTX Capital, L.P. | 0 | -100,00 | 0 | |||||
| 2026-02-03 | 13F | NewEdge Wealth, LLC | 24.382 | 18,53 | 3.108 | 27,12 | ||||
| 2026-02-17 | 13F | Modern Wealth Management, LLC | 1.725 | 2,92 | 220 | 1,38 | ||||
| 2026-02-20 | 13F | Sunbelt Securities, Inc. | 3.851 | 0,05 | 491 | -2,00 | ||||
| 2026-01-30 | 13F | Oakworth Capital, Inc. | 591 | 75 | ||||||
| 2026-01-07 | 13F | WESPAC Advisors SoCal, LLC | 0 | -100,00 | 0 | |||||
| 2025-11-07 | 13F | Synovus Financial Corp | 23.970 | 68,54 | 3.115 | 64,64 | ||||
| 2026-02-17 | 13F | one8zero8, LLC | 3.900 | -2,50 | 497 | -4,24 | ||||
| 2026-02-11 | 13F | MCF Advisors LLC | 1.363 | 5.352,00 | 174 | 5.666,67 | ||||
| 2026-02-17 | 13F | Bank Of America Corp /de/ | Put | 0 | -100,00 | 0 | ||||
| 2026-02-10 | 13F | Jupiter Asset Management Ltd | 0 | -100,00 | 0 | |||||
| 2025-11-14 | 13F | Binnacle Investments Inc | 7 | 0,00 | 1 | |||||
| 2025-11-14 | 13F | Select Equity Group, L.P. | 0 | -100,00 | 0 | |||||
| 2026-04-08 | 13F | Cadent Capital Advisors, LLC | 3.020 | 0,00 | 279 | -27,34 | ||||
| 2026-02-17 | 13F | Warren Averett Asset Management, LLC | 78.428 | 228,47 | 9.998 | 222,28 | ||||
| 2026-02-12 | 13F | Gardner Lewis Asset Management L P | 0 | -100,00 | 0 | |||||
| 2026-02-04 | 13F | GGM Financials LLC | 206 | 0,49 | 26 | 0,00 | ||||
| 2026-02-03 | 13F | Asset Planning,Inc | 670 | 0,15 | 85 | -1,16 | ||||
| 2026-02-12 | 13F | Intesa Sanpaolo Wealth Management | 41 | 5 | ||||||
| 2026-02-12 | 13F | Loomis Sayles & Co L P | 1.670 | -0,54 | 213 | -2,75 | ||||
| 2026-02-09 | 13F | Fisher Asset Management, LLC | 2.447 | 22,96 | 312 | 20,93 | ||||
| 2026-01-12 | 13F | Castleview Partners, Llc | 19.924 | 284.528,57 | 2.540 | |||||
| 2026-02-12 | 13F | Summit Financial, LLC | 50.842 | 0,05 | 6.481 | -1,85 | ||||
| 2026-02-05 | 13F | Cambridge Investment Research Advisors, Inc. | 108.526 | -1,26 | 14 | -7,14 | ||||
| 2026-02-17 | 13F | Twinbeech Capital Lp | 0 | -100,00 | 0 | |||||
| 2026-04-20 | 13F | Louisiana State Employees Retirement System | 35.000 | -0,28 | 3.238 | -27,65 | ||||
| 2025-11-14 | 13F | Mbb Public Markets I Llc | 0 | -100,00 | 0 | |||||
| 2026-04-10 | 13F | Bouvel Investment Partners, LLC | 0 | -100,00 | 0 | |||||
| 2026-02-23 | 13F | Wealth Preservation Advisors, LLC | 4.000 | 0,00 | 510 | -1,93 | ||||
| 2026-01-23 | 13F | Bridgewater Advisors Inc. | 0 | -100,00 | 0 | |||||
| 2026-02-05 | 13F | RiverFront Investment Group, LLC | 5.677 | 1,05 | 724 | -0,96 | ||||
| 2026-01-28 | 13F | Mowery & Schoenfeld Wealth Management, LLC | 10 | 1 | ||||||
| 2026-01-29 | 13F | Quest 10 Wealth Builders, Inc. | 9 | 0,00 | 1 | 0,00 | ||||
| 2026-02-17 | 13F | Graham Capital Management, L.P. | 0 | -100,00 | 0 | |||||
| 2026-01-23 | 13F | Diversify Advisory Services, LLC | 6.733 | 5,85 | 885 | 18,18 | ||||
| 2026-02-11 | 13F | Simplex Trading, Llc | Call | 168.800 | -23,69 | 21.519 | 76.750,00 | |||
| 2026-02-11 | 13F | Simplex Trading, Llc | Put | 334.500 | -0,86 | 42.642 | 99.067,44 | |||
| 2025-11-13 | 13F | Oribel Capital Management, LP | 0 | -100,00 | 0 | -100,00 | ||||
| 2026-02-12 | 13F | Litman Gregory Asset Management LLC | 694 | 88 | ||||||
| 2026-02-12 | 13F | Conservest Capital Advisors, Inc. | 1.903 | 0,16 | 243 | -1,63 | ||||
| 2026-03-04 | 13F | Rehmann Capital Advisory Group | 1.623 | 0,06 | 207 | -1,90 | ||||
| 2026-01-07 | 13F | Sagespring Wealth Partners, Llc | 7.318 | -6,46 | 933 | -8,27 | ||||
| 2026-02-17 | 13F | Sagewood Asset Management LP | 3.857 | 492 | ||||||
| 2026-04-17 | 13F | Krilogy Financial LLC | 8.413 | 858 | ||||||
| 2026-04-16 | 13F | Capital Advisors, Ltd. LLC | 123 | 35,16 | 0 | |||||
| 2026-02-10 | 13F | Eurizon Capital SGR S.p.A. | 79.705 | 10.167 | ||||||
| 2026-04-03 | 13F | Investors Research Corp | 6.725 | 622 | ||||||
| 2026-02-17 | 13F | Wiley Bros.-aintree Capital, Llc | 67.877 | 4,56 | 8.649 | 2,67 | ||||
| 2026-01-28 | 13F | Campbell Capital Management Inc | 92.800 | -0,48 | 11.830 | -2,37 | ||||
| 2026-01-14 | 13F | ORG Partners LLC | 186 | 39,85 | 24 | 35,29 | ||||
| 2026-04-14 | 13F | Prospera Financial Services Inc | 15.100 | 158,08 | 1.397 | 87,27 | ||||
| 2026-02-17 | 13F | Longaeva Partners L.P. | 105.345 | 13.429 | ||||||
| 2026-02-17 | 13F | Oddo Bhf Asset Management Sas | 0 | -100,00 | 0 | -100,00 | ||||
| 2026-01-27 | 13F | Duncker Streett & Co Inc | 4.700 | 0,00 | 599 | -1,80 | ||||
| 2026-04-20 | 13F | CWA Asset Management Group, LLC | 7.572 | -2,47 | 700 | -29,22 | ||||
| 2026-02-17 | 13F/A | Laurion Capital Management LP | Call | 0 | -100,00 | 0 | -100,00 | |||
| 2026-02-17 | 13F | Nomura Holdings Inc | 57.573 | -19,99 | 7.339 | -21,51 | ||||
| 2026-04-15 | 13F | Nations Financial Group Inc, /ia/ /adv | 3.378 | 313 | ||||||
| 2026-02-10 | 13F | Nomura Asset Management Co Ltd | 426.149 | -4,80 | 54.325 | -6,61 | ||||
| 2026-02-17 | 13F | Nomura Holdings Inc | Call | 2.100 | 268 | |||||
| 2026-02-12 | 13F | Founders Financial Alliance, LLC | 2.150 | -2,01 | 274 | -3,86 | ||||
| 2026-02-13 | 13F | Southeast Asset Advisors Inc. | 0 | -100,00 | 0 | |||||
| 2026-02-17 | 13F | Lighthouse Investment Partners, LLC | 5.579 | -94,11 | 711 | -94,22 | ||||
| 2026-02-02 | 13F | Advisors Preferred, LLC | 25.000 | 6,38 | 3.222 | 7,58 | ||||
| 2026-01-23 | 13F | Guidance Capital, Inc | 8.173 | 3,56 | 1.009 | 5,54 | ||||
| 2026-04-14 | 13F | West Branch Capital LLC | 3 | 0,00 | 0 | |||||
| 2026-02-12 | 13F | Strive Asset Management, LLC | 0 | -100,00 | 0 | |||||
| 2026-02-05 | 13F | Conning Inc. | 3.302 | -5,95 | 421 | -7,89 | ||||
| 2026-02-05 | 13F | Cornerstone Wealth Management, LLC | 6.796 | 47,07 | 866 | 44,33 | ||||
| 2026-02-18 | 13F | EP Wealth Advisors, Inc. | 99.504 | -4,30 | 12.685 | -8,29 | ||||
| 2026-02-06 | 13F | Profund Advisors Llc | 7.570 | -19,36 | 965 | -20,84 | ||||
| 2026-02-10 | 13F | Goldman Sachs Group Inc | 4.245.773 | 4,81 | 541.251 | 2,82 | ||||
| 2026-02-10 | 13F | Goldman Sachs Group Inc | Put | 30.000 | 0,00 | 3.824 | -1,90 | |||
| 2026-02-04 | 13F | Opinicus Capital, Inc. | 0 | -100,00 | 0 | |||||
| 2026-04-16 | 13F | Beese Fulmer Investment Management, Inc. | 3.802 | 352 | ||||||
| 2026-04-10 | 13F | Quaker Wealth Management, LLC | 19 | 18,75 | 2 | -50,00 | ||||
| 2026-02-10 | 13F | Sivia Capital Partners, LLC | 1.993 | -2,45 | 254 | -4,15 | ||||
| 2026-02-17 | 13F | Oxford Asset Management Llp | 11.953 | 42,60 | 1.524 | 39,85 | ||||
| 2026-04-15 | 13F | Spirit Of America Management Corp/ny | 4.350 | 0,00 | 402 | -27,44 | ||||
| 2026-02-11 | 13F | Caldwell Investment Management Ltd. | 200.000 | 25.711 | ||||||
| 2026-02-06 | 13F | Bare Financial Services, Inc | 49 | -3,92 | 6 | 0,00 | ||||
| 2026-04-15 | 13F | Douglas Lane & Associates, LLC | 6.481 | 0,00 | 600 | -27,48 | ||||
| 2026-02-11 | 13F | Capital World Investors | 6.566.669 | -38,61 | 837.146 | -39,78 | ||||
| 2026-02-13 | 13F | Victory Capital Management Inc | 1.878.182 | -17,94 | 239.431 | -19,44 | ||||
| 2026-02-05 | 13F | Barr E S & Co | 24.425 | -3,17 | 3.114 | -5,00 | ||||
| 2026-04-14 | 13F | Drive Wealth Management, Llc | 4.158 | 74,27 | 385 | 26,32 | ||||
| 2025-11-13 | 13F | Oribel Capital Management, LP | Put | 0 | -100,00 | 0 | -100,00 | |||
| 2026-02-13 | 13F | 71 West Capital Partners | 1.575 | 201 | ||||||
| 2026-04-10 | 13F | Benin Management CORP | 0 | -100,00 | 0 | |||||
| 2026-02-04 | 13F | Oregon Public Employees Retirement Fund | 78.534 | 0,13 | 10.012 | -1,78 | ||||
| 2026-02-06 | 13F | Principle Wealth Partners Llc | 5.030 | 0,00 | 641 | -1,84 | ||||
| 2026-02-17 | 13F | Gallagher Fiduciary Advisors, LLC | 3.136 | 6,85 | 400 | 4,72 | ||||
| 2026-02-02 | 13F | Qrg Capital Management, Inc. | 53.347 | 1,55 | 6.801 | -0,38 | ||||
| 2026-02-12 | 13F | Jane Street Group, Llc | 84.656 | -88,42 | 10.792 | -88,64 | ||||
| 2026-02-12 | 13F | Jane Street Group, Llc | Put | 515.700 | -26,71 | 65.741 | -28,10 | |||
| 2026-02-13 | 13F | Platform Technology Partners | 3.042 | 71,09 | 388 | 67,53 | ||||
| 2026-02-12 | 13F | Jane Street Group, Llc | Call | 459.800 | -35,89 | 58.615 | -37,11 | |||
| 2026-02-12 | 13F | Principal Securities, Inc. | 31.696 | 6,72 | 4.041 | 4,69 | ||||
| 2026-02-05 | 13F | High Note Wealth, LLC | 82 | 7,89 | 10 | 11,11 | ||||
| 2026-02-09 | 13F | Huntington National Bank | 6.516 | 4,37 | 831 | 2,34 | ||||
| 2026-02-17 | 13F | MGB Wealth Management, LLC | 3.766 | 0,03 | 480 | -2,24 | ||||
| 2026-02-13 | 13F | Kempen Capital Management N.v. | 3.877.794 | 2,09 | 494.341 | 0,15 | ||||
| 2026-02-13 | 13F | Northwest Bancshares, Inc. | 2.425 | 0,00 | 309 | -1,90 | ||||
| 2026-02-14 | 13F | Frec Markets, Inc. | 3.636 | 464 | ||||||
| 2026-02-12 | 13F | StoneX Group Inc. | 7.004 | -21,91 | 893 | -23,35 | ||||
| 2026-02-10 | 13F | Argent Trust Co | 2.442 | -5,50 | 311 | -7,16 | ||||
| 2026-02-13 | 13F | Walleye Trading LLC | Call | 126.000 | 19,77 | 16.062 | 17,50 | |||
| 2026-02-13 | 13F | Walleye Trading LLC | 200.433 | -15,46 | 25.551 | -17,07 | ||||
| 2026-01-16 | 13F | Hopwood Financial Services, Inc. | 0 | -100,00 | 0 | |||||
| 2026-02-13 | 13F | Walleye Trading LLC | Put | 353.300 | -3,73 | 45.039 | -5,56 | |||
| 2026-04-10 | 13F | Armstrong Advisory Group, Inc | 232 | 0,00 | 21 | -27,59 | ||||
| 2026-02-04 | 13F | Paradigm Asset Management Co Llc | 7.354 | -6,37 | 937 | -8,14 | ||||
| 2026-02-13 | 13F | Public Sector Pension Investment Board | 0 | -100,00 | 0 | |||||
| 2026-02-17 | 13F | Two Sigma Securities, Llc | 6.462 | 82,03 | 824 | 78,52 | ||||
| 2026-02-17 | 13F | Integrated Advisors Network LLC | 28.963 | -42,75 | 3.692 | -43,84 | ||||
| 2026-02-13 | 13F | Hurley Capital, LLC | 0 | -100,00 | 0 | |||||
| 2026-02-13 | 13F | Level Four Advisory Services, Llc | 14.966 | 19,20 | 1.908 | 16,92 | ||||
| 2026-02-17 | 13F | Maryland State Retirement & Pension System | 33.673 | 0,00 | 4.293 | -1,90 | ||||
| 2026-02-17 | 13F | Gillson Capital LP | 31.800 | 4 | ||||||
| 2026-02-18 | 13F | State of Tennessee, Treasury Department | 218.709 | -8,23 | 24.990 | -19,31 | ||||
| 2026-02-17 | 13F | Mercer Global Advisors Inc /adv | 36.208 | 11,99 | 4.739 | 12,81 | ||||
| 2026-02-10 | 13F | Peapack Gladstone Financial Corp | 0 | -100,00 | 0 | |||||
| 2026-02-10 | 13F | Norges Bank | 13.460.378 | 1.715.929 | ||||||
| 2025-10-27 | 13F | Smith Shellnut Wilson Llc /adv | 8.364 | -2,10 | 1.087 | -4,40 | ||||
| 2026-02-06 | 13F | Cullen/frost Bankers, Inc. | 152.830 | 1,24 | 19.483 | -0,68 | ||||
| 2025-11-14 | 13F | Knightsbridge Asset Management, Llc | 3.482 | -0,17 | 453 | -2,38 | ||||
| 2026-04-13 | 13F | Community Trust & Investment Co | 206.750 | 36,68 | 19.125 | -0,82 | ||||
| 2026-04-23 | 13F | Farmers & Merchants Investments Inc | 445 | 0,00 | 41 | -26,79 | ||||
| 2026-01-29 | 13F | Inscription Capital, LLC | 0 | -100,00 | 0 | |||||
| 2026-04-15 | 13F | Gf Fund Management Co. Ltd. | 1.218 | 113 | ||||||
| 2026-01-26 | 13F | Cwm, Llc | 14.261 | 40,79 | 2 | 0,00 | ||||
| 2026-02-12 | 13F | BRYN MAWR TRUST Co | 17.251 | -2,30 | 2.199 | -4,14 | ||||
| 2025-11-14 | 13F | Williams Jones Wealth Management, LLC. | 0 | -100,00 | 0 | |||||
| 2026-02-05 | 13F | Northwestern Mutual Investment Management Company, Llc | 21.930 | 0,30 | 2.796 | -1,62 | ||||
| 2026-02-13 | 13F | Soros Fund Management Llc | 0 | -100,00 | 0 | |||||
| 2026-02-17 | 13F | Signature Equity Partners, LLC | 859 | 109 | ||||||
| 2026-04-17 | 13F | Essex Savings Bank | 2.843 | 1,14 | 263 | -26,82 | ||||
| 2026-01-28 | 13F | Cornerstone Advisory, LLC | 3.420 | 7,24 | 436 | 5,07 | ||||
| 2026-01-21 | 13F | Raleigh Capital Management Inc. | 0 | 0 | ||||||
| 2026-04-21 | 13F | Trueblood Wealth Management, LLC | 10.873 | -1,15 | 1.006 | -28,32 | ||||
| 2026-02-13 | 13F | JustInvest LLC | 30.309 | 50,04 | 3.864 | 47,16 | ||||
| 2026-04-22 | 13F | Wallington Asset Management, LLC | 2.500 | 0,00 | 231 | -27,36 | ||||
| 2026-02-17 | 13F | PenderFund Capital Management Ltd. | 19.740 | 92,77 | 2.516 | 89,17 | ||||
| 2026-04-13 | 13F | Pettinga Financial Advisors, LLC | 0 | -100,00 | 0 | |||||
| 2026-02-13 | 13F | Cordoba Advisory Partners LLC | 16.945 | 2.168 | ||||||
| 2026-02-17 | 13F | Woodline Partners LP | 284.443 | 213,75 | 36.261 | 207,78 | ||||
| 2026-04-21 | 13F | Wesbanco Bank Inc | 27.222 | -1,71 | 2.518 | -28,67 | ||||
| 2026-02-17 | 13F | Lazard Asset Management Llc | 30.286 | 61,03 | 3.861 | 57,94 | ||||
| 2026-01-27 | 13F | Mainstay Capital Management Llc /adv | 3.963 | 7,92 | 505 | 5,87 | ||||
| 2026-02-10 | 13F | Fideuram Asset Management (Ireland) dac | 8.240 | 1.115 | ||||||
| 2026-01-02 | 13F | Global Wealth Strategies & Associates | 0 | -100,00 | 0 | -100,00 | ||||
| 2026-02-13 | 13F | Smartleaf Asset Management LLC | 4.703 | 9,63 | 605 | 4,85 | ||||
| 2026-01-29 | 13F | Ashton Thomas Private Wealth, LLC | 0 | -100,00 | 0 | |||||
| 2026-01-29 | 13F | Comerica Bank | 90.679 | -11,12 | 11.560 | -12,81 | ||||
| 2026-02-13 | 13F | Blueshift Asset Management, LLC | 0 | -100,00 | 0 | |||||
| 2026-01-28 | 13F | Proathlete Wealth Management Llc | 45 | 6 | ||||||
| 2026-02-17 | 13F | Elequin Capital Lp | 144 | 18 | ||||||
| 2025-11-12 | 13F | Artisan Partners Limited Partnership | 0 | -100,00 | 0 | -100,00 | ||||
| 2026-04-22 | 13F | Patriot Financial Group Insurance Agency, LLC | 4.218 | 109,54 | 390 | 52,34 | ||||
| 2025-11-14 | 13F | ICONIQ Capital, LLC | 0 | -100,00 | 0 | |||||
| 2026-02-05 | 13F | Lynx Investment Advisory | 1.860 | 0,22 | 237 | -1,66 | ||||
| 2026-04-22 | 13F | Avantra Family Wealth, Inc. | 0 | -100,00 | 0 | |||||
| 2026-04-09 | 13F | Nelson, Van Denburg & Campbell Wealth Management Group, LLC | 14.358 | 42,34 | 1.328 | 3,35 | ||||
| 2026-04-08 | 13F | Icapital Wealth Llc | 0 | -100,00 | 0 | |||||
| 2026-04-13 | 13F | Hm Payson & Co | 66 | -44,54 | 6 | -60,00 | ||||
| 2026-02-09 | 13F | Wellington Shields Capital Management, LLC | 15.495 | -22,09 | 1.975 | -23,57 | ||||
| 2026-02-13 | 13F | Resources Management Corp /ct/ /adv | 0 | -100,00 | 0 | |||||
| 2026-04-07 | 13F | Heartwood Wealth Advisors LLC | 0 | -100,00 | 0 | |||||
| 2026-02-03 | 13F | Crossmark Global Holdings, Inc. | 33.940 | 17,30 | 4.327 | 15,05 | ||||
| 2026-02-13 | 13F | Partners Capital Investment Group, Llp | 2.529 | 0,00 | 322 | -1,83 | ||||
| 2026-04-20 | 13F | Jfs Wealth Advisors, Llc | 128 | -12,93 | 12 | -38,89 | ||||
| 2026-01-20 | 13F | Wealth Management Associates, Inc. | 3.834 | 25,95 | 489 | 23,54 | ||||
| 2026-02-13 | 13F | Bridgefront Capital, LLC | 5.915 | 754 | ||||||
| 2026-01-30 | 13F | Sigma Planning Corp | 4.345 | 6,76 | 713 | 35,04 | ||||
| 2026-02-05 | 13F | Tucker Asset Management Llc | 39 | 5 | ||||||
| 2026-02-10 | 13F | Root Financial Partners, LLC | 728 | 11,15 | 93 | 8,24 | ||||
| 2026-01-23 | 13F | Bellevue Asset Management, Llc | 47 | 0,00 | 6 | -16,67 | ||||
| 2026-02-03 | 13F | Cheviot Value Management, LLC | 510 | 0,00 | 60 | -3,28 | ||||
| 2026-02-13 | 13F | Walleye Capital LLC | Call | 39.800 | -18,28 | 5.074 | -19,83 | |||
| 2026-02-13 | 13F | Walleye Capital LLC | Put | 117.600 | 378,05 | 14.992 | 369,06 | |||
| 2026-02-13 | 13F | Walleye Capital LLC | 127.405 | -33,05 | 16.242 | -34,32 | ||||
| 2026-02-13 | 13F | Marnell Management LLC | 9.100 | 1.160 | ||||||
| 2026-04-15 | 13F | Financial Management Professionals, Inc. | 90 | -43,40 | 8 | -60,00 | ||||
| 2026-02-11 | 13F | Picton Mahoney Asset Management | 274.575 | 12,97 | 35.003 | 112.809,68 | ||||
| 2026-02-06 | 13F | Envestnet Portfolio Solutions, Inc. | 15.310 | -3,64 | 1.952 | -5,47 | ||||
| 2026-02-11 | 13F | Empowered Funds, LLC | 31.537 | -1,25 | 4.020 | -3,13 | ||||
| 2026-02-04 | 13F | HighPoint Advisor Group LLC | 7.650 | -10,70 | 975 | -12,40 | ||||
| 2026-02-04 | 13F | JSF Financial, LLC | 2.281 | 0,18 | 291 | -1,69 | ||||
| 2026-02-13 | 13F | Dynamic Technology Lab Private Ltd | 3.447 | -15,39 | 439 | -17,01 | ||||
| 2026-02-11 | 13F | Fjarde Ap-fonden /fourth Swedish National Pension Fund | 97.975 | 12.490 | ||||||
| 2025-11-14 | 13F | Strategic Wealth Partners, Ltd. | 615 | 2,33 | 80 | 0,00 | ||||
| 2026-02-03 | 13F | Sequoia Financial Advisors, LLC | 27.085 | 10,95 | 3.453 | 8,83 | ||||
| 2026-04-20 | 13F | Triangle Securities Wealth Management | 58.407 | -1,55 | 5.403 | -28,57 | ||||
| 2026-04-21 | 13F | Financial Consulate, Inc | 60 | 150,00 | 6 | 66,67 | ||||
| 2026-02-02 | 13F | Caisse Des Depots Et Consignations | 3.917 | -90,74 | 499 | -90,93 | ||||
| 2026-03-20 | 13F/A | Hsbc Holdings Plc | Put | 29.400 | 3.763 | |||||
| 2026-02-06 | 13F | BlueStem Wealth Partners, LLC | 2.069 | -16,51 | 264 | -18,07 | ||||
| 2026-02-13 | 13F | AlTi Global, Inc. | 11.338 | -0,33 | 1.445 | -2,23 | ||||
| 2026-01-27 | 13F | TD Waterhouse Canada Inc. | 36.884 | -28,17 | 4.701 | -28,19 | ||||
| 2026-02-10 | 13F | Principia Wealth Advisory, LLC | 41 | 36,67 | 5 | 66,67 | ||||
| 2026-01-28 | 13F | United Asset Strategies, Inc. | 13.569 | 2,93 | 1.730 | 0,93 | ||||
| 2026-02-10 | 13F | Core Wealth Advisors, Llc | 55 | 7 | ||||||
| 2026-02-13 | 13F | Headlands Technologies LLC | 2.036 | 260 | ||||||
| 2026-02-06 | 13F | Pnc Financial Services Group, Inc. | 220.753 | -0,58 | 28.142 | -2,47 | ||||
| 2026-02-11 | 13F | Meketa Investment Group Inc /adv | 11.521 | 1.469 | ||||||
| 2026-02-17 | 13F | Tcw Group Inc | 10.473 | 1.335 | ||||||
| 2026-04-17 | 13F | Hanson & Doremus Investment Management | 330 | 83,33 | 0 | |||||
| 2026-02-10 | 13F | Rational Advisors Llc | 18.925 | -18,95 | 2.413 | -20,50 | ||||
| 2026-01-23 | 13F | Sumitomo Mitsui Trust Holdings, Inc. | 1.389.553 | -3,48 | 177.140 | -5,31 | ||||
| 2026-02-17 | 13F | Palisade Capital Management Llc/nj | 91.483 | -0,22 | 11.662 | -2,12 | ||||
| 2026-02-05 | 13F | AlphaCore Capital LLC | 780 | 26,62 | 99 | 23,75 | ||||
| 2026-02-17 | 13F | DV Trading LLC | 2 | 0 | ||||||
| 2026-04-09 | 13F | Chemistry Wealth Management LLC | 11.242 | 0,04 | 1.040 | -27,44 | ||||
| 2026-02-10 | 13F | Axq Capital, Lp | 0 | -100,00 | 0 | |||||
| 2026-01-23 | 13F | Sage Mountain Advisors LLC | 1.845 | -3,66 | 235 | -5,24 | ||||
| 2026-02-10 | 13F | Tandem Financial, LLC | 0 | -100,00 | 0 | |||||
| 2026-02-17 | 13F | Css Llc/il | Put | 2.000 | 255 | |||||
| 2026-02-17 | 13F | Jump Financial, LLC | 4.903 | -31,46 | 625 | -32,72 | ||||
| 2026-02-13 | 13F | Kcm Investment Advisors Llc | 4.235 | -16,17 | 540 | -17,84 | ||||
| 2026-02-13 | 13F | Missouri Trust & Investment Co | 320 | 0,00 | 41 | -2,44 | ||||
| 2026-02-20 | 13F | Kovitz Investment Group Partners, LLC | 0 | -100,00 | 0 | |||||
| 2026-04-22 | 13F | Bravera Wealth | 0 | -100,00 | 0 | |||||
| 2026-02-17 | 13F | Credit Agricole S A | 839.136 | 19,70 | 106.973 | 17,43 | ||||
| 2026-02-17 | 13F | Credit Agricole S A | Put | 20.000 | 0,00 | 2.550 | -1,92 | |||
| 2026-01-30 | 13F | State of New Jersey Common Pension Fund D | 215.521 | -2,22 | 27.475 | -4,07 | ||||
| 2026-01-29 | 13F | Scissortail Wealth Management, LLC | 0 | -100,00 | 0 | |||||
| 2026-01-29 | 13F | Middleton & Co Inc/ma | 2.622 | 0,00 | 334 | -1,76 | ||||
| 2026-02-10 | 13F | Moors & Cabot, Inc. | 6.572 | -5,06 | 838 | -6,90 | ||||
| 2026-02-13 | 13F | Colony Group, LLC | 12.000 | 0,00 | 1.530 | -1,92 | ||||
| 2026-01-15 | 13F | Lodestone Wealth Management LLC | 651 | 83 | ||||||
| 2026-02-12 | 13F | Insigneo Advisory Services, Llc | 4.298 | 1,42 | 548 | -0,55 | ||||
| 2026-04-15 | 13F | Perkins Coie Trust Co | 677 | 0,00 | 63 | -27,91 | ||||
| 2026-02-12 | 13F | Ankerstar Wealth, LLC | 15 | 2 | ||||||
| 2026-02-12 | 13F | Marsico Capital Management Llc | 0 | -100,00 | 0 | |||||
| 2026-01-20 | 13F | Savvy Advisors, Inc. | 2.812 | 12,44 | 358 | 10,15 | ||||
| 2026-02-17 | 13F | Bank Of America Corp /de/ | Call | 0 | -100,00 | 0 | ||||
| 2026-02-03 | 13F | Generali Asset Management SPA SGR | 12.240 | -67,21 | 1.560 | -67,84 | ||||
| 2026-02-13 | 13F | Chevy Chase Trust Holdings, Inc. | 350.557 | -0,62 | 44.689 | -2,51 | ||||
| 2026-01-12 | 13F | VisionPoint Advisory Group, LLC | 6.063 | 773 | ||||||
| 2025-11-14 | 13F | Axa S.a. | 0 | -100,00 | 0 | |||||
| 2026-02-13 | 13F | Rafferty Asset Management, LLC | 213.589 | -7,65 | 27.228 | -9,41 | ||||
| 2026-02-02 | 13F | Robertson Stephens Wealth Management, LLC | 7.400 | -9,99 | 943 | -11,70 | ||||
| 2025-11-05 | 13F | Jackson Square Partners, LLC | 0 | -100,00 | 0 | |||||
| 2026-02-13 | 13F | Ausdal Financial Partners, Inc. | 2.248 | 2,93 | 287 | 1,06 | ||||
| 2026-01-29 | 13F | D.a. Davidson & Co. | 8.192 | -1,09 | 1.044 | -2,97 | ||||
| 2026-02-17 | 13F | Main Street Financial Solutions, LLC | 1.685 | -45,61 | 215 | -46,77 | ||||
| 2026-02-09 | 13F | Unison Asset Management LLC | 1.668 | 0,00 | 213 | -1,85 | ||||
| 2026-04-22 | 13F | Joel Isaacson & Co., LLC | 4.541 | 0,11 | 420 | -27,34 | ||||
| 2026-02-13 | 13F | Bridgewater Associates, LP | 47.434 | -13,40 | 6.047 | -15,05 | ||||
| 2026-02-09 | 13F | Clearwater Capital Advisors, LLC | 4.659 | 0,00 | 594 | -1,98 | ||||
| 2026-04-17 | 13F | James J. Burns & Company, LLC | 7.774 | -0,01 | 719 | -27,45 | ||||
| 2026-02-17 | 13F | BTG Pactual Asset Management US LLC | 0 | -100,00 | 0 | |||||
| 2026-02-17 | 13F | First Manhattan Co | 8.597.044 | 0,79 | 1.095.951 | -1,13 | ||||
| 2025-11-14 | 13F | Landmark Investment Partners, L.p. | Call | 0 | -100,00 | 0 | ||||
| 2026-04-17 | 13F | First National Bank Sioux Falls | 13.403 | -1,72 | 1.367 | -21,35 | ||||
| 2026-02-12 | 13F | Logan Capital Management Inc | 61.057 | -1,20 | 7.784 | -3,08 | ||||
| 2026-02-13 | 13F | Bollard Group LLC | 280.919 | 0,10 | 36 | -2,78 | ||||
| 2026-02-09 | 13F | Smithfield Trust Co | 346 | -22,42 | 0 | |||||
| 2026-01-23 | 13F | Iridian Asset Management Llc/ct | 17.258 | 5,20 | 2.200 | 3,24 | ||||
| 2026-02-03 | 13F | Morse Asset Management, Inc | 185 | 0,00 | 24 | -4,17 | ||||
| 2026-02-11 | 13F | CenterBook Partners LP | 9.260 | 1.180 | ||||||
| 2025-11-14 | 13F | PineBridge Investments, L.P. | 117.116 | 103,71 | 15.219 | 98,99 | ||||
| 2026-04-15 | 13F | Merit Financial Group, LLC | 33.372 | 32,38 | 3.087 | -3,95 | ||||
| 2026-04-20 | 13F | Arta Finance Wealth Management LLC | 0 | -100,00 | 0 | |||||
| 2025-11-14 | 13F | Point72 (DIFC) Ltd | Call | 400 | -42,86 | 52 | -45,16 | |||
| 2026-02-04 | 13F | Tsfg, Llc | 726 | 0,00 | 0 | |||||
| 2026-02-13 | 13F | Fieldview Capital Management, LLC | 0 | -100,00 | 0 | |||||
| 2026-02-13 | 13F | MAI Capital Management | 20.622 | 0,26 | 2.629 | -1,65 | ||||
| 2026-02-13 | 13F | Wells Fargo & Company/mn | 2.681.132 | 27,01 | 341.791 | 24,60 | ||||
| 2025-11-14 | 13F | Point72 (DIFC) Ltd | 153.437 | 66,56 | 19.939 | 62,71 | ||||
| 2026-02-02 | 13F | Avidian Wealth Solutions, LLC | 2.051 | 19,11 | 261 | 17,04 | ||||
| 2026-02-13 | 13F | Ostrum Asset Management | 641 | -25,03 | 82 | -27,03 | ||||
| 2026-02-02 | 13F | Danske Bank A/s | 239.968 | -33,82 | 30.591 | -35,08 | ||||
| 2026-02-17 | 13F | Fountainhead AM, LLC | 68 | -98,45 | 9 | -98,60 | ||||
| 2026-02-17 | 13F | Limestone Investment Advisors LP | 60 | 8 | ||||||
| 2026-02-13 | 13F | Kilter Group LLC | 107 | 101,89 | 14 | 116,67 | ||||
| 2026-01-23 | 13F | Steigerwald, Gordon & Koch Inc. | 122 | 916,67 | 16 | 1.400,00 | ||||
| 2026-02-17 | 13F | Aquatic Capital Management LLC | 0 | -100,00 | 0 | |||||
| 2026-04-15 | 13F | Tema Etfs Llc | 13.197 | 1,68 | 1.221 | -26,24 | ||||
| 2026-02-13 | 13F | Toroso Investments, LLC | 34.497 | -18,65 | 4.398 | -20,20 | ||||
| 2025-10-24 | 13F | Hemington Wealth Management | 805 | 9,67 | 0 | |||||
| 2026-02-06 | 13F | ProShare Advisors LLC | 144.601 | 5,15 | 18.434 | 3,14 | ||||
| 2026-04-13 | 13F | CGC Financial Services, LLC | 325 | 0,00 | 30 | -26,83 | ||||
| 2026-02-12 | 13F | Xxi Wealth, Llc | 2.554 | 326 | ||||||
| 2026-02-19 | 13F | Invesco Ltd. | 9.931.850 | -20,81 | 1.266.112 | -22,32 | ||||
| 2026-02-17 | 13F | Limestone Investment Advisors LP | Call | 3.300 | 13,79 | 421 | 11,70 | |||
| 2026-02-06 | 13F | Americana Partners, LLC | 3.063 | 390 | ||||||
| 2026-02-17 | 13F | Limestone Investment Advisors LP | Put | 3.500 | 133,33 | 446 | 129,90 | |||
| 2026-04-17 | 13F | Stephenson National Bank & Trust | 413 | 7,55 | 38 | -20,83 | ||||
| 2026-02-13 | 13F | Neuberger Berman Group LLC | 801.219 | -14,23 | 102.139 | -15,86 | ||||
| 2026-02-13 | 13F | Towarzystwo Funduszy Inwestycyjnych Pzu Sa | 0 | -100,00 | 0 | |||||
| 2026-02-13 | 13F | Ossiam | 7.981 | -94,78 | 1.017 | -94,88 | ||||
| 2026-02-17 | 13F | Man Group plc | 47.924 | 257,46 | 6.109 | 250,69 | ||||
| 2025-11-13 | 13F | Perbak Capital Partners LLP | 0 | -100,00 | 0 | |||||
| 2026-02-17 | 13F | Snowden Capital Advisors LLC | 10.244 | -1,32 | 1.306 | -3,19 | ||||
| 2026-04-08 | 13F | Hardin Capital Partners, LLC | 4.043 | 6,03 | 374 | -23,25 | ||||
| 2026-04-23 | 13F | waypoint wealth counsel | 0 | -100,00 | 0 | |||||
| 2026-02-06 | 13F | Gsa Capital Partners Llp | 3.851 | -29,01 | 0 | |||||
| 2026-02-17 | 13F | Advisor Group Holdings, Inc. | 109.918 | -14,68 | 14.015 | -20,18 | ||||
| 2026-02-12 | 13F | Keel Point, LLC | 5.043 | -2,74 | 643 | -4,61 | ||||
| 2026-01-28 | 13F | Geneos Wealth Management Inc. | 36 | -43,75 | 5 | -50,00 | ||||
| 2026-01-21 | 13F | Sound Income Strategies, LLC | 1.084 | 9,05 | 143 | 15,45 | ||||
| 2026-01-30 | 13F | Jennison Associates Llc | 1.978.888 | -2,03 | 252.269 | -3,90 | ||||
| 2026-02-04 | 13F | Ameritas Advisory Services, LLC | 4.262 | 171,64 | 543 | 167,49 | ||||
| 2026-02-10 | 13F | Fiduciary Family Office, Llc | 2.748 | -12,06 | 350 | -13,79 | ||||
| 2026-02-09 | 13F | Harbour Investments, Inc. | 807 | 21,17 | 103 | 18,60 | ||||
| 2025-11-14 | 13F | Point72 Hong Kong Ltd | 139.774 | 18.164 | ||||||
| 2026-04-10 | 13F | Integris Wealth Management, LLC | 0 | -100,00 | 0 | |||||
| 2026-04-17 | 13F | Brown, Lisle/cummings, Inc. | 21 | 0,00 | 2 | -50,00 | ||||
| 2026-04-13 | 13F | Allen Mooney & Barnes Investment Advisors LLC | 2.630 | 0,00 | 243 | -27,46 | ||||
| 2026-02-12 | 13F | JPL Wealth Management, LLC | 0 | -100,00 | 0 | |||||
| 2026-01-16 | 13F | Red Lighthouse Investment Management, Llc | 0 | -100,00 | 0 | |||||
| 2026-01-27 | 13F | Werba Rubin Papier Wealth Management | 0 | -100,00 | 0 | -100,00 | ||||
| 2026-04-20 | 13F | Norway Savings Bank | 6.922 | 141,77 | 640 | 75,82 | ||||
| 2026-01-15 | 13F | Jamison Private Wealth Management, Inc. | 35.465 | -1,19 | 4.521 | -3,07 | ||||
| 2026-04-15 | 13F | Avanza Fonder AB | 48.592 | -1,62 | 4.495 | -28,62 | ||||
| 2026-04-22 | 13F | Portus Wealth Advisors, LLC | 55 | -97,81 | 5 | -98,44 | ||||
| 2026-02-17 | 13F | Fairview Capital Investment Management, Llc | 2.001 | 0,00 | 255 | -1,92 | ||||
| 2026-01-27 | 13F | MASTERINVEST Kapitalanlage GmbH | 2.370 | 0,00 | 305 | -0,98 | ||||
| 2026-02-13 | 13F | Banco Santander, S.A. | 184.994 | 27,61 | 23.583 | 25,19 | ||||
| 2026-02-06 | 13F | Resona Asset Management Co.,Ltd. | 186.142 | -4,05 | 23.794 | -6,16 | ||||
| 2026-02-17 | 13F | Hunting Hill Global Capital, LLC | 3.736 | -64,32 | 476 | -65,00 | ||||
| 2026-02-17 | 13F | Hunting Hill Global Capital, LLC | Put | 1.000 | 0,00 | 127 | -1,55 | |||
| 2026-02-13 | 13F | Crescent Park Management, L.P. | 120.581 | 0,90 | 15.372 | -1,02 | ||||
| 2026-02-17 | 13F | Public Employees Retirement System Of Ohio | 270.719 | -0,07 | 34.511 | -1,97 | ||||
| 2026-02-13 | 13F | Pinnacle Wealth Planning Services, Inc. | 837 | 107 | ||||||
| 2026-04-13 | 13F | Runnymede Capital Advisors, Inc. | 12.709 | 1.176 | ||||||
| 2026-01-30 | 13F | Simplicity Wealth,LLC | 2.448 | 30,77 | 312 | 28,40 | ||||
| 2026-02-12 | 13F | WealthPLAN Partners, LLC | 2.082 | -8,52 | 265 | -10,17 | ||||
| 2026-02-10 | 13F | Lido Advisors, LLC | 108.987 | 4,22 | 14.067 | 3,52 | ||||
| 2026-02-10 | 13F | Lido Advisors, LLC | Put | 1.000 | 0,00 | 127 | -1,55 | |||
| 2026-04-16 | 13F | Sweeney & Michel, Llc | 2.876 | 0,21 | 282 | -6,31 | ||||
| 2026-04-13 | 13F | Massmutual Trust Co Fsb/adv | 1.721 | -12,77 | 159 | -36,65 | ||||
| 2026-04-13 | 13F | LexAurum Advisors, LLC | 5.780 | 535 | ||||||
| 2026-04-14 | 13F | Banque de Luxembourg S.A. | 0 | -100,00 | 0 | |||||
| 2026-01-15 | 13F | Orrstown Financial Services Inc | 0 | -100,00 | 0 | |||||
| 2026-02-06 | 13F | Keystone Financial Group | 2.174 | -0,59 | 277 | -2,46 | ||||
| 2026-04-21 | 13F | PDS Planning, Inc | 2.317 | -4,41 | 214 | -30,74 | ||||
| 2026-02-23 | 13F | Beaird Harris Wealth Management, LLC | 62 | -18,42 | 8 | -22,22 | ||||
| 2025-11-14 | 13F | Point72 Europe (London) LLP | 182.980 | 23,14 | 23.778 | 20,29 | ||||
| 2026-04-20 | 13F | Consilium Wealth Advisory, LLC | 8.499 | -11,83 | 786 | -35,99 | ||||
| 2026-02-11 | 13F | Los Angeles Capital Management Llc | 3.109 | 367 | ||||||
| 2026-02-17 | 13F | Fmr Llc | 23.681.190 | 13,64 | 3.018.878 | 11,48 | ||||
| 2026-02-06 | 13F | Covestor Ltd | 347 | -7,71 | 0 | |||||
| 2026-02-17 | 13F | MFF Capital Investments Ltd | 298.711 | 38.080 | ||||||
| 2025-11-14 | 13F | Old Mission Capital Llc | 0 | -100,00 | 0 | |||||
| 2026-02-17 | 13F | Cape Investment Advisory, Inc. | 56 | 24,44 | 7 | 40,00 | ||||
| 2026-02-11 | 13F | Deseret Mutual Benefit Administrators | 288 | 0,00 | 37 | -2,70 | ||||
| 2026-02-17 | 13F | Northern Trust Corp | 5.981.990 | -1,30 | 762.584 | -3,18 | ||||
| 2026-02-10 | 13F | Commonwealth Of Pennsylvania Public School Empls Retrmt Sys | 159.647 | -3,09 | 20.352 | -4,94 | ||||
| 2026-04-06 | 13F | CX Institutional | 703 | -77,65 | 0 | |||||
| 2026-02-09 | 13F | Fidelis Capital Partners, LLC | 12.185 | -18,65 | 1.553 | -20,20 | ||||
| 2026-02-17 | 13F | Montaka Global Pty Ltd | 139.165 | 17.741 | ||||||
| 2026-02-09 | 13F/A | Swedbank AB | 94.438 | 1,07 | 12.039 | -0,86 | ||||
| 2026-02-13 | 13F | L2 Asset Management, LLC | 3.434 | 438 | ||||||
| 2026-01-16 | 13F | Standard Life Aberdeen plc | 259.657 | -1,49 | 33.101 | -2,32 | ||||
| 2026-02-17 | 13F | Prosperity Consulting Group, LLC | 3.345 | 24,35 | 426 | 22,06 | ||||
| 2026-01-28 | 13F | Kingswood Wealth Advisors, Llc | 0 | -100,00 | 0 | |||||
| 2026-02-10 | 13F | Ade, Llc | 3.805 | 0,00 | 485 | -1,82 | ||||
| 2026-02-13 | 13F | Royal London Asset Management Ltd | 39.388 | 37,93 | 5.021 | 35,34 | ||||
| 2026-04-22 | 13F | Barnes Dennig Private Wealth Management LLC | 436 | 0,00 | 40 | -27,27 | ||||
| 2026-02-13 | 13F | Healthcare Of Ontario Pension Plan Trust Fund | 227.132 | -72,10 | 28.955 | -72,63 | ||||
| 2026-02-13 | 13F | Golden State Wealth Management, LLC | 3.672 | -8,25 | 468 | -10,00 | ||||
| 2026-02-17 | 13F | Tudor Investment Corp Et Al | Call | 66.100 | 8.426 | |||||
| 2026-01-14 | 13F | ORG Wealth Partners, LLC | 1.691 | 0,00 | 216 | -1,83 | ||||
| 2026-02-17 | 13F | Tudor Investment Corp Et Al | Put | 27.900 | 3.557 | |||||
| 2026-02-11 | 13F | 111 Capital | 2.087 | 266 | ||||||
| 2026-01-29 | 13F | Lee Danner & Bass Inc | 17.371 | -8,91 | 2.214 | -10,65 | ||||
| 2026-02-17 | 13F | Laird Norton Trust Company, Llc | 11.755 | 1.499 | ||||||
| 2026-01-23 | 13F | Portman Square Capital LLP | Put | 611.800 | -35,31 | 77.992 | -36,54 | |||
| 2026-02-06 | 13F | Cumberland Partners Ltd | 25.998 | 0,80 | 3.314 | -1,10 | ||||
| 2026-04-10 | 13F | First Bank & Trust | 10.124 | 33,37 | 936 | -3,21 | ||||
| 2026-01-23 | 13F | Portman Square Capital LLP | 123.579 | 15.754 | ||||||
| 2026-02-03 | 13F | Cassaday & Co Wealth Management LLC | 4.294 | 0,07 | 547 | -1,80 | ||||
| 2026-02-17 | 13F | Engle Capital Management, L.P. | 0 | -100,00 | 0 | |||||
| 2026-02-10 | 13F | MidAtlantic Capital Management, Inc. | 1.897 | 0,00 | 242 | -2,03 | ||||
| 2026-02-03 | 13F | Alpha Cubed Investments, LLC | 4.411 | 0,00 | 562 | -1,92 | ||||
| 2026-02-13 | 13F | Y-Intercept (Hong Kong) Ltd | 168.769 | 25,99 | 21.515 | 23,59 | ||||
| 2026-02-13 | 13F | Alberta Investment Management Corp | 11.400 | 1.453 | ||||||
| 2026-04-13 | 13F | Loring Wolcott & Coolidge Fiduciary Advisors Llp/ma | 15.453 | 0,00 | 1.410 | -21,37 | ||||
| 2026-02-11 | 13F | Signet Private Wealth LLC | 2.010 | 256 | ||||||
| 2026-04-22 | 13F | Union Bancaire Privee, UBP SA | 6.023 | 54,20 | 518 | 12,88 | ||||
| 2026-02-17 | 13F | Bank Of America Corp /de/ | 10.044.503 | -5,41 | 1.280.473 | -7,21 | ||||
| 2026-02-17 | 13F | Boreal Capital Management LLC | 1.009 | 0,00 | 129 | -2,29 | ||||
| 2026-02-17 | 13F | Kemnay Advisory Services Inc. | 272 | 35 | ||||||
| 2026-04-06 | 13F | GAMMA Investing LLC | 11.318 | -23,16 | 1.047 | -44,27 | ||||
| 2026-04-15 | 13F | Steadtrust LLC | 10.800 | 0,00 | 999 | -27,40 | ||||
| 2026-02-12 | 13F | Resurgent Financial Advisors LLC | 3.908 | 1,43 | 498 | -0,40 | ||||
| 2026-02-17 | 13F | Boothbay Fund Management, Llc | 26.103 | 13,23 | 3.328 | 11,09 | ||||
| 2026-04-22 | 13F | Janney Montgomery Scott LLC | 259.197 | 0,85 | 24 | -28,12 | ||||
| 2026-01-06 | 13F | Canal Capital Management, LLC | 45.753 | 8,89 | 5.833 | 6,81 | ||||
| 2026-04-17 | 13F | Webster Bank, N. A. | 944 | -14,49 | 87 | -37,86 | ||||
| 2026-04-22 | 13F | Louisbourg Investments Inc. | 56.845 | 80,03 | 4.113 | 29,83 | ||||
| 2026-04-22 | 13F | Uniting Wealth Partners, LLC | 15.300 | 84,34 | 1.415 | 33,74 | ||||
| 2026-01-29 | 13F | Teachers Retirement System Of The State Of Kentucky | 119.469 | -4,27 | 15 | -6,25 | ||||
| 2026-02-17 | 13F | Lone Pine Capital Llc | 5.001.085 | 22,56 | 637.538 | 20,23 | ||||
| 2026-02-11 | 13F | Allianz Asset Management GmbH | Put | 28.700 | 50,26 | 3.659 | 47,38 | |||
| 2025-11-07 | 13F | Sierra Ocean, Llc | 0 | -100,00 | 0 | |||||
| 2026-01-20 | 13F | Stratos Wealth Partners, LTD. | 11.568 | -11,68 | 1.475 | -13,40 | ||||
| 2026-02-11 | 13F | Allianz Asset Management GmbH | Call | 15.800 | 1,28 | 2.014 | -0,64 | |||
| 2026-02-11 | 13F | Allianz Asset Management GmbH | 106.469 | -17,16 | 13.573 | -18,74 | ||||
| 2025-11-13 | 13F | Banco BTG Pactual S.A. | 0 | -100,00 | 0 | |||||
| 2026-01-16 | 13F | Crewe Advisors LLC | 161 | 5,23 | 21 | 5,26 | ||||
| 2026-02-02 | 13F | Strs Ohio | 230.679 | -2,61 | 29.407 | -4,46 | ||||
| 2026-01-28 | 13F | Citizens & Northern Corp | 14.168 | 1.806 | ||||||
| 2026-02-17 | 13F | D. E. Shaw & Co., Inc. | 1.256.668 | 1.075,99 | 160.200 | 1.053,68 | ||||
| 2026-02-04 | 13F | Advisor OS, LLC | 8.076 | -6,06 | 1.030 | -7,88 | ||||
| 2026-02-17 | 13F | Parkwood LLC | 0 | -100,00 | 0 | |||||
| 2026-02-23 | 13F | Mv Capital Management, Inc. | 245 | 0,82 | 31 | -3,12 | ||||
| 2026-02-12 | 13F | Xponance, Inc. | 116.557 | 5,79 | 14.859 | 3,78 | ||||
| 2026-01-28 | 13F | Cortland Associates Inc/mo | 228.691 | -1,80 | 29.153 | -3,67 | ||||
| 2026-01-21 | 13F | Y.D. More Investments Ltd | 495 | -1,59 | 0 | |||||
| 2026-02-06 | 13F | Vestmark Advisory Solutions, Inc. | 12.923 | 46,60 | 1.647 | 43,84 | ||||
| 2026-02-05 | 13F | Avantax Planning Partners, Inc. | 2.000 | -0,45 | 255 | -2,68 | ||||
| 2026-02-11 | 13F | Next Capital Management LLC | 20.273 | 0,00 | 2.584 | -1,90 | ||||
| 2025-11-13 | 13F | Texas Capital Bancshares Inc/tx | 21 | 3 | ||||||
| 2026-02-17 | 13F | D. E. Shaw & Co., Inc. | Call | 71.400 | 87,89 | 9.102 | 84,33 | |||
| 2026-02-17 | 13F | D. E. Shaw & Co., Inc. | Put | 19.000 | 16,56 | 2.422 | 14,35 | |||
| 2026-02-17 | 13F | Wealth Watch Advisors, INC | 60 | -11,76 | 8 | -12,50 | ||||
| 2026-02-13 | 13F | Bank Of Nova Scotia | 584.111 | 408,44 | 74.464 | 398,81 | ||||
| 2026-02-18 | 13F/A | Virtue Capital Management, LLC | 2.931 | -94,61 | 378 | -33,98 | ||||
| 2025-11-14 | 13F | Whitebox Advisors Llc | 0 | -100,00 | 0 | -100,00 | ||||
| 2026-02-17 | 13F | Agf Management Ltd | 6.444 | 9,85 | 821 | 7,74 | ||||
| 2026-02-04 | 13F | Plato Investment Management Ltd | 47 | 0,00 | 6 | 0,00 | ||||
| 2026-02-04 | 13F | Midwest Trust Co | 127.989 | -4,12 | 16.316 | -5,94 | ||||
| 2026-01-29 | 13F | Calamos Wealth Management LLC | 2.292 | 8,73 | 292 | 6,96 | ||||
| 2026-04-22 | 13F | Horizon Bancorp Inc /in/ | 2.622 | 3,76 | 0 | |||||
| 2026-02-02 | 13F | Cornerstone Planning Group LLC | 943 | 0,32 | 110 | -0,90 | ||||
| 2026-02-04 | 13F | KLCM Advisors, Inc. | 1.577 | 0,00 | 201 | -1,47 | ||||
| 2026-02-17 | 13F | National Asset Management, Inc. | 5.558 | 2,00 | 708 | 0,00 | ||||
| 2026-02-09 | 13F | Employees Retirement System of Texas | 0 | -100,00 | 0 | |||||
| 2026-02-04 | 13F | Independent Advisor Alliance | 16.842 | -5,49 | 2.147 | -7,26 | ||||
| 2026-02-10 | 13F/A | Algebris (uk) Ltd | 157.103 | 20.037 | ||||||
| 2026-02-17 | 13F | Evercore Wealth Management, LLC | 2.602 | 0,00 | 332 | -2,07 | ||||
| 2026-01-27 | 13F | CenterStar Asset Management, LLC | Put | 2.400 | 33,33 | 306 | 30,90 | |||
| 2026-02-12 | 13F | Nuveen, LLC | 6.324.240 | -4,61 | 806.214 | -6,42 | ||||
| 2026-02-10 | 13F | Sittner & Nelson, Llc | 27 | 0,00 | 3 | -33,33 | ||||
| 2026-01-29 | 13F | Dunhill Financial, LLC | 2 | 0,00 | 0 | |||||
| 2026-04-10 | 13F | Naviter Wealth, LLC | 2.839 | 0,21 | 263 | -27,42 | ||||
| 2026-02-12 | 13F | Proficio Capital Partners LLC | 31.434 | -0,06 | 4.007 | -1,96 | ||||
| 2026-02-09 | 13F | Roundview Capital LLC | 2.080 | -16,10 | 265 | -17,70 | ||||
| 2026-02-17 | 13F | MIRAE ASSET GLOBAL ETFS HOLDINGS Ltd. | 65.947 | -28,86 | 8.407 | -30,21 | ||||
| 2025-11-14 | 13F | Lombard Odier Asset Management (USA) Corp | 0 | -100,00 | 0 | -100,00 | ||||
| 2026-01-28 | 13F | Salomon & Ludwin, LLC | 458 | 62,99 | 62 | 74,29 | ||||
| 2026-02-12 | 13F | Voya Investment Management Llc | 116.073 | -2,72 | 14.797 | -4,57 | ||||
| 2026-04-20 | 13F | Tower View Investment Management & Research LLC | 1.254 | 0,24 | 116 | -27,67 | ||||
| 2026-01-30 | 13F | Sage Rhino Capital Llc | 7.307 | 0,44 | 931 | -1,48 | ||||
| 2025-11-10 | 13F/A | Flaharty Asset Management, LLC | 0 | -100,00 | 0 | |||||
| 2026-01-20 | 13F | Harbor Capital Advisors, Inc. | 16.488 | -0,15 | 2 | 0,00 | ||||
| 2026-01-22 | 13F | Bartlett & Co. Wealth Management Llc | 3.636 | -12,24 | 464 | -13,94 | ||||
| 2026-02-13 | 13F | Allianz Se | 7.910 | -48,33 | 1.008 | -49,32 | ||||
| 2026-02-17 | 13F | Whitebox Advisors Llc | Put | 200.000 | 0,00 | 25.496 | -1,90 | |||
| 2026-04-16 | 13F | Guardian Investment Management | 14.584 | 34,07 | 1.463 | 3,47 | ||||
| 2026-01-23 | 13F | Rsm Us Wealth Management Llc | 17.927 | 21,20 | 2.306 | 19,98 | ||||
| 2026-02-13 | 13F | Kayne Anderson Rudnick Investment Management Llc | 417 | -8,55 | 53 | -10,17 | ||||
| 2026-04-07 | 13F | Farther Finance Advisors, LLC | 32.784 | 10,33 | 2.995 | -20,91 | ||||
| 2026-04-13 | 13F | E Fund Management Co., Ltd. | 2.531 | 43,48 | 234 | 0,00 | ||||
| 2026-02-17 | 13F | XTX Topco Ltd | 34.434 | 31,16 | 4.390 | 28,67 | ||||
| 2026-04-15 | 13F | Curbstone Financial Management Corp | 27.888 | -0,71 | 2.580 | -27,96 | ||||
| 2026-02-17 | 13F | Crawford Investment Counsel Inc | 2.942 | 375 | ||||||
| 2026-02-11 | 13F | LPL Financial LLC | 678.261 | -11,49 | 86.465 | -13,17 | ||||
| 2026-02-17 | 13F | Janus Henderson Group Plc | 55.077 | 0,19 | 7.020 | -1,71 | ||||
| 2025-11-04 | 13F | Pineridge Advisors LLC | 226 | -3,83 | 29 | -6,45 | ||||
| 2026-02-11 | 13F | Capital Group Private Client Services, Inc. | 55.345 | -2,65 | 7.055 | -4,49 | ||||
| 2026-01-21 | 13F | Stock Yards Bank & Trust Co | 2.028 | 0,00 | 259 | -1,90 | ||||
| 2026-01-05 | 13F | Chesapeake Asset Management Llc | 5 | -50,00 | 1 | -100,00 | ||||
| 2026-02-10 | 13F | Bowen Hanes & Co Inc | 119.195 | 115,23 | 15 | -99,79 | ||||
| 2026-04-10 | 13F | Granite FO LLC | 2.000 | 0,00 | 185 | -27,17 | ||||
| 2026-02-10 | 13F | Essex Financial Services, Inc. | 15.317 | 2,30 | 1.953 | 0,36 | ||||
| 2025-11-14 | 13F | Cubist Systematic Strategies, LLC | Put | 23.900 | 2,58 | 3.106 | 0,19 | |||
| 2025-11-14 | 13F | Cubist Systematic Strategies, LLC | Call | 79.400 | 92,72 | 10.318 | 88,28 | |||
| 2026-02-12 | 13F | BlackRock, Inc. | 45.544.538 | -5,37 | 5.806.018 | -7,17 | ||||
| 2026-02-09 | 13F | Bellwether Advisors, LLC | 0 | -100,00 | 0 | |||||
| 2026-02-13 | 13F | Venture Visionary Partners LLC | 20.040 | -6,94 | 2.555 | -8,72 | ||||
| 2025-11-14 | 13F | Cubist Systematic Strategies, LLC | 65.150 | 8.466 | ||||||
| 2026-02-17 | 13F | Balyasny Asset Management Llc | Call | 8.200 | -44,22 | 1.045 | -45,29 | |||
| 2026-02-17 | 13F | Balyasny Asset Management Llc | Put | 25.700 | -55,99 | 3.276 | -56,83 | |||
| 2026-04-15 | 13F | Badgley Phelps Wealth Managers, LLC | 155.354 | -1,43 | 14.370 | -28,48 | ||||
| 2026-02-17 | 13F | Balyasny Asset Management Llc | 520.918 | -43,31 | 66.407 | -44,39 | ||||
| 2025-11-07 | 13F | Beacon Capital Management, LLC | 0 | -100,00 | 0 | |||||
| 2026-02-02 | 13F | Dudley Capital Management, Llc | 3.570 | -0,70 | 455 | -2,57 | ||||
| 2026-02-06 | 13F | Tredje AP-fonden | 637.751 | 34,00 | 81.300 | 31,46 | ||||
| 2026-02-12 | 13F | Sit Investment Associates Inc | 0 | -100,00 | 0 | |||||
| 2026-02-23 | 13F | Kera Capital Partners, Inc. | 2.736 | 6,17 | 313 | -6,59 | ||||
| 2026-04-22 | 13F | RMR Wealth Builders | 0 | -100,00 | 0 | |||||
| 2026-02-05 | 13F | North Dakota State Investment Board | 23.251 | 2.964 | ||||||
| 2026-02-13 | 13F | Baird Financial Group, Inc. | 90.192 | 173,56 | 11.498 | 168,37 | ||||
| 2026-02-09 | 13F | Allstate Corp | 47.469 | 104,03 | 6.051 | 100,17 | ||||
| 2026-01-07 | 13F/A | Stonekeep Investments, LLC | 0 | -100,00 | 0 | |||||
| 2026-04-23 | 13F | Davidson Kahn Capital Management, LLC | 32.626 | 32,41 | 3.023 | -3,76 | ||||
| 2026-04-13 | 13F | Cypress Point Wealth Management, LLC | 2.652 | 14,06 | 245 | -17,23 | ||||
| 2026-02-13 | 13F | Silvant Capital Management LLC | 7.187 | 0,00 | 916 | -1,82 | ||||
| 2026-02-13 | 13F | USS Investment Management Ltd | 110.558 | 0,23 | 14.092 | -1,66 | ||||
| 2026-02-10 | 13F | National Pension Service | 1.521.260 | 6,37 | 193.930 | 4,34 | ||||
| 2026-02-11 | 13F | Capital Research Global Investors | 5.602.262 | 0,42 | 714.195 | -1,50 | ||||
| 2026-02-17 | 13F | Equitable Holdings, Inc. | 15.792 | -5,18 | 2.013 | -6,98 | ||||
| 2026-01-20 | 13F | Tritonpoint Wealth, Llc | 0 | -100,00 | 0 | |||||
| 2026-02-17 | 13F | State Of Wisconsin Investment Board | 329.167 | -4,37 | 41.962 | -6,19 | ||||
| 2026-01-27 | 13F | Brighton Jones Llc | 0 | -100,00 | 0 | |||||
| 2026-02-17 | 13F/A | Kovack Advisors, Inc. | 4.626 | 7,51 | 590 | 5,37 | ||||
| 2026-01-27 | 13F | Asset Management One Co., Ltd. | 273.849 | 0,94 | 35.433 | 0,50 | ||||
| 2026-02-11 | 13F | SOUTH STATE Corp | 228 | 185,00 | 29 | 190,00 | ||||
| 2026-02-17 | 13F | Philadelphia Financial Management of San Francisco, LLC | 78.563 | 131,75 | 10.015 | 127,36 | ||||
| 2026-02-12 | 13F | Financial Engines Advisors L.L.C. | 7.938 | 0,16 | 1.012 | -1,75 | ||||
| 2026-02-06 | 13F | Adell Harriman & Carpenter Inc | 269.866 | 2,21 | 34.403 | 0,27 | ||||
| 2026-01-26 | 13F | West Wealth Group, LLC | 2.072 | -0,62 | 264 | 1,93 | ||||
| 2026-04-21 | 13F | Waterway Wealth Management, LLC | 16.724 | 7,12 | 1.547 | -22,31 | ||||
| 2026-04-09 | 13F | Park Place Capital Corp | 58 | -17,14 | 5 | -37,50 | ||||
| 2025-11-05 | 13F | Optimize Financial Inc | 0 | -100,00 | 0 | -100,00 | ||||
| 2026-02-09 | 13F | Dilation Capital Management LP | 113.565 | 24,28 | 14.477 | 21,92 | ||||
| 2026-02-13 | 13F | Citigroup Inc | 1.074.601 | 13,85 | 136.990 | 11,69 | ||||
| 2026-01-20 | 13F | Fundamentun, Llc | 4.540 | -0,11 | 579 | -2,03 | ||||
| 2026-02-13 | 13F | Citigroup Inc | Call | 437.500 | 7,36 | 55.772 | 5,32 | |||
| 2026-02-13 | 13F | Citigroup Inc | Put | 402.800 | 218,17 | 51.349 | 212,13 | |||
| 2026-02-10 | 13F | Texas Yale Capital Corp. | 94.666 | -0,47 | 12.068 | -2,35 | ||||
| 2026-01-30 | 13F | Trifecta Capital Advisors, LLC | 0 | -100,00 | 0 | |||||
| 2026-02-17 | 13F | Dark Forest Capital Management Lp | 7.042 | 898 | ||||||
| 2026-03-13 | 13F/A | Pensionmark Financial Group, Llc | 29.392 | 26,13 | 3.747 | 23,71 | ||||
| 2026-04-08 | 13F | Canandaigua National Corp | 13.684 | 13,98 | 1.266 | |||||
| 2026-02-04 | 13F | Securian Asset Management, Inc | 18.662 | -43,67 | 2.379 | -44,74 | ||||
| 2026-02-10 | 13F | Td Asset Management Inc | 280.775 | -4,55 | 35.793 | -6,36 | ||||
| 2026-02-13 | 13F | 1832 Asset Management L.P. | 3.610 | -98,28 | 460 | -98,31 | ||||
| 2026-02-12 | 13F | Elo Mutual Pension Insurance Co | 58.967 | 122,51 | 7.517 | 118,33 | ||||
| 2026-02-06 | 13F | Mjp Associates Inc /adv | 5.798 | -6,59 | 739 | -8,31 | ||||
| 2026-02-17 | 13F | Cresset Asset Management, LLC | 41.382 | 16,73 | 5.275 | 14,52 | ||||
| 2026-02-09 | 13F | Bleakley Financial Group, LLC | 28.261 | -29,35 | 3.603 | -30,70 | ||||
| 2026-01-14 | 13F | Enclave Advisors LLC | 0 | -100,00 | 0 | |||||
| 2026-02-09 | 13F | Mizuho Securities Usa Llc | 49.975 | 0,02 | 6.113 | -12,35 | ||||
| 2026-02-17 | 13F | Greenline Partners, LLC | 12.783 | 0,00 | 1.630 | -1,93 | ||||
| 2026-04-16 | 13F | Toth Financial Advisory Corp | 0 | -100,00 | 0 | |||||
| 2025-11-05 | 13F | Moloney Securities Asset Management, LLC | 6.727 | 0,01 | 874 | -2,24 | ||||
| 2026-01-21 | 13F | Modera Wealth Management, LLC | 1.789 | 4,93 | 228 | 3,17 | ||||
| 2026-02-10 | 13F | Foundations Investment Advisors, LLC | 3.039 | -40,49 | 387 | -41,63 | ||||
| 2026-02-17 | 13F | Schonfeld Strategic Advisors LLC | 196.771 | 16,69 | 25.084 | 14,47 | ||||
| 2026-01-29 | 13F | IMC-Chicago, LLC | 0 | -100,00 | 0 | -100,00 | ||||
| 2026-01-28 | 13F | Chicago Partners Investment Group LLC | 75.270 | 6,30 | 9.126 | 6,87 | ||||
| 2026-04-22 | 13F | Spirepoint Private Client, Llc | 7.510 | -0,84 | 695 | -28,08 | ||||
| 2026-02-09 | 13F | Leavell Investment Management, Inc. | 3.509 | -13,87 | 447 | -15,50 | ||||
| 2026-01-28 | 13F | B. Metzler seel. Sohn & Co. AG | 63.975 | -35,37 | 8.167 | -36,50 | ||||
| 2026-02-17 | 13F | Family Management Corp | 4.551 | 0,29 | 580 | -1,53 | ||||
| 2026-04-22 | 13F | Atlantic Edge Private Wealth Management, LLC | 130 | 0,00 | 12 | -25,00 | ||||
| 2026-02-05 | 13F | GABELLI & Co INVESTMENT ADVISERS, INC. | 12.000 | -25,00 | 1.530 | -26,46 | ||||
| 2026-04-20 | 13F | YANKCOM Partnership | 2.067 | 54,48 | 191 | 12,35 | ||||
| 2026-02-11 | 13F | Group One Trading, L.p. | Put | 589.700 | 64,90 | 75.175 | 61,77 | |||
| 2026-02-05 | 13F | DnB Asset Management AS | 268.202 | 19,07 | 34.190 | 16,81 | ||||
| 2026-02-12 | 13F | CIBC Private Wealth Group, LLC | 18.058 | -10,44 | 2.302 | -12,14 | ||||
| 2026-02-06 | 13F | Aviance Capital Partners, LLC | 2.316 | 0,00 | 295 | -1,67 | ||||
| 2026-02-12 | 13F | Great Lakes Advisors, Llc | 0 | -100,00 | 0 | |||||
| 2026-02-17 | 13F | Clark Capital Management Group, Inc. | 1.930 | -94,28 | 246 | -94,39 | ||||
| 2026-04-21 | 13F | Robeco Institutional Asset Management B.V. | 42.277 | -1,38 | 3.911 | -28,45 | ||||
| 2026-02-13 | 13F | Lavaca Capital Llc | 88.300 | 0,00 | 11.256 | -1,90 | ||||
| 2026-04-17 | 13F | Fifth Third Wealth Advisors LLC | 7.649 | 4,65 | 708 | -24,06 | ||||
| 2026-02-13 | 13F | Lavaca Capital Llc | Put | 22.000 | 2.805 | |||||
| 2026-02-17 | 13F | Adage Capital Partners Gp, L.l.c. | 620.400 | -8,35 | 79.089 | -10,09 | ||||
| 2026-02-03 | 13F | Grange Capital, LLC | 14.943 | 9,05 | 1.905 | 6,97 | ||||
| 2026-02-17 | 13F | Edmond De Rothschild Holding S.a. | 36.754 | -23,45 | 4.685 | -24,91 | ||||
| 2026-04-14 | 13F | Perpetual Ltd | 0 | -100,00 | 0 | |||||
| 2026-02-17 | 13F | Imprint Wealth LLC | 31 | -72,81 | 4 | -78,57 | ||||
| 2026-02-12 | 13F | Alps Advisors Inc | 26.540 | -12,67 | 3.383 | -14,33 | ||||
| 2026-02-06 | 13F | Mach-1 Financial Group, Inc. | 3.450 | 440 | ||||||
| 2026-02-09 | 13F | Atlantic Trust, LLC | 0 | -100,00 | 0 | |||||
| 2026-02-12 | 13F | Johnson Financial Group, Inc. | 4.048 | -0,52 | 516 | -2,27 | ||||
| 2026-01-07 | 13F | Central Pacific Bank - Trust Division | 0 | -100,00 | 0 | |||||
| 2026-04-16 | 13F | Evolve Private Wealth, Llc | 8.264 | 764 | ||||||
| 2026-02-11 | 13F | IMA Wealth, Inc. | 20 | 3 | ||||||
| 2026-02-13 | 13F | Resources Investment Advisors, LLC. | 9.619 | -9,01 | 1.226 | -10,71 | ||||
| 2025-10-28 | 13F | Pinnacle Financial Partners Inc | 41.919 | 0,63 | 5.447 | -1,70 | ||||
| 2026-02-13 | 13F | American Century Companies Inc | 752.259 | -0,11 | 95.898 | -2,01 | ||||
| 2026-02-12 | 13F | Hilton Capital Management, LLC | 1.932 | 0,00 | 246 | -1,99 | ||||
| 2026-02-12 | 13F | Bank Of Montreal /can/ | 1.053.367 | 3,38 | 134.283 | 1,41 | ||||
| 2026-02-09 | 13F | Westover Capital Advisors, LLC | 11.130 | 0,00 | 1.419 | -1,94 | ||||
| 2026-04-20 | 13F | Yorktown Management & Research Co Inc | 7.200 | 0,00 | 666 | -27,37 | ||||
| 2026-04-07 | 13F | Signaturefd, Llc | 8.502 | -8,80 | 786 | -33,84 | ||||
| 2026-02-11 | 13F | Group One Trading, L.p. | Call | 142.700 | 0,56 | 18.191 | -1,34 | |||
| 2026-02-11 | 13F | Group One Trading, L.p. | 5.508 | -64,52 | 702 | -65,20 | ||||
| 2026-02-13 | 13F | 1832 Asset Management L.P. | Put | 0 | -100,00 | 0 | -100,00 | |||
| 2026-02-05 | 13F | Gabelli Funds Llc | 1.075.282 | -0,85 | 137.077 | -2,74 | ||||
| 2026-02-09 | 13F | Choate Investment Advisors | 13.961 | 0,00 | 1.780 | -1,93 | ||||
| 2026-04-16 | 13F | Brookstone Capital Management | 176.574 | 40,38 | 16.333 | 1,86 | ||||
| 2026-01-29 | 13F | Sanctuary Advisors, LLC | 68.725 | -6,58 | 8.761 | -8,36 | ||||
| 2026-02-10 | 13F | Pring Turner Capital Group Inc | 2.275 | -1,73 | 290 | -3,33 | ||||
| 2025-12-16 | 13F | Garde Capital, Inc. | 0 | -100,00 | 0 | |||||
| 2026-01-29 | 13F | RMG Wealth Management LLC | 288 | -60,44 | 36 | -59,55 | ||||
| 2026-02-13 | 13F | First Trust Advisors Lp | 33.013 | -40,86 | 4.209 | -41,99 | ||||
| 2026-04-21 | 13F | Bennett Selby Investments Lp | 0 | -100,00 | 0 | |||||
| 2026-02-05 | 13F | Canada Post Corp Registered Pension Plan | 17.180 | 26,88 | 2.190 | 20,33 | ||||
| 2025-10-27 | 13F | Qvr Llc | Put | 0 | -100,00 | 0 | ||||
| 2025-10-27 | 13F | Qvr Llc | Call | 0 | -100,00 | 0 | ||||
| 2026-02-17 | 13F | Principal Street Partners, LLC | 5.141 | 0,27 | 655 | -1,65 | ||||
| 2026-02-13 | 13F | Gts Securities Llc | 9.101 | 103,88 | 1.160 | 100,00 | ||||
| 2025-10-27 | 13F | Qvr Llc | 0 | -100,00 | 0 | |||||
| 2026-04-09 | 13F | Diversified Management Inc | 3.674 | 340 | ||||||
| 2026-02-17 | 13F | IHT Wealth Management, LLC | 9.571 | -3,81 | 1.220 | -5,65 | ||||
| 2026-04-08 | 13F | Wealth Enhancement Advisory Services, Llc | 129.586 | -3,39 | 11.236 | -38,33 | ||||
| 2026-01-14 | 13F | Net Worth Advisory Group | 0 | -100,00 | 0 | -100,00 | ||||
| 2026-04-22 | 13F | Smallwood Wealth Investment Management, LLC | 434 | 0,23 | 40 | -27,27 | ||||
| 2026-02-04 | 13F | Income Insurance Ltd | 1.849 | 236 | ||||||
| 2026-02-13 | 13F | SRS Capital Advisors, Inc. | 4.780 | -52,22 | 609 | -53,15 | ||||
| 2026-04-23 | 13F | iA Global Asset Management Inc. | 0 | -100,00 | 0 | |||||
| 2026-01-22 | 13F | Ofi Invest Asset Management | 429.843 | 0,01 | 46.657 | -1,85 | ||||
| 2026-04-21 | 13F | Merkkuri Wealth Advisors LLC | 3 | 0 | ||||||
| 2026-02-17 | 13F | Prelude Capital Management, Llc | 2.021 | -52,23 | 258 | -53,19 | ||||
| 2026-02-17 | 13F | DZ BANK AG Deutsche Zentral Genossenschafts Bank, Frankfurt am Main | 2.078.604 | -60,35 | 264.980 | -61,10 | ||||
| 2026-02-13 | 13F | Quarry LP | 659 | -33,30 | 84 | -34,37 | ||||
| 2026-01-27 | 13F | Penobscot Investment Management Company, Inc. | 5.500 | 0,00 | 701 | -1,82 | ||||
| 2026-02-17 | 13F | Investment Management Corp of Ontario | 55.349 | 42,72 | 7.056 | 40,01 | ||||
| 2026-02-13 | 13F | Truvestments Capital Llc | 310 | 0,00 | 40 | -2,50 | ||||
| 2026-02-11 | 13F | Parallel Advisors, LLC | 18.260 | -3,75 | 2.328 | -5,60 | ||||
| 2026-02-17 | 13F | Fairscale Capital, LLC | 0 | -100,00 | 0 | |||||
| 2026-04-20 | 13F | Emprise Bank | 0 | -100,00 | 0 | |||||
| 2026-02-11 | 13F | CNB Bank | 3.504 | 0,98 | 447 | -0,89 | ||||
| 2026-02-03 | 13F | Legacy Wealth Managment, LLC/ID | 72 | 9 | ||||||
| 2025-10-30 | 13F | Carmel Capital Partners, LLC | 0 | -100,00 | 0 | |||||
| 2026-04-10 | 13F/A | OP Asset Management Ltd | 63.470 | -7,72 | 5.871 | -33,04 | ||||
| 2026-01-30 | 13F | Valued Wealth Advisors LLC | 25 | 31,58 | 3 | 50,00 | ||||
| 2026-02-05 | 13F | Qsemble Capital Management, LP | 6.894 | -78,02 | 879 | -78,45 | ||||
| 2026-01-29 | 13F | Vanguard Group Inc | 60.064.587 | 1,39 | 7.657.034 | -0,54 | ||||
| 2026-02-13 | 13F | Maltese Capital Management Llc | 0 | -100,00 | 0 | |||||
| 2026-04-22 | 13F | Yelin Lapidot Holdings Management Ltd. | 14.827 | 0,00 | 1.371 | -27,46 | ||||
| 2026-02-10 | 13F | CIBC Asset Management Inc | 167.527 | 67,15 | 21.356 | 63,99 | ||||
| 2026-02-11 | 13F | Entelevest, LLC | Call | 700 | 89 | |||||
| 2026-02-11 | 13F | Entelevest, LLC | 1.447 | 184 | ||||||
| 2026-02-17 | 13F | BlueCrest Capital Management Ltd | 9.341 | 1.191 | ||||||
| 2026-04-21 | 13F | Cfm Wealth Partners Llc | 32.470 | -9,84 | 3.004 | -34,59 | ||||
| 2026-02-17 | 13F | Ameriflex Group, Inc. | 306 | -49,67 | 39 | -50,63 | ||||
| 2026-02-11 | 13F | J.Safra Asset Management Corp | 943 | 0,00 | 120 | -1,64 | ||||
| 2026-01-21 | 13F | Flagship Harbor Advisors, Llc | 194 | -88,29 | 25 | -88,84 | ||||
| 2026-02-11 | 13F | Capital International Sarl | 171.174 | 309,01 | 21.821 | 301,27 | ||||
| 2026-04-16 | 13F | Financial Management Network Inc | 13.759 | -7,30 | 1.277 | -33,25 | ||||
| 2026-01-21 | 13F | Crews Bank & Trust | 204 | 0,00 | 26 | 0,00 | ||||
| 2026-02-10 | 13F | Meitav Dash Investments Ltd | 592.177 | 35,69 | 75.491 | 33,32 | ||||
| 2026-02-13 | 13F | Mariner, LLC | 485.621 | -3,76 | 61.904 | -5,60 | ||||
| 2026-02-17 | 13F | Citadel Advisors Llc | 347.848 | -60,26 | 44.344 | -61,02 | ||||
| 2026-02-17 | 13F | Citadel Advisors Llc | Put | 649.500 | -7,16 | 82.798 | -8,93 | |||
| 2026-02-17 | 13F | Citadel Advisors Llc | Call | 1.108.100 | 60,64 | 141.261 | 57,59 | |||
| 2026-02-11 | 13F | Winton Capital Group Ltd | 52.350 | 100,34 | 6.674 | 96,55 | ||||
| 2026-02-17 | 13F | Rakuten Investment Management, Inc. | 87.633 | -73,09 | 11.341 | -88,97 | ||||
| 2026-04-16 | 13F | Quotient Wealth Partners, LLC | 2.260 | -18,71 | 209 | -40,96 | ||||
| 2026-04-16 | 13F | Davis Capital Management | 10 | 11,11 | 1 | -100,00 | ||||
| 2026-02-05 | 13F | United Bank | 9.769 | 29,99 | 1.245 | 27,56 | ||||
| 2026-04-17 | 13F | First City Capital Management, Inc. | 3.541 | -3,54 | 328 | -29,98 | ||||
| 2025-11-05 | 13F | Concord Asset Management, LLC/VA | 0 | -100,00 | 0 | |||||
| 2026-01-28 | 13F | Financial Perspectives, Inc | 1.120 | 0,00 | 143 | -2,07 | ||||
| 2026-01-28 | 13F | CAPROCK Group, Inc. | 10.044 | 62,16 | 1.280 | 48,15 | ||||
| 2026-02-11 | 13F | Horizon Kinetics Asset Management Llc | 2.394 | 0,08 | 305 | -1,61 | ||||
| 2026-02-17 | 13F | ISAM Funds (UK) Ltd | 0 | -100,00 | 0 | |||||
| 2026-02-10 | 13F | Beaton Management Co. Inc. | 2.100 | 0 | ||||||
| 2026-02-12 | 13F | New York State Common Retirement Fund | 723.976 | -1,45 | 92.292 | -3,32 | ||||
| 2026-04-08 | 13F | Canandaigua National Trust Co of Florida | 5.240 | 485 | ||||||
| 2026-01-23 | 13F | Westside Investment Management, Inc. | 63 | 0,00 | 8 | 0,00 | ||||
| 2026-02-11 | 13F | Marks Group Wealth Management, Inc | 12.831 | 173,17 | 1.636 | 168,03 | ||||
| 2026-04-23 | 13F | SJS Investment Consulting Inc. | 1.040 | 97,72 | 96 | 43,28 | ||||
| 2026-01-26 | 13F | PFG Investments, LLC | 0 | -100,00 | 0 | |||||
| 2026-04-22 | 13F | Formidable Asset Management, LLC | 2.681 | 14,52 | 342 | 12,17 | ||||
| 2026-02-10 | 13F | Tidemark, LLC | 0 | -100,00 | 0 | |||||
| 2026-02-17 | 13F | Karani Asset Management LLC | 0 | -100,00 | 0 | |||||
| 2026-04-20 | 13F | SILVER OAK SECURITIES, Inc | 3.249 | -15,10 | 301 | -39,02 | ||||
| 2026-04-13 | 13F | IFP Advisors, Inc | 41.368 | 4,64 | 3.827 | -24,07 | ||||
| 2026-02-17 | 13F | GeoWealth Management, LLC | 2.046 | 17,86 | 261 | 15,56 | ||||
| 2026-04-13 | 13F | Global X Japan Co., Ltd. | 347 | 32 | ||||||
| 2026-02-10 | 13F | Redwood Financial Network Corp | 1.637 | 0,06 | 209 | -1,89 | ||||
| 2026-02-17 | 13F | Aureus Asset Management, LLC | 1.692 | -1,05 | 216 | -3,15 | ||||
| 2026-01-28 | 13F | O'ROURKE & COMPANY, Inc | 38.045 | -2,75 | 4.850 | -4,60 | ||||
| 2026-02-17 | 13F | Tower Research Capital LLC (TRC) | 24.695 | 27,70 | 3.148 | 25,32 | ||||
| 2026-01-29 | 13F | Golden State Equity Partners | 9.714 | 2,10 | 1.238 | 0,16 | ||||
| 2026-02-17 | 13F | Holocene Advisors, LP | 714.651 | 15,86 | 91.104 | 13,65 | ||||
| 2026-02-17 | 13F | Farallon Capital Management Llc | 2.017.700 | 257.216 | ||||||
| 2026-02-11 | 13F | Manchester Capital Management LLC | 3.455 | 440 | ||||||
| 2026-01-14 | 13F | Congress Park Capital LLC | 0 | -100,00 | 0 | |||||
| 2026-02-12 | 13F | Foster Dykema Cabot & Partners, Llc | 3.981 | -97,90 | 507 | -97,94 | ||||
| 2026-04-13 | 13F | GoalVest Advisory LLC | 0 | -100,00 | 0 | |||||
| 2026-04-06 | 13F | Washington Trust Advisors, Inc. | 30 | -85,58 | 3 | -92,31 | ||||
| 2026-02-05 | 13F | Millennium Capital Advisors, LLC | 3.155 | 6,23 | 402 | 4,42 | ||||
| 2026-02-13 | 13F | Change Path, LLC | 2.105 | -8,08 | 268 | -9,76 | ||||
| 2026-02-13 | 13F | Ariel Investments, Llc | 264.916 | 3,70 | 33.771 | 1,73 | ||||
| 2026-01-23 | 13F | Cove Private Wealth, LLC | 20.127 | -6,94 | 2.566 | -8,72 | ||||
| 2026-02-02 | 13F | Artemis Investment Management LLP | 0 | -100,00 | 0 | |||||
| 2026-04-07 | 13F | Alpha Omega Wealth Management LLC | 0 | -100,00 | 0 | |||||
| 2026-02-13 | 13F | Glen Eagle Advisors, LLC | 437 | 2,34 | 56 | 0,00 | ||||
| 2026-02-09 | 13F | Geode Capital Management, Llc | 14.995.742 | 0,99 | 1.903.220 | -0,91 | ||||
| 2026-01-15 | 13F | Frank, Rimerman Advisors LLC | 4.987 | 91,51 | 636 | 87,87 | ||||
| 2026-02-12 | 13F | Winslow Capital Management, LLC | 2.114.593 | 16.061,67 | 270.214 | 15.794,88 | ||||
| 2026-01-20 | 13F | Cromwell Holdings LLC | 2.127 | 235,49 | 271 | 230,49 | ||||
| 2026-01-27 | 13F | Checchi Capital Advisers, LLC | 18.812 | -0,20 | 2.398 | -2,08 | ||||
| 2026-02-02 | 13F | Oppenheimer Asset Management Inc. | 5.051 | 7,15 | 644 | 5,07 | ||||
| 2026-04-20 | 13F | Ritholtz Wealth Management | 6.735 | -2,60 | 623 | -29,28 | ||||
| 2026-01-30 | 13F | Torren Management, LLC | 95 | 12 | ||||||
| 2026-01-15 | 13F | Rochester Wealth Strategies, LLC | 3.010 | 0,00 | 384 | -2,05 | ||||
| 2026-04-07 | 13F | Park Avenue Securities Llc | 12.068 | -58,39 | 1 | -66,67 | ||||
| 2026-01-20 | 13F | C2P Capital Advisory Group, LLC d.b.a. Prosperity Capital Advisors | 0 | -100,00 | 0 | -100,00 | ||||
| 2026-04-21 | 13F | Old National Bancorp /in/ | 6.108 | -8,99 | 565 | -34,04 | ||||
| 2026-02-17 | 13F | Hancock Whitney Corp | 35.032 | 4,09 | 4.466 | 2,10 | ||||
| 2026-02-17 | 13F | Millennium Management Llc | 390.332 | -39,45 | 49.760 | -40,60 | ||||
| 2026-04-08 | 13F | DiNuzzo Private Wealth, Inc. | 273 | -0,73 | 25 | -28,57 | ||||
| 2026-04-15 | 13F | Norden Group Llc | 5.269 | 74,88 | 487 | 26,82 | ||||
| 2026-04-07 | 13F | CoreCap Advisors, LLC | 499 | 2,89 | 46 | -24,59 | ||||
| 2026-04-21 | 13F | First United Bank Trust/ | 267 | -10,70 | 25 | -36,84 | ||||
| 2026-01-08 | 13F | Fulton Bank, N.a. | 13.088 | -4,08 | 1.668 | -5,92 | ||||
| 2026-02-09 | 13F | King Luther Capital Management Corp | 0 | -100,00 | 0 | |||||
| 2026-02-10 | 13F | Goldman Sachs Group Inc | Call | 0 | -100,00 | 0 | -100,00 | |||
| 2026-02-03 | 13F | S-Bank Fund Management Ltd | 3.670 | -3,42 | 468 | -5,27 | ||||
| 2026-02-17 | 13F | Triveni Capital Investments LP | 90.514 | 11.539 | ||||||
| 2026-02-17 | 13F | Millennium Management Llc | Call | 91.900 | -4,37 | 11.715 | -6,19 | |||
| 2026-02-17 | 13F | Millennium Management Llc | Put | 157.400 | 17,99 | 20.065 | 15,75 | |||
| 2026-04-08 | 13F | E Fund Management (Hong Kong) Co., Ltd. | 86 | 91,11 | 8 | 40,00 | ||||
| 2026-02-27 | 13F | Groupama Asset Managment | 8.116 | -9,40 | 1.035 | -11,17 | ||||
| 2026-02-09 | 13F | HBK Sorce Advisory LLC | 13.841 | -0,74 | 1.428 | -17,69 | ||||
| 2026-02-09 | 13F | HBK Sorce Advisory LLC | Put | 10.500 | 0,00 | 190 | 53,66 | |||
| 2026-04-21 | 13F | Pinnacle Associates Ltd | 71.886 | -2,87 | 6.649 | -29,52 | ||||
| 2026-02-17 | 13F | Castle Hook Partners LP | 22.303 | 2.843 | ||||||
| 2026-02-02 | 13F | Horizon Investments, LLC | 13.972 | -2,44 | 1.781 | -4,30 | ||||
| 2026-02-10 | 13F | Bruce G. Allen Investments, LLC | 433 | -19,81 | 55 | -21,43 | ||||
| 2026-02-10 | 13F | Gulf International Bank (UK) Ltd | 31.373 | 0,00 | 4 | -25,00 | ||||
| 2026-02-05 | 13F | IMG Wealth Management, Inc. | 3 | 0 | ||||||
| 2025-11-14 | 13F | Bain Capital Public Equity Management Ii, Llc | 0 | -100,00 | 0 | -100,00 | ||||
| 2025-11-14 | 13F | Teza Capital Management LLC | 0 | -100,00 | 0 | |||||
| 2026-03-12 | 13F/A | Peak6 Llc | Put | 173.900 | 286,44 | 22.169 | 279,13 | |||
| 2026-03-12 | 13F/A | Peak6 Llc | Call | 119.400 | 17,52 | 15.221 | 15,29 | |||
| 2026-02-13 | 13F | OMERS ADMINISTRATION Corp | 24.393 | 0,00 | 3.110 | -1,89 | ||||
| 2026-03-12 | 13F/A | Peak6 Llc | 140.194 | 35,11 | 17.872 | 32,53 | ||||
| 2025-11-17 | 13F | FSA Wealth Management LLC | 34 | 0,00 | 4 | 0,00 |