Grundlæggende statistik
| Institutionelle aktier (lange) | 204.136.278 - 91,44% (ex 13D/G) - change of -46,59MM shares -18,58% MRQ |
| Institutionel værdi (lang) | $ 14.456.651 USD ($1000) |
Institutionelt ejerskab og aktionærer
Hologic, Inc. (US:HOLX) har 780 institutionelle ejere og aktionærer, der har indsendt 13D/G- eller 13F-formularer til Securities Exchange Commission (SEC). Disse institutioner har i alt 204,136,278 aktier. Største aktionærer omfatter Vanguard Group Inc, BlackRock, Inc., State Street Corp, Hbk Investments L P, Geode Capital Management, Llc, Victory Capital Management Inc, FIL Ltd, Pentwater Capital Management LP, T. Rowe Price Investment Management, Inc., and Norges Bank .
Hologic, Inc. (NasdaqGS:HOLX) institutionel ejerskabsstruktur viser aktuelle positioner i virksomheden efter institutioner og fonde, samt seneste ændringer i positionsstørrelse. Større aktionærer kan omfatte individuelle investorer, investeringsforeninger, hedgefonde eller institutioner. Skema 13D angiver, at investoren besidder (eller besidder) mere end 5 % af virksomheden og har til hensigt (eller har til hensigt at) aktivt at forfølge en ændring i forretningsstrategi. Skema 13G indikerer en passiv investering på over 5%.
The share price as of March 27, 2026 is 75,67 / share. Previously, on March 28, 2025, the share price was 61,32 / share. This represents an increase of 23,40% over that period.

Fondens stemningsscore
Fund Sentiment Score (fka Ownership Accumulation Score) finder de aktier, der bliver mest købt af fonde. Det er resultatet af en sofistikeret, multi-faktor kvantitativ model, der identificerer virksomheder med de højeste niveauer af institutionel akkumulering. Scoringsmodellen bruger en kombination af den samlede stigning i oplyste ejere, ændringerne i porteføljeallokeringer i disse ejere og andre målinger. Tallet går fra 0 til 100, hvor højere tal indikerer et højere niveau af akkumulering for sine jævnaldrende, og 50 er gennemsnittet.
Opdateringsfrekvens: Dagligt
Se Ownership Explorer, som giver en liste over højest rangerende virksomheder.
AI+ Ask Fintel’s AI assistant about Hologic, Inc..
Select a question to share a public post with an AI-crafted answer.
Thinking of good questions…
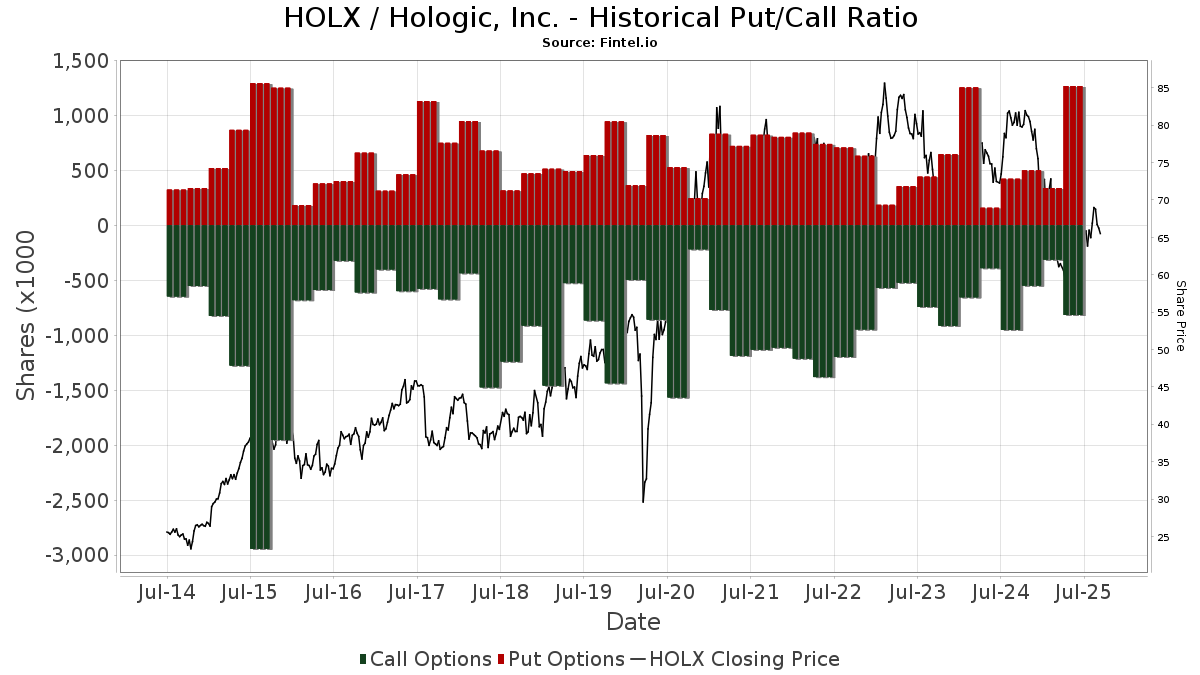
Institutionel Put/Call-forhold
Ud over at indberette standardaktie- og gældsudstedelser skal institutter med mere end 100 mill. aktiver under forvaltning også oplyse deres put- og call-optionsbeholdninger. Da salgsoptioner generelt indikerer negativ stemning, og købsoptioner indikerer positiv stemning, kan vi få en fornemmelse af den overordnede institutionelle stemning ved at plotte forholdet mellem put og kald. Diagrammet til højre viser det historiske put/call-forhold for dette instrument.
Brug af Put/Call Ratio som en indikator for investorernes stemning overvinder en af de vigtigste mangler ved at bruge totalt institutionelt ejerskab, som er, at en betydelig mængde af aktiver under forvaltning investeres passivt for at spore indekser. Passivt forvaltede fonde køber typisk ikke optioner, så indikatoren for put/call-forholdet følger mere nøje følelsen af aktivt forvaltede fonde.
13D/G-arkivering
Vi præsenterer 13D/G ansøgninger separat fra 13F ansøgninger på grund af den forskellige behandling af SEC. 13D/G-ansøgninger kan indgives af grupper af investorer (med én ledende), hvorimod 13F-ansøgninger ikke kan. Dette resulterer i situationer, hvor en investor kan indsende en 13D/G, der rapporterer én værdi for de samlede aktier (der repræsenterer alle de aktier, der ejes af investorgruppen), men derefter indsender en 13F, der rapporterer en anden værdi for de samlede aktier (der udelukkende repræsenterer deres egne) ejendomsret). Det betyder, at aktieejerskab af 13D/G-arkiver og 13F-arkiveringer ofte ikke er direkte sammenlignelige, så vi præsenterer dem separat.
Bemærk: Fra den 16. maj 2021 viser vi ikke længere ejere, der ikke har indsendt en 13D/G inden for det seneste år. Tidligere viste vi den fulde historie af 13D/G-arkiver. Generelt skal enheder, der er forpligtet til at indgive 13D/G-ansøgninger, indgive mindst årligt, før de indsender en afsluttende ansøgning. Dog forlader fonde nogle gange positioner uden at indsende en afsluttende ansøgning (dvs. de afvikler), så visning af den fulde historie resulterede nogle gange i forvirring om det nuværende ejerskab. For at undgå forvirring viser vi nu kun 'aktuelle' ejere - det vil sige - ejere, der har anmeldt inden for det seneste år.
Upgrade to unlock premium data.
| Fil dato | Form | Investor | Forrige Aktier |
Seneste Aktier |
Δ Aktier (Procent) |
Ejendomsret (Procent) |
Δ Ejerskab (Procent) |
|
|---|---|---|---|---|---|---|---|---|
| 2026-03-27 | VANGUARD GROUP INC | 27,678,976 | 0 | -100.00 | 0.00 | -100.00 | ||
| 2026-02-17 | T. Rowe Price Investment Management, Inc. | 21,550,364 | 5,932,301 | -72.47 | 2.70 | -72.16 | ||
| 2025-04-17 | BlackRock, Inc. | 24,263,694 | 19,937,246 | -17.83 | 8.90 | -11.88 |
13F og NPORT arkivering
Detaljer om 13F-arkivering er gratis. Detaljer om NP-ansøgninger kræver et premium-medlemskab. Grønne rækker angiver nye positioner. Røde rækker angiver lukkede positioner. Klik på linket ikon for at se den fulde transaktionshistorik.
Opgrader
for at låse premium-data op og eksportere til Excel ![]() .
.
Important Note
In an effort to reduce load times for our mobile users, we are testing some ways to deliver lighter pages.
In this first test, we will deliver only the most recent 750 transactions (out of 1003 for this stock). If you are interested in loading *all* the transactions for this company, click the "load all" button below. This is just a test and if you don't like it, please let us know by submitting some gentle feedback via the link at the bottom of this page.
Load All| Fil dato | Kilde | Investor | Type | Gennemsnitlig pris (Øst) |
Aktier | Δ Aktier (%) |
Rapporteret Værdi ($1000) |
Δ Værdi (%) |
Port Alloc (%) |
|
|---|---|---|---|---|---|---|---|---|---|---|
| 2026-02-10 | 13F | Principia Wealth Advisory, LLC | 17 | 6,25 | 1 | 0,00 | ||||
| 2026-02-11 | 13F | Group One Trading, L.p. | Put | 11.200 | -31,29 | 834 | -24,18 | |||
| 2026-02-11 | 13F | Group One Trading, L.p. | 1.111 | 83 | ||||||
| 2026-02-12 | 13F | Commonwealth Equity Services, Llc | 39.007 | -18,66 | 2.906 | 96.733,33 | ||||
| 2026-02-13 | 13F | Colony Group, LLC | 48.306 | 48,17 | 3.598 | 63,47 | ||||
| 2026-01-29 | 13F | State Of Michigan Retirement System | 58.265 | -3,16 | 4.340 | 6,90 | ||||
| 2026-02-11 | 13F | Group One Trading, L.p. | Call | 6.000 | -95,57 | 447 | -95,12 | |||
| 2026-02-17 | 13F | Fmr Llc | 472.087 | 43,38 | 35.166 | 58,25 | ||||
| 2026-01-21 | 13F | Clayton Financial Group LLC | 14 | 1 | ||||||
| 2026-02-17 | 13F | Tcw Group Inc | 3.524 | 263 | ||||||
| 2026-01-20 | 13F | Toth Financial Advisory Corp | 550 | -5,17 | 41 | 2,56 | ||||
| 2026-02-09 | 13F | Nia Impact Advisors, Llc | 53.051 | -6,97 | 3.952 | 2,68 | ||||
| 2026-02-13 | 13F | JustInvest LLC | 34.991 | 9,25 | 2.606 | 20,59 | ||||
| 2026-02-12 | 13F | APG Asset Management US Inc. | 0 | -100,00 | 0 | |||||
| 2026-01-28 | 13F | Teacher Retirement System Of Texas | 7.371 | -94,78 | 549 | -94,23 | ||||
| 2026-02-13 | 13F | Soros Fund Management Llc | 876.422 | 65.285 | ||||||
| 2026-01-28 | 13F | Cranbrook Wealth Management, LLC | 4.851 | 28,74 | 361 | 42,13 | ||||
| 2026-02-17 | 13F | Greenland Capital Management LP | 17.200 | 1.281 | ||||||
| 2025-09-29 | NP | HCMT - Direxion HCM Tactical Enhanced US ETF | 1.658 | 22,00 | 111 | 39,24 | ||||
| 2026-02-02 | 13F | CENTRAL TRUST Co | 777 | -3,72 | 58 | 5,56 | ||||
| 2026-02-17 | 13F | Toronto Dominion Bank | 85.638 | -5,66 | 6.379 | 4,13 | ||||
| 2026-02-11 | 13F | Janney Montgomery Scott LLC | 23.490 | -5,34 | 2 | 0,00 | ||||
| 2026-02-13 | 13F | Parkside Financial Bank & Trust | 341 | 15,99 | 25 | 31,58 | ||||
| 2026-02-10 | 13F | Daiwa Securities Group Inc. | 35.874 | 2,91 | 3 | 0,00 | ||||
| 2025-11-14 | 13F | Binnacle Investments Inc | 15 | 1 | ||||||
| 2026-02-04 | 13F | HighPoint Advisor Group LLC | 9.882 | -25,71 | 736 | -17,95 | ||||
| 2026-02-05 | 13F | iA Global Asset Management Inc. | 17.752 | 1 | ||||||
| 2026-02-03 | 13F | Crossmark Global Holdings, Inc. | 17.263 | -46,40 | 1.286 | -40,87 | ||||
| 2026-01-22 | 13F | Red Tortoise LLC | 44 | 0,00 | 3 | 50,00 | ||||
| 2026-02-17 | 13F | Perbak Capital Partners LLP | 0 | -100,00 | 0 | |||||
| 2025-11-13 | 13F | Capital Fund Management S.a. | Call | 0 | -100,00 | 0 | -100,00 | |||
| 2026-02-11 | 13F | Illinois Municipal Retirement Fund | 126.548 | -26,55 | 9.427 | -18,94 | ||||
| 2026-02-11 | 13F | Fjarde Ap-fonden /fourth Swedish National Pension Fund | 101.614 | 7.569 | ||||||
| 2026-02-13 | 13F | Great West Life Assurance Co /can/ | 126.203 | -61,47 | 9 | -59,09 | ||||
| 2026-01-20 | 13F | Hanson & Doremus Investment Management | 900 | 0,00 | 0 | |||||
| 2026-02-11 | 13F | Nuance Investments, Llc | 360.824 | -0,17 | 26.878 | 10,18 | ||||
| 2026-01-26 | 13F | Abundance Wealth Counselors | 12.096 | 1,01 | 901 | 11,51 | ||||
| 2026-02-13 | 13F | Candriam Luxembourg S.C.A. | 23.399 | -94,14 | 1.743 | -93,53 | ||||
| 2026-02-05 | 13F | Tucker Asset Management Llc | 104 | 8 | ||||||
| 2026-01-12 | 13F | Canvas Wealth Advisors, LLC | 4.125 | 11,85 | 307 | 22,31 | ||||
| 2026-02-17 | 13F | T. Rowe Price Investment Management, Inc. | 3.853.062 | -82,12 | 287 | -80,26 | ||||
| 2026-02-09 | 13F | Coldstream Capital Management Inc | 7.188 | -18,74 | 535 | -10,39 | ||||
| 2026-02-11 | 13F | Ing Groep Nv | 28.764 | 0,03 | 2.143 | 10,41 | ||||
| 2026-02-13 | 13F | Charles Schwab Investment Management Inc | 2.095.962 | 1,39 | 156.128 | 11,90 | ||||
| 2025-11-05 | 13F | Soundwatch Capital LLC | 0 | -100,00 | 0 | |||||
| 2026-03-03 | 13F/A | Caitong International Asset Management Co., Ltd | 10 | -97,05 | 1 | -100,00 | ||||
| 2025-09-29 | NP | CFMCX - Column Mid Cap Fund | 28.371 | 22,80 | 1.904 | 32,59 | ||||
| 2026-01-23 | 13F | Sumitomo Mitsui Trust Holdings, Inc. | 557.978 | -2,93 | 41.564 | 7,14 | ||||
| 2026-02-09 | 13F | Fisher Asset Management, LLC | 0 | -100,00 | 0 | |||||
| 2026-02-17 | 13F | Two Sigma Securities, Llc | 8.228 | -36,11 | 613 | -29,57 | ||||
| 2026-02-13 | 13F | Walleye Trading LLC | Call | 68.700 | -15,39 | 5.117 | -6,62 | |||
| 2026-02-13 | 13F | Walleye Trading LLC | 9.000 | -93,33 | 670 | -92,65 | ||||
| 2026-01-13 | 13F | Syquant Capital Sas | 126.300 | 9 | ||||||
| 2026-02-12 | 13F | State Board Of Administration Of Florida Retirement System | 203.843 | -9,78 | 15.184 | -0,43 | ||||
| 2026-02-13 | 13F | Walleye Trading LLC | Put | 101.000 | -62,62 | 7.523 | -58,74 | |||
| 2026-02-13 | 13F | Marshall Wace, Llp | 157.674 | 11.745 | ||||||
| 2025-09-29 | NP | XTR - Global X S&P 500 Tail Risk ETF This fund is a listed as child fund of Mirae Asset Global Investments Co., Ltd. and if that institution has disclosed ownership in this security, then these positions will not be double counted when calculating total shares and total value | 8 | 0,00 | 1 | |||||
| 2026-02-06 | 13F | Twin Capital Management Inc | 5.373 | 0,67 | 400 | 11,11 | ||||
| 2026-02-13 | 13F | Caxton Associates Llp | 0 | -100,00 | 0 | |||||
| 2026-02-26 | 13F | Anchor Investment Management, LLC | 5.000 | -31,88 | 372 | -24,85 | ||||
| 2026-01-21 | 13F | Oak Thistle LLC | 62.629 | 182,30 | 4.665 | 211,62 | ||||
| 2026-02-05 | 13F | IMG Wealth Management, Inc. | 0 | -100,00 | 0 | -100,00 | ||||
| 2026-02-17 | 13F | Mercer Global Advisors Inc /adv | 25.313 | 14,29 | 1.886 | 26,17 | ||||
| 2026-02-17 | 13F | TCG Advisory Services, LLC | 2.712 | 202 | ||||||
| 2025-11-14 | 13F | Pentwater Capital Management LP | Put | 0 | -100,00 | 0 | -100,00 | |||
| 2026-02-17 | 13F | Brevan Howard Capital Management LP | 65.513 | 40,17 | 4.880 | 54,72 | ||||
| 2026-02-17 | 13F | Longaeva Partners L.P. | 0 | -100,00 | 0 | |||||
| 2026-02-17 | 13F | NEOS Investment Management LLC | 30.246 | 19,56 | 2.253 | 31,99 | ||||
| 2026-02-11 | 13F | Cerity Partners LLC | 16.952 | -62,78 | 1.263 | -58,93 | ||||
| 2026-02-06 | 13F | Leonteq Securities AG | 24 | -94,27 | 2 | -96,43 | ||||
| 2026-01-20 | 13F | SOA Wealth Advisors, LLC. | 3 | 0,00 | 0 | |||||
| 2026-02-05 | 13F | Mesirow Financial Investment Management, Inc. | 4.671 | -10,02 | 348 | -0,86 | ||||
| 2026-02-17 | 13F | Longaeva Partners L.P. | Call | 0 | -100,00 | 0 | ||||
| 2025-11-14 | 13F | Eqis Capital Management, Inc. | 0 | -100,00 | 0 | |||||
| 2026-02-12 | 13F | FineMark National Bank & Trust | 3.375 | 0,00 | 251 | 10,57 | ||||
| 2026-02-12 | 13F | South Dakota Investment Council | 11.000 | -30,38 | 1 | -100,00 | ||||
| 2026-01-16 | 13F | First Community Trust Na | 16.553 | -0,05 | 1.233 | 10,38 | ||||
| 2026-02-06 | 13F | Larson Financial Group LLC | 702 | 39,84 | 52 | 57,58 | ||||
| 2026-02-17 | 13F | ISAM Funds (UK) Ltd | 0 | -100,00 | 0 | |||||
| 2025-09-29 | NP | AIM INTERNATIONAL MUTUAL FUNDS (INVESCO INTERNATIONAL MUTUAL FUNDS) - Invesco Global Responsibility Equity Fund Class A | 235 | 0,00 | 16 | 15,38 | ||||
| 2025-09-29 | NP | OTTRX - Otter Creek Long/Short Opportunity Fund Institutional Class | 66.000 | 612,05 | 4.410 | 528,21 | ||||
| 2026-01-12 | 13F | Salem Investment Counselors Inc | 0 | -100,00 | 0 | |||||
| 2026-02-03 | 13F | Bokf, Na | 8.459 | -11,89 | 630 | -2,63 | ||||
| 2026-02-13 | 13F | Rafferty Asset Management, LLC | 23.963 | -2,96 | 1.785 | 7,14 | ||||
| 2025-11-14 | 13F | Wetherby Asset Management Inc | 3.338 | 0,72 | 225 | 4,65 | ||||
| 2026-02-02 | 13F | Equitable Trust Co | 3.044 | 0,00 | 227 | 10,24 | ||||
| 2026-02-11 | 13F | CLARET ASSET MANAGEMENT Corp | 3.520 | -0,23 | 0 | |||||
| 2025-09-29 | NP | OCFS - Otter Creek Focus Strategy ETF | 5.407 | 361 | ||||||
| 2026-01-21 | 13F | Hunter Associates Investment Management Llc | 22.944 | -1,72 | 2 | 0,00 | ||||
| 2026-02-10 | 13F | Anchor Capital Advisors Llc | 14.660 | 0,00 | 1.092 | 10,41 | ||||
| 2026-02-13 | 13F | Landscape Capital Management, L.l.c. | 0 | -100,00 | 0 | |||||
| 2026-01-30 | 13F | Keybank National Association/oh | 4.400 | 7,40 | 328 | 18,48 | ||||
| 2026-02-12 | 13F | Hm Payson & Co | 8.353 | -20,31 | 622 | -12,02 | ||||
| 2026-01-09 | 13F | Bdf-gestion | 0 | -100,00 | 0 | |||||
| 2025-10-17 | 13F | MPS Loria Financial Planners, LLC | 0 | -100,00 | 0 | |||||
| 2026-02-12 | 13F | Loomis Sayles & Co L P | 490 | -3,54 | 36 | 5,88 | ||||
| 2026-01-16 | 13F | Ronald Blue Trust, Inc. | 8.702 | -2,88 | 648 | 7,28 | ||||
| 2025-09-29 | NP | COWZ - Pacer US Cash Cows 100 ETF | 1.023.836 | -18,42 | 68.413 | -6,34 | ||||
| 2026-01-15 | 13F | Retirement Systems of Alabama | 364.233 | -47,75 | 27.132 | -42,33 | ||||
| 2026-01-23 | 13F | Robeco Institutional Asset Management B.V. | 11.563 | -57,43 | 861 | -53,03 | ||||
| 2026-02-17 | 13F | Integral Health Asset Management, LLC | 0 | -100,00 | 0 | -100,00 | ||||
| 2026-01-22 | 13F | Hager Investment Management Services, Llc | 135 | 0,00 | 10 | 11,11 | ||||
| 2026-02-05 | 13F | Stephens Investment Management Group LLC | 0 | -100,00 | 0 | -100,00 | ||||
| 2025-09-29 | NP | LGDX - Intech S&P Large Cap Diversified Alpha ETF | 424 | 27,71 | 28 | 47,37 | ||||
| 2026-02-04 | 13F | Swiss Life Asset Management Ltd | 50.340 | -7,75 | 3.750 | 1,82 | ||||
| 2026-01-22 | 13F | V-Square Quantitative Management LLC | 7.843 | 584 | ||||||
| 2026-01-30 | 13F | R Squared Ltd | 15.524 | 62,16 | 1.156 | 78,95 | ||||
| 2026-02-10 | 13F | Rothschild Investment Llc | 75 | 36,36 | 6 | 66,67 | ||||
| 2026-02-10 | 13F | Eurizon Capital SGR S.p.A. | 200.562 | 14.940 | ||||||
| 2026-02-17 | 13F | Farringdon Capital, Ltd. | 8.095 | 603 | ||||||
| 2026-01-09 | 13F | Pacifica Partners Inc. | 0 | -100,00 | 0 | |||||
| 2026-02-17 | 13F | Omni Event Management Ltd | 727.335 | 54.179 | ||||||
| 2026-02-13 | 13F | Smartleaf Asset Management LLC | 448 | -9,31 | 33 | 0,00 | ||||
| 2026-02-12 | 13F | Federated Hermes, Inc. | 4.831 | -35,34 | 360 | -28,77 | ||||
| 2026-02-17 | 13F | Fort Baker Capital Management LP | 279.139 | 20.793 | ||||||
| 2026-02-02 | 13F | Oppenheimer Asset Management Inc. | 0 | -100,00 | 0 | -100,00 | ||||
| 2026-02-17 | 13F | Lighthouse Investment Partners, LLC | 58.311 | 575,36 | 4.344 | 646,22 | ||||
| 2026-01-23 | 13F | Private Wealth Management Group, LLC | 11 | 0,00 | 1 | |||||
| 2026-02-18 | 13F/A | Fuller & Thaler Asset Management, Inc. | 96.867 | 52,95 | 7.216 | 68,81 | ||||
| 2026-02-17 | 13F | Norinchukin Bank, The | 13.713 | 7,32 | 1.021 | 18,45 | ||||
| 2025-11-12 | 13F | Claro Advisors LLC | 0 | -100,00 | 0 | |||||
| 2026-02-13 | 13F | MAI Capital Management | 5.963 | -0,25 | 444 | 10,17 | ||||
| 2026-02-13 | 13F | Maven Securities LTD | Call | 0 | -100,00 | 0 | -100,00 | |||
| 2026-02-13 | 13F | Walleye Capital LLC | Put | 400 | -86,67 | 30 | -85,64 | |||
| 2026-01-23 | 13F | Optima Capital Llc | 39 | 3 | ||||||
| 2026-02-02 | 13F | CX Institutional | 3.616 | 4,96 | 0 | |||||
| 2026-02-13 | 13F | Walleye Capital LLC | 20.002 | 1.490 | ||||||
| 2026-02-24 | 13F | Bell Investment Advisors, Inc | 305 | -7,58 | 23 | 0,00 | ||||
| 2026-02-13 | 13F | Walleye Capital LLC | Call | 8.100 | -59,90 | 603 | -55,76 | |||
| 2026-01-20 | 13F | Trust Co Of Toledo Na /oh/ | 203 | 0,00 | 15 | 15,38 | ||||
| 2026-02-12 | 13F | BlackRock, Inc. | 22.098.417 | 13,83 | 1.646.111 | 25,64 | ||||
| 2025-11-20 | 13F | Maven Securities LTD | Put | 0 | -100,00 | 0 | -100,00 | |||
| 2026-01-29 | 13F | UMA Financial Services, Inc. | 127 | 11,40 | 9 | 28,57 | ||||
| 2025-11-06 | 13F | CBIZ Investment Advisory Services, LLC | 0 | -100,00 | 0 | |||||
| 2026-02-10 | 13F | Axq Capital, Lp | 0 | -100,00 | 0 | -100,00 | ||||
| 2026-02-13 | 13F | Aigen Investment Management, Lp | 0 | -100,00 | 0 | |||||
| 2026-01-21 | 13F | Azzad Asset Management Inc /adv | 0 | -100,00 | 0 | -100,00 | ||||
| 2026-02-17 | 13F | Two Sigma Investments, Lp | 85.204 | 24,88 | 6.347 | 37,84 | ||||
| 2025-11-13 | 13F | Eisler Capital Management Ltd. | 3.239 | 218 | ||||||
| 2026-02-06 | 13F | IFP Advisors, Inc | 191 | 198,44 | 14 | 250,00 | ||||
| 2026-02-13 | 13F | Public Sector Pension Investment Board | 0 | -100,00 | 0 | |||||
| 2026-02-04 | 13F | ABN AMRO Bank N.V. | 2.957 | -98,29 | 220 | -98,12 | ||||
| 2026-01-23 | 13F | Northland Securities, Inc. | 2.800 | 209 | ||||||
| 2026-02-04 | 13F | Paradigm Asset Management Co Llc | 18.600 | -3,63 | 1.386 | 6,37 | ||||
| 2026-02-09 | 13F | Key FInancial Inc | 864 | -18,80 | 64 | -9,86 | ||||
| 2026-02-13 | 13F | Wilkerson Advisory Group LLC | 3.466 | 258 | ||||||
| 2026-02-06 | 13F | Resona Asset Management Co.,Ltd. | 105.880 | -5,80 | 7.887 | 4,04 | ||||
| 2026-02-04 | 13F | Tsfg, Llc | 572 | 0,00 | 0 | |||||
| 2026-01-27 | 13F | Proffitt & Goodson Inc | 0 | -100,00 | 0 | |||||
| 2026-02-02 | 13F | Danske Bank A/s | 154.991 | -8,53 | 11.545 | 0,96 | ||||
| 2026-02-13 | 13F | AlTi Global, Inc. | 0 | -100,00 | 0 | |||||
| 2026-02-10 | 13F | Savant Capital, LLC | 13.866 | 1,36 | 1.033 | 11,81 | ||||
| 2026-02-13 | 13F | Citigroup Inc | 394.929 | -65,26 | 29.418 | -61,65 | ||||
| 2026-02-17 | 13F | Sandler Capital Management | 68.864 | -16,67 | 5.130 | -8,03 | ||||
| 2026-02-10 | 13F | Mutual Of America Capital Management Llc | 23.959 | -0,85 | 1.785 | 9,45 | ||||
| 2026-01-16 | 13F | Marquette Asset Management, LLC | 63 | 215,00 | 5 | 300,00 | ||||
| 2026-02-05 | 13F | AlphaCore Capital LLC | 15.895 | 1.184 | ||||||
| 2026-02-11 | 13F | West Family Investments, Inc. | 2.916 | -14,08 | 217 | -5,24 | ||||
| 2026-02-13 | 13F | Neuberger Berman Group LLC | 941.497 | 3.089,68 | 70.132 | 3.420,68 | ||||
| 2026-01-14 | 13F | Spire Wealth Management | 85 | 2,41 | 6 | 20,00 | ||||
| 2026-02-13 | 13F | Toroso Investments, LLC | 16.913 | -48,68 | 1.260 | -43,39 | ||||
| 2026-02-14 | 13F | Rockefeller Capital Management L.P. | 6.594 | 0,05 | 491 | 10,59 | ||||
| 2026-02-11 | 13F | SOUTH STATE Corp | 28 | 0,00 | 2 | 100,00 | ||||
| 2026-01-23 | 13F | Halbert Hargrove Global Advisors, Llc | 0 | -100,00 | 0 | |||||
| 2026-02-03 | 13F | Mitsubishi UFJ Kokusai Asset Management Co., Ltd. | 465.048 | 2,98 | 34.674 | 13,77 | ||||
| 2026-02-10 | 13F | Root Financial Partners, LLC | 416 | 5,32 | 31 | 15,38 | ||||
| 2026-02-12 | 13F | Athos Capital Ltd | 170.000 | 13 | ||||||
| 2026-02-06 | 13F | Great Diamond Partners, LLC | 4.998 | -18,04 | 372 | -9,49 | ||||
| 2026-02-17 | 13F | Clear Street Markets Llc | 331 | -76,08 | 25 | -74,19 | ||||
| 2026-02-17 | 13F | Man Group plc | 668.695 | 898,01 | 49.811 | 1.001,53 | ||||
| 2026-01-12 | 13F | Avanza Fonder AB | 24.574 | 0,00 | 1.831 | 10,37 | ||||
| 2026-01-16 | 13F | Tema Etfs Llc | 3.313 | -0,24 | 247 | 9,82 | ||||
| 2026-01-27 | 13F | First Horizon Corp | 394 | 23,51 | 29 | 38,10 | ||||
| 2026-02-18 | 13F | EP Wealth Advisors, Inc. | 17.764 | 58,00 | 1.323 | 80,74 | ||||
| 2025-10-15 | 13F | Atwood & Palmer Inc | 0 | -100,00 | 0 | |||||
| 2026-02-17 | 13F | Susquehanna International Group, Llp | Put | 17.500 | -95,26 | 1.304 | -94,77 | |||
| 2026-01-12 | 13F | Pensionfund Sabic | 18.800 | 0,00 | 1 | 0,00 | ||||
| 2026-02-17 | 13F | Susquehanna International Group, Llp | Call | 35.500 | -90,36 | 2.644 | -89,36 | |||
| 2026-02-18 | 13F | Mackenzie Financial Corp | 1.016.337 | -0,88 | 75.609 | 9,25 | ||||
| 2026-02-17 | 13F | Susquehanna International Group, Llp | 75.010 | -29,16 | 5.587 | -21,81 | ||||
| 2026-03-17 | 13F | Stance Capital Llc | 0 | -100,00 | 0 | |||||
| 2026-02-06 | 13F | One Charles Private Wealth Services, LLC | 5.670 | -0,18 | 422 | 10,18 | ||||
| 2026-01-16 | 13F | Formidable Asset Management, LLC | 0 | -100,00 | 0 | |||||
| 2025-09-29 | NP | PTLC - Pacer Trendpilot US Large Cap ETF | 13.906 | -12,75 | 929 | -19,15 | ||||
| 2025-09-29 | NP | QDPL - Pacer Metaurus US Large Cap Dividend Multiplier 400 ETF | 4.053 | 13,47 | 271 | 30,43 | ||||
| 2025-09-29 | NP | PBP - Invesco S&P 500 BuyWrite ETF This fund is a listed as child fund of Invesco Ltd. and if that institution has disclosed ownership in this security, then these positions will not be double counted when calculating total shares and total value | 1.191 | 75,66 | 80 | 102,56 | ||||
| 2026-01-09 | 13F | Assenagon Asset Management S.A. | 666.053 | 275,18 | 49.614 | 314,11 | ||||
| 2026-02-17 | 13F | PenderFund Capital Management Ltd. | 4.400 | 528,57 | 328 | 595,74 | ||||
| 2026-02-03 | 13F | LaFleur & Godfrey LLC | 95.362 | -12,74 | 7.104 | -3,69 | ||||
| 2026-02-17 | 13F | Guggenheim Capital Llc | 7.392 | 19,36 | 551 | 31,89 | ||||
| 2026-02-10 | 13F | Kentucky Retirement Systems | 14.005 | 0,00 | 1.043 | 10,37 | ||||
| 2026-02-13 | 13F | Edgestream Partners, L.P. | 0 | -100,00 | 0 | |||||
| 2026-02-17 | 13F | Maryland State Retirement & Pension System | 10.688 | 0,00 | 796 | 10,40 | ||||
| 2026-02-05 | 13F | Northwestern Mutual Investment Management Company, Llc | 7.112 | 0,34 | 530 | 10,67 | ||||
| 2026-02-19 | 13F | Invesco Ltd. | 3.591.531 | -49,43 | 267.533 | -44,18 | ||||
| 2026-02-10 | 13F | Triodos Investment Management BV | 62.750 | 0,00 | 4.677 | 10,52 | ||||
| 2026-02-05 | 13F | AustralianSuper Pty Ltd | 82.361 | 0,00 | 6.135 | 10,38 | ||||
| 2026-02-10 | 13F | Bnp Paribas Arbitrage, Sa | Call | 0 | -100,00 | 0 | -100,00 | |||
| 2026-02-11 | 13F | Meeder Advisory Services, Inc. | 4.226 | 31,57 | 315 | 45,37 | ||||
| 2026-02-17 | 13F | Integrated Advisors Network LLC | 5.091 | -4,86 | 379 | 4,99 | ||||
| 2026-02-17 | 13F | Pentwater Capital Management LP | 4.247.500 | 316.396 | ||||||
| 2026-02-12 | 13F | Boussard & Gavaudan Investment Management LLP | 117.910 | 8.789 | ||||||
| 2026-02-13 | 13F | Public Employees Retirement Association Of Colorado | 21.399 | -92,12 | 2 | -94,44 | ||||
| 2026-01-23 | 13F | State of Alaska, Department of Revenue | 164.366 | -1,30 | 12 | 9,09 | ||||
| 2026-02-13 | 13F | Fifth Lane Capital, Lp | Put | 30.200 | 2.250 | |||||
| 2026-02-13 | 13F | Fifth Lane Capital, Lp | Call | 55.000 | 4.097 | |||||
| 2025-10-10 | 13F | Corsicana & Co. | 0 | -100,00 | 0 | |||||
| 2026-02-13 | 13F | Fifth Lane Capital, Lp | 32.500 | 983,33 | 2.421 | 1.098,02 | ||||
| 2026-01-14 | 13F | Exchange Traded Concepts, Llc | 13.488 | -46,48 | 1.005 | -40,94 | ||||
| 2026-02-11 | 13F | Picton Mahoney Asset Management | 501.214 | 3.580.000,00 | 37.335 | |||||
| 2025-10-24 | 13F | Hemington Wealth Management | 313 | 47,64 | 0 | |||||
| 2026-02-17 | 13F | one8zero8, LLC | 0 | -100,00 | 0 | |||||
| 2026-02-18 | 13F | State of Tennessee, Treasury Department | 27.878 | -2,62 | 2.089 | 8,07 | ||||
| 2026-02-17 | 13F | Vinva Investment Management Ltd | 165.362 | 1.044,45 | 12.326 | 1.170,72 | ||||
| 2026-02-05 | 13F | Stephens Inc /ar/ | 0 | -100,00 | 0 | -100,00 | ||||
| 2026-02-11 | 13F | LPL Financial LLC | 227.143 | -22,79 | 16.920 | -14,78 | ||||
| 2026-02-17 | 13F | Woodline Partners LP | 997.890 | 8,42 | 74.333 | 19,66 | ||||
| 2026-01-29 | 13F | Vanguard Group Inc | 26.089.403 | -0,47 | 1.943.400 | 9,85 | ||||
| 2026-02-17 | 13F | Raymond James Financial Inc | 436.275 | -22,11 | 32.498 | -14,02 | ||||
| 2026-02-23 | 13F | Virtu Financial LLC | 22.750 | 62,43 | 2 | |||||
| 2025-11-04 | 13F | Chung Wu Investment Group, LLC | 0 | -100,00 | 0 | -100,00 | ||||
| 2026-01-08 | 13F | NorthCrest Asset Manangement, LLC | 7.090 | 3,28 | 530 | 14,01 | ||||
| 2026-02-06 | 13F | ProShare Advisors LLC | 47.161 | 18,18 | 3.513 | 30,45 | ||||
| 2026-02-10 | 13F | Norges Bank | 3.816.001 | 284.254 | ||||||
| 2026-01-28 | 13F | Universal- Beteiligungs- und Servicegesellschaft mbH | 188.703 | -41,00 | 14.063 | -34,86 | ||||
| 2026-02-17 | 13F | Equitec Proprietary Markets, Llc | 62.300 | 4.641 | ||||||
| 2026-02-13 | 13F | Kilter Group LLC | 22 | 175,00 | 2 | |||||
| 2026-02-17 | 13F | Equitec Proprietary Markets, Llc | Call | 1.300 | 97 | |||||
| 2026-02-17 | 13F | Equitec Proprietary Markets, Llc | Put | 96.700 | 7.203 | |||||
| 2026-02-13 | 13F | Dai-Ichi Life Insurance Company, Ltd | 9.299 | 0,00 | 693 | 10,37 | ||||
| 2026-01-29 | 13F | Prentiss Smith & Co Inc | 32.160 | -0,44 | 2.396 | 9,86 | ||||
| 2026-02-06 | 13F | Handelsbanken Fonder AB | 103.457 | -23,22 | 8 | -22,22 | ||||
| 2026-02-11 | 13F | Metis Global Partners, LLC | 12.515 | 66,82 | 932 | 84,19 | ||||
| 2026-02-17 | 13F | Glenmede Trust Co Na | 4.704 | 22,88 | 350 | 48,31 | ||||
| 2026-01-30 | 13F | Citizens Financial Group Inc/ri | 4.434 | -10,50 | 330 | -1,20 | ||||
| 2026-02-03 | 13F | Generali Asset Management SPA SGR | 24.987 | 5,09 | 1.861 | 16,02 | ||||
| 2026-02-13 | 13F | Barclays Plc | Call | 0 | -100,00 | 0 | -100,00 | |||
| 2026-02-13 | 13F | Motiv8 Investments LLC | 10 | 0 | ||||||
| 2026-02-13 | 13F | Kempen Capital Management N.v. | 0 | -100,00 | 0 | |||||
| 2026-02-17 | 13F | Shay Capital LLC | 0 | -100,00 | 0 | -100,00 | ||||
| 2026-01-14 | 13F | Eastern Bank | 0 | -100,00 | 0 | |||||
| 2026-02-17 | 13F | FIL Ltd | 5.227.433 | 10.317,78 | 389.391 | 11.400,03 | ||||
| 2025-11-07 | 13F | Sierra Ocean, Llc | 0 | -100,00 | 0 | -100,00 | ||||
| 2026-02-11 | 13F | Jpmorgan Chase & Co | 1.683.290 | 51,92 | 125.388 | 67,67 | ||||
| 2026-02-12 | 13F/A | Pinebridge Investments Llc | 9.195 | 685 | ||||||
| 2026-02-12 | 13F | Campbell & CO Investment Adviser LLC | 0 | -100,00 | 0 | |||||
| 2025-11-14 | 13F | PineBridge Investments, L.P. | 7.342 | -77,32 | 496 | -76,53 | ||||
| 2026-02-12 | 13F | Xponance, Inc. | 51.645 | 41,48 | 3.847 | 56,19 | ||||
| 2026-02-17 | 13F | Millennium Management Llc | Put | 0 | -100,00 | 0 | ||||
| 2026-02-13 | 13F | Yakira Capital Management, Inc. | 103.172 | 7.685 | ||||||
| 2026-02-13 | 13F | Y-Intercept (Hong Kong) Ltd | 32.818 | 2.445 | ||||||
| 2026-02-17 | 13F | Millennium Management Llc | Call | 0 | -100,00 | 0 | ||||
| 2026-02-13 | 13F | Pinnacle Wealth Planning Services, Inc. | 643 | 48 | ||||||
| 2026-02-04 | 13F | Sentry Investment Management Llc | 617 | 0,00 | 0 | |||||
| 2026-02-05 | 13F | Amalgamated Bank | 41.537 | -1,62 | 3 | 50,00 | ||||
| 2026-02-17 | 13F | Jain Global LLC | 22.830 | 1.701 | ||||||
| 2026-02-11 | 13F | Arrowpoint Investment Partners (Singapore) Pte. Ltd. | 0 | -100,00 | 0 | |||||
| 2026-02-14 | 13F | Whipplewood Advisors, LLC | 11 | 1 | ||||||
| 2026-02-12 | 13F | Cibc World Markets Corp | 30.955 | 10,14 | 2.306 | 25,89 | ||||
| 2026-02-10 | 13F | State of Wyoming | 0 | -100,00 | 0 | |||||
| 2026-02-17 | 13F | Cetera Investment Advisers | 22.537 | -5,21 | 1.679 | 4,61 | ||||
| 2026-02-12 | 13F | Steward Partners Investment Advisory, Llc | 4.152 | -22,60 | 309 | -14,64 | ||||
| 2025-11-13 | 13F | Crewe Advisors LLC | 0 | -100,00 | 0 | |||||
| 2026-02-13 | 13F | Seneschal Advisors, LLC | 5 | 0,00 | 0 | |||||
| 2025-11-17 | 13F | LGT Financial Advisors LLC | 0 | -100,00 | 0 | |||||
| 2026-02-04 | 13F | Hartford Investment Management Co | 12.891 | -1,17 | 960 | 9,09 | ||||
| 2026-02-17 | 13F | Highland Capital Management Fund Advisors, L.p. | 859.040 | 63.990 | ||||||
| 2025-11-14 | 13F | AXA Investment Managers S.A. | 69.967 | 4.722 | ||||||
| 2026-02-06 | 13F | Covestor Ltd | 695 | -42,42 | 0 | |||||
| 2026-01-07 | 13F | Massmutual Trust Co Fsb/adv | 1.996 | -0,10 | 149 | 10,45 | ||||
| 2025-10-22 | 13F | Geneos Wealth Management Inc. | 0 | -100,00 | 0 | -100,00 | ||||
| 2026-02-17 | 13F | Sand Grove Capital Management LLP | 377.962 | 28.154 | ||||||
| 2026-02-13 | 13F | State Street Corp | 9.875.663 | -1,01 | 735.638 | 9,25 | ||||
| 2026-02-06 | 13F | Tortoise Investment Management, LLC | 0 | -100,00 | 0 | -100,00 | ||||
| 2026-01-21 | 13F | Sound Income Strategies, LLC | 846 | 0,95 | 63 | 10,53 | ||||
| 2026-02-17 | 13F | XTX Topco Ltd | 0 | -100,00 | 0 | |||||
| 2026-03-23 | 13F/A | Barclays Plc | Put | 0 | -100,00 | 0 | ||||
| 2026-02-09 | 13F | Atlantic Trust, LLC | 126 | 1.700,00 | 9 | |||||
| 2026-02-10 | 13F | Bnp Paribas Arbitrage, Sa | 352.906 | 12,94 | 26.288 | 24,65 | ||||
| 2026-02-17 | 13F | Boothbay Fund Management, Llc | 74.098 | 1.056,16 | 5.520 | 1.177,55 | ||||
| 2026-01-22 | 13F | Financial Consulate, Inc | 300 | 0,00 | 22 | 10,00 | ||||
| 2026-01-28 | 13F | Davis Capital Management | 3 | 0,00 | 0 | |||||
| 2026-01-29 | 13F | Nbc Securities, Inc. | 75 | 0,00 | 6 | 0,00 | ||||
| 2026-02-17 | 13F | Credit Agricole S A | 78.157 | 18,08 | 5.822 | 30,31 | ||||
| 2026-01-05 | 13F | GAMMA Investing LLC | 14.506 | 47,64 | 1.081 | 62,90 | ||||
| 2026-02-13 | 13F | Chevy Chase Trust Holdings, Inc. | 112.841 | -0,59 | 8.406 | 9,73 | ||||
| 2026-02-03 | 13F | Ethic Inc. | 21.168 | -3,68 | 1.577 | 6,27 | ||||
| 2026-02-02 | 13F | JDM Financial Group LLC | 65 | 0,00 | 5 | 0,00 | ||||
| 2026-01-29 | 13F | Inscription Capital, LLC | 7.784 | 1,05 | 580 | 11,56 | ||||
| 2026-02-17 | 13F | Mirabella Financial Services Llp | 7.512 | 560 | ||||||
| 2026-02-04 | 13F | Nicholas Company, Inc. | 168.385 | -0,04 | 12.543 | 10,33 | ||||
| 2026-02-13 | 13F | Glazer Capital, Llc | 368.378 | 27 | ||||||
| 2026-02-17 | 13F | Css Llc/il | Put | 24.600 | 1.832 | |||||
| 2026-02-17 | 13F | Css Llc/il | 15.673 | 134,52 | 1.167 | 158,76 | ||||
| 2026-02-17 | 13F | Advisor Group Holdings, Inc. | 12.565 | -43,90 | 936 | -37,81 | ||||
| 2026-02-17 | 13F | Varenne Capital Partners | 29.116 | 2.170 | ||||||
| 2026-02-11 | 13F | Highbridge Capital Management Llc | 611.860 | 45.577 | ||||||
| 2026-01-23 | 13F | Capital Investment Counsel, Inc | 4.876 | 5,11 | 363 | 15,97 | ||||
| 2026-01-05 | 13F | Park Avenue Securities Llc | 3.314 | -45,85 | 0 | |||||
| 2026-02-13 | 13F | Police & Firemen's Retirement System of New Jersey | 33.927 | -5,49 | 2.527 | 4,34 | ||||
| 2025-11-21 | 13F/A | CIBC Bancorp USA Inc. | 30.702 | 2.072 | ||||||
| 2026-01-14 | 13F | Jfs Wealth Advisors, Llc | 74 | 7,25 | 6 | 25,00 | ||||
| 2025-09-29 | NP | CATH - Global X S&P 500 Catholic Values ETF This fund is a listed as child fund of Mirae Asset Global Investments Co., Ltd. and if that institution has disclosed ownership in this security, then these positions will not be double counted when calculating total shares and total value | 10.437 | -14,13 | 697 | -1,41 | ||||
| 2026-02-12 | 13F | APG Asset Management N.V. | 160.293 | -8,30 | 10.167 | 1,25 | ||||
| 2026-02-11 | 13F | Ovata Capital Management Ltd | 0 | -100,00 | 0 | |||||
| 2026-02-23 | 13F | Mv Capital Management, Inc. | 67 | 11,67 | 5 | 33,33 | ||||
| 2026-02-10 | 13F | Lido Advisors, LLC | 19.447 | 2,93 | 1.317 | 3,22 | ||||
| 2026-01-20 | 13F | AdvisorNet Financial, Inc | 26 | 62,50 | 2 | 0,00 | ||||
| 2026-01-30 | 13F | State of New Jersey Common Pension Fund D | 71.127 | -3,91 | 5.298 | 6,07 | ||||
| 2026-02-13 | 13F | Prospector Partners Llc | 0 | -100,00 | 0 | |||||
| 2026-02-09 | 13F | Avalon Trust Co | 1.724 | 0,00 | 128 | 10,34 | ||||
| 2026-01-15 | 13F | Nisa Investment Advisors, Llc | 32.806 | -27,42 | 2.444 | -19,90 | ||||
| 2026-02-03 | 13F | McIlrath & Eck, LLC | 69 | 0,00 | 5 | 25,00 | ||||
| 2025-11-14 | 13F | Financial Network Wealth Management LLC | 0 | -100,00 | 0 | |||||
| 2026-02-13 | 13F | Squarepoint Ops LLC | 1.034.067 | 17.329,07 | 77.028 | 19.156,75 | ||||
| 2026-03-04 | 13F | SHP Wealth Management | 778 | 58 | ||||||
| 2026-02-11 | 13F | Zions Bancorporation, National Association /ut/ | 487 | 4,28 | 36 | 16,13 | ||||
| 2026-01-21 | 13F | SJS Investment Consulting Inc. | 484 | 3,42 | 36 | 16,13 | ||||
| 2026-02-09 | 13F | Smithfield Trust Co | 250 | 0,00 | 0 | |||||
| 2026-01-15 | 13F | Allspring Global Investments Holdings, LLC | 10.210 | -99,52 | 761 | -99,47 | ||||
| 2026-02-11 | 13F | Allianz Asset Management GmbH | 4.338 | -93,09 | 323 | -92,38 | ||||
| 2026-02-17 | 13F | Jump Financial, LLC | 17.774 | 367,00 | 1.324 | 416,80 | ||||
| 2026-02-02 | 13F | Fifth Third Bancorp | 24.250 | -6,45 | 1.806 | 3,26 | ||||
| 2026-02-11 | 13F | Parallel Advisors, LLC | 3.612 | 22,44 | 269 | 35,18 | ||||
| 2026-02-13 | 13F | Transamerica Financial Advisors, Inc. | 39 | 3 | ||||||
| 2026-02-05 | 13F | Financial Security Advisor, Inc. | 3.311 | -23,74 | 247 | -16,04 | ||||
| 2026-02-10 | 13F | Murphy & Mullick Capital Management Corp | 1 | 0 | ||||||
| 2026-01-30 | 13F | Us Bancorp \de\ | 13.181 | -39,17 | 982 | -32,90 | ||||
| 2026-01-21 | 13F | Ledyard National Bank | 3.109 | -0,64 | 232 | 9,48 | ||||
| 2026-02-13 | 13F | Bridgewater Associates, LP | 13.448 | -42,95 | 1.002 | -37,04 | ||||
| 2026-02-06 | 13F | Vestmark Advisory Solutions, Inc. | 3.211 | 2,20 | 239 | 12,74 | ||||
| 2026-02-12 | 13F | New South Capital Management Inc | 161.176 | -0,43 | 12.006 | 9,90 | ||||
| 2026-02-17 | 13F | Tudor Investment Corp Et Al | 1.609.400 | 634,16 | 119.884 | 710,30 | ||||
| 2026-01-29 | 13F | Munich Reinsurance Co Stock Corp in Munich | 4.571 | -92,62 | 341 | -91,87 | ||||
| 2026-02-17 | 13F | Creative Planning | 100.956 | 21,41 | 7.520 | 34,02 | ||||
| 2026-01-23 | 13F | Assetmark, Inc | 951 | -61,82 | 71 | -58,33 | ||||
| 2026-01-16 | 13F | Louisiana State Employees Retirement System | 11.400 | -2,56 | 849 | 7,60 | ||||
| 2026-02-12 | 13F | Davis R M Inc | 4.415 | -7,44 | 329 | 2,18 | ||||
| 2026-02-13 | 13F | Vivaldi Asset Management, LLC | 309.557 | 23.059 | ||||||
| 2026-02-12 | 13F | UniSuper Management Pty Ltd | 30.919 | -20,68 | 2.303 | -12,43 | ||||
| 2026-02-17 | 13F | Northern Trust Corp | 2.720.773 | -2,69 | 202.670 | 7,40 | ||||
| 2025-11-14 | 13F | PFM Health Sciences, LP | 0 | -100,00 | 0 | |||||
| 2026-01-16 | 13F | PFS Partners, LLC | 51 | 0,00 | 4 | 0,00 | ||||
| 2025-09-29 | NP | XRMI - Global X S&P 500 Risk Managed Income ETF This fund is a listed as child fund of Mirae Asset Global Investments Co., Ltd. and if that institution has disclosed ownership in this security, then these positions will not be double counted when calculating total shares and total value | 186 | -25,60 | 12 | -14,29 | ||||
| 2026-01-13 | 13F | Stephens Consulting, LLC | 2 | 0 | ||||||
| 2026-02-17 | 13F | Nissay Asset Management Corp /japan/ /adv | 28.727 | 0,02 | 2.140 | 10,37 | ||||
| 2026-01-23 | 13F | Curbstone Financial Management Corp | 17.546 | -22,35 | 1.307 | -14,30 | ||||
| 2026-01-26 | 13F | Mirae Asset Global Investments Co., Ltd. | 43.158 | 18,43 | 3.215 | 30,70 | ||||
| 2026-02-17 | 13F | TIG Advisors, LLC | 1.194.808 | 5.094,82 | 89.001 | 5.634,60 | ||||
| 2026-02-10 | 13F | Railway Pension Investments Ltd | 157.200 | 0,00 | 11.710 | 10,37 | ||||
| 2026-02-17 | 13F | Aristeia Capital Llc | 0 | -100,00 | 0 | |||||
| 2026-01-20 | 13F | Signaturefd, Llc | 6.004 | 5,26 | 447 | 16,41 | ||||
| 2026-02-12 | 13F | DRW Securities, LLC | 0 | -100,00 | 0 | |||||
| 2026-02-12 | 13F | DRW Securities, LLC | Call | 0 | -100,00 | 0 | ||||
| 2025-09-29 | NP | SPUU - Direxion Daily S&P 500(R) Bull 2X Shares | 698 | 24,20 | 47 | 43,75 | ||||
| 2026-01-12 | 13F | Rialto Wealth Management, LLC | 41 | -10,87 | 3 | 0,00 | ||||
| 2026-01-15 | 13F | Mn Services Vermogensbeheer B.V. | 85.946 | 1,28 | 6 | 20,00 | ||||
| 2025-09-29 | NP | SPXL - Direxion Daily S&P 500(R) Bull 3X Shares | 15.464 | 15,45 | 1.033 | 32,61 | ||||
| 2025-09-29 | NP | SZNE - Pacer CFRA-Stovall Equal Weight Seasonal Rotation ETF | 2.015 | -52,02 | 135 | -60,82 | ||||
| 2026-02-17 | 13F | PharVision Advisers, LLC | 6.803 | 108,43 | 507 | 130,00 | ||||
| 2026-02-17 | 13F | Polymer Capital Management (US) LLC | 3.058 | 228 | ||||||
| 2026-02-17 | 13F | Shapiro Capital Management Llc | 0 | -100,00 | 0 | |||||
| 2026-01-30 | 13F | Trifecta Capital Advisors, LLC | 0 | -100,00 | 0 | |||||
| 2026-02-10 | 13F | Bridges Investment Management Inc | 0 | -100,00 | 0 | -100,00 | ||||
| 2026-02-13 | 13F | Ostrum Asset Management | 9.675 | -24,88 | 721 | -17,15 | ||||
| 2026-02-13 | 13F | Schroder Investment Management Group | 7.929 | -10,93 | 591 | -1,01 | ||||
| 2026-02-17 | 13F | Aqr Capital Management Llc | 606.377 | 71,72 | 45.169 | 89,93 | ||||
| 2026-01-22 | 13F | Massachusetts Financial Services Co /ma/ | 28.319 | -4,41 | 2.109 | 5,50 | ||||
| 2026-01-22 | 13F | Bartlett & Co. Wealth Management Llc | 49 | 0,00 | 4 | 0,00 | ||||
| 2026-02-03 | 13F | Carlson Capital L P | 19.000 | 1.415 | ||||||
| 2025-11-03 | 13F | Pandora Wealth, Inc. | 0 | -100,00 | 0 | |||||
| 2026-02-10 | 13F | Thompson Siegel & Walmsley Llc | 3.531 | 0,00 | 0 | |||||
| 2026-02-17 | 13F | Clear Street Markets Llc | Put | 0 | -100,00 | 0 | ||||
| 2026-02-17 | 13F | Humankind Investments LLC | 0 | -100,00 | 0 | |||||
| 2026-02-12 | 13F | Alps Advisors Inc | 11.338 | -13,23 | 845 | -4,20 | ||||
| 2026-02-17 | 13F | Clear Street Markets Llc | Call | 0 | -100,00 | 0 | ||||
| 2026-02-17 | 13F | Ameriprise Financial Inc | 816.290 | 0,04 | 60.805 | 10,42 | ||||
| 2026-02-10 | 13F | Natixis Advisors, L.p. | 368.967 | -15,63 | 27 | -6,90 | ||||
| 2026-02-13 | 13F | Headlands Technologies LLC | 0 | -100,00 | 0 | |||||
| 2026-01-16 | 13F | Trust Co Of Vermont | 57 | 0,00 | 4 | 33,33 | ||||
| 2026-02-02 | 13F | Cornerstone Planning Group LLC | 57 | 7,55 | 4 | 33,33 | ||||
| 2026-02-17 | 13F | MIRAE ASSET GLOBAL ETFS HOLDINGS Ltd. | 138.744 | 64,15 | 10.335 | 81,19 | ||||
| 2026-02-12 | 13F | Hrt Financial Lp | 33.957 | -89,12 | 3 | -90,48 | ||||
| 2026-02-10 | 13F | Kentucky Retirement Systems Insurance Trust Fund | 5.870 | 0,00 | 437 | 10,35 | ||||
| 2025-11-14 | 13F | Cubist Systematic Strategies, LLC | 46.246 | 3.121 | ||||||
| 2025-09-29 | NP | XYLG - Global X S&P 500 Covered Call & Growth ETF This fund is a listed as child fund of Mirae Asset Global Investments Co., Ltd. and if that institution has disclosed ownership in this security, then these positions will not be double counted when calculating total shares and total value | 217 | -27,18 | 14 | -17,65 | ||||
| 2025-09-29 | NP | XCLR - Global X S&P 500 Collar 95-110 ETF This fund is a listed as child fund of Mirae Asset Global Investments Co., Ltd. and if that institution has disclosed ownership in this security, then these positions will not be double counted when calculating total shares and total value | 13 | 8,33 | 1 | |||||
| 2026-02-10 | 13F | Td Asset Management Inc | 537.152 | -63,82 | 40.012 | -60,07 | ||||
| 2026-02-11 | 13F | Fox Run Management, L.l.c. | 0 | -100,00 | 0 | |||||
| 2026-02-04 | 13F | Securian Asset Management, Inc | 6.000 | -43,71 | 447 | -37,97 | ||||
| 2025-09-29 | NP | KCEVX - Knights of Columbus Long/Short Equity Fund Investor Shares | 15.989 | -60,91 | 1.068 | -55,13 | ||||
| 2026-01-29 | 13F | Sanctuary Advisors, LLC | 24.661 | -6,48 | 1.837 | 3,20 | ||||
| 2026-02-12 | 13F | Brown Brothers Harriman & Co | 6.101 | 30,42 | 454 | 44,13 | ||||
| 2026-02-17 | 13F | Janus Henderson Group Plc | 511.314 | -15,64 | 38.089 | -6,88 | ||||
| 2026-01-15 | 13F | Bernard Wealth Management Corp. | 10 | 0,00 | 1 | |||||
| 2026-02-17 | 13F | Polar Asset Management Partners Inc. | 486.023 | 36.204 | ||||||
| 2026-02-17 | 13F | Polar Asset Management Partners Inc. | Put | 2.900 | 216 | |||||
| 2026-02-17 | 13F | Spears Abacus Advisors LLC | 3.452 | 0,00 | 257 | 10,78 | ||||
| 2026-02-13 | 13F | Quinn Opportunity Partners LLC | 693.600 | 51.666 | ||||||
| 2026-02-13 | 13F | Capula Management Ltd | 196.184 | 14.614 | ||||||
| 2026-02-17 | 13F | Caption Management, LLC | Call | 0 | -100,00 | 0 | ||||
| 2026-01-22 | 13F | Venturi Wealth Management, LLC | 2.973 | 221 | ||||||
| 2026-02-06 | 13F | HighTower Advisors, LLC | 12.894 | -8,31 | 960 | 1,16 | ||||
| 2026-02-11 | 13F | GW&K Investment Management, LLC | 3.058 | 0 | ||||||
| 2025-11-14 | 13F | Texas Permanent School Fund | 0 | -100,00 | 0 | |||||
| 2026-02-13 | 13F | Pathstone Holdings, LLC | 37.137 | -30,98 | 2.766 | -23,82 | ||||
| 2026-02-17 | 13F | Blair William & Co/il | 20.073 | -65,27 | 1.495 | -61,68 | ||||
| 2026-01-28 | 13F | DekaBank Deutsche Girozentrale | 1.475.379 | 0,00 | 124 | 25,51 | ||||
| 2026-01-13 | 13F | Harrington Investments, INC | 13.654 | 0,00 | 1.017 | 10,42 | ||||
| 2026-02-17 | 13F | American Capital Management Inc | 16.280 | -31,54 | 1.213 | -24,44 | ||||
| 2026-02-17 | 13F | Price T Rowe Associates Inc /md/ | 362.673 | 2,60 | 27 | 17,39 | ||||
| 2026-02-12 | 13F | Voya Investment Management Llc | 46.960 | -53,83 | 3.498 | -49,04 | ||||
| 2025-12-18 | 13F | AIA Group Ltd | 0 | -100,00 | 0 | |||||
| 2026-02-05 | 13F | May Hill Capital, LLC | 34.014 | 100,12 | 2.534 | 120,84 | ||||
| 2026-02-12 | 13F | Penserra Capital Management LLC | 15 | 0,00 | 0 | |||||
| 2026-02-17 | 13F | Royal Bank Of Canada | 384.365 | -41,95 | 28.632 | -35,93 | ||||
| 2026-02-17 | 13F | Balyasny Asset Management Llc | 1.608.340 | 32,01 | 119.805 | 45,70 | ||||
| 2026-01-21 | 13F | Flagship Harbor Advisors, Llc | 218 | 16 | ||||||
| 2026-02-13 | 13F | Centiva Capital, LP | Put | 100.000 | 7.449 | |||||
| 2026-02-13 | 13F | Centiva Capital, LP | 115.300 | 8.589 | ||||||
| 2026-02-17 | 13F | Schonfeld Strategic Advisors LLC | 799.388 | 4.855,29 | 59.546 | 5.372,98 | ||||
| 2026-02-13 | 13F | Royal London Asset Management Ltd | 121.861 | -66,19 | 9.077 | -62,69 | ||||
| 2026-02-17 | 13F | Citadel Advisors Llc | Call | 0 | -100,00 | 0 | ||||
| 2026-02-11 | 13F | RWC Asset Management LLP | 0 | -100,00 | 0 | |||||
| 2026-02-02 | 13F | Sachetta, LLC | 72 | 0,00 | 5 | 25,00 | ||||
| 2026-02-10 | 13F | Intech Investment Management Llc | 43.071 | 50,69 | 3.208 | 66,30 | ||||
| 2026-02-05 | 13F | New York Life Investment Management Llc | 98.239 | 223,53 | 7.318 | 257,10 | ||||
| 2026-02-17 | 13F | Private Advisor Group, LLC | 7.030 | -40,45 | 524 | -34,30 | ||||
| 2026-01-23 | 13F | Brown, Lisle/cummings, Inc. | 7 | 0,00 | 1 | |||||
| 2026-02-12 | 13F | Riverwater Partners LLC | 5.202 | -1,85 | 387 | 8,40 | ||||
| 2025-11-14 | 13F | WealthTrak Capital Management LLC | 0 | -100,00 | 0 | |||||
| 2026-01-23 | 13F | Rsm Us Wealth Management Llc | 7.077 | 67,38 | 528 | 84,91 | ||||
| 2026-01-21 | 13F | Modera Wealth Management, LLC | 19.179 | -0,08 | 1.429 | 10,27 | ||||
| 2026-02-17 | 13F | State Of Wisconsin Investment Board | 168.904 | 28,48 | 12.582 | 41,81 | ||||
| 2026-02-09 | 13F | Legal & General Group Plc | 1.313.604 | -30,64 | 97.850 | -23,44 | ||||
| 2026-01-29 | 13F | Teachers Retirement System Of The State Of Kentucky | 18.060 | 0,00 | 1 | 0,00 | ||||
| 2026-02-13 | 13F | Stifel Financial Corp | 14.870 | 2,94 | 1.108 | 13,66 | ||||
| 2026-02-12 | 13F | Wealthspire Advisors, LLC | 0 | -100,00 | 0 | |||||
| 2026-02-04 | 13F | Clark Wealth Partners | 0 | -100,00 | 0 | |||||
| 2026-02-17 | 13F | Voleon Capital Management Lp | 0 | -100,00 | 0 | |||||
| 2026-01-12 | 13F | Abound Wealth Management | 34 | 0,00 | 3 | 0,00 | ||||
| 2026-01-16 | 13F | Standard Life Aberdeen plc | 191.867 | -1,08 | 14.292 | 9,18 | ||||
| 2026-02-17 | 13F | Quantitative Investment Management, LLC | 0 | -100,00 | 0 | |||||
| 2026-02-13 | 13F | National Bank Of Canada /fi/ | 144.810 | 5,23 | 10.787 | 16,14 | ||||
| 2026-02-12 | 13F | Jane Street Group, Llc | 491.915 | -46,63 | 36.643 | -41,10 | ||||
| 2026-02-12 | 13F | Jane Street Group, Llc | Put | 14.500 | 51,04 | 1.080 | 66,92 | |||
| 2026-02-12 | 13F | Jane Street Group, Llc | Call | 2.800 | -95,54 | 209 | -95,09 | |||
| 2026-02-17 | 13F | Perennial Investment Advisors, LLC | 3.479 | -10,57 | 259 | -1,15 | ||||
| 2026-02-13 | 13F | Inspire Advisors, LLC | 7.318 | 545 | ||||||
| 2026-02-09 | 13F/A | Swedbank AB | 567.047 | -4,90 | 42.239 | 4,97 | ||||
| 2026-02-12 | 13F | Bank Of Montreal /can/ | 291.089 | -5,80 | 21.683 | 3,97 | ||||
| 2026-01-28 | 13F | Chicago Partners Investment Group LLC | 5.278 | 23,43 | 396 | 25,32 | ||||
| 2026-02-10 | 13F | Westpac Banking Corp | 0 | -100,00 | 0 | |||||
| 2025-11-14 | 13F | Wolverine Trading, Llc | 6.841 | -71,09 | 459 | -70,16 | ||||
| 2026-01-21 | 13F | Aaron Wealth Advisors LLC | 5.275 | 34,88 | 393 | 49,05 | ||||
| 2026-02-13 | 13F | Baird Financial Group, Inc. | 17.095 | -52,68 | 1.273 | -47,79 | ||||
| 2025-11-14 | 13F | Wolverine Trading, Llc | Call | 21.900 | 226,87 | 1.471 | 237,93 | |||
| 2025-11-14 | 13F | Wolverine Trading, Llc | Put | 13.700 | -13,29 | 920 | -10,52 | |||
| 2026-02-17 | 13F | Freestone Grove Partners LP | 0 | -100,00 | 0 | -100,00 | ||||
| 2026-02-06 | 13F | Banque Cantonale Vaudoise | 6.877 | -3,55 | 512 | |||||
| 2026-02-17 | 13F | Meteora Capital, LLC | 134.196 | 9.996 | ||||||
| 2026-01-08 | 13F | True Wealth Design, LLC | 202 | 169,33 | 15 | 200,00 | ||||
| 2026-02-11 | 13F | First Command Advisory Services, Inc. | 46 | 3 | ||||||
| 2026-02-06 | 13F | Envestnet Portfolio Solutions, Inc. | 0 | -100,00 | 0 | |||||
| 2026-02-11 | 13F | Deseret Mutual Benefit Administrators | 837 | 10,13 | 62 | 21,57 | ||||
| 2026-02-10 | 13F | Sound Shore Management Inc /ct/ | 0 | -100,00 | 0 | |||||
| 2025-11-25 | 13F | Briaud Financial Planning, Inc | 0 | -100,00 | 0 | |||||
| 2026-02-13 | 13F | Black Creek Investment Management Inc. | 0 | -100,00 | 0 | |||||
| 2026-02-17 | 13F | 2Xideas AG | 0 | -100,00 | 0 | |||||
| 2026-02-10 | 13F | Commonwealth Of Pennsylvania Public School Empls Retrmt Sys | 51.770 | -3,07 | 3.856 | 6,99 | ||||
| 2026-01-23 | 13F | Patton Fund Management, Inc. | 2.938 | -22,58 | 219 | -14,84 | ||||
| 2026-02-13 | 13F | L2 Asset Management, LLC | 74.634 | 174,27 | 5.559 | 202,78 | ||||
| 2026-02-13 | 13F | Sei Investments Co | 1.220.536 | -16,22 | 90.918 | -7,53 | ||||
| 2026-01-23 | 13F | Aspect Partners, LLC | 8 | 1 | ||||||
| 2026-02-05 | 13F | Atria Investments Llc | 15.289 | -8,31 | 1.139 | 1,16 | ||||
| 2026-02-03 | 13F | Strengthening Families & Communities, LLC | 0 | -100,00 | 0 | |||||
| 2026-02-05 | 13F | Applied Finance Capital Management, LLC | 0 | -100,00 | 0 | |||||
| 2026-02-11 | 13F | TCTC Holdings, LLC | 158 | 0,00 | 12 | 10,00 | ||||
| 2026-02-12 | 13F | Triumph Capital Management | 9 | 0,00 | 1 | |||||
| 2026-02-13 | 13F | Mml Investors Services, Llc | 13.185 | -40,17 | 982 | -33,96 | ||||
| 2026-01-29 | 13F | IMC-Chicago, LLC | Call | 0 | -100,00 | 0 | -100,00 | |||
| 2026-02-18 | 13F | Achmea Investment Management B.V. | 0 | -100,00 | 0 | |||||
| 2026-02-13 | 13F | Victory Capital Management Inc | 5.609.912 | 2,56 | 417.882 | 13,19 | ||||
| 2026-02-13 | 13F | PCM Encore, LLC | 5.024 | 374 | ||||||
| 2026-02-17 | 13F | Moore Capital Management, Lp | 120.000 | 102,43 | 8.939 | 123,45 | ||||
| 2026-02-02 | 13F | Truist Financial Corp | 37.602 | -55,02 | 2.801 | -50,36 | ||||
| 2026-01-27 | 13F | Forum Financial Management, LP | 5.337 | 2,22 | 398 | 12,78 | ||||
| 2026-01-26 | 13F | BCS Private Wealth Management, Inc. | 6.105 | 2,52 | 455 | 13,22 | ||||
| 2026-02-05 | 13F | Bessemer Group Inc | 9.648 | -28,09 | 1 | |||||
| 2026-02-03 | 13F | Broadwater Capital Management Llc | 234 | 0,00 | 17 | 13,33 | ||||
| 2026-02-13 | 13F | Alberta Investment Management Corp | 688.300 | 51.271 | ||||||
| 2026-02-12 | 13F | Investment Research Partners LLC | 3.002 | 1,94 | 224 | 2,76 | ||||
| 2026-02-13 | 13F | Healthcare Of Ontario Pension Plan Trust Fund | 173.798 | 1.873,86 | 12.946 | 2.079,46 | ||||
| 2026-02-17 | 13F | Utah Retirement Systems | 36.655 | 0,00 | 2.730 | 10,39 | ||||
| 2026-02-12 | 13F | Swiss National Bank | 609.440 | -5,12 | 45.397 | 4,72 | ||||
| 2025-09-29 | NP | KCXIX - Knights of Columbus U.S. All Cap Index Fund I Shares | 999 | 2,57 | 67 | 17,86 | ||||
| 2026-02-17 | 13F | California State Teachers Retirement System | 397.483 | -5,41 | 29.609 | 4,40 | ||||
| 2026-01-12 | 13F | CVA Family Office, LLC | 223 | -3,46 | 17 | 6,67 | ||||
| 2026-01-14 | 13F | Wolff Wiese Magana Llc | 109 | 0,00 | 8 | 14,29 | ||||
| 2026-02-06 | 13F | Creative Financial Designs Inc /adv | 17 | 0,00 | 1 | 0,00 | ||||
| 2026-02-12 | 13F | Cloud Capital Management, LLC | 0 | -100,00 | 0 | |||||
| 2025-11-13 | 13F | Van Eck Associates Corp | 0 | -100,00 | 0 | |||||
| 2026-02-03 | 13F | SBI Securities Co., Ltd. | 40 | 0,00 | 3 | 0,00 | ||||
| 2026-02-04 | 13F | Boston Private Wealth Llc | 4.032 | -35,23 | 300 | -28,57 | ||||
| 2025-11-14 | 13F | Point72 Europe (London) LLP | 1.064 | 72 | ||||||
| 2026-02-12 | 13F | MetLife Investment Management, LLC | 53.360 | -3,32 | 3.975 | 6,68 | ||||
| 2026-02-17 | 13F | Laird Norton Trust Company, Llc | 7.889 | 588 | ||||||
| 2026-01-26 | 13F | KBC Group NV | 199.868 | 455,07 | 15 | 600,00 | ||||
| 2026-02-10 | 13F | United Super Pty Ltd in its capacity as Trustee for the Construction & Building Unions Superannuation Fund | 136.057 | 10.135 | ||||||
| 2026-02-13 | 13F | Becker Capital Management Inc | 55.812 | -31,73 | 4.157 | -24,65 | ||||
| 2026-02-13 | 13F | Gts Securities Llc | 9.617 | 716 | ||||||
| 2026-02-10 | 13F | Bank of New York Mellon Corp | 1.212.363 | -12,82 | 90.309 | -3,77 | ||||
| 2026-02-17 | 13F | Rakuten Investment Management, Inc. | 29.272 | 233,70 | 2.181 | 64,48 | ||||
| 2026-02-12 | 13F | Moneta Group Investment Advisors Llc | 2.942 | 219 | ||||||
| 2026-02-17 | 13F | Caption Management, LLC | 26.137 | -73,81 | 1.947 | -71,11 | ||||
| 2026-02-17 | 13F | Caption Management, LLC | Put | 33.800 | 2.518 | |||||
| 2026-01-26 | 13F | Private Trust Co Na | 309 | -1,59 | 23 | 9,52 | ||||
| 2026-01-30 | 13F/A | M&t Bank Corp | 25.820 | 16,04 | 1.923 | 28,11 | ||||
| 2026-02-03 | 13F | Credit Industriel Et Commercial | 147.250 | 10.969 | ||||||
| 2026-02-13 | 13F | BNP Paribas Asset Management Holding S.A. | 640.183 | -62,15 | 48 | -58,41 | ||||
| 2025-11-10 | 13F | Marshall & Sterling Wealth Advisors Inc. | 0 | -100,00 | 0 | -100,00 | ||||
| 2026-02-17 | 13F | SageView Advisory Group, LLC | 1.517 | 113 | ||||||
| 2025-11-13 | 13F | GeoWealth Management, LLC | 0 | -100,00 | 0 | |||||
| 2026-02-12 | 13F | Quadrant Capital Group Llc | 7.639 | 1,15 | 569 | 11,79 | ||||
| 2026-02-13 | 13F | American Century Companies Inc | 878.043 | -52,51 | 65.406 | -47,58 | ||||
| 2026-02-17 | 13F | Cresset Asset Management, LLC | 0 | -100,00 | 0 | -100,00 | ||||
| 2026-02-17 | 13F | Taconic Capital Advisors LP | 0 | -100,00 | 0 | |||||
| 2026-02-13 | 13F | Ossiam | 0 | -100,00 | 0 | |||||
| 2026-02-09 | 13F | Annis Gardner Whiting Capital Advisors, LLC | 153 | 10,87 | 11 | 22,22 | ||||
| 2026-01-09 | 13F | SG Americas Securities, LLC | 421.240 | 405,34 | 31 | 520,00 | ||||
| 2026-02-13 | 13F | Palisade Asset Management, LLC | 0 | -100,00 | 0 | |||||
| 2026-01-30 | 13F | Catalytic Wealth RIA, LLC | 2.721 | -68,54 | 203 | -65,35 | ||||
| 2026-02-11 | 13F | Winton Capital Group Ltd | 253.320 | 18.870 | ||||||
| 2026-01-23 | 13F | Farther Finance Advisors, LLC | 3.255 | 20,02 | 242 | 32,24 | ||||
| 2026-02-17 | 13F | Abel Hall, LLC | 4.125 | 307 | ||||||
| 2026-02-17 | 13F | Engineers Gate Manager LP | 25.192 | -24,78 | 1.877 | -16,99 | ||||
| 2026-02-13 | 13F | Quarry LP | 3.127 | -57,35 | 233 | -53,04 | ||||
| 2026-02-11 | 13F | Empowered Funds, LLC | 33.400 | 142,15 | 2.488 | 167,42 | ||||
| 2026-02-13 | 13F | Alamea Verwaltungs GmbH | 0 | -100,00 | 0 | |||||
| 2026-02-05 | 13F | Baader Bank INC | 6.784 | 14,19 | 505 | 26,25 | ||||
| 2026-01-07 | 13F | Norman Fields, Gottscho Capital Management, LLC | 4.600 | 0,00 | 343 | |||||
| 2026-02-17 | 13F | Prelude Capital Management, Llc | 115.837 | 3.621,07 | 8.629 | 4.008,57 | ||||
| 2025-09-29 | NP | RSP - Invesco S&P 500 Equal Weight ETF This fund is a listed as child fund of Invesco Ltd. and if that institution has disclosed ownership in this security, then these positions will not be double counted when calculating total shares and total value | 2.187.935 | -4,95 | 146.198 | 9,12 | ||||
| 2026-02-12 | 13F | Callan Family Office, LLC | 4.498 | 335 | ||||||
| 2026-02-04 | 13F | Summit Wealth Group Llc / Co | 0 | -100,00 | 0 | |||||
| 2026-02-04 | 13F | Plato Investment Management Ltd | 4.693 | 0,00 | 351 | 11,78 | ||||
| 2026-02-11 | 13F | Vise Technologies, Inc. | 5.096 | 45,43 | 380 | 60,59 | ||||
| 2026-02-17 | 13F | Snowden Capital Advisors LLC | 0 | -100,00 | 0 | -100,00 | ||||
| 2025-09-29 | NP | VSCAX - Invesco Small Cap Value Fund Class A | 2.172.509 | 0,00 | 145.167 | 14,81 | ||||
| 2026-02-17 | 13F | Bridgeway Capital Management Inc | 0 | -100,00 | 0 | -100,00 | ||||
| 2026-02-17 | 13F | NorthRock Partners, LLC | 0 | -100,00 | 0 | |||||
| 2026-01-27 | 13F | Evergreen Capital Management Llc | 7.986 | 97,04 | 595 | 117,58 | ||||
| 2026-02-02 | 13F | Principal Financial Group Inc | 272.971 | 2,38 | 20.334 | 13,00 | ||||
| 2026-02-17 | 13F | Mittelman Wealth Management | 7.389 | -19,99 | 550 | -11,72 | ||||
| 2026-02-17 | 13F | Agf Management Ltd | 40.168 | -17,58 | 2.992 | -9,03 | ||||
| 2025-11-26 | 13F/A | Jpmorgan Chase & Co | Call | 0 | -100,00 | 0 | -100,00 | |||
| 2026-01-08 | 13F | Armstrong Advisory Group, Inc | 150 | 0,00 | 11 | 10,00 | ||||
| 2026-02-12 | 13F | Aviva Plc | 186.902 | 5,36 | 13.922 | 16,29 | ||||
| 2026-02-17 | 13F | Qube Research & Technologies Ltd | 2.115.543 | 77,51 | 157.587 | 95,92 | ||||
| 2025-11-14 | 13F | Ieq Capital, Llc | 0 | -100,00 | 0 | |||||
| 2026-02-03 | 13F/A | Mount Yale Investment Advisors, LLC | 0 | -100,00 | 0 | -100,00 | ||||
| 2026-02-17 | 13F | Evercore Wealth Management, LLC | 3.465 | 0,00 | 258 | 10,73 | ||||
| 2026-02-11 | 13F | Nemes Rush Group LLC | 18 | 1 | ||||||
| 2026-02-17 | 13F | Ameriflex Group, Inc. | 83 | -50,00 | 6 | -45,45 | ||||
| 2026-02-19 | 13F | CI Private Wealth, LLC | 72.061 | 37,14 | 4.887 | 37,82 | ||||
| 2026-02-09 | 13F | Hartland & Co., LLC | 2.218 | 266,01 | 165 | 312,50 | ||||
| 2026-02-13 | 13F | Kennedy Capital Management, Inc. | 57.823 | -22,80 | 4.307 | -14,80 | ||||
| 2026-02-17 | 13F | Governors Lane LP | 253.986 | 18.919 | ||||||
| 2026-02-10 | 13F | CIBC Asset Management Inc | 52.301 | 66,62 | 3.896 | 83,90 | ||||
| 2026-02-10 | 13F | CIBC World Markets Inc. | 3.150 | 235 | ||||||
| 2026-02-17 | 13F | Point72 Asset Management, L.P. | Call | 0 | -100,00 | 0 | ||||
| 2026-02-13 | 13F | First Trust Advisors Lp | 224.235 | 0,22 | 16.703 | 10,62 | ||||
| 2026-02-12 | 13F | BRYN MAWR TRUST Co | 0 | -100,00 | 0 | |||||
| 2026-02-13 | 13F | Resources Investment Advisors, LLC. | 2.692 | -55,90 | 201 | -51,46 | ||||
| 2026-02-18 | 13F | GWM Advisors LLC | 10.830 | -2,03 | 807 | 8,04 | ||||
| 2026-02-13 | 13F | Bank Of Nova Scotia | 94.172 | -19,14 | 7.015 | -10,75 | ||||
| 2025-10-24 | 13F | Meeder Asset Management Inc | 0 | -100,00 | 0 | |||||
| 2026-02-17 | 13F | Bellevue Group AG | 0 | -100,00 | 0 | |||||
| 2026-01-27 | 13F | Gf Fund Management Co. Ltd. | 6.037 | -1,84 | 450 | 8,19 | ||||
| 2026-01-26 | 13F | Pursuit Wealth Management LLC | 9.206 | 686 | ||||||
| 2026-02-10 | 13F | Tidemark, LLC | 1.724 | 0,00 | 128 | 10,34 | ||||
| 2026-02-17 | 13F | Millennium Management Llc | 3.500.016 | 19,93 | 260.716 | 32,36 | ||||
| 2026-01-05 | 13F | Coastline Trust Co | 400 | -70,06 | 30 | -67,78 | ||||
| 2026-02-10 | 13F | Private Wealth Asset Management, LLC | 3 | 0,00 | 0 | |||||
| 2025-11-05 | 13F | SPC Financial, Inc. | 13.108 | 1,94 | 885 | 5,62 | ||||
| 2025-11-14 | 13F | Thematics Asset Management | 466.255 | 0,12 | 31.468 | 3,70 | ||||
| 2026-01-28 | 13F | Arizona State Retirement System | 61.009 | -7,54 | 4.545 | 2,04 | ||||
| 2026-02-17 | 13F | TIG Advisors, LLC | Call | 0 | -100,00 | 0 | ||||
| 2026-02-17 | 13F | Ancora Advisors, LLC | 501 | -33,20 | 37 | -26,00 | ||||
| 2025-11-17 | 13F | Morningstar Investment Management LLC | 0 | -100,00 | 0 | |||||
| 2026-01-26 | 13F | Cwm, Llc | 4.927 | 10,55 | 0 | |||||
| 2026-02-17 | 13F | D. E. Shaw & Co., Inc. | 0 | -100,00 | 0 | |||||
| 2026-02-12 | 13F | Laurel Oak Wealth Management, Llc | 4.209 | 314 | ||||||
| 2026-02-13 | 13F | Westchester Capital Management, LLC | 319.734 | 23.817 | ||||||
| 2026-02-13 | 13F | Umb Bank N A/mo | 640 | 3,23 | 48 | 14,63 | ||||
| 2025-11-12 | 13F | Erste Asset Management GmbH | 0 | -100,00 | 0 | |||||
| 2026-02-23 | 13F | Kera Capital Partners, Inc. | 8.039 | 158,74 | 602 | 188,04 | ||||
| 2025-11-13 | 13F | Total Investment Management Inc | 0 | -100,00 | 0 | |||||
| 2026-02-10 | 13F | Acadian Asset Management Llc | 0 | -100,00 | 0 | |||||
| 2026-01-14 | 13F | Pallas Capital Advisors LLC | 0 | -100,00 | 0 | |||||
| 2026-01-28 | 13F | Salomon & Ludwin, LLC | 101 | 0,00 | 8 | 16,67 | ||||
| 2026-02-17 | 13F | Alliancebernstein L.p. | 1.449.516 | -30,85 | 107.974 | -23,68 | ||||
| 2026-02-10 | 13F | WASHINGTON TRUST Co | 3.712 | -6,73 | 277 | 2,99 | ||||
| 2026-02-17 | 13F | Gotham Asset Management, LLC | 0 | -100,00 | 0 | |||||
| 2026-02-10 | 13F | Connor, Clark & Lunn Investment Management Ltd. | 36.665 | -4,03 | 2.731 | 5,93 | ||||
| 2026-02-17 | 13F | Hbk Investments L P | 8.400.000 | 625.716 | ||||||
| 2026-01-20 | 13F | Harbor Capital Advisors, Inc. | 359 | 0 | ||||||
| 2026-02-12 | 13F | CIBC Private Wealth Group, LLC | 5.505 | -10,62 | 410 | -1,20 | ||||
| 2026-02-05 | 13F | North Dakota State Investment Board | 7.650 | 570 | ||||||
| 2026-02-12 | 13F | Dimensional Fund Advisors Lp | 2.260.052 | -2,07 | 168.352 | 8,09 | ||||
| 2026-02-02 | 13F | Chicago Capital Management, LLC | 85.000 | 4.778 | ||||||
| 2025-11-07 | 13F | Shell Asset Management Co | 5.089 | -33,81 | 0 | |||||
| 2026-01-26 | 13F | Whittier Trust Co Of Nevada Inc | 296 | 0,00 | 22 | 10,00 | ||||
| 2026-01-27 | 13F | Asset Management One Co., Ltd. | 147.996 | -0,28 | 11.027 | 10,09 | ||||
| 2026-02-12 | 13F | Nuveen, LLC | 496.852 | 0,33 | 37.011 | 10,74 | ||||
| 2026-02-13 | 13F | PSquared Asset Management AG | 0 | -100,00 | 0 | |||||
| 2025-11-14 | 13F | Point72 Asia (Singapore) Pte. Ltd. | 11.683 | 789 | ||||||
| 2026-02-06 | 13F | Tredje AP-fonden | 27.098 | 0,00 | 2.019 | 10,39 | ||||
| 2026-02-05 | 13F | Allworth Financial LP | 1.890 | 8,06 | 141 | 18,64 | ||||
| 2026-01-07 | 13F | Tealwood Asset Management Inc | 15.385 | -1,61 | 1 | 0,00 | ||||
| 2026-02-11 | 13F | Winnow Wealth Llc | 1 | -99,74 | 0 | -100,00 | ||||
| 2026-02-17 | 13F | Quantinno Capital Management LP | 574.986 | 162,75 | 42.831 | 190,02 | ||||
| 2026-02-05 | 13F | Leeward Investments, LLC - MA | 0 | -100,00 | 0 | -100,00 | ||||
| 2026-02-13 | 13F | Kayne Anderson Rudnick Investment Management Llc | 21 | 0,00 | 2 | 0,00 | ||||
| 2026-02-13 | 13F | Journey Strategic Wealth Llc | 4.916 | 0,92 | 366 | 11,59 | ||||
| 2026-02-10 | 13F | Hillsdale Investment Management Inc. | 0 | -100,00 | 0 | |||||
| 2026-02-24 | 13F/A | Pacer Advisors, Inc. | 17.508 | -10,29 | 1.304 | -0,99 | ||||
| 2026-02-26 | 13F/A | Alpine Global Management, LLC | 22.500 | 1.676 | ||||||
| 2025-11-14 | 13F | Skopos Labs, Inc. | 0 | -100,00 | 0 | |||||
| 2026-02-09 | 13F | Allstate Corp | 15.976 | 103,23 | 1.190 | 124,53 | ||||
| 2026-02-11 | 13F | Inceptionr Llc | 0 | -100,00 | 0 | |||||
| 2026-02-13 | 13F | Kestra Advisory Services, LLC | 2.946 | 219 | ||||||
| 2026-02-17 | 13F | Fairscale Capital, LLC | 452 | 0,00 | 34 | 10,00 | ||||
| 2026-02-10 | 13F | National Pension Service | 72.883 | 22,90 | 5.429 | 35,66 | ||||
| 2026-02-17 | 13F | Two Sigma Advisers, Lp | 148.500 | 11.062 | ||||||
| 2026-01-30 | 13F | Torren Management, LLC | 33 | 2 | ||||||
| 2026-02-03 | 13F | Grimes & Company, Inc. | 3.214 | 1,20 | 239 | 11,68 | ||||
| 2026-02-12 | 13F | Hollencrest Capital Management | 28 | -78,12 | 2 | -75,00 | ||||
| 2026-02-12 | 13F | Earnest Partners Llc | 1.890.483 | -1,08 | 140.822 | 9,18 | ||||
| 2026-02-13 | 13F | OMERS ADMINISTRATION Corp | 8.556 | 0,00 | 637 | 10,40 | ||||
| 2025-11-14 | 13F | Mbb Public Markets I Llc | 0 | -100,00 | 0 | |||||
| 2026-01-23 | 13F | Ogorek Anthony Joseph /ny/ /adv | 54 | -25,00 | 0 | |||||
| 2026-01-23 | 13F | Webster Bank, N. A. | 5.635 | -0,88 | 420 | 9,40 | ||||
| 2026-01-16 | 13F | DiNuzzo Private Wealth, Inc. | 37 | 48,00 | 3 | 100,00 | ||||
| 2026-02-10 | 13F | Forsta Ap-fonden | 42.400 | 4,95 | 3.158 | 15,85 | ||||
| 2025-09-29 | NP | COWG - Pacer US Large Cap Cash Cows Growth Leaders ETF | 144.618 | 69,73 | 9.663 | 94,90 | ||||
| 2026-03-05 | 13F | Bayban | 37 | 3 | ||||||
| 2026-01-13 | 13F | Mather Group, Llc. | 0 | -100,00 | 0 | -100,00 | ||||
| 2025-10-30 | 13F | Twin Peaks Wealth Advisors, LLC | 0 | -100,00 | 0 | |||||
| 2026-01-16 | 13F | Empirical Financial Services, LLC d.b.a. Empirical Wealth Management | 2.797 | 208 | ||||||
| 2026-02-17 | 13F | ExodusPoint Capital Management, LP | 0 | -100,00 | 0 | -100,00 | ||||
| 2026-02-03 | 13F | Everence Capital Management Inc | 9.530 | 0,00 | 1 | |||||
| 2026-02-03 | 13F | Sumitomo Mitsui DS Asset Management Company, Ltd | 27.209 | 3,44 | 2.027 | 14,14 | ||||
| 2026-02-13 | 13F | Arrowstreet Capital, Limited Partnership | 3.023.079 | 3,62 | 225.189 | 14,37 | ||||
| 2026-02-06 | 13F | EverSource Wealth Advisors, LLC | 1.112 | -24,35 | 83 | -17,17 | ||||
| 2026-02-11 | 13F | Syon Capital Llc | 15.140 | 115,42 | 1.128 | 137,76 | ||||
| 2026-02-17 | 13F | Redwood Investment Management, Llc | 0 | -100,00 | 0 | |||||
| 2026-02-04 | 13F | Atlantic Union Bankshares Corp | 1.400 | 0,00 | 104 | 10,64 | ||||
| 2026-02-12 | 13F | New York State Common Retirement Fund | 142.622 | 0,00 | 10.624 | 10,37 | ||||
| 2026-01-29 | 13F | Pictet Asset Management Holding SA | 331.769 | 109,95 | 24.714 | 131,74 | ||||
| 2026-02-11 | 13F | Manchester Capital Management LLC | 64 | 5 | ||||||
| 2025-10-22 | 13F | Hennion & Walsh Asset Management, Inc. | 0 | -100,00 | 0 | |||||
| 2026-01-07 | 13F | Procyon Private Wealth Partners, LLC | 18.973 | 18,37 | 1.413 | 30,71 | ||||
| 2026-02-17 | 13F | Jones Financial Companies Lllp | 3.649 | 23,49 | 272 | 36,87 | ||||
| 2026-01-29 | 13F | Rakuten Securities, Inc. | 9 | -18,18 | 1 | |||||
| 2026-01-15 | 13F | Frank, Rimerman Advisors LLC | 4.149 | 0,34 | 309 | 10,75 | ||||
| 2026-02-17 | 13F | Water Island Capital Llc | Put | 60.600 | 4.514 | |||||
| 2026-02-17 | 13F | Water Island Capital Llc | 467.742 | 34.842 | ||||||
| 2026-02-13 | 13F | Glen Eagle Advisors, LLC | 75 | 0,00 | 6 | 0,00 | ||||
| 2026-02-13 | 13F | Sterling Capital Management LLC | 13.774 | -6,07 | 1.026 | 3,74 | ||||
| 2025-10-17 | 13F | Smallwood Wealth Investment Management, LLC | 0 | -100,00 | 0 | |||||
| 2026-02-17 | 13F | Cinctive Capital Management LP | 210.000 | 216,25 | 15.643 | 249,07 | ||||
| 2026-02-10 | 13F | Gulf International Bank (UK) Ltd | 13.544 | 0,00 | 1 | |||||
| 2026-01-29 | 13F | UBS Group AG | 3.139.661 | 27,89 | 233.873 | 41,15 | ||||
| 2026-02-03 | 13F | International Assets Investment Management, Llc | 23 | 2 | ||||||
| 2026-02-17 | 13F | Signature Equity Partners, LLC | 104 | 8 | ||||||
| 2026-02-09 | 13F | Jefferies Financial Group Inc. | 57.206 | -6,09 | 4.261 | 3,65 | ||||
| 2026-02-03 | 13F | Manning & Napier Advisors Llc | 10 | 1 | ||||||
| 2026-01-12 | 13F | E. Ohman J:or Asset Management AB | 10.200 | 0,00 | 760 | 10,32 | ||||
| 2026-02-05 | 13F | Alpine Associates Management Inc. | 435.350 | 32.429 | ||||||
| 2026-01-28 | 13F | B. Metzler seel. Sohn & Co. AG | 54.291 | -11,77 | 4.044 | -2,60 | ||||
| 2026-02-02 | 13F | Headinvest, Llc | 17.990 | -4,16 | 1.340 | 5,85 | ||||
| 2026-02-13 | 13F | Barclays Plc | 469.020 | 0,26 | 34.937 | 10,66 | ||||
| 2026-02-13 | 13F | Osmosis Investment Management UK Ltd | 74.068 | 5.517 | ||||||
| 2026-02-03 | 13F | Costello Asset Management, INC | 100 | 0,00 | 7 | 16,67 | ||||
| 2026-02-03 | 13F | Crestwood Advisors Group LLC | 6.169 | 36,94 | 460 | 50,99 | ||||
| 2026-02-13 | 13F | Brown Advisory Inc | 205.498 | 10,29 | 15.308 | 21,73 | ||||
| 2026-02-17 | 13F | LMR Partners LLP | 439.947 | 32.772 | ||||||
| 2026-01-26 | 13F | Clean Yield Group | 57.913 | -0,71 | 4.314 | 9,58 | ||||
| 2026-02-17 | 13F | Banco Bilbao Vizcaya Argentaria, S.a. | 0 | -100,00 | 0 | |||||
| 2026-02-11 | 13F | Livforsakringsbolaget Skandia, Omsesidigt | 2.126 | 0,00 | 158 | 10,49 | ||||
| 2026-02-13 | 13F | USS Investment Management Ltd | 0 | -100,00 | 0 | |||||
| 2026-02-05 | 13F | DnB Asset Management AS | 43.154 | -83,67 | 3.215 | -81,97 | ||||
| 2026-02-05 | 13F | GABELLI & Co INVESTMENT ADVISERS, INC. | 253.000 | 18.846 | ||||||
| 2026-02-11 | 13F | Longfellow Investment Management Co Llc | 1.512 | 113 | ||||||
| 2026-01-29 | 13F | Washington Capital Management Inc | 9.120 | -46,04 | 679 | -40,44 | ||||
| 2026-02-17 | 13F | Trexquant Investment LP | 0 | -100,00 | 0 | -100,00 | ||||
| 2026-01-28 | 13F | N.E.W. Advisory Services LLC | 925 | 0,00 | 69 | 9,68 | ||||
| 2026-02-17 | 13F | Sagefield Capital LP | 169.882 | 12.655 | ||||||
| 2026-01-20 | 13F | Family Legacy Financial Solutions, LLC | 3.277 | 0,00 | 0 | -100,00 | ||||
| 2026-02-12 | 13F | Castleark Management Llc | 0 | -100,00 | 0 | |||||
| 2026-02-13 | 13F | Cornercap Investment Counsel Inc | 15.223 | -1,35 | 1.134 | 8,84 | ||||
| 2026-02-09 | 13F | Mizuho Securities Usa Llc | 16.206 | 0,04 | 1.215 | 11,68 | ||||
| 2026-02-17 | 13F | Wealth Watch Advisors, INC | 39 | 0,00 | 3 | 0,00 | ||||
| 2026-02-17 | 13F | Adage Capital Partners Gp, L.l.c. | 1.051.259 | 268,75 | 78.308 | 307,01 | ||||
| 2025-11-18 | 13F | Apexium Financial, Lp | 4.698 | -2,08 | 317 | 1,60 | ||||
| 2026-02-13 | 13F | Carmignac Gestion | 56.387 | 4.200 | ||||||
| 2026-01-30 | 13F | New York State Teachers Retirement System | 171.690 | -2,28 | 13 | 9,09 | ||||
| 2026-02-13 | 13F | Absolute Gestao de Investimentos Ltda. | 630.749 | 46.984 | ||||||
| 2026-02-04 | 13F | Beverly Hills Private Wealth, LLC | 4.739 | 0,00 | 320 | 0,00 | ||||
| 2026-03-02 | 13F | Sankala Group LLC | 81 | 6 | ||||||
| 2026-02-17 | 13F | VestGen Advisors, LLC | 9.259 | -19,98 | 690 | -11,67 | ||||
| 2026-01-15 | 13F | J. Safra Sarasin Holding AG | 0 | -100,00 | 0 | |||||
| 2026-02-11 | 13F | Los Angeles Capital Management Llc | 1.052 | -96,85 | 78 | -96,58 | ||||
| 2026-02-09 | 13F | Employees Retirement System of Texas | 1.851 | 0,00 | 0 | |||||
| 2025-11-14 | 13F | Delta Global Management LP | 0 | -100,00 | 0 | |||||
| 2026-01-14 | 13F | CIBRA Capital Ltd | 62.838 | 4.681 | ||||||
| 2026-02-04 | 13F | Seelaus Asset Management LLC | 0 | -100,00 | 0 | |||||
| 2026-02-17 | 13F | Amundi | 1.323.909 | 23,71 | 98.618 | 36,85 | ||||
| 2026-02-17 | 13F | Twin Securities, Inc. | 84.513 | 6.295 | ||||||
| 2026-01-30 | 13F | Wealthfront Advisers Llc | 60.910 | 0,38 | 4.537 | 10,79 | ||||
| 2026-02-17 | 13F | Tower Research Capital LLC (TRC) | 8.614 | -34,73 | 642 | -27,98 | ||||
| 2025-11-07 | 13F | Ontario Teachers Pension Plan Board | 0 | -100,00 | 0 | -100,00 | ||||
| 2026-02-06 | 13F | Cullen/frost Bankers, Inc. | 1.779 | -35,98 | 133 | -29,41 | ||||
| 2026-02-04 | 13F | Versor Investments LP | 66.587 | 4.960 | ||||||
| 2026-02-02 | 13F | PKO Investment Management Joint-Stock Co | 0 | -100,00 | 0 | |||||
| 2026-03-06 | 13F | Hsbc Holdings Plc | 618.246 | -28,15 | 45.898 | -21,02 | ||||
| 2026-01-29 | 13F | UBS Group AG | Call | 0 | -100,00 | 0 | -100,00 | |||
| 2026-02-17 | 13F | Howard Hughes Medical Institute | 48 | 0,00 | 4 | 0,00 | ||||
| 2026-02-04 | 13F | Bailard, Inc. | 9.632 | -38,04 | 717 | -31,65 | ||||
| 2026-01-05 | 13F | Rosenberg Matthew Hamilton | 726 | 0,00 | 54 | 12,50 | ||||
| 2026-02-17 | 13F | Dark Forest Capital Management Lp | 0 | -100,00 | 0 | |||||
| 2026-02-17 | 13F | Decagon Asset Management LLP | 498.125 | 37.105 | ||||||
| 2026-02-09 | 13F | Choate Investment Advisors | 13.691 | -6,59 | 1.020 | 3,03 | ||||
| 2026-01-23 | 13F | Avion Wealth | 104 | 36,84 | 0 | |||||
| 2026-02-02 | 13F | Horizon Investments, LLC | 3.622 | -66,34 | 270 | -62,95 | ||||
| 2026-02-05 | 13F | Gabelli Funds Llc | 285.742 | 21.285 | ||||||
| 2026-02-11 | 13F | IMA Wealth, Inc. | 376 | 0,00 | 28 | 12,00 | ||||
| 2026-02-23 | 13F | Beaird Harris Wealth Management, LLC | 0 | -100,00 | 0 | -100,00 | ||||
| 2026-02-09 | 13F | Geode Capital Management, Llc | 5.919.013 | 0,37 | 439.228 | 10,80 | ||||
| 2026-02-17 | 13F | Investment Management Corp of Ontario | 11.114 | 0,00 | 828 | 10,27 | ||||
| 2026-01-26 | 13F | Merit Financial Group, LLC | 3.115 | 3,80 | 232 | 14,85 | ||||
| 2025-11-13 | 13F | Riggs Asset Managment Co. Inc. | 0 | -100,00 | 0 | |||||
| 2026-01-08 | 13F | Wealth Enhancement Advisory Services, Llc | 17.925 | 21,79 | 1.344 | 34,84 | ||||
| 2026-02-04 | 13F | LRI Investments, LLC | 44 | 0,00 | 3 | 50,00 | ||||
| 2026-02-12 | 13F | Brinker Capital Investments, LLC | 15.258 | -60,96 | 1.137 | -56,92 | ||||
| 2026-02-11 | 13F | Ameritas Investment Partners, Inc. | 2.027 | 151 | ||||||
| 2026-02-10 | 13F | Goldman Sachs Group Inc | 1.006.189 | -24,04 | 74.951 | -16,16 | ||||
| 2026-02-13 | 13F | Rodgers Brothers Inc. | 7.000 | -92,63 | 521 | -91,87 | ||||
| 2026-02-05 | 13F | Bank Julius Baer & Co. Ltd, Zurich | 0 | -100,00 | 0 |