Grundlæggende statistik
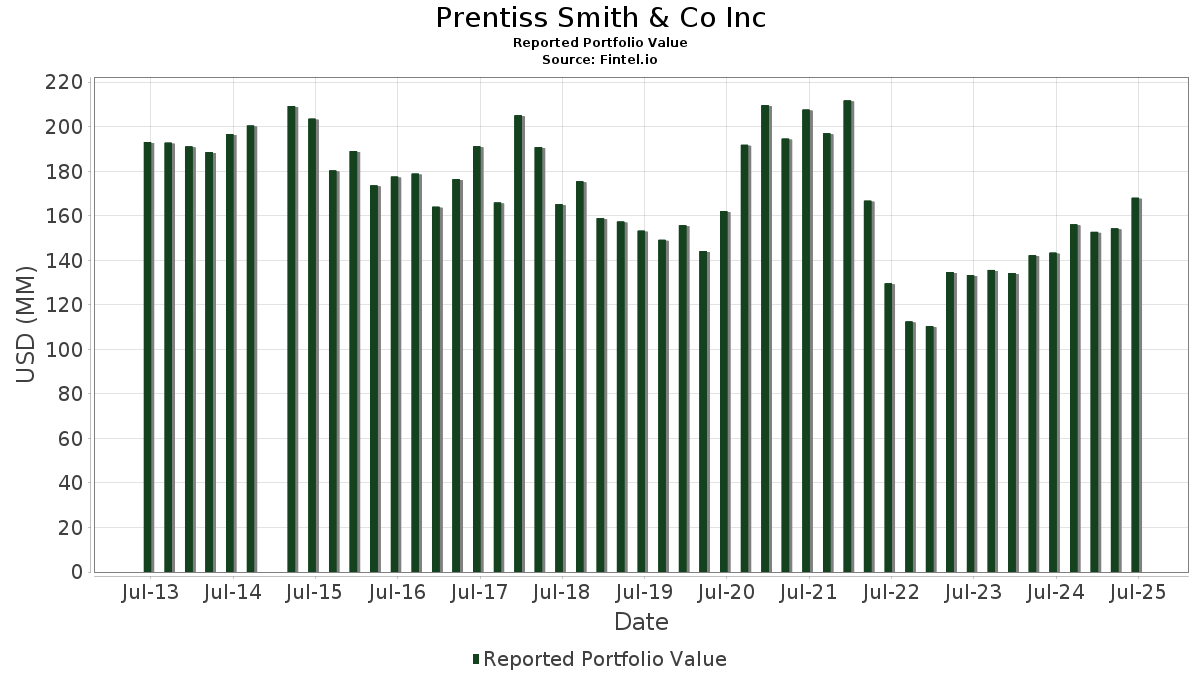
| Porteføljeværdi | $ 168.059.201 |
| Nuværende stillinger | 66 |
Seneste beholdninger, ydeevne, AUM (fra 13F, 13D)
Prentiss Smith & Co Inc har afsløret 66 samlede besiddelser i deres seneste SEC-arkivering. Den seneste porteføljeværdi er beregnet til at være $ 168.059.201 USD. Faktiske aktiver under forvaltning (AUM) er denne værdi plus kontanter (som ikke er oplyst). Prentiss Smith & Co Incs største beholdninger er Microsoft Corporation (US:MSFT) , Cisco Systems, Inc. (US:CSCO) , Alphabet Inc. (US:GOOG) , Johnson & Johnson (US:JNJ) , and Salesforce, Inc. (US:CRM) . Prentiss Smith & Co Incs nye stillinger omfatter BlackRock, Inc. (US:BLK) , .
Top øger dette kvartal
Vi bruger ændringen i porteføljeallokeringen, fordi dette er den mest meningsfulde metrik. Ændringer kan skyldes handler eller ændringer i aktiekurser.
| Sikkerhed | Aktier (MM) |
Værdi (MM$) |
Portefølje % | ΔPortefølje % |
|---|---|---|---|---|
| 0,02 | 9,97 | 5,9346 | 4,1551 | |
| 0,01 | 5,46 | 3,2515 | 3,2515 | |
| 0,03 | 6,23 | 3,7099 | 2,9885 | |
| 0,02 | 4,90 | 2,9158 | 2,6783 | |
| 0,02 | 6,47 | 3,8502 | 0,9961 | |
| 0,06 | 3,42 | 2,0372 | 0,4009 | |
| 0,01 | 2,71 | 1,6111 | 0,3866 | |
| 0,01 | 1,48 | 0,8824 | 0,2534 | |
| 0,08 | 4,05 | 2,4096 | 0,1988 | |
| 0,07 | 6,29 | 3,7447 | 0,1938 |
Top falder i dette kvartal
Vi bruger ændringen i porteføljeallokeringen, fordi dette er den mest meningsfulde metrik. Ændringer kan skyldes handler eller ændringer i aktiekurser.
| Sikkerhed | Aktier (MM) |
Værdi (MM$) |
Portefølje % | ΔPortefølje % |
|---|---|---|---|---|
| 0,00 | 0,00 | -4,3412 | ||
| 0,03 | 3,55 | 2,1122 | -1,3485 | |
| 0,02 | 3,86 | 2,2986 | -1,0753 | |
| 0,04 | 6,48 | 3,8559 | -0,8700 | |
| 0,03 | 2,14 | 1,2737 | -0,6640 | |
| 0,05 | 3,46 | 2,0616 | -0,6286 | |
| 0,03 | 5,15 | 3,0637 | -0,5081 | |
| 0,01 | 3,17 | 1,8860 | -0,3665 | |
| 0,06 | 3,94 | 2,3456 | -0,3047 | |
| 0,04 | 6,05 | 3,6015 | -0,2647 |
13F og Fondsarkivering
Denne formular blev indsendt den 2025-07-22 for rapporteringsperioden 2025-06-30. Klik på linkikonet for at se den fulde transaktionshistorik.
Opgrader for at låse op for premium-data og eksportere til Excel ![]() .
.
| Sikkerhed | Type | Gennemsnitlig aktiekurs | Aktier (MM) |
Δ Aktier (%) |
Δ Aktier (%) |
Værdi ($MM) |
Portefølje (%) |
ΔPortefølje (%) |
|
|---|---|---|---|---|---|---|---|---|---|
| MSFT / Microsoft Corporation | 0,02 | 174,18 | 9,97 | 263,32 | 5,9346 | 4,1551 | |||
| CSCO / Cisco Systems, Inc. | 0,14 | -0,99 | 9,86 | 11,32 | 5,8649 | 0,1257 | |||
| GOOG / Alphabet Inc. | 0,05 | -1,14 | 8,44 | 12,25 | 5,0223 | 0,1485 | |||
| JNJ / Johnson & Johnson | 0,04 | -3,50 | 6,48 | -11,11 | 3,8559 | -0,8700 | |||
| CRM / Salesforce, Inc. | 0,02 | 44,62 | 6,47 | 46,95 | 3,8502 | 0,9961 | |||
| SCHW / The Charles Schwab Corporation | 0,07 | -1,44 | 6,29 | 14,88 | 3,7447 | 0,1938 | |||
| GRC / The Gorman-Rupp Company | 0,17 | 0,00 | 6,27 | 4,61 | 3,7300 | -0,1540 | |||
| AMAT / Applied Materials, Inc. | 0,03 | 344,09 | 6,23 | 460,61 | 3,7099 | 2,9885 | |||
| ABT / Abbott Laboratories | 0,04 | -1,03 | 6,05 | 1,48 | 3,6015 | -0,2647 | |||
| BLK / BlackRock, Inc. | 0,01 | 5,46 | 3,2515 | 3,2515 | |||||
| NYT / The New York Times Company | 0,09 | -1,35 | 5,26 | 11,34 | 3,1307 | 0,0676 | |||
| PG / The Procter & Gamble Company | 0,03 | -0,05 | 5,15 | -6,57 | 3,0637 | -0,5081 | |||
| WMS / Advanced Drainage Systems, Inc. | 0,04 | -0,94 | 5,09 | 4,71 | 3,0304 | -0,1218 | |||
| UNP / Union Pacific Corporation | 0,02 | 1.273,18 | 4,90 | 1.238,80 | 2,9158 | 2,6783 | |||
| QGEN / Qiagen N.V. | 0,08 | -0,81 | 4,05 | 18,74 | 2,4096 | 0,1988 | |||
| BRC / Brady Corporation | 0,06 | 0,20 | 3,94 | -3,57 | 2,3456 | -0,3047 | |||
| ATMU / Atmus Filtration Technologies Inc. | 0,11 | 0,46 | 3,93 | -0,38 | 2,3365 | -0,2186 | |||
| BDX / Becton, Dickinson and Company | 0,02 | -1,31 | 3,86 | -25,78 | 2,2986 | -1,0753 | |||
| MSA / MSA Safety Incorporated | 0,02 | -1,12 | 3,83 | 12,94 | 2,2804 | 0,0806 | |||
| NVS / Novartis AG - Depositary Receipt (Common Stock) | 0,03 | -38,75 | 3,55 | -33,53 | 2,1122 | -1,3485 | |||
| COO / The Cooper Companies, Inc. | 0,05 | -1,05 | 3,46 | -16,53 | 2,0616 | -0,6286 | |||
| ONON / On Holding AG | 0,07 | -1,09 | 3,45 | 17,22 | 2,0540 | 0,1452 | |||
| BSY / Bentley Systems, Incorporated | 0,06 | -1,14 | 3,42 | 35,62 | 2,0372 | 0,4009 | |||
| BRK.B / Berkshire Hathaway Inc. | 0,01 | 0,00 | 3,17 | -8,81 | 1,8860 | -0,3665 | |||
| TNC / Tennant Company | 0,04 | -0,57 | 3,06 | -3,40 | 1,8236 | -0,2328 | |||
| EME / EMCOR Group, Inc. | 0,01 | -0,96 | 2,71 | 43,30 | 1,6111 | 0,3866 | |||
| HOLX / Hologic, Inc. | 0,03 | -32,12 | 2,14 | -28,40 | 1,2737 | -0,6640 | |||
| XYL / Xylem Inc. | 0,01 | -0,54 | 1,85 | 7,68 | 1,1010 | -0,0126 | |||
| A / Agilent Technologies, Inc. | 0,02 | -1,22 | 1,81 | -0,39 | 1,0780 | -0,1005 | |||
| IVV / iShares Trust - iShares Core S&P 500 ETF | 0,00 | 0,00 | 1,54 | 10,51 | 0,9137 | 0,0129 | |||
| WRBY / Warby Parker Inc. | 0,07 | 4,09 | 1,52 | 25,21 | 0,9048 | 0,1176 | |||
| PGR / The Progressive Corporation | 0,01 | 62,06 | 1,48 | 52,78 | 0,8824 | 0,2534 | |||
| V / Visa Inc. | 0,00 | 0,00 | 1,45 | 1,32 | 0,8649 | -0,0651 | |||
| AAPL / Apple Inc. | 0,01 | 0,00 | 1,44 | -7,58 | 0,8557 | -0,1535 | |||
| META / Meta Platforms, Inc. | 0,00 | 0,00 | 1,34 | 28,00 | 0,7949 | 0,1187 | |||
| XOM / Exxon Mobil Corporation | 0,01 | 0,00 | 1,22 | -9,36 | 0,7262 | -0,1466 | |||
| UBER / Uber Technologies, Inc. | 0,01 | 0,00 | 1,10 | 28,09 | 0,6544 | 0,0977 | |||
| REGN / Regeneron Pharmaceuticals, Inc. | 0,00 | -1,00 | 1,10 | -18,09 | 0,6526 | -0,2148 | |||
| AMZN / Amazon.com, Inc. | 0,00 | 0,00 | 1,09 | 15,30 | 0,6509 | 0,0360 | |||
| XPRO / Expro Group Holdings N.V. | 0,01 | 5,23 | 1,08 | -17,86 | 0,6434 | -0,2097 | |||
| SUSA / iShares Trust - iShares ESG Optimized MSCI USA ETF | 0,01 | -1,13 | 1,06 | 9,08 | 0,6295 | 0,0009 | |||
| ADP / Automatic Data Processing, Inc. | 0,00 | 0,00 | 0,96 | 0,94 | 0,5735 | -0,0454 | |||
| FIVN / Five9, Inc. | 0,04 | -1,08 | 0,94 | -3,60 | 0,5575 | -0,0720 | |||
| MA / Mastercard Incorporated | 0,00 | 0,00 | 0,90 | 2,50 | 0,5367 | -0,0336 | |||
| ABBV / AbbVie Inc. | 0,00 | 0,00 | 0,79 | -11,42 | 0,4711 | -0,1082 | |||
| ACI / Albertsons Companies, Inc. | 0,03 | -3,14 | 0,75 | -5,30 | 0,4467 | -0,0669 | |||
| GE / General Electric Company | 0,00 | 0,00 | 0,73 | 28,70 | 0,4351 | 0,0665 | |||
| PEP / PepsiCo, Inc. | 0,00 | 0,00 | 0,62 | -12,01 | 0,3712 | -0,0880 | |||
| GPC / Genuine Parts Company | 0,01 | 0,00 | 0,61 | 1,85 | 0,3609 | -0,0252 | |||
| BKNG / Booking Holdings Inc. | 0,00 | 0,00 | 0,58 | 25,65 | 0,3445 | 0,0459 | |||
| IBM / International Business Machines Corporation | 0,00 | 0,00 | 0,53 | 18,44 | 0,3175 | 0,0257 | |||
| GLD / SPDR Gold Trust | 0,00 | 17,21 | 0,42 | 23,96 | 0,2496 | 0,0303 | |||
| KO / The Coca-Cola Company | 0,01 | 0,00 | 0,42 | -1,18 | 0,2490 | -0,0256 | |||
| DIS / The Walt Disney Company | 0,00 | -6,75 | 0,41 | 17,43 | 0,2446 | 0,0172 | |||
| TIP / iShares Trust - iShares TIPS Bond ETF | 0,00 | -0,06 | 0,39 | -1,01 | 0,2338 | -0,0235 | |||
| PFE / Pfizer Inc. | 0,02 | 0,00 | 0,38 | -4,49 | 0,2283 | -0,0317 | |||
| GEV / GE Vernova Inc. | 0,00 | -1,56 | 0,37 | 71,16 | 0,2191 | 0,0792 | |||
| JPM / JPMorgan Chase & Co. | 0,00 | 0,00 | 0,37 | 18,01 | 0,2189 | 0,0171 | |||
| WFC / Wells Fargo & Company | 0,00 | 0,00 | 0,37 | 11,62 | 0,2174 | 0,0052 | |||
| IAU / iShares Gold Trust | 0,01 | 0,00 | 0,34 | 5,99 | 0,2000 | -0,0060 | |||
| VZ / Verizon Communications Inc. | 0,01 | 0,00 | 0,31 | -4,69 | 0,1818 | -0,0258 | |||
| GIS / General Mills, Inc. | 0,01 | -0,02 | 0,27 | -13,27 | 0,1596 | -0,0411 | |||
| INTC / Intel Corporation | 0,01 | 0,00 | 0,27 | -1,48 | 0,1591 | -0,0166 | |||
| DSI / iShares Trust - iShares ESG MSCI KLD 400 ETF | 0,00 | 0,00 | 0,25 | 13,06 | 0,1498 | 0,0059 | |||
| TY / Tri-Continental Corporation | 0,01 | 0,00 | 0,24 | 3,40 | 0,1449 | -0,0080 | |||
| MRK / Merck & Co., Inc. | 0,00 | -3,24 | 0,24 | -14,80 | 0,1408 | -0,0389 | |||
| RVTY / Revvity, Inc. | 0,00 | -100,00 | 0,00 | 0,0000 | |||||
| HSY / The Hershey Company | 0,00 | -100,00 | 0,00 | 0,0000 | |||||
| ALC / Alcon Inc. | 0,00 | -100,00 | 0,00 | -100,00 | -4,3412 | ||||
| TECH / Bio-Techne Corporation | 0,00 | -100,00 | 0,00 | 0,0000 |