Grundlæggende statistik
| Institutionelle ejere | 518 total, 518 long only, 0 short only, 0 long/short - change of 8,32% MRQ |
| Gennemsnitlig porteføljeallokering | 0.7655 % - change of -12,06% MRQ |
| Institutionelle aktier (lange) | 59.359.552 (ex 13D/G) - change of 7,29MM shares 14,01% MRQ |
| Institutionel værdi (lang) | $ 4.977.092 USD ($1000) |
Institutionelt ejerskab og aktionærer
PIMCO ETF Trust - PIMCO Active Bond Exchange-Traded Fund (US:BOND) har 518 institutionelle ejere og aktionærer, der har indsendt 13D/G- eller 13F-formularer til Securities Exchange Commission (SEC). Disse institutioner har i alt 59,359,552 aktier. Største aktionærer omfatter Cwm, Llc, Morgan Stanley, LPL Financial LLC, Envestnet Asset Management Inc, Wells Fargo & Company/mn, Advisor Group Holdings, Inc., Tectonic Advisors Llc, Resources Investment Advisors, LLC., AE Wealth Management LLC, and Bank Of America Corp /de/ .
PIMCO ETF Trust - PIMCO Active Bond Exchange-Traded Fund (NYSE:BOND) institutionel ejerskabsstruktur viser aktuelle positioner i virksomheden efter institutioner og fonde, samt seneste ændringer i positionsstørrelse. Større aktionærer kan omfatte individuelle investorer, investeringsforeninger, hedgefonde eller institutioner. Skema 13D angiver, at investoren besidder (eller besidder) mere end 5 % af virksomheden og har til hensigt (eller har til hensigt at) aktivt at forfølge en ændring i forretningsstrategi. Skema 13G indikerer en passiv investering på over 5%.
The share price as of May 1, 2026 is 92,03 / share. Previously, on May 5, 2025, the share price was 90,71 / share. This represents an increase of 1,46% over that period.

Fondens stemningsscore
Fund Sentiment Score (fka Ownership Accumulation Score) finder de aktier, der bliver mest købt af fonde. Det er resultatet af en sofistikeret, multi-faktor kvantitativ model, der identificerer virksomheder med de højeste niveauer af institutionel akkumulering. Scoringsmodellen bruger en kombination af den samlede stigning i oplyste ejere, ændringerne i porteføljeallokeringer i disse ejere og andre målinger. Tallet går fra 0 til 100, hvor højere tal indikerer et højere niveau af akkumulering for sine jævnaldrende, og 50 er gennemsnittet.
Opdateringsfrekvens: Dagligt
Se Ownership Explorer, som giver en liste over højest rangerende virksomheder.
AI+ Ask Fintel’s AI assistant about PIMCO ETF Trust - PIMCO Active Bond Exchange-Traded Fund.
Select a question to share a public post with an AI-crafted answer.
Thinking of good questions…
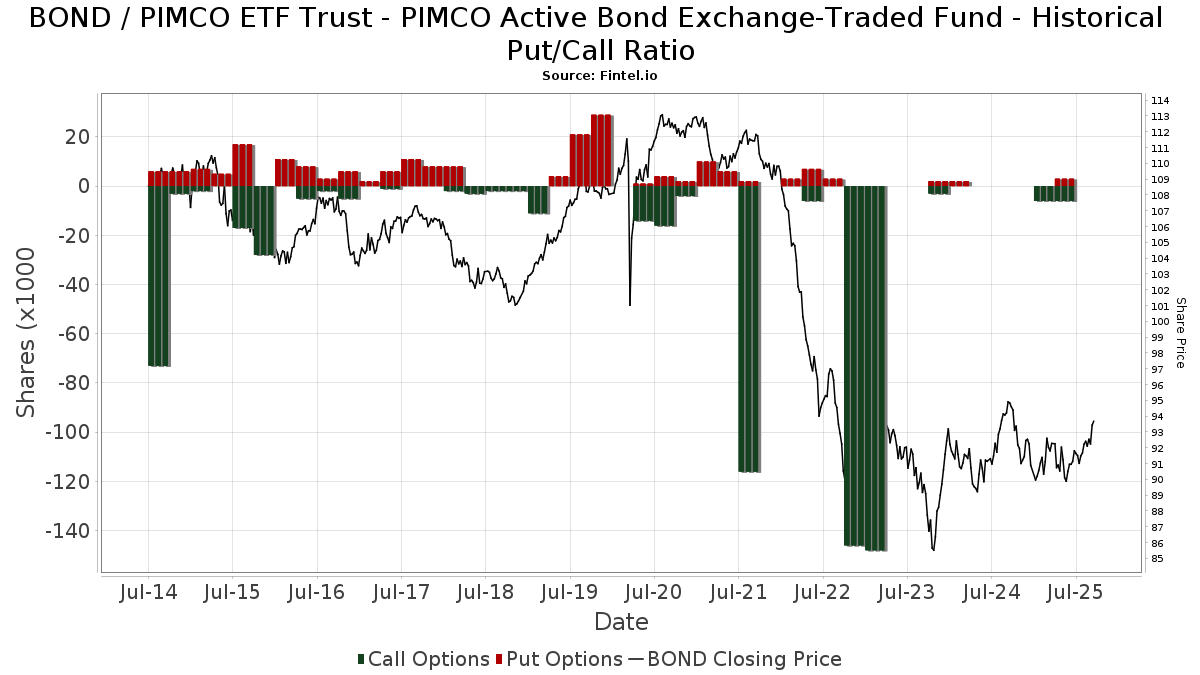
Institutionel Put/Call-forhold
Ud over at indberette standardaktie- og gældsudstedelser skal institutter med mere end 100 mill. aktiver under forvaltning også oplyse deres put- og call-optionsbeholdninger. Da salgsoptioner generelt indikerer negativ stemning, og købsoptioner indikerer positiv stemning, kan vi få en fornemmelse af den overordnede institutionelle stemning ved at plotte forholdet mellem put og kald. Diagrammet til højre viser det historiske put/call-forhold for dette instrument.
Brug af Put/Call Ratio som en indikator for investorernes stemning overvinder en af de vigtigste mangler ved at bruge totalt institutionelt ejerskab, som er, at en betydelig mængde af aktiver under forvaltning investeres passivt for at spore indekser. Passivt forvaltede fonde køber typisk ikke optioner, så indikatoren for put/call-forholdet følger mere nøje følelsen af aktivt forvaltede fonde.
13F og NPORT arkivering
Detaljer om 13F-arkivering er gratis. Detaljer om NP-ansøgninger kræver et premium-medlemskab. Grønne rækker angiver nye positioner. Røde rækker angiver lukkede positioner. Klik på linket ikon for at se den fulde transaktionshistorik.
Opgrader
for at låse premium-data op og eksportere til Excel ![]() .
.
| Fil dato | Kilde | Investor | Type | Gennemsnitlig pris (Øst) |
Aktier | Δ Aktier (%) |
Rapporteret Værdi ($1000) |
Δ Værdi (%) |
Port Alloc (%) |
|
|---|---|---|---|---|---|---|---|---|---|---|
| 2026-02-09 | 13F | Huntington National Bank | 199 | 161,84 | ||||||
| 2026-04-22 | 13F | MFA Wealth Services | 12.051 | 0,46 | 1.112 | -0,36 | ||||
| 2026-02-10 | 13F | Lido Advisors, LLC | 38.087 | 7,51 | 3.550 | 7,35 | ||||
| 2026-02-17 | 13F | Equitable Holdings, Inc. | 23.166 | 11,07 | 2.156 | 10,73 | ||||
| 2026-04-15 | 13F | Exchange Traded Concepts, Llc | 210.351 | -46,00 | 19.411 | -46,47 | ||||
| 2026-04-24 | 13F | Secured Retirement Advisors, Llc | 58.697 | -1,13 | 5.417 | -1,97 | ||||
| 2026-02-06 | 13F | EverSource Wealth Advisors, LLC | 2.622 | -33,89 | 244 | -34,05 | ||||
| 2026-04-17 | 13F | Krilogy Financial LLC | 14.609 | -9,01 | 1.354 | -10,04 | ||||
| 2025-11-04 | 13F | UMA Financial Services, Inc. | 0 | -100,00 | 0 | |||||
| 2026-04-28 | 13F | MBL Wealth, LLC | 4.621 | 10,55 | 426 | 9,51 | ||||
| 2026-04-21 | 13F | Pinnacle Wealth Management Advisory Group, LLC | 8.162 | -4,46 | 753 | -5,28 | ||||
| 2026-02-10 | 13F | Twin Peaks Wealth Advisors, LLC | 3.324 | -2,52 | 311 | -2,52 | ||||
| 2026-04-20 | 13F | First PREMIER Bank | 11.805 | 269,14 | 1 | |||||
| 2026-02-05 | 13F | WealthPlan Investment Management, LLC | 0 | -100,00 | 0 | |||||
| 2026-01-20 | 13F | Ascent Group, LLC | 17.599 | 2,23 | 1.638 | 1,93 | ||||
| 2026-04-17 | 13F | Tectonic Advisors Llc | 1.623.692 | 2,34 | 149.834 | 1,46 | ||||
| 2026-04-21 | 13F | ADG Wealth Management Group, LLC | 4.686 | 11,94 | 432 | 11,05 | ||||
| 2026-02-13 | 13F | University Of Texas/texas Am Investment Managment Co | 17.742 | 0,00 | 1.651 | -0,30 | ||||
| 2025-11-05 | 13F | Moloney Securities Asset Management, LLC | 9.770 | -7,36 | 912 | -6,17 | ||||
| 2026-04-22 | 13F | Pinnacle Bancorp, Inc. | 956 | 0,00 | 88 | 0,00 | ||||
| 2026-05-01 | 13F | International Assets Investment Management, Llc | 109 | 0,00 | 10 | 0,00 | ||||
| 2026-02-13 | 13F | Resources Investment Advisors, LLC. | 1.552.324 | 8,36 | 144.490 | 8,05 | ||||
| 2025-11-12 | 13F | Accredited Wealth Management, LLC | 11.480 | -58,64 | 2.917 | 14,03 | ||||
| 2026-01-23 | 13F | Westside Investment Management, Inc. | 14.316 | -0,14 | 1.332 | -0,37 | ||||
| 2026-04-22 | 13F | Janney Montgomery Scott LLC | 92.112 | 188,44 | 8 | 300,00 | ||||
| 2026-02-10 | 13F/A | Northwestern Mutual Wealth Management Co | 125.862 | 47,98 | 11.715 | 47,56 | ||||
| 2026-02-17 | 13F | Advisory Services Network, LLC | 23.560 | 81,33 | 2.193 | 80,94 | ||||
| 2026-01-20 | 13F | Westwood Wealth Management | 7.498 | 701 | ||||||
| 2026-03-04 | 13F | Rehmann Capital Advisory Group | 9.301 | 2,86 | 867 | 2,49 | ||||
| 2026-04-30 | 13F | CarsonAllaria Wealth Management, Ltd. | 73.653 | 3,27 | 6.797 | 2,38 | ||||
| 2026-02-09 | 13F | Syverson Strege & Co | 60.077 | -1,18 | 5.592 | -1,48 | ||||
| 2026-04-28 | 13F | Fortitude Advisory Group L.L.C. | 4.110 | 379 | ||||||
| 2026-02-11 | 13F | Arrowroot Family Office, LLC | 13.723 | 2,26 | 1.277 | 2,00 | ||||
| 2026-04-23 | 13F | Oppenheimer & Co Inc | 13.269 | 5,25 | 1.224 | 4,35 | ||||
| 2026-01-22 | 13F | Treasure Coast Financial Planning | 92.344 | 3,97 | 8.598 | 3,70 | ||||
| 2026-04-29 | 13F | Strategic Blueprint, LLC | 27.541 | 12,77 | 2.541 | 11,79 | ||||
| 2026-01-30 | 13F | BancorpSouth Bank | 4.545 | 423 | ||||||
| 2026-02-18 | 13F | Beacon Pointe Advisors, LLC | 49.800 | 218,82 | 4.635 | 217,90 | ||||
| 2026-02-17 | 13F | Cetera Investment Advisers | 944.019 | 13,79 | 87.869 | 13,46 | ||||
| 2026-01-23 | 13F | Smith, Moore & Co. | 4.404 | 410 | ||||||
| 2026-04-21 | 13F | Sherrill & Hutchins Financial Advisory, Inc | 5.624 | 519 | ||||||
| 2026-04-17 | 13F | BCS Wealth Management | 76.934 | -42,74 | 7.099 | -43,23 | ||||
| 2026-02-11 | 13F | Parallel Advisors, LLC | 14.968 | 8,51 | 1.393 | 8,24 | ||||
| 2026-04-14 | 13F | Heirloom Wealth Management | 1.019.618 | 107,32 | 94.090 | 105,54 | ||||
| 2026-04-30 | 13F | Csenge Advisory Group | 52.710 | -4,42 | 4.864 | -5,22 | ||||
| 2025-11-14 | 13F | Jane Street Group, Llc | 0 | -100,00 | 0 | -100,00 | ||||
| 2026-04-27 | 13F | Mount Yale Investment Advisors, LLC | 194.918 | 4,52 | 17.987 | 3,18 | ||||
| 2026-04-20 | 13F | Fiduciary Alliance LLC | 38.622 | 4,77 | 3.585 | 4,49 | ||||
| 2026-02-13 | 13F | Gould Asset Management Llc /ca/ | 121.012 | 13,75 | 11.264 | 13,42 | ||||
| 2026-02-11 | 13F | Allianz Asset Management GmbH | 417 | 23,74 | 39 | 22,58 | ||||
| 2026-04-22 | 13F | Caldwell Trust Co | 34 | 0,00 | 3 | 0,00 | ||||
| 2026-02-11 | 13F | SlateStone Wealth, LLC | 44.733 | 21,71 | 4 | 33,33 | ||||
| 2026-02-11 | 13F | Atlanta Consulting Group Advisors, LLC | 3.996 | 74,88 | 374 | 75,12 | ||||
| 2026-04-27 | 13F | Liberty Atlantic Advisors LLC | 9.946 | 0,19 | 918 | -0,65 | ||||
| 2026-02-13 | 13F | Tcfg Wealth Management, Llc | 0 | -100,00 | 0 | |||||
| 2025-11-12 | 13F | Creekmur Asset Management LLC | 93.949 | -4,72 | 8.770 | -3,51 | ||||
| 2026-02-20 | 13F | Sunbelt Securities, Inc. | 3.399 | 0,21 | 316 | 0,00 | ||||
| 2026-04-07 | 13F | Blueline Advisors Llc | 8 | 0,00 | 1 | |||||
| 2026-04-17 | 13F | Halbert Hargrove Global Advisors, Llc | 72.059 | -5,42 | 6.650 | -6,23 | ||||
| 2026-01-29 | 13F | Traction Financial Partners, LLC | 48.627 | 8,09 | 4.526 | 7,79 | ||||
| 2026-02-17 | 13F | Asset Management Group, Inc. | 6.299 | -4,95 | 586 | -5,18 | ||||
| 2026-04-27 | 13F | Sound Income Strategies, LLC | 66 | 10,00 | 6 | 20,00 | ||||
| 2026-04-22 | 13F | SimpliFi, Inc. | 106.584 | 1,21 | 9.836 | 0,34 | ||||
| 2026-04-15 | 13F | Avondale Wealth Management | 7.100 | 0,00 | 655 | -0,76 | ||||
| 2026-04-28 | 13F | Berger Financial Group, Inc | 240.823 | 1.042,91 | 22.223 | 1.033,25 | ||||
| 2026-05-01 | 13F | Thrivent Financial For Lutherans | 492.905 | 2,77 | 45 | 2,27 | ||||
| 2026-02-13 | 13F | Menard Financial Group LLC | 24.730 | -3,83 | 2.302 | -4,12 | ||||
| 2026-04-24 | 13F | Wagner Wealth Management, Llc | 2.066 | 0,00 | 191 | -1,04 | ||||
| 2026-05-01 | 13F | Slagle Financial, LLC | 48.346 | 31,51 | 4.461 | 30,40 | ||||
| 2026-02-13 | 13F | SYM FINANCIAL Corp | 462 | -9,06 | 43 | -8,51 | ||||
| 2026-04-15 | 13F | Nations Financial Group Inc, /ia/ /adv | 71.458 | 2,16 | 6.594 | 1,29 | ||||
| 2026-05-01 | 13F | Jmac Enterprises Llc | 60.205 | 1,81 | 5.556 | 0,93 | ||||
| 2026-02-13 | 13F | Integrated Wealth Concepts LLC | 67.073 | -8,10 | 6.243 | -8,37 | ||||
| 2026-01-21 | 13F | Capital Investment Advisory Services, LLC | 1.912 | -0,88 | 178 | -1,67 | ||||
| 2026-04-17 | 13F | IFC & Insurance Marketing, Inc. | 0 | -100,00 | 0 | |||||
| 2026-02-13 | 13F | Beacon Capital Management, LLC | 2.704 | 252 | ||||||
| 2026-04-10 | 13F | Bouvel Investment Partners, LLC | 238.621 | 0,33 | 22.020 | -0,54 | ||||
| 2026-02-13 | 13F | MorganRosel Wealth Management, LLC | 116.301 | 6,89 | 10.825 | 6,59 | ||||
| 2026-04-15 | 13F | Bright Futures Wealth Management, LLC. | 8.017 | -6,84 | 740 | -7,74 | ||||
| 2026-02-09 | 13F | Fisher Asset Management, LLC | 0 | -100,00 | 0 | |||||
| 2026-04-21 | 13F | Financial Planning Hawaii, Inc. | 2.765 | 21,91 | 255 | 20,85 | ||||
| 2026-04-13 | 13F | Hudson Capital Management LLC | 428.534 | 8,40 | 39.545 | 7,47 | ||||
| 2026-04-15 | 13F | Milestone Asset Management, Llc | 40.207 | -0,20 | 3.710 | -1,07 | ||||
| 2026-01-08 | 13F | Old Port Advisors | 0 | -100,00 | 0 | |||||
| 2026-02-03 | 13F | Retirement Planning Group | 18.036 | -3,31 | 1.679 | -3,62 | ||||
| 2026-02-17 | 13F | Qube Research & Technologies Ltd | 3.859 | 107,92 | 359 | 107,51 | ||||
| 2026-02-10 | 13F | Crestmont Private Wealth LLC | 183.532 | -0,97 | 17.083 | -1,25 | ||||
| 2025-11-21 | 13F | Watts Gwilliam & Co., LLC | 12.396 | 10,64 | 1.157 | 10,61 | ||||
| 2026-02-04 | 13F | Fairway Financial, LLC | 31.121 | 9,72 | 2.897 | 9,41 | ||||
| 2026-04-24 | 13F | Essex Financial Services, Inc. | 35.589 | 13,02 | 3.284 | 12,04 | ||||
| 2026-02-17 | 13F | IHT Wealth Management, LLC | 4.210 | 55,98 | 392 | 55,78 | ||||
| 2026-02-13 | 13F | SRS Capital Advisors, Inc. | 1.174 | 109 | ||||||
| 2026-02-17 | 13F | Cape Investment Advisory, Inc. | 295 | 22,92 | 27 | 22,73 | ||||
| 2026-01-27 | 13F | PFG Advisors | 12.086 | 65,13 | 1.125 | 64,57 | ||||
| 2026-04-22 | 13F | Essential Planning, LLC. | 42.096 | -2,42 | 3.884 | -3,26 | ||||
| 2026-04-23 | 13F | Fortitude Financial, LLC | 24.008 | 2,35 | 2.215 | 1,47 | ||||
| 2026-02-13 | 13F | Aptus Capital Advisors, LLC | 140 | 0,00 | 13 | 0,00 | ||||
| 2026-02-12 | 13F | Principal Securities, Inc. | 10.893 | 3,36 | 1.014 | 3,05 | ||||
| 2026-04-27 | 13F | PFG Investments, LLC | 10.190 | 31,16 | 940 | 30,01 | ||||
| 2026-04-30 | 13F | Kestra Advisory Services, LLC | 297.527 | -15,09 | 27.456 | -15,82 | ||||
| 2026-04-13 | 13F | Mather Group, Llc. | 3.594 | -0,61 | 332 | -1,49 | ||||
| 2026-04-22 | 13F | Spire Wealth Management | 23 | 0,00 | 2 | 0,00 | ||||
| 2026-01-13 | 13F | Synergy Financial Management, LLC | 5.828 | 542 | ||||||
| 2026-02-17 | 13F | Tower Research Capital LLC (TRC) | 122 | 11 | ||||||
| 2026-05-01 | 13F | Harwood Advisory Group, LLC | 74.210 | 0,13 | 6.848 | -0,72 | ||||
| 2026-04-22 | 13F | Goodman Advisory Group, LLC | 1.460 | -5,44 | 135 | -6,29 | ||||
| 2026-02-09 | 13F | Allen Capital Group, LLC | 2.242 | 209 | ||||||
| 2026-04-07 | 13F | U.S. Capital Wealth Advisors, LLC | 5.433 | 32,29 | 501 | 31,15 | ||||
| 2026-04-22 | 13F | Boomfish Wealth Group, LLC | 12.594 | 1.162 | ||||||
| 2026-02-10 | 13F | Moment Partners, LLC | 0 | -100,00 | 0 | |||||
| 2026-02-02 | 13F | Dudley Capital Management, Llc | 15.040 | -2,69 | 1.400 | -2,98 | ||||
| 2026-04-29 | 13F | Your Advocates Ltd., LLP | 2.235 | -80,80 | 206 | -80,98 | ||||
| 2026-02-06 | 13F | Pnc Financial Services Group, Inc. | 203.406 | 8,91 | 18.933 | 8,60 | ||||
| 2026-02-10 | 13F | Womack Financial LLC | 28.576 | 6,56 | 2.660 | 6,23 | ||||
| 2026-02-11 | 13F | Cerity Partners LLC | 4.740 | -19,25 | 441 | -19,38 | ||||
| 2026-01-29 | 13F | Concurrent Investment Advisors, LLC | 558.121 | 10,51 | 51.950 | 10,19 | ||||
| 2026-02-11 | 13F | LPL Financial LLC | 2.895.952 | 25,45 | 269.555 | 25,09 | ||||
| 2026-04-30 | 13F | Elevated Capital Advisors, LLC | 27.930 | -31,50 | 2.577 | -32,09 | ||||
| 2026-05-01 | 13F | Patten & Patten Inc/tn | 77.325 | 3,20 | 7.136 | 2,31 | ||||
| 2026-04-22 | 13F | Investment Advisory Group, LLC | 5.308 | 0,00 | 490 | -1,01 | ||||
| 2026-01-28 | 13F | Barrett & Company, Inc. | 12 | 1 | ||||||
| 2026-02-17 | 13F | SageView Advisory Group, LLC | 358 | 33 | ||||||
| 2026-04-08 | 13F | Wealth Enhancement Trust Services, Inc. | 8.900 | 0,00 | 821 | -0,85 | ||||
| 2026-04-16 | 13F | Evolve Private Wealth, Llc | 526.533 | 12,85 | 48.588 | 11,40 | ||||
| 2026-04-10 | 13F | Tounjian Advisory Partners, Llc | 15.020 | 0,74 | 1.386 | -0,07 | ||||
| 2026-02-13 | 13F | Citigroup Inc | 21.498 | 17,26 | 2.001 | 16,95 | ||||
| 2026-05-01 | 13F | Emerald Investment Partners, Llc | 103.918 | 8,86 | 9.590 | 7,92 | ||||
| 2026-01-15 | 13F | Retireful, LLC | 0 | -100,00 | 0 | |||||
| 2026-04-28 | 13F | Bogart Wealth, LLC | 276 | 0,00 | 25 | 0,00 | ||||
| 2026-02-03 | 13F | Crossmark Global Holdings, Inc. | 0 | -100,00 | 0 | -100,00 | ||||
| 2026-02-19 | 13F | First Growth Capital LLC | 10.412 | 974 | ||||||
| 2026-02-13 | 13F | Colony Group, LLC | 49.444 | 1.525,91 | 4.606 | 1.527,56 | ||||
| 2026-02-12 | 13F | Wayfinding Financial, LLC | 175.288 | 16 | ||||||
| 2026-04-09 | 13F | Pacifica Partners Inc. | 68.131 | 6,35 | 6.287 | 5,50 | ||||
| 2026-02-06 | 13F | HighTower Advisors, LLC | 418.859 | 67,55 | 38.987 | 67,07 | ||||
| 2026-04-09 | 13F | Thrive Wealth Management, LLC | 4.121 | 0,12 | 380 | -0,78 | ||||
| 2026-02-17 | 13F | Bank Of America Corp /de/ | 1.453.893 | 18,29 | 135.328 | 17,94 | ||||
| 2025-11-05 | 13F | Lokken Investment Group LLC | 7.343 | 3,28 | 685 | 4,58 | ||||
| 2026-04-22 | 13F | Asset Allocation Strategies LLC | 94.582 | 31,40 | 8.728 | 30,27 | ||||
| 2026-04-13 | 13F | Winthrop Advisory Group LLC | 4.455 | 411 | ||||||
| 2026-04-13 | 13F | Wolff Wiese Magana Llc | 38 | 4 | ||||||
| 2026-02-04 | 13F | D'Orazio & Associates, Inc. | 22.418 | -4,42 | 2.087 | -4,71 | ||||
| 2026-04-07 | 13F | Central Pacific Bank - Trust Division | 10 | 0,00 | 1 | |||||
| 2026-04-07 | 13F | Legacy Private Trust Co. | 293.994 | -0,09 | 27.130 | -0,95 | ||||
| 2026-02-10 | 13F | Calton & Associates, Inc. | 3.088 | -4,37 | 287 | -4,65 | ||||
| 2026-04-30 | 13F | Mascoma Wealth Management LLC | 1 | 0,00 | 0 | |||||
| 2026-02-12 | 13F | Steward Partners Investment Advisory, Llc | 25.470 | 1,18 | 2.371 | 0,89 | ||||
| 2026-01-16 | 13F | Legacy Capital Wealth Partners, LLC | 2.392 | -0,37 | 223 | -0,89 | ||||
| 2026-02-06 | 13F | Flaharty Asset Management, LLC | 284.921 | 2,19 | 26.520 | 1,89 | ||||
| 2026-02-09 | 13F | Harbour Investments, Inc. | 103.252 | 1,08 | 9.611 | 0,79 | ||||
| 2026-02-17 | 13F | Gotham Asset Management, LLC | 228.960 | 17,15 | 21.312 | 16,81 | ||||
| 2026-04-13 | 13F | Total Investment Management Inc | 58.407 | -4,61 | 5.390 | -5,44 | ||||
| 2026-02-02 | 13F | Legacy Edge Advisors, LLC | 3.378 | 314 | ||||||
| 2026-01-27 | 13F | Mainstay Capital Management Llc /adv | 2.546 | -4,89 | 237 | -5,22 | ||||
| 2026-02-03 | 13F | Gallacher Capital Management LLC | 0 | -100,00 | 0 | |||||
| 2026-02-03 | 13F | Crestwood Advisors Group LLC | 3.518 | 0,00 | 327 | -0,30 | ||||
| 2026-01-14 | 13F | Jfs Wealth Advisors, Llc | 0 | -100,00 | 0 | |||||
| 2026-01-30 | 13F | Sigma Planning Corp | 4.929 | -9,96 | 459 | -10,20 | ||||
| 2026-04-28 | 13F | Golden State Equity Partners | 19.659 | 54,91 | 1.814 | 53,60 | ||||
| 2026-04-13 | 13F | John W. Brooker & Co., CPAs | 21.897 | -28,41 | 2.021 | -29,05 | ||||
| 2026-02-17 | 13F | Signature Equity Partners, LLC | 2.637 | 245 | ||||||
| 2026-04-07 | 13F | Cooper Financial Group | 396.395 | 1.119,75 | 36.579 | 1.109,62 | ||||
| 2026-01-28 | 13F | Cornerstone Advisory, LLC | 42.274 | -6,62 | 3.935 | -6,91 | ||||
| 2026-02-05 | 13F | Tucker Asset Management Llc | 153 | 14 | ||||||
| 2026-04-21 | 13F | Decker Retirement Planning Inc. | 5.520 | -4,93 | 509 | -5,74 | ||||
| 2026-04-22 | 13F | Eqis Capital Management, Inc. | 102.180 | 15,49 | 9.429 | 14,50 | ||||
| 2026-04-28 | 13F | Bfsg, Llc | 20 | 0,00 | 2 | 0,00 | ||||
| 2026-02-17 | 13F | Ameriflex Group, Inc. | 2.107 | -27,32 | 196 | -27,41 | ||||
| 2026-04-09 | 13F | Nelson, Van Denburg & Campbell Wealth Management Group, LLC | 37.742 | 3.483 | ||||||
| 2026-02-10 | 13F | Eq Llc | 3.339 | -54,19 | 311 | -54,41 | ||||
| 2026-04-21 | 13F | FSA Investment Group, LLC | 7.247 | -9,20 | 669 | -9,97 | ||||
| 2026-04-29 | 13F | Addison Capital Co | 184.929 | 6.122,38 | 17.065 | 6.082,97 | ||||
| 2026-04-30 | 13F | Sequoia Financial Advisors, LLC | 5.277 | 86,40 | 487 | 84,79 | ||||
| 2025-11-06 | 13F | LexAurum Advisors, LLC | 0 | -100,00 | 0 | |||||
| 2026-04-24 | 13F | Keybank National Association/oh | 3.797 | 8,58 | 350 | 7,69 | ||||
| 2026-05-01 | 13F | J. Derek Lewis & Associates Inc. | 3.585 | 0,00 | 334 | 0,00 | ||||
| 2026-03-03 | 13F | NWF Advisory Services Inc. | 2.379 | -11,82 | 221 | -11,95 | ||||
| 2026-04-22 | 13F | Patriot Financial Group Insurance Agency, LLC | 2.542 | 235 | ||||||
| 2026-04-30 | 13F | Base Wealth Management LLC | 7.548 | -10,12 | 697 | -10,88 | ||||
| 2026-04-06 | 13F | Versant Capital Management, Inc | 8 | 0,00 | 1 | |||||
| 2026-04-17 | 13F | AdvisorNet Financial, Inc | 161.029 | 35,37 | 14.860 | 34,20 | ||||
| 2026-02-12 | 13F | Renaissance Technologies Llc | 31.100 | 697,44 | 2.895 | 695,05 | ||||
| 2026-02-11 | 13F | First Command Advisory Services, Inc. | 134 | 12 | ||||||
| 2026-02-17 | 13F | Capital Planning Advisors, LLC | 44.026 | 35,69 | 4.098 | 35,30 | ||||
| 2026-02-13 | 13F | Bay Colony Advisory Group, Inc d/b/a Bay Colony Advisors | 2.835 | 0,07 | 264 | -0,38 | ||||
| 2026-05-01 | 13F | Droms Strauss Advisors Inc /mo/ /adv | 8.969 | -9,83 | 828 | -10,59 | ||||
| 2026-02-10 | 13F | Bank of New York Mellon Corp | 39.595 | 145,46 | 3.685 | 144,85 | ||||
| 2026-01-23 | 13F | Legacy Advisory Services, LLC | 6.086 | 0,13 | 566 | -0,18 | ||||
| 2026-02-12 | 13F | Federation des caisses Desjardins du Quebec | 88 | 0,00 | 8 | 0,00 | ||||
| 2026-01-16 | 13F | First Community Trust Na | 0 | -100,00 | 0 | |||||
| 2026-04-13 | 13F | IFP Advisors, Inc | 26.622 | 223,00 | 2.457 | 220,21 | ||||
| 2026-04-28 | 13F | Goldstein Advisors, LLC | 281.501 | 4,64 | 25.977 | 3,74 | ||||
| 2026-02-17 | 13F | DV Trading LLC | 1.373 | 128 | ||||||
| 2026-02-02 | 13F | FSA Advisors, Inc. | 5.952 | 7,88 | 554 | 7,57 | ||||
| 2026-01-12 | 13F | Daymark Wealth Partners, Llc | 2.229 | 207 | ||||||
| 2026-02-13 | 13F | Artemis Wealth Advisors, LLC | 3.027 | 1,31 | 282 | 1,08 | ||||
| 2026-02-17 | 13F | Wiley Bros.-aintree Capital, Llc | 23.592 | 217,82 | 2.199 | 217,77 | ||||
| 2026-04-24 | 13F | Patten Group, Inc. | 20.284 | -2,46 | 1.872 | -3,31 | ||||
| 2026-02-10 | 13F | IFG Advisory, LLC | 93.428 | 8.696 | ||||||
| 2026-02-12 | 13F | Mark Sheptoff Financial Planning, Llc | 377 | 0,53 | 35 | 0,00 | ||||
| 2026-04-13 | 13F | Creative Financial Designs Inc /adv | 4.144 | -42,68 | 382 | -43,15 | ||||
| 2026-02-12 | 13F | Moneta Group Investment Advisors Llc | 77.710 | -1,51 | 7.233 | -1,79 | ||||
| 2026-04-24 | 13F | Medallion Wealth Advisors, LLC | 5.759 | 89,63 | 532 | 88,30 | ||||
| 2026-01-23 | 13F | Intelligence Driven Advisers, LLC | 33.101 | -6,30 | 3.081 | -6,55 | ||||
| 2026-01-16 | 13F | Wall Street Financial Group, Inc. | 0 | -100,00 | 0 | |||||
| 2026-04-10 | 13F | Novem Group | 233.987 | 1,50 | 21.592 | 0,62 | ||||
| 2026-04-16 | 13F | IVC Wealth Advisors LLC | 0 | -100,00 | 0 | |||||
| 2026-02-02 | 13F | Cornerstone Planning Group LLC | 318 | -2,15 | 30 | -9,37 | ||||
| 2026-02-10 | 13F | Parr Mcknight Wealth Management Group, Llc | 141.358 | 16,34 | 13.158 | 16,00 | ||||
| 2026-02-13 | 13F | Tobias Financial Advisors, Inc. | 2.926 | 1,28 | 272 | 1,12 | ||||
| 2026-04-21 | 13F | Forteris Wealth Management Inc. | 27.804 | 6,74 | 2.566 | 5,82 | ||||
| 2026-04-22 | 13F | Continuum Advisory, LLC | 14.558 | 9,20 | 1.343 | 8,31 | ||||
| 2026-04-20 | 13F | SILVER OAK SECURITIES, Inc | 7.992 | 6,99 | 737 | 5,29 | ||||
| 2026-02-13 | 13F | Maia Wealth LLC | 28.373 | 7,56 | 2.667 | 8,15 | ||||
| 2026-01-27 | 13F | Leisure Capital Management | 10.656 | 116,19 | 992 | 115,43 | ||||
| 2026-04-21 | 13F | Merkkuri Wealth Advisors LLC | 27 | 2 | ||||||
| 2026-02-09 | 13F | Kingsview Wealth Management, LLC | 14.429 | -14,95 | 1.343 | -15,16 | ||||
| 2026-02-06 | 13F | VSM Wealth Advisory, LLC | 16.115 | 22,06 | 1.500 | 21,67 | ||||
| 2026-05-01 | 13F/A | Lodestone Wealth Management LLC | 1.045 | 0,77 | 96 | 0,00 | ||||
| 2026-04-27 | 13F | Thrive Capital Management, LLC | 5.864 | 0,38 | 541 | -0,37 | ||||
| 2026-01-22 | 13F | Bartlett & Co. Wealth Management Llc | 582 | 0,00 | 54 | 0,00 | ||||
| 2026-04-14 | 13F | Zrc Wealth Management, Llc | 799 | 1,40 | 74 | 0,00 | ||||
| 2026-04-23 | 13F | Ferguson Shapiro LLC | 0 | -100,00 | 0 | |||||
| 2026-01-07 | 13F | Sagespring Wealth Partners, Llc | 89.322 | 0,00 | 8.314 | -0,28 | ||||
| 2026-01-23 | 13F | Lunt Capital Management, Inc. | 50.830 | -4,44 | 4.731 | -4,71 | ||||
| 2026-01-26 | 13F | LifeWealth Investments, LLC | 0 | -100,00 | 0 | -100,00 | ||||
| 2026-02-05 | 13F | Stonebridge Financial Planning Group, LLC | 2.741 | 0,00 | 255 | 0,00 | ||||
| 2025-11-03 | 13F | Belpointe Asset Management LLC | 0 | -100,00 | 0 | |||||
| 2026-04-28 | 13F | Strata Wealth Advisors, LLC | 12.050 | 0,00 | 1.112 | -0,89 | ||||
| 2026-05-01 | 13F | Connecticut Wealth Management, LLC | 46.349 | -24,10 | 4.277 | -24,75 | ||||
| 2026-04-28 | 13F | Golden State Wealth Management, LLC | 857 | 52,49 | 79 | 51,92 | ||||
| 2026-02-10 | 13F | Vista Private Wealth Partners. LLC | 68.088 | 0,00 | 6.276 | 0,00 | ||||
| 2026-02-17 | 13F | Redwood Park Advisors LLC | 808 | 75 | ||||||
| 2026-04-15 | 13F | Hutchens & Kramer Investment Management Group, LLC | 176.533 | 6,23 | 16.290 | 5,32 | ||||
| 2026-02-04 | 13F | Rollins Financial Advisors, LLC | 7.405 | 111,51 | 689 | 111,35 | ||||
| 2025-11-14 | 13F | Susquehanna International Group, Llp | 0 | -100,00 | 0 | -100,00 | ||||
| 2026-02-17 | 13F | Old Mission Capital Llc | 0 | -100,00 | 0 | |||||
| 2026-02-17 | 13F | Warren Averett Asset Management, LLC | 640.890 | 180,98 | 59.654 | 180,17 | ||||
| 2026-02-17 | 13F | Ameriprise Financial Inc | 4.815 | -22,74 | 450 | -22,72 | ||||
| 2026-02-05 | 13F | Prudent Investors Network | 23.970 | -28,02 | 2.231 | -28,22 | ||||
| 2026-04-29 | 13F | Cary Street Partners Financial Llc | 3.073 | -16,56 | 284 | -17,25 | ||||
| 2026-04-16 | 13F | Capital Advisors, Ltd. LLC | 2.686 | 61,71 | 0 | |||||
| 2026-04-08 | 13F | Dynamic Advisor Solutions LLC | 6.610 | 8,77 | 610 | 7,79 | ||||
| 2026-04-14 | 13F | ACT Advisors, LLC. | 6.798 | 44,03 | 627 | 42,82 | ||||
| 2026-02-10 | 13F | Beckerman Institutional, LLC | 16.342 | 1.521 | ||||||
| 2026-04-14 | 13F | Southland Equity Partners LLC | 273.026 | -0,82 | 25.195 | -1,67 | ||||
| 2026-02-13 | 13F | Baird Financial Group, Inc. | 45.428 | -5,02 | 4.228 | -5,29 | ||||
| 2026-04-13 | 13F | First Hawaiian Bank | 38.201 | 0,00 | 3.525 | -0,84 | ||||
| 2026-04-30 | 13F | Millstone Evans Group, LLC | 246 | 0,00 | 23 | 0,00 | ||||
| 2026-04-21 | 13F | OneAscent Wealth Management LLC | 5.522 | 99,71 | 510 | 98,05 | ||||
| 2026-01-29 | 13F | UBS Group AG | 889.205 | 9,18 | 82.767 | 8,87 | ||||
| 2026-04-14 | 13F | XY Planning Network, Inc. | 6.403 | 19,48 | 589 | 18,27 | ||||
| 2026-01-26 | 13F | Consolidated Portfolio Review Corp | 0 | -100,00 | 0 | |||||
| 2025-11-05 | 13F | Burt Wealth Advisors | 6.527 | 0,00 | 609 | 1,33 | ||||
| 2026-02-12 | 13F | Triumph Capital Management | 1.945 | 181 | ||||||
| 2026-04-15 | 13F | 21 West Wealth Management LLC | 38.562 | 4,12 | 3.559 | 3,22 | ||||
| 2026-04-16 | 13F | Quotient Wealth Partners, LLC | 2.255 | 208 | ||||||
| 2026-02-05 | 13F | Atria Investments Llc | 7.748 | -7,29 | 721 | -7,56 | ||||
| 2026-04-07 | 13F | Eastern Bank | 50 | 0,00 | 5 | 0,00 | ||||
| 2026-04-16 | 13F | Triad Wealth Partners, LLC | 12.666 | 1.169 | ||||||
| 2026-02-12 | 13F | Blue Edge Capital, LLC | 2.832 | 12,65 | 264 | 12,39 | ||||
| 2026-01-29 | 13F | Quest 10 Wealth Builders, Inc. | 246 | 0,00 | 23 | 0,00 | ||||
| 2026-02-04 | 13F | First Foundation Advisors | 8.094 | -6,77 | 753 | -7,04 | ||||
| 2026-02-17 | 13F | Ducere Wealth Management LLC | 8.724 | 812 | ||||||
| 2026-02-18 | 13F | EP Wealth Advisors, Inc. | 22.864 | 9,52 | 2.128 | 10,60 | ||||
| 2026-05-01 | 13F | Avion Wealth | 428 | -4,46 | 0 | |||||
| 2026-04-24 | 13F | Northwest Financial Advisors | 7.007 | 8,30 | 647 | 7,31 | ||||
| 2026-04-22 | 13F | Romano Brothers And Company | 17.118 | 4,33 | 1.580 | 3,41 | ||||
| 2026-04-08 | 13F | Emergent Wealth Advisors, LLC | 29.939 | -46,61 | 2.763 | -47,08 | ||||
| 2026-04-27 | 13F | Truist Financial Corp | 318.700 | 119,85 | 29.410 | 117,96 | ||||
| 2026-02-09 | 13F | Keating Financial Advisory Services, Inc. | 2.698 | 251 | ||||||
| 2026-02-13 | 13F | Visionary Wealth Advisors | 72.890 | 18,41 | 6.785 | 18,06 | ||||
| 2026-04-24 | 13F | Private Advisor Group, LLC | 269.954 | 0,71 | 24.911 | -0,15 | ||||
| 2026-02-13 | 13F | MAI Capital Management | 3.975 | -1,00 | 370 | -1,07 | ||||
| 2026-02-13 | 13F | Brasada Capital Management, Lp | 8.643 | -5,33 | 804 | -5,52 | ||||
| 2026-02-10 | 13F | WCG Wealth Advisors LLC | 42.175 | 41,75 | 3.924 | 41,30 | ||||
| 2026-02-17 | 13F | Citadel Advisors Llc | Call | 4.100 | 382 | |||||
| 2026-02-17 | 13F | Asset One Wealth Management LLC | 17.122 | 1.593 | ||||||
| 2026-04-22 | 13F | Vicus Capital | 144.662 | 2,62 | 13.349 | 1,74 | ||||
| 2026-02-11 | 13F | MCF Advisors LLC | 30.713 | 2.871 | ||||||
| 2026-04-24 | 13F | Eagle Bay Advisors LLC | 0 | -100,00 | 0 | |||||
| 2026-02-17 | 13F | Widmann Financial Services, Inc. | 2.850 | 265 | ||||||
| 2026-02-19 | 13F | Claris Financial LLC | 5.564 | 0,61 | 518 | 0,19 | ||||
| 2026-04-27 | 13F | Vavra Capital Management, LLC | 140.103 | 0,37 | 12.929 | -0,49 | ||||
| 2026-01-16 | 13F | Trust Co Of Vermont | 780 | 0,00 | 73 | 0,00 | ||||
| 2026-02-04 | 13F | BCJ Capital Management, LLC | 10.179 | 260,32 | 947 | 260,08 | ||||
| 2026-02-10 | 13F | Marshall & Sterling Wealth Advisors Inc. | 36 | 0,00 | 3 | 0,00 | ||||
| 2026-04-29 | 13F | LiftPoint Family Wealth Advisors LLC | 5.299 | 6,83 | 489 | 5,86 | ||||
| 2026-04-17 | 13F/A | Founders Financial Securities Llc | 3.437 | 3,90 | 318 | 3,58 | ||||
| 2026-02-06 | 13F | GPS Wealth Strategies Group, LLC | 0 | -100,00 | 0 | |||||
| 2026-04-24 | 13F | SOL Capital Management CO | 0 | -100,00 | 0 | |||||
| 2026-02-12 | 13F | Summit Financial, LLC | 4.700 | 23,85 | 439 | 24,01 | ||||
| 2026-02-24 | 13F | Astoria Portfolio Advisors LLC. | 0 | -100,00 | 0 | |||||
| 2026-02-06 | 13F | Larson Financial Group LLC | 1.501 | -6,89 | 140 | -7,33 | ||||
| 2026-02-13 | 13F | Clarity Asset Management, Inc. | 173 | 16 | ||||||
| 2026-01-14 | 13F | ORG Partners LLC | 7.216 | -0,47 | 673 | -0,74 | ||||
| 2026-04-20 | 13F | Cardinal Point Capital Management, ULC | 2.311 | -28,69 | 213 | -29,47 | ||||
| 2026-03-12 | 13F | Winthrop Partners - Wny, Llc | 0 | -100,00 | 0 | |||||
| 2026-02-12 | 13F | Vickerman Investment Advisors, Inc. | 777.120 | 13,62 | 72.334 | 13,29 | ||||
| 2026-02-17 | 13F | Insight Wealth Partners, LLC | 33.750 | 5,86 | 3.141 | 5,54 | ||||
| 2026-04-28 | 13F | Kingswood Wealth Advisors, Llc | 3.205 | -3,46 | 296 | -4,53 | ||||
| 2025-11-06 | 13F | Savvy Advisors, Inc. | 0 | -100,00 | 0 | |||||
| 2026-04-30 | 13F | Private Trust Co Na | 3.954 | 83,31 | 365 | 82,00 | ||||
| 2026-04-21 | 13F | Mayfair Advisory Group, LLC | 5.345 | 0,02 | 493 | -0,80 | ||||
| 2026-05-01 | 13F | Smart Portfolios, LLC | 108.036 | 6,19 | 9.970 | 5,28 | ||||
| 2026-04-08 | 13F | Eclectic Associates Inc /adv | 346.903 | 30,34 | 32.012 | 29,22 | ||||
| 2026-02-09 | 13F | Green Square Capital Advisors Llc | 12.370 | 1.151 | ||||||
| 2026-02-13 | 13F | Wells Fargo & Company/mn | 1.983.801 | 23,79 | 184.652 | 23,44 | ||||
| 2026-04-20 | 13F | Williams & Novak, LLC | 9.543 | 38,75 | 878 | 37,19 | ||||
| 2026-04-17 | 13F | Vermillion Wealth Management, Inc. | 2.451 | -3,77 | 226 | -4,64 | ||||
| 2026-01-29 | 13F | Dunhill Financial, LLC | 3.557 | -40,72 | ||||||
| 2026-04-28 | 13F | Southern Michigan Bank & Trust | 225 | 21 | ||||||
| 2026-02-02 | 13F | Horizon Investments, LLC | 154.435 | 1,50 | 14.375 | 2,10 | ||||
| 2026-01-26 | 13F | Keystone Wealth Services, LLC | 3.608 | 4,67 | 336 | 4,36 | ||||
| 2026-02-05 | 13F | Elyxium Wealth, LLC | 29.933 | 2.786 | ||||||
| 2026-04-22 | 13F | Beacon Financial Planning, Inc | 12.526 | 1,35 | 1.156 | 0,43 | ||||
| 2026-02-17 | 13F | First Commonwealth Financial Corp /pa/ | 205.060 | 12,00 | 19.087 | 11,67 | ||||
| 2026-02-24 | 13F | Barnes Wealth Management Group, Inc | 34.822 | 2,12 | 3.241 | 1,82 | ||||
| 2026-04-23 | 13F | Farmers & Merchants Investments Inc | 220 | 0,00 | 20 | 0,00 | ||||
| 2026-02-10 | 13F | Koss-Olinger Consulting, LLC | 1.315.663 | 100,45 | 122.462 | 102,41 | ||||
| 2026-04-27 | 13F | USAdvisors Wealth Management, LLC | 81.124 | 4,94 | 7 | 0,00 | ||||
| 2026-04-27 | 13F | FSM Wealth Advisors, LLC | 537.942 | 27,98 | 49.641 | 26,88 | ||||
| 2026-01-16 | 13F | Empirical Financial Services, LLC d.b.a. Empirical Wealth Management | 2.300 | -2,13 | 214 | -2,28 | ||||
| 2026-04-27 | 13F | Pensionmark Financial Group, Llc | 7.716 | 28,51 | 712 | 27,60 | ||||
| 2026-01-26 | 13F | AE Wealth Management LLC | 1.482.067 | 47,60 | 137.951 | 47,17 | ||||
| 2026-04-21 | 13F | Pinnacle Associates Ltd | 8.643 | -6,45 | 798 | -7,22 | ||||
| 2026-02-05 | 13F | Wealth Advisors of Iowa, LLC | 21.183 | 0,35 | 1.972 | 0,05 | ||||
| 2026-04-28 | 13F | Sheridan Capital Management, LLC | 136.024 | 9,39 | 12.552 | 8,45 | ||||
| 2026-02-02 | 13F | Avidian Wealth Solutions, LLC | 2.750 | 0,15 | 256 | 0,00 | ||||
| 2026-02-17 | 13F | Scarborough Advisors, LLC | 147 | 1,38 | 14 | 0,00 | ||||
| 2025-11-18 | 13F | Schubert & Co | 0 | -100,00 | 0 | |||||
| 2026-04-17 | 13F | United Advisor Group, LLC | 4.702 | 10,17 | 434 | 9,07 | ||||
| 2026-02-06 | 13F | Harmony Asset Management Llc | 7.478 | 46,31 | 696 | 45,91 | ||||
| 2026-02-05 | 13F | Pinnacle Financial Group, LLC / IL | 37.577 | 16,95 | 3.498 | 16,61 | ||||
| 2026-02-12 | 13F | StoneX Group Inc. | 2.900 | 271 | ||||||
| 2026-02-13 | 13F | National Bank Of Canada /fi/ | 23.449 | 20,78 | 2.183 | 20,49 | ||||
| 2026-01-23 | 13F | Ogorek Anthony Joseph /ny/ /adv | 839 | 0,00 | 0 | |||||
| 2026-02-17 | 13F | Stadion Money Management, LLC | 264.926 | 24.659 | ||||||
| 2026-01-13 | 13F | Lionshead Wealth Management, LLC | 7.498 | -0,36 | 701 | -0,28 | ||||
| 2026-04-23 | 13F | Summit Investment Advisory Services, LLC | 5.443 | -18,36 | 502 | -19,03 | ||||
| 2026-01-28 | 13F | Geneos Wealth Management Inc. | 43.385 | 13,73 | 4.038 | 13,43 | ||||
| 2026-04-15 | 13F | Valley National Advisers Inc | 258.144 | 0,78 | 24 | 0,00 | ||||
| 2026-04-17 | 13F | Richards, Merrill & Peterson, Inc. | 5.954 | 0,03 | 549 | -0,90 | ||||
| 2026-02-09 | 13F | Financial Advisory Corp /ut/ /adv | 10.285 | -1,24 | 1 | |||||
| 2026-05-01 | 13F | Fifth Third Bancorp | 48.832 | 4.506 | ||||||
| 2026-04-08 | 13F | Selby Wealth Management, LLC | 58.526 | 2,54 | 5.401 | 1,66 | ||||
| 2026-04-30 | 13F | Money Concepts Capital Corp | 35.489 | 8,66 | 3.275 | 7,70 | ||||
| 2026-02-17 | 13F | Wealth Watch Advisors, INC | 3.423 | 100,06 | 319 | 100,00 | ||||
| 2026-04-07 | 13F/A | Round Rock Advisors, LLC | 2.223 | 0,00 | 207 | -0,48 | ||||
| 2026-04-14 | 13F | Prospera Financial Services Inc | 0 | -100,00 | 0 | |||||
| 2026-04-22 | 13F | Apollon Financial, LLC | 17.334 | 203,41 | 1.600 | 201,13 | ||||
| 2026-04-13 | 13F | Cyndeo Wealth Partners, LLC | 15.008 | -4,39 | 1.385 | -5,27 | ||||
| 2026-02-14 | 13F | Rockefeller Capital Management L.P. | 6.806 | 24,61 | 634 | 24,36 | ||||
| 2026-04-28 | 13F | Stephens Inc /ar/ | 2.715 | -49,54 | 251 | -50,00 | ||||
| 2026-02-10 | 13F | Rothschild Investment Llc | 4.050 | 0,00 | 377 | -0,53 | ||||
| 2026-01-27 | 13F | TD Waterhouse Canada Inc. | 22.080 | 3,26 | 2.055 | 3,16 | ||||
| 2026-02-17 | 13F | Captrust Financial Advisors | 230.276 | -8,57 | 21.434 | -8,83 | ||||
| 2026-05-01 | 13F | Diversify Wealth Management, Llc | 0 | -100,00 | 0 | |||||
| 2026-02-11 | 13F | Advocacy Wealth Management Services, LLC | 410.678 | 38.226 | ||||||
| 2026-04-14 | 13F | Wealthcare Advisory Partners LLC | 21.294 | -1,33 | 1.965 | -2,19 | ||||
| 2026-05-01 | 13F | Valmark Advisers, Inc. | 17.852 | 17,11 | 1.647 | 16,15 | ||||
| 2025-11-18 | 13F | Apexium Financial, Lp | 6.834 | 34,26 | 638 | 35,82 | ||||
| 2026-04-24 | 13F | National Asset Management, Inc. | 74.026 | 5,95 | 6.814 | 4,78 | ||||
| 2026-02-17 | 13F | Susquehanna International Group, Llp | Call | 18.500 | 23,33 | 1.722 | 22,93 | |||
| 2026-01-26 | 13F | Cwm, Llc | 4.149.576 | 4,48 | 386 | 4,32 | ||||
| 2026-01-23 | 13F | Assetmark, Inc | 1.161 | 2,83 | 108 | 2,86 | ||||
| 2026-02-04 | 13F | Ameritas Advisory Services, LLC | 3.498 | 56,37 | 326 | 56,25 | ||||
| 2026-01-22 | 13F | Maseco Llp | 0 | -100,00 | 0 | |||||
| 2026-04-17 | 13F | Brown, Lisle/cummings, Inc. | 2.574 | -6,16 | 238 | -7,06 | ||||
| 2026-04-30 | 13F | BRYN MAWR TRUST Co | 9.181 | 0,39 | 847 | -0,47 | ||||
| 2026-02-12 | 13F | Hollencrest Capital Management | 24.537 | -0,40 | 2.284 | -0,70 | ||||
| 2026-02-06 | 13F | Aviance Capital Partners, LLC | 56.057 | 0,82 | 5.218 | 0,52 | ||||
| 2026-02-12 | 13F | Sumitomo Mitsui Financial Group, Inc. | 0 | -100,00 | 0 | |||||
| 2026-01-21 | 13F | Prime Capital Investment Advisors, LLC | 3.641 | 68,10 | 339 | 67,33 | ||||
| 2026-01-29 | 13F | Almanack Investment Partners, LLC. | 0 | -100,00 | 0 | |||||
| 2026-02-09 | 13F | HBK Sorce Advisory LLC | 8.293 | 775 | ||||||
| 2026-04-15 | 13F | Wright Fund Managment, LLC | 0 | -100,00 | 0 | |||||
| 2026-04-28 | 13F | Sage Rhino Capital Llc | 5.237 | 0,63 | 483 | -0,21 | ||||
| 2026-02-12 | 13F | Commonwealth Equity Services, Llc | 635.255 | 46,54 | 59.130 | 147.722,50 | ||||
| 2026-01-30 | 13F | Caldwell Securities, Inc | 10.058 | -10,73 | 936 | -10,94 | ||||
| 2026-02-10 | 13F | CIBC World Markets Inc. | 44.149 | -2,31 | 4.109 | -2,58 | ||||
| 2026-04-23 | 13F | O'Connor Financial Group LLC | 235.894 | -0,19 | 21.768 | -1,56 | ||||
| 2026-02-09 | 13F | Frazier Financial Advisors, LLC | 3 | 0,00 | 0 | |||||
| 2026-02-17 | 13F | Aqr Capital Management Llc | 11.259 | 54,83 | 1.048 | 54,57 | ||||
| 2026-05-01 | 13F | American Trust | 6.924 | -0,09 | 639 | -1,09 | ||||
| 2026-04-15 | 13F | Redhawk Wealth Advisors, Inc. | 59.764 | 5.515 | ||||||
| 2026-01-12 | 13F | Evolution Wealth Advisors, LLC | 2.546 | -19,74 | 237 | -20,27 | ||||
| 2025-11-13 | 13F | Promus Capital, LLC | 39 | 0,00 | 4 | 0,00 | ||||
| 2026-02-05 | 13F | Allworth Financial LP | 84.436 | -3,97 | 7.859 | -4,25 | ||||
| 2025-11-14 | 13F | Strategic Wealth Partners, Ltd. | 18.314 | 70.338,46 | 1.710 | 85.350,00 | ||||
| 2026-02-09 | 13F | Nicolet Bankshares Inc | 7.769 | 73,26 | 723 | 72,97 | ||||
| 2026-04-17 | 13F | RFG Advisory, LLC | 282.970 | 47,76 | 26.113 | 46,49 | ||||
| 2026-02-10 | 13F | CIBC Asset Management Inc | 5.030 | 0,00 | 468 | -0,21 | ||||
| 2025-11-04 | 13F | L.m. Kohn & Company | 2.339 | -1,52 | 218 | 0,00 | ||||
| 2026-04-22 | 13F | Morris Retirement Advisors, LLC | 116.458 | 7,76 | 10.747 | 6,83 | ||||
| 2026-04-20 | 13F | Apella Capital, LLC | 3.290 | -3,89 | 306 | -3,77 | ||||
| 2026-01-30 | 13F | Archer Investment Corp | 0 | -100,00 | 0 | |||||
| 2026-02-17 | 13F | Blair William & Co/il | 885 | -2,32 | 82 | -2,38 | ||||
| 2026-04-14 | 13F | Affiance Financial, LLC | 97.316 | 35,58 | 8.980 | 34,41 | ||||
| 2026-04-20 | 13F | Focused Wealth Management, Inc | 2.908 | -20,59 | 268 | -21,18 | ||||
| 2026-02-06 | 13F | Global Retirement Partners, LLC | 72.814 | 8,74 | 6.778 | 8,43 | ||||
| 2026-04-21 | 13F | Ramiah Investment Group | 12.633 | -1,24 | 1.166 | -2,10 | ||||
| 2026-02-11 | 13F | Greykasell Wealth Strategies, Inc. | 1.143 | 0,09 | 106 | 0,00 | ||||
| 2026-04-15 | 13F | Fjell Capital, LLC | 12.474 | 1.151 | ||||||
| 2026-02-13 | 13F | Wilkerson Advisory Group LLC | 30.581 | 2.846 | ||||||
| 2026-02-14 | 13F | POM Investment Strategies, LLC | 79 | 7 | ||||||
| 2026-02-11 | 13F | M Holdings Securities, Inc. | 0 | -100,00 | 0 | |||||
| 2026-04-21 | 13F | Avaii Wealth Management, Llc | 2.947 | -16,14 | 272 | -17,13 | ||||
| 2026-02-17 | 13F | BTG Pactual Asset Management US LLC | 2.729 | 0,00 | 252 | 0,00 | ||||
| 2026-04-27 | 13F | Koshinski Asset Management, Inc. | 58.412 | 25,81 | 5.390 | 24,74 | ||||
| 2026-04-17 | 13F | Stephenson National Bank & Trust | 114.755 | -14,38 | 10.590 | -15,12 | ||||
| 2026-02-13 | 13F | Arkadios Wealth Advisors | 10.956 | -1,47 | 1.020 | -1,74 | ||||
| 2026-02-06 | 13F | Mullooly Asset Management, Inc. | 149.136 | 10,29 | 13.882 | 9,97 | ||||
| 2026-01-07 | 13F | Procyon Private Wealth Partners, LLC | 5.510 | -21,44 | 513 | -21,71 | ||||
| 2026-02-13 | 13F | Stifel Financial Corp | 446.487 | 1,81 | 41.559 | 1,52 | ||||
| 2026-04-16 | 13F | Brookstone Capital Management | 21.468 | -9,48 | 1.981 | -10,24 | ||||
| 2026-02-13 | 13F | Level Four Advisory Services, Llc | 2.349 | 219 | ||||||
| 2026-04-23 | 13F | Cornerstone Wealth Management, LLC | 281.894 | 7,32 | 26.013 | 6,40 | ||||
| 2026-04-30 | 13F | Cedar Mountain Advisors, LLC | 634 | 1,28 | 58 | 0,00 | ||||
| 2026-04-29 | 13F | Arbor Trust Wealth Advisors, Llc | 6.766 | 50,62 | 624 | 48,93 | ||||
| 2026-01-26 | 13F | Milestones Private Investment Advisors LLC | 5.491 | 0,07 | 511 | -0,20 | ||||
| 2026-02-10 | 13F | Linscomb & Williams, Inc. | 84.216 | 10,41 | 7.839 | 10,08 | ||||
| 2026-04-17 | 13F | Signal Advisors Wealth, LLC | 16.561 | 15,92 | 1.528 | 14,97 | ||||
| 2026-04-15 | 13F | Signature Estate & Investment Advisors Llc | 5.022 | 463 | ||||||
| 2026-02-12 | 13F | Aristides Capital LLC | 14.977 | 4,46 | 1.394 | 4,19 | ||||
| 2026-02-17 | 13F | United Capital Financial Advisers, Llc | 13.047 | 1.214 | ||||||
| 2026-04-21 | 13F | HCR Wealth Advisors | 10.524 | 0,00 | 971 | -0,82 | ||||
| 2026-02-05 | 13F | Edge Financial Advisors LLC | 0 | -100,00 | 0 | |||||
| 2026-02-12 | 13F | Kovack Advisors, Inc. | 12.030 | 652 | ||||||
| 2026-04-23 | 13F | J.w. Cole Advisors, Inc. | 9.455 | 8,84 | 873 | 7,92 | ||||
| 2026-01-26 | 13F | Key Capital Management, INC | 100 | 9 | ||||||
| 2026-01-29 | 13F | Comerica Bank | 48.141 | 25,88 | 4.481 | 25,49 | ||||
| 2026-04-07 | 13F | Farther Finance Advisors, LLC | 87.880 | -2,23 | 8.087 | -3,35 | ||||
| 2026-04-08 | 13F | Miracle Mile Advisors, LLC | 39.599 | -9,62 | 3.654 | -10,40 | ||||
| 2026-02-02 | 13F | PKS Advisory Services, LLC | 12.688 | 6,12 | 1.181 | 5,73 | ||||
| 2025-11-07 | 13F | TT Capital Management LLC | 0 | -100,00 | 0 | -100,00 | ||||
| 2026-02-06 | 13F | Vestmark Advisory Solutions, Inc. | 186.470 | 7,08 | 17.357 | 6,77 | ||||
| 2026-02-10 | 13F | Strategic Advisors LLC | 31.514 | -23,55 | 2.933 | -23,78 | ||||
| 2026-02-17 | 13F | Prosperity Consulting Group, LLC | 9.778 | 910 | ||||||
| 2026-04-30 | 13F | Waterfront Wealth Inc. | 16.134 | 23,57 | 1.489 | 21,67 | ||||
| 2025-11-12 | 13F | Napa Wealth Management | 0 | -100,00 | 0 | |||||
| 2026-04-07 | 13F | Park Avenue Securities Llc | 4.451 | -66,39 | 0 | -100,00 | ||||
| 2026-04-20 | 13F | Consilium Wealth Advisory, LLC | 11.450 | 43,57 | 1.057 | 42,32 | ||||
| 2026-04-07 | 13F | CoreCap Advisors, LLC | 380 | 804,76 | 35 | 1.066,67 | ||||
| 2026-02-12 | 13F | CIBC Private Wealth Group, LLC | 21 | -85,42 | 2 | -92,31 | ||||
| 2025-11-14 | 13F | Susquehanna International Group, Llp | Put | 0 | -100,00 | 0 | -100,00 | |||
| 2026-02-12 | 13F | Brinker Capital Investments, LLC | 84.068 | -0,80 | 7.825 | -1,09 | ||||
| 2026-02-17 | 13F | Creative Planning | 26.647 | 15,37 | 2.480 | 15,03 | ||||
| 2026-02-13 | 13F | Paragon Capital Management LLC | 2.314 | 215 | ||||||
| 2026-01-26 | 13F | Lionsbridge Wealth Management LLC | 18.189 | 4,87 | 1.693 | 4,57 | ||||
| 2026-02-05 | 13F | 1620 Investment Advisors, Inc. | 10.867 | -5,44 | 1.012 | -5,69 | ||||
| 2026-04-17 | 13F | BAM Wealth Management, LLC | 67.175 | 0,90 | 6.199 | 0,03 | ||||
| 2026-04-10 | 13F | Abound Wealth Management | 32 | 3 | ||||||
| 2026-04-27 | 13F | Appalachian Capital Management Ltd | 9.816 | -1,53 | 906 | -2,37 | ||||
| 2026-02-03 | 13F | Alpha Cubed Investments, LLC | 239.469 | 2,97 | 22.290 | 2,68 | ||||
| 2026-02-06 | 13F | CFO4Life Group, LLC | 10.008 | 0,00 | 932 | -0,32 | ||||
| 2026-02-09 | 13F | Hartland & Co., LLC | 125.322 | 3,53 | 11.665 | 3,22 | ||||
| 2026-02-26 | 13F | TD Capital Management LLC | 116.230 | 1,16 | 10.819 | 0,87 | ||||
| 2026-02-12 | 13F | Great Valley Advisor Group, Inc. | 1.115.814 | 11,48 | 103.860 | 11,16 | ||||
| 2026-04-07 | 13F | Signaturefd, Llc | 0 | 0 | ||||||
| 2026-02-13 | 13F | Mariner, LLC | 209.445 | 43,98 | 19.495 | 43,57 | ||||
| 2026-01-13 | 13F | Dakota Wealth Management | 7.327 | 682 | ||||||
| 2026-04-27 | 13F | PAX Financial Group, LLC | 141.683 | 6,31 | 13.075 | 5,40 | ||||
| 2026-04-22 | 13F | Clear Creek Financial Management, LLC | 10.462 | -24,38 | 965 | -25,02 | ||||
| 2026-02-12 | 13F | Scotia Capital Inc. | 118.165 | -62,95 | 10.999 | -63,06 | ||||
| 2026-02-13 | 13F | Flow Traders U.s. Llc | 12.988 | 32,60 | 1 | |||||
| 2026-01-27 | 13F | Security Financial Services, INC. | 78.378 | 23,71 | 7.295 | 23,35 | ||||
| 2026-04-09 | 13F | Taylor & Morgan Wealth Management, LLC | 49.572 | 41,25 | 4.575 | 40,05 | ||||
| 2026-04-16 | 13F | Westmount Partners, LLC | 5.290 | 3,81 | 488 | 2,95 | ||||
| 2026-04-20 | 13F | Sowell Financial Services LLC | 5.915 | -97,78 | 546 | -97,80 | ||||
| 2026-04-09 | 13F | Mechanics Bank Trust Department | 0 | -100,00 | 0 | |||||
| 2026-02-12 | 13F | Bank Of Montreal /can/ | 45.562 | -6,53 | 4.241 | -6,81 | ||||
| 2026-04-10 | 13F | Perigon Wealth Management, LLC | 11.863 | 185,72 | 1.095 | 183,42 | ||||
| 2026-02-04 | 13F | Pandora Wealth, Inc. | 913 | 0,00 | 85 | -1,18 | ||||
| 2026-05-01 | 13F | BKD Wealth Advisors, LLC | 23.508 | 3,49 | 2.169 | 2,60 | ||||
| 2026-02-05 | 13F | Macroview Investment Management Llc | 6.820 | 2,74 | 635 | 2,42 | ||||
| 2026-04-30 | 13F | Titleist Asset Management, Llc | 37.621 | 401,01 | 3.472 | 397,28 | ||||
| 2026-02-13 | 13F | Sofos Investments, Inc. | 124 | -26,63 | 12 | -26,67 | ||||
| 2026-02-13 | 13F | Parkside Financial Bank & Trust | 500 | 0,00 | 47 | 0,00 | ||||
| 2026-02-12 | 13F | Sand Hill Global Advisors, LLC | 624.484 | 17,39 | 58.127 | 17,05 | ||||
| 2026-04-15 | 13F | DAVENPORT & Co LLC | 66.155 | 25,47 | 6.105 | 24,39 | ||||
| 2026-05-01 | 13F | Strategic Wealth Advisors LLC | 92 | 0 | ||||||
| 2026-04-10 | 13F | McGrath & Associates, Inc. | 159.687 | 18,19 | 14.736 | 17,18 | ||||
| 2026-02-19 | 13F | CI Private Wealth, LLC | 16.351 | 58,96 | 1.522 | 58,54 | ||||
| 2026-02-03 | 13F | McIlrath & Eck, LLC | 45 | 0,00 | 4 | 0,00 | ||||
| 2026-02-10 | 13F | Envestnet Asset Management Inc | 2.100.558 | -1,11 | 195.520 | -1,39 | ||||
| 2026-01-16 | 13F | Crewe Advisors LLC | 66 | 0,00 | 6 | 0,00 | ||||
| 2026-02-17 | 13F | Raymond James Financial Inc | 1.017.170 | 65,31 | 94.678 | 64,84 | ||||
| 2026-04-28 | 13F | Stratos Wealth Partners, LTD. | 202.176 | 5,82 | 18.657 | 4,91 | ||||
| 2025-11-12 | 13F | Transce3nd, LLC | 0 | -100,00 | 0 | |||||
| 2026-04-23 | 13F | Catalyst Investment Management LLC | 84.782 | -3,22 | 7.889 | -3,26 | ||||
| 2026-02-12 | 13F | Bank of Jackson Hole Trust | 0 | -100,00 | 0 | |||||
| 2026-02-10 | 13F | Savant Capital, LLC | 11.195 | 144,65 | 1.042 | 144,03 | ||||
| 2026-02-19 | 13F | Birchwood Financial Partners, Inc. | 45.087 | 4.197 | ||||||
| 2026-04-27 | 13F | Beacon Financial Advisory LLC | 13.445 | 6,21 | 1.241 | 5,26 | ||||
| 2026-02-12 | 13F | Colonial Trust Co / SC | 1.100 | 0,00 | 103 | 0,98 | ||||
| 2026-01-20 | 13F | Roger Wittlin Investment Advisory, LLC | 40.421 | -18,46 | 3.762 | -18,69 | ||||
| 2026-04-28 | 13F | Stratos Wealth Advisors, LLC | 144.944 | 11,95 | 13.375 | 10,99 | ||||
| 2026-04-17 | 13F | HHM Wealth Advisors, LLC | 632 | 20,38 | 58 | 20,83 | ||||
| 2026-04-20 | 13F | L.K. Benson & Company, P.C. | 5.711 | 0,09 | 527 | -0,75 | ||||
| 2026-01-26 | 13F | Northwest Capital Management Inc | 0 | -100,00 | 0 | |||||
| 2026-02-02 | 13F | Del-Sette Capital Management, LLC | 44.143 | -13,17 | 4.109 | -13,42 | ||||
| 2026-02-13 | 13F | Morgan Stanley | 3.380.670 | 14,18 | 314.673 | 13,85 | ||||
| 2026-04-08 | 13F | Wealth Enhancement Advisory Services, Llc | 309.290 | -36,08 | 28.526 | -36,79 | ||||
| 2026-04-29 | 13F | Axxcess Wealth Management, Llc | 77.900 | 1,48 | 7.189 | 0,60 | ||||
| 2026-02-18 | 13F | GWM Advisors LLC | 0 | -100,00 | 0 | |||||
| 2025-11-14 | 13F | Goldman Sachs Group Inc | 0 | -100,00 | 0 | |||||
| 2026-04-27 | 13F | Evolution Wealth Management Inc. | 616 | 0,00 | 57 | -1,75 | ||||
| 2026-02-06 | 13F | Cullen/frost Bankers, Inc. | 1.788 | -0,17 | 166 | -0,60 | ||||
| 2026-02-09 | 13F | King Luther Capital Management Corp | 233 | -0,43 | ||||||
| 2026-04-14 | 13F | Opal Wealth Advisors, LLC | 510 | 47 | ||||||
| 2026-01-27 | 13F | Tranquilli Financial Advisor LLC | 7.391 | -1,39 | 688 | -1,72 | ||||
| 2026-02-17 | 13F | Royal Bank Of Canada | 634.895 | 15,61 | 59.096 | 15,28 | ||||
| 2026-02-13 | 13F | Change Path, LLC | 772.020 | 9,46 | 71.860 | 9,14 | ||||
| 2026-02-10 | 13F | Bnp Paribas Arbitrage, Sa | 380.578 | 0,44 | 35.424 | 0,15 | ||||
| 2026-04-09 | 13F | Kwmg, Llc | 149.441 | 4,04 | 13.790 | 3,15 | ||||
| 2026-02-13 | 13F | Ausdal Financial Partners, Inc. | 8.167 | -4,02 | 760 | -4,28 | ||||
| 2026-01-29 | 13F | D.a. Davidson & Co. | 123.863 | 30,88 | 11.529 | 30,51 | ||||
| 2025-11-12 | 13F | Park Square Financial Group, LLC | 0 | -100,00 | 0 | |||||
| 2026-02-04 | 13F | Advisor OS, LLC | 37.127 | 160,98 | 3.456 | 160,36 | ||||
| 2026-02-05 | 13F | AlphaCore Capital LLC | 243 | 23 | ||||||
| 2026-04-15 | 13F | Register Financial Advisors LLC | 513 | 0,59 | 47 | 0,00 | ||||
| 2025-11-04 | 13F | Everhart Financial Group, Inc. | 0 | -100,00 | 0 | |||||
| 2026-04-29 | 13F | Envestnet Portfolio Solutions, Inc. | 161.614 | -16,93 | 14.914 | -17,64 | ||||
| 2026-02-11 | 13F | Gateway Wealth Partners, LLC | 8.178 | 192,18 | 761 | 191,57 | ||||
| 2026-02-24 | 13F | Lynch Investment Planning, LLC | 153.154 | 14.317 | ||||||
| 2026-02-06 | 13F | Kingdom Financial Group LLC. | 7 | 1 | ||||||
| 2026-04-07 | 13F | Fragasso Group Inc. | 13.943 | -2,79 | 1.285 | -3,75 | ||||
| 2026-02-17 | 13F | Hamilton Wealth, LLC | 383.077 | 777,99 | 15.790 | 287,77 | ||||
| 2026-02-18 | 13F | NFP Retirement, Inc. | 4.587 | -19,53 | 427 | -19,92 | ||||
| 2026-02-06 | 13F | Synergy Investment Management, LLC | 5.285 | 26,28 | 492 | 25,90 | ||||
| 2026-02-13 | 13F | Destination Wealth Management | 104.023 | 5,09 | 9.682 | 4,78 | ||||
| 2026-01-29 | 13F | Sanctuary Advisors, LLC | 91.379 | 133,47 | 8.506 | 132,82 | ||||
| 2026-04-06 | 13F | Acima Private Wealth, Llc | 142.364 | 1,77 | 13.137 | 0,90 | ||||
| 2026-02-13 | 13F | Fort Point Capital Partners LLC | 10.296 | 0,45 | 964 | 0,84 | ||||
| 2025-11-04 | 13F | Christian Investment Advisors, Inc. | 0 | -100,00 | 0 | |||||
| 2026-02-09 | 13F | Bleakley Financial Group, LLC | 164.245 | 19,38 | 15.288 | 19,03 | ||||
| 2026-04-16 | 13F | Security National Bank | 1.013 | 0,00 | 93 | -1,06 | ||||
| 2026-02-12 | 13F | Insigneo Advisory Services, Llc | 6.205 | 35,33 | 578 | 34,81 | ||||
| 2026-01-30 | 13F | Us Bancorp \de\ | 1.280 | -0,70 | 119 | -0,83 | ||||
| 2026-02-09 | 13F | Endowment Wealth Management, Inc. | 2.569 | 239 | ||||||
| 2026-02-13 | 13F | Glen Eagle Advisors, LLC | 5.162 | 11,68 | 480 | 11,37 | ||||
| 2026-04-09 | 13F | Wealth Alliance Advisory Group, LLC | 81.918 | 7.559 | ||||||
| 2026-02-17 | 13F | Advisor Group Holdings, Inc. | 1.652.036 | -0,98 | 153.786 | -1,12 | ||||
| 2026-04-14 | 13F | Beacon Investment Advisory Services, Inc. | 200 | 18 | ||||||
| 2026-04-17 | 13F | Morris Financial Concepts, Inc. | 138 | 5,34 | 13 | 0,00 | ||||
| 2026-02-12 | 13F | Betterment LLC | 8.451 | 28,79 | 1 | |||||
| 2026-04-24 | 13F | Root Financial Partners, LLC | 43 | 0,00 | 4 | -25,00 | ||||
| 2026-04-27 | 13F | Kelman-Lazarov, Inc. | 262.289 | 0,77 | 24.204 | -0,09 | ||||
| 2026-04-21 | 13F | Wedbush Securities Inc | 6.668 | 6,47 | 1 | |||||
| 2026-02-17 | 13F | GeoWealth Management, LLC | 151.094 | 7,15 | 14.064 | 6,84 | ||||
| 2026-04-30 | 13F | Independence Bank of Kentucky | 325 | 0,00 | 30 | -3,33 | ||||
| 2026-02-17 | 13F | Ancora Advisors, LLC | 602 | 0,00 | 56 | 0,00 | ||||
| 2026-02-12 | 13F | Richard W. Paul & Associates, LLC | 19.545 | 24,38 | 1.819 | 24,08 | ||||
| 2026-02-17 | 13F | Engineers Gate Manager LP | 2.197 | 204 | ||||||
| 2026-04-23 | 13F | Summit Wealth Group Llc / Co | 17.137 | -1,71 | 1.591 | -1,91 | ||||
| 2026-05-01 | 13F | BCR Wealth Strategies, LLC | 2.893 | 0,00 | 0 | |||||
| 2026-02-05 | 13F | L & S Advisors Inc | 38.585 | 136,78 | 3.591 | 136,09 | ||||
| 2026-02-11 | 13F | Capital Analysts, Inc. | 98.635 | 121,72 | 9 | 125,00 | ||||
| 2026-02-11 | 13F | Jpmorgan Chase & Co | 765.938 | 8,05 | 71.294 | 7,74 | ||||
| 2026-02-17 | 13F | Jones Financial Companies Lllp | 160.804 | 102,94 | 14.968 | 102,75 | ||||
| 2026-04-28 | 13F | GM Advisory Group, Inc. | 109.129 | 3,08 | 10.070 | 2,20 | ||||
| 2026-02-03 | 13F | Buck Wealth Strategies, LLC | 581.455 | 40,51 | 54.122 | 40,10 | ||||
| 2026-02-10 | 13F | Keyvantage Wealth, Llc | 17.462 | -0,49 | 1.625 | -0,79 | ||||
| 2026-02-11 | 13F | Smithbridge Asset Management Inc/de | 0 | -100,00 | 0 | |||||
| 2026-04-21 | 13F | OneAscent Financial Services LLC | 46.192 | 627,66 | 4.263 | 622,37 | ||||
| 2026-04-16 | 13F | Freedom Financial Partners LLC | 54.959 | 8,66 | 5.072 | 7,73 | ||||
| 2026-02-10 | 13F | Measured Wealth Private Client Group, LLC | 25 | 2 | ||||||
| 2026-04-30 | 13F | Cambridge Investment Research Advisors, Inc. | 109.716 | 3,11 | 10 | 11,11 | ||||
| 2026-02-10 | 13F | Foundations Investment Advisors, LLC | 0 | -100,00 | 0 | |||||
| 2026-02-11 | 13F | O'shaughnessy Asset Management, Llc | 1.787 | -1,38 | 166 | -1,78 | ||||
| 2026-02-05 | 13F | Duncan Williams Asset Management, LLC | 7.777 | 9,75 | 723 | 9,38 | ||||
| 2026-02-13 | 13F | Mml Investors Services, Llc | 193.412 | 5,06 | 18.003 | 4,76 | ||||
| 2026-02-17 | 13F | Mercer Global Advisors Inc /adv | 458.159 | 7,47 | 42.646 | 7,16 |