Grundlæggende statistik
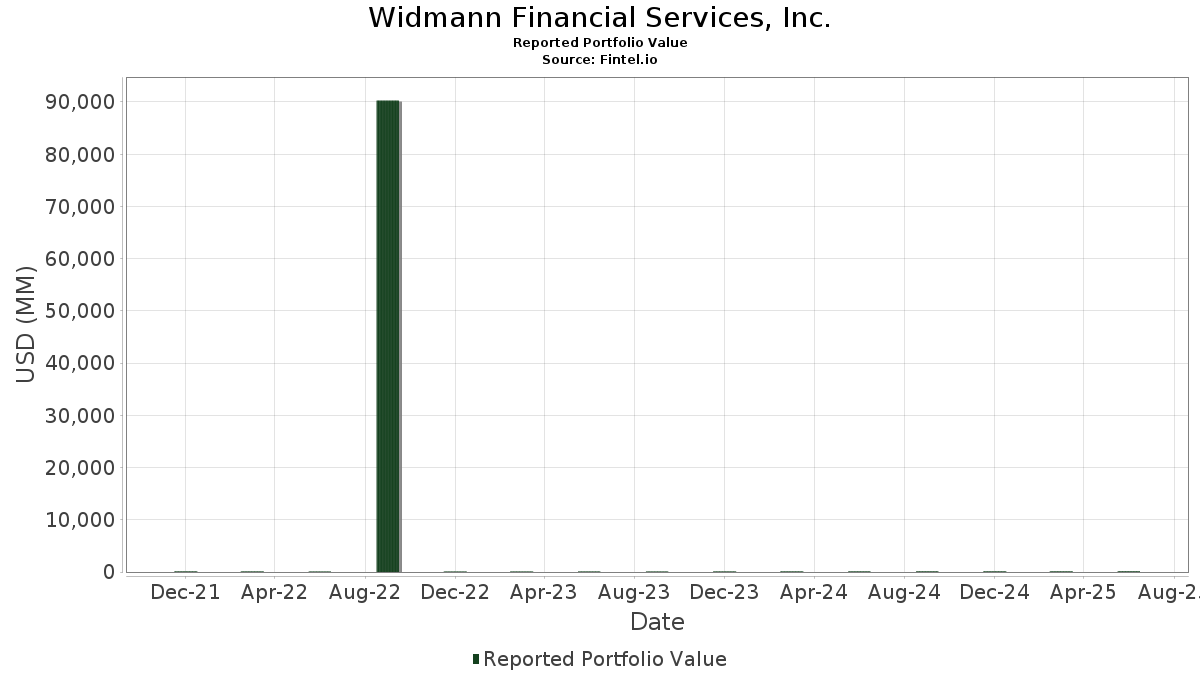
| Porteføljeværdi | $ 143.414.397 |
| Nuværende stillinger | 108 |
Seneste beholdninger, ydeevne, AUM (fra 13F, 13D)
Widmann Financial Services, Inc. har afsløret 108 samlede besiddelser i deres seneste SEC-arkivering. Den seneste porteføljeværdi er beregnet til at være $ 143.414.397 USD. Faktiske aktiver under forvaltning (AUM) er denne værdi plus kontanter (som ikke er oplyst). Widmann Financial Services, Inc.s største beholdninger er iShares Trust - iShares Core MSCI EAFE ETF (US:IEFA) , Microsoft Corporation (US:MSFT) , American Century ETF Trust - Avantis U.S. Small Cap Value ETF (US:AVUV) , iShares Trust - iShares Russell 1000 Value ETF (US:IWD) , and Apple Inc. (US:AAPL) . Widmann Financial Services, Inc.s nye stillinger omfatter Barrick Mining Corporation (US:B) , Capital Group Dividend Value ETF (US:CGDV) , GE Vernova Inc. (US:GEV) , .
Top øger dette kvartal
Vi bruger ændringen i porteføljeallokeringen, fordi dette er den mest meningsfulde metrik. Ændringer kan skyldes handler eller ændringer i aktiekurser.
| Sikkerhed | Aktier (MM) |
Værdi (MM$) |
Portefølje % | ΔPortefølje % |
|---|---|---|---|---|
| 0,01 | 2,08 | 1,4533 | 1,1868 | |
| 0,02 | 7,98 | 5,5659 | 0,9225 | |
| 0,03 | 0,60 | 0,4184 | 0,4184 | |
| 0,01 | 5,69 | 3,9664 | 0,3558 | |
| 0,01 | 0,49 | 0,3421 | 0,3421 | |
| 0,03 | 4,32 | 3,0120 | 0,2826 | |
| 0,00 | 0,36 | 0,2500 | 0,2500 | |
| 0,02 | 1,42 | 0,9881 | 0,2315 | |
| 0,00 | 0,31 | 0,2144 | 0,2144 | |
| 0,00 | 0,30 | 0,2118 | 0,2118 |
Top falder i dette kvartal
Vi bruger ændringen i porteføljeallokeringen, fordi dette er den mest meningsfulde metrik. Ændringer kan skyldes handler eller ændringer i aktiekurser.
| Sikkerhed | Aktier (MM) |
Værdi (MM$) |
Portefølje % | ΔPortefølje % |
|---|---|---|---|---|
| 0,03 | 5,83 | 4,0681 | -0,6132 | |
| 0,03 | 3,72 | 2,5927 | -0,4583 | |
| 0,01 | 1,76 | 1,2244 | -0,3689 | |
| 0,01 | 2,94 | 2,0516 | -0,3516 | |
| 0,01 | 2,35 | 1,6374 | -0,3371 | |
| 0,02 | 2,36 | 1,6482 | -0,3273 | |
| 0,01 | 1,67 | 1,1621 | -0,2826 | |
| 0,01 | 1,10 | 0,7669 | -0,2230 | |
| 0,02 | 0,89 | 0,6220 | -0,1883 | |
| 0,03 | 6,15 | 4,2909 | -0,1839 |
13F og Fondsarkivering
Denne formular blev indsendt den 2025-08-14 for rapporteringsperioden 2025-06-30. Klik på linkikonet for at se den fulde transaktionshistorik.
Opgrader for at låse op for premium-data og eksportere til Excel ![]() .
.
| Sikkerhed | Type | Gennemsnitlig aktiekurs | Aktier (MM) |
Δ Aktier (%) |
Δ Aktier (%) |
Værdi ($MM) |
Portefølje (%) |
ΔPortefølje (%) |
|
|---|---|---|---|---|---|---|---|---|---|
| IEFA / iShares Trust - iShares Core MSCI EAFE ETF | 0,11 | 1,99 | 9,05 | 12,55 | 6,3102 | 0,0643 | |||
| MSFT / Microsoft Corporation | 0,02 | 0,78 | 7,98 | 33,55 | 5,5659 | 0,9225 | |||
| AVUV / American Century ETF Trust - Avantis U.S. Small Cap Value ETF | 0,07 | 10,91 | 6,48 | 15,91 | 4,5158 | 0,1757 | |||
| IWD / iShares Trust - iShares Russell 1000 Value ETF | 0,03 | 3,49 | 6,15 | 6,82 | 4,2909 | -0,1839 | |||
| AAPL / Apple Inc. | 0,03 | 4,81 | 5,83 | -3,19 | 4,0681 | -0,6132 | |||
| IWF / iShares Trust - iShares Russell 1000 Growth ETF | 0,01 | 4,08 | 5,69 | 22,38 | 3,9664 | 0,3558 | |||
| IBM / International Business Machines Corporation | 0,02 | -0,34 | 4,43 | 18,12 | 3,0909 | 0,1764 | |||
| IWP / iShares Trust - iShares Russell Mid-Cap Growth ETF | 0,03 | 4,15 | 4,32 | 22,94 | 3,0120 | 0,2826 | |||
| DVYA / iShares, Inc. - iShares Asia/Pacific Dividend ETF | 0,09 | 0,88 | 4,27 | 11,34 | 2,9781 | -0,0012 | |||
| XOM / Exxon Mobil Corporation | 0,03 | 4,44 | 3,72 | -5,32 | 2,5927 | -0,4583 | |||
| IWS / iShares Trust - iShares Russell Mid-Cap Value ETF | 0,02 | 4,66 | 3,24 | 9,76 | 2,2584 | -0,0332 | |||
| MCD / McDonald's Corporation | 0,01 | 1,68 | 2,94 | -4,88 | 2,0516 | -0,3516 | |||
| HD / The Home Depot, Inc. | 0,01 | 2,45 | 2,56 | 2,49 | 1,7827 | -0,1549 | |||
| IWO / iShares Trust - iShares Russell 2000 Growth ETF | 0,01 | 6,46 | 2,44 | 19,09 | 1,7010 | 0,1098 | |||
| JNJ / Johnson & Johnson | 0,02 | 0,91 | 2,36 | -7,08 | 1,6482 | -0,3273 | |||
| RTX / RTX Corporation | 0,02 | -1,00 | 2,35 | 9,14 | 1,6402 | -0,0341 | |||
| GJR / Strats Trust For Procter & Gambel Security - Preferred Security | 0,01 | -1,18 | 2,35 | -7,60 | 1,6374 | -0,3371 | |||
| NVDA / NVIDIA Corporation | 0,01 | 316,81 | 2,08 | 507,58 | 1,4533 | 1,1868 | |||
| T / AT&T Inc. | 0,07 | 0,85 | 2,02 | 3,21 | 1,4109 | -0,1121 | |||
| KO / The Coca-Cola Company | 0,03 | 1,57 | 2,02 | 0,35 | 1,4057 | -0,1551 | |||
| SPY / SPDR S&P 500 ETF | 0,00 | 1,21 | 1,97 | 11,82 | 1,3724 | 0,0048 | |||
| MOO / VanEck ETF Trust - VanEck Agribusiness ETF | 0,02 | 2,12 | 1,79 | 10,72 | 1,2465 | -0,0076 | |||
| CAT / Caterpillar Inc. | 0,00 | 0,40 | 1,76 | 18,22 | 1,2259 | 0,0701 | |||
| CVX / Chevron Corporation | 0,01 | 0,02 | 1,76 | -14,38 | 1,2244 | -0,3689 | |||
| TSLA / Tesla, Inc. | 0,01 | 0,36 | 1,67 | 23,04 | 1,1622 | 0,1097 | |||
| ABBV / AbbVie Inc. | 0,01 | 1,15 | 1,67 | -10,38 | 1,1621 | -0,2826 | |||
| VZ / Verizon Communications Inc. | 0,03 | 0,20 | 1,50 | -4,40 | 1,0451 | -0,1729 | |||
| TT / Trane Technologies plc | 0,00 | -0,91 | 1,48 | 28,70 | 1,0323 | 0,1384 | |||
| MAIN / Main Street Capital Corporation | 0,02 | 0,01 | 1,44 | 4,50 | 1,0049 | -0,0664 | |||
| MCHP / Microchip Technology Incorporated | 0,02 | 0,09 | 1,42 | 45,63 | 0,9881 | 0,2315 | |||
| C / Citigroup Inc. - Corporate Bond/Note | 0,02 | 0,98 | 1,34 | 21,12 | 0,9360 | 0,0748 | |||
| PFE / Pfizer Inc. | 0,05 | 0,38 | 1,30 | -4,00 | 0,9048 | -0,1449 | |||
| F / Ford Motor Company | 0,12 | -0,65 | 1,29 | 7,49 | 0,9010 | -0,0329 | |||
| DUK / Duke Energy Corporation | 0,01 | 3,48 | 1,27 | 0,08 | 0,8825 | -0,0996 | |||
| IRM / Iron Mountain Incorporated | 0,01 | 0,00 | 1,25 | 19,16 | 0,8721 | 0,0571 | |||
| DIS / The Walt Disney Company | 0,01 | -0,50 | 1,18 | 24,95 | 0,8248 | 0,0898 | |||
| SO / The Southern Company | 0,01 | 8,27 | 1,18 | 8,05 | 0,8242 | -0,0250 | |||
| MO / Altria Group, Inc. | 0,02 | -0,44 | 1,11 | -2,79 | 0,7766 | -0,1130 | |||
| PEP / PepsiCo, Inc. | 0,01 | -1,99 | 1,10 | -13,74 | 0,7669 | -0,2230 | |||
| GWW / W.W. Grainger, Inc. | 0,00 | -1,36 | 1,06 | 3,84 | 0,7359 | -0,0534 | |||
| CGW / Invesco Exchange-Traded Fund Trust II - Invesco S&P Global Water Index ETF | 0,02 | 10,96 | 1,06 | 24,56 | 0,7358 | 0,0775 | |||
| DIA / SPDR Dow Jones Industrial Average ETF Trust | 0,00 | -4,07 | 1,04 | 0,68 | 0,7239 | -0,0770 | |||
| PPG / PPG Industries, Inc. | 0,01 | 2,27 | 1,03 | 6,31 | 0,7174 | -0,0338 | |||
| BA / The Boeing Company | 0,00 | -0,75 | 0,98 | 21,88 | 0,6802 | 0,0588 | |||
| TFC / Truist Financial Corporation | 0,02 | -3,01 | 0,95 | 1,38 | 0,6648 | -0,0661 | |||
| MRK / Merck & Co., Inc. | 0,01 | 7,29 | 0,95 | -5,41 | 0,6594 | -0,1169 | |||
| JCI / Johnson Controls International plc | 0,01 | -1,68 | 0,93 | 29,65 | 0,6469 | 0,0910 | |||
| GIS / General Mills, Inc. | 0,02 | -1,31 | 0,89 | -14,48 | 0,6220 | -0,1883 | |||
| APD / Air Products and Chemicals, Inc. | 0,00 | 2,67 | 0,86 | -1,84 | 0,5968 | -0,0804 | |||
| GD / General Dynamics Corporation | 0,00 | 48,33 | 0,82 | 58,75 | 0,5692 | 0,1697 | |||
| CVS / CVS Health Corporation | 0,01 | -0,75 | 0,78 | 1,04 | 0,5441 | -0,0557 | |||
| BND / Vanguard Bond Index Funds - Vanguard Total Bond Market ETF | 0,01 | 0,00 | 0,75 | 0,27 | 0,5246 | -0,0584 | |||
| LLY / Eli Lilly and Company | 0,00 | 0,52 | 0,75 | -5,07 | 0,5224 | -0,0910 | |||
| LMT / Lockheed Martin Corporation | 0,00 | 0,63 | 0,74 | 4,35 | 0,5193 | -0,0352 | |||
| PM / Philip Morris International Inc. | 0,00 | 0,00 | 0,74 | 14,80 | 0,5141 | 0,0150 | |||
| CATH / Global X Funds - Global X S&P 500 Catholic Values ETF | 0,01 | 0,00 | 0,70 | 11,84 | 0,4874 | 0,0013 | |||
| IWN / iShares Trust - iShares Russell 2000 Value ETF | 0,00 | -9,05 | 0,68 | -5,01 | 0,4762 | -0,0821 | |||
| WMT / Walmart Inc. | 0,01 | 0,72 | 0,64 | 12,08 | 0,4469 | 0,0031 | |||
| GE / General Electric Company | 0,00 | 3,74 | 0,62 | 33,55 | 0,4331 | 0,0714 | |||
| B / Barrick Mining Corporation | 0,03 | 0,60 | 0,4184 | 0,4184 | |||||
| MMM / 3M Company | 0,00 | -0,64 | 0,59 | 2,99 | 0,4091 | -0,0334 | |||
| FDVV / Fidelity Covington Trust - Fidelity High Dividend ETF | 0,01 | 2,51 | 0,55 | 7,60 | 0,3853 | -0,0140 | |||
| JPM / JPMorgan Chase & Co. | 0,00 | 10,41 | 0,55 | 30,64 | 0,3838 | 0,0561 | |||
| TBIL / The RBB Fund, Inc. - F/m US Treasury 3 Month Bill ETF | 0,01 | 5,95 | 0,53 | 5,75 | 0,3723 | -0,0193 | |||
| GLW / Corning Incorporated | 0,01 | 0,01 | 0,53 | 14,87 | 0,3719 | 0,0113 | |||
| CGDV / Capital Group Dividend Value ETF | 0,01 | 0,49 | 0,3421 | 0,3421 | |||||
| CSCO / Cisco Systems, Inc. | 0,01 | 7,69 | 0,49 | 20,95 | 0,3387 | 0,0271 | |||
| GOOGL / Alphabet Inc. | 0,00 | 5,48 | 0,46 | 20,05 | 0,3220 | 0,0236 | |||
| VUG / Vanguard Index Funds - Vanguard Growth ETF | 0,00 | 0,00 | 0,45 | 18,21 | 0,3127 | 0,0180 | |||
| BMY / Bristol-Myers Squibb Company | 0,01 | 0,00 | 0,41 | -24,07 | 0,2862 | -0,1339 | |||
| ABT / Abbott Laboratories | 0,00 | 10,29 | 0,39 | 13,04 | 0,2725 | 0,0040 | |||
| MDT / Medtronic plc | 0,00 | 2,81 | 0,38 | -0,26 | 0,2670 | -0,0312 | |||
| ORCL / Oracle Corporation | 0,00 | -26,72 | 0,37 | 14,38 | 0,2558 | 0,0071 | |||
| AMZN / Amazon.com, Inc. | 0,00 | 0,36 | 0,2500 | 0,2500 | |||||
| BRK.B / Berkshire Hathaway Inc. | 0,00 | 0,41 | 0,36 | -8,25 | 0,2483 | -0,0537 | |||
| IR / Ingersoll Rand Inc. | 0,00 | 0,00 | 0,35 | 4,13 | 0,2463 | -0,0177 | |||
| IYW / iShares Trust - iShares U.S. Technology ETF | 0,00 | 0,00 | 0,35 | 23,57 | 0,2416 | 0,0234 | |||
| DOW / Dow Inc. | 0,01 | -6,53 | 0,34 | -29,22 | 0,2404 | -0,1374 | |||
| BAC / Bank of America Corporation | 0,01 | 0,00 | 0,34 | 13,38 | 0,2368 | 0,0042 | |||
| LOW / Lowe's Companies, Inc. | 0,00 | 5,15 | 0,34 | 0,00 | 0,2367 | -0,0269 | |||
| COST / Costco Wholesale Corporation | 0,00 | -18,29 | 0,33 | -14,47 | 0,2311 | -0,0700 | |||
| XLK / The Select Sector SPDR Trust - The Technology Select Sector SPDR Fund | 0,00 | 0,00 | 0,33 | 22,76 | 0,2295 | 0,0210 | |||
| NFLX / Netflix, Inc. | 0,00 | 1,70 | 0,32 | 46,12 | 0,2232 | 0,0529 | |||
| RPM / RPM International Inc. | 0,00 | 0,00 | 0,31 | -4,85 | 0,2190 | -0,0380 | |||
| GEV / GE Vernova Inc. | 0,00 | 0,31 | 0,2144 | 0,2144 | |||||
| AEP / American Electric Power Company, Inc. | 0,00 | 0,00 | 0,31 | -4,97 | 0,2136 | -0,0370 | |||
| AZN / AstraZeneca PLC - Depositary Receipt (Common Stock) | 0,00 | 13,43 | 0,30 | 8,19 | 0,2120 | -0,0070 | |||
| CEG / Constellation Energy Corporation | 0,00 | 0,30 | 0,2118 | 0,2118 | |||||
| SGOV / iShares Trust - iShares 0-3 Month Treasury Bond ETF | 0,00 | 36,36 | 0,30 | 36,65 | 0,2106 | 0,0386 | |||
| GOOG / Alphabet Inc. | 0,00 | 4,33 | 0,30 | 18,47 | 0,2058 | 0,0123 | |||
| WPC / W. P. Carey Inc. | 0,00 | -3,45 | 0,29 | -4,32 | 0,2008 | -0,0336 | |||
| OC / Owens Corning | 0,00 | 9,91 | 0,27 | 5,79 | 0,1914 | -0,0101 | |||
| V / Visa Inc. | 0,00 | 25,20 | 0,27 | 26,64 | 0,1894 | 0,0231 | |||
| HON / Honeywell International Inc. | 0,00 | 18,07 | 0,27 | 29,81 | 0,1889 | 0,0268 | |||
| AFL / Aflac Incorporated | 0,00 | 0,27 | 0,1878 | 0,1878 | |||||
| SPLG / SPDR Series Trust - SPDR Portfolio S&P 500 ETF | 0,00 | 20,20 | 0,27 | 33,17 | 0,1876 | 0,0303 | |||
| AMGN / Amgen Inc. | 0,00 | 36,43 | 0,26 | 22,27 | 0,1801 | 0,0160 | |||
| VTI / Vanguard Index Funds - Vanguard Total Stock Market ETF | 0,00 | 0,00 | 0,26 | 10,78 | 0,1795 | -0,0013 | |||
| WY / Weyerhaeuser Company | 0,01 | 8,01 | 0,25 | -5,38 | 0,1722 | -0,0302 | |||
| TGT / Target Corporation | 0,00 | 9,20 | 0,24 | 3,52 | 0,1641 | -0,0130 | |||
| CRBN / iShares Trust - iShares MSCI ACWI Low Carbon Target ETF | 0,00 | 0,24 | 0,1639 | 0,1639 | |||||
| NUE / Nucor Corporation | 0,00 | 0,00 | 0,23 | 7,87 | 0,1627 | -0,0056 | |||
| NAD / Nuveen Quality Municipal Income Fund | 0,02 | -8,99 | 0,22 | -11,07 | 0,1520 | -0,0378 | |||
| EFA / iShares Trust - iShares MSCI EAFE ETF | 0,00 | -10,03 | 0,22 | -1,37 | 0,1509 | -0,0199 | |||
| D / Dominion Energy, Inc. | 0,00 | 0,00 | 0,21 | 0,97 | 0,1455 | -0,0153 | |||
| BDJ / BlackRock Enhanced Equity Dividend Trust | 0,02 | 0,03 | 0,20 | 3,59 | 0,1411 | -0,0109 | |||
| CTVA / Corteva, Inc. | 0,00 | 0,20 | 0,1404 | 0,1404 | |||||
| AMT / American Tower Corporation | 0,00 | 0,20 | 0,1398 | 0,1398 | |||||
| AZZ / AZZ Inc. | 0,00 | -100,00 | 0,00 | 0,0000 | |||||
| WBA / Walgreens Boots Alliance, Inc. | 0,00 | -100,00 | 0,00 | 0,0000 | |||||
| CMCSA / Comcast Corporation | 0,00 | -100,00 | 0,00 | 0,0000 | |||||
| KHC / The Kraft Heinz Company | 0,00 | -100,00 | 0,00 | 0,0000 | |||||
| GOLD / Barrick Mining Corporation | 0,00 | -100,00 | 0,00 | 0,0000 |