Grundlæggende statistik
| Porteføljeværdi | $ 168.360.314 |
| Nuværende stillinger | 93 |
Seneste beholdninger, ydeevne, AUM (fra 13F, 13D)
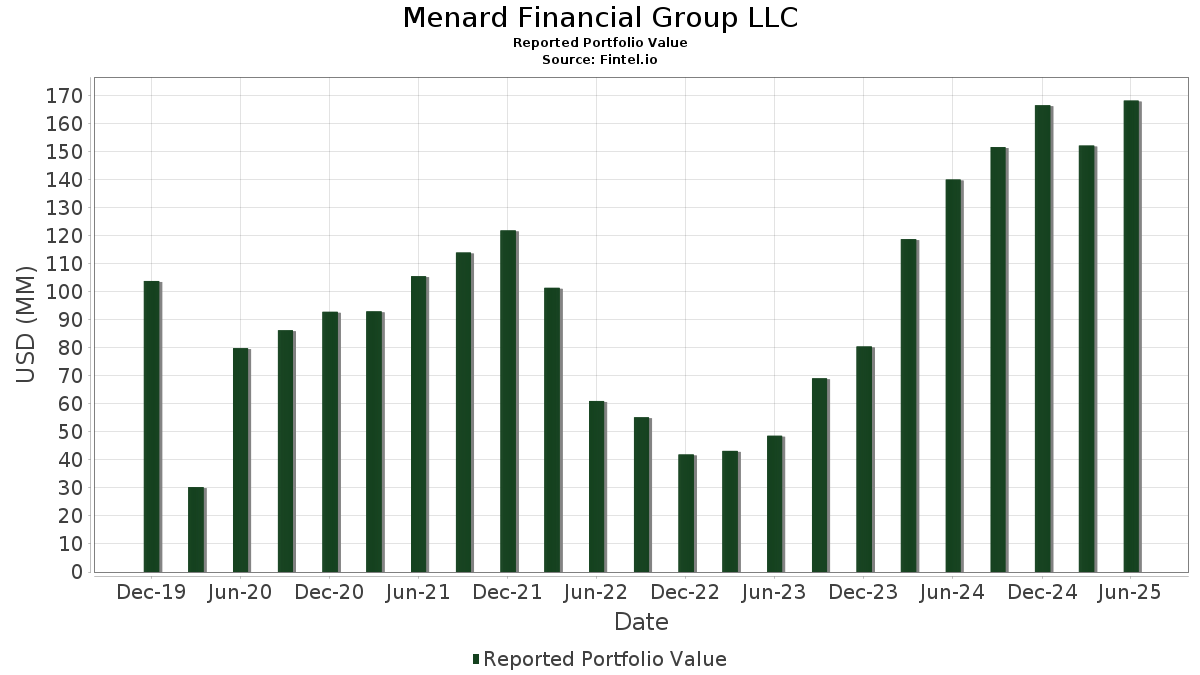
Menard Financial Group LLC har afsløret 93 samlede besiddelser i deres seneste SEC-arkivering. Den seneste porteføljeværdi er beregnet til at være $ 168.360.314 USD. Faktiske aktiver under forvaltning (AUM) er denne værdi plus kontanter (som ikke er oplyst). Menard Financial Group LLCs største beholdninger er Zacks Trust - Zacks Earnings Consistent Portfolio ETF (US:ZECP) , NVIDIA Corporation (US:NVDA) , Meta Platforms, Inc. (US:META) , Amazon.com, Inc. (US:AMZN) , and Microsoft Corporation (US:MSFT) . Menard Financial Group LLCs nye stillinger omfatter GE Vernova Inc. (US:GEV) , Coupang, Inc. (US:CPNG) , Amphenol Corporation (US:APH) , Brinker International, Inc. (US:EAT) , and .
Top øger dette kvartal
Vi bruger ændringen i porteføljeallokeringen, fordi dette er den mest meningsfulde metrik. Ændringer kan skyldes handler eller ændringer i aktiekurser.
| Sikkerhed | Aktier (MM) |
Værdi (MM$) |
Portefølje % | ΔPortefølje % |
|---|---|---|---|---|
| 0,10 | 15,43 | 9,1673 | 1,7812 | |
| 0,02 | 5,35 | 3,1807 | 0,7308 | |
| 0,00 | 1,38 | 0,8197 | 0,5154 | |
| 0,00 | 0,80 | 0,4776 | 0,4776 | |
| 0,00 | 1,15 | 0,6829 | 0,4602 | |
| 0,00 | 0,54 | 0,3212 | 0,3212 | |
| 0,01 | 0,52 | 0,3079 | 0,3079 | |
| 0,01 | 2,18 | 1,2932 | 0,2824 | |
| 0,02 | 0,47 | 0,2787 | 0,2787 | |
| 0,04 | 7,79 | 4,6260 | 0,2692 |
Top falder i dette kvartal
Vi bruger ændringen i porteføljeallokeringen, fordi dette er den mest meningsfulde metrik. Ændringer kan skyldes handler eller ændringer i aktiekurser.
| Sikkerhed | Aktier (MM) |
Værdi (MM$) |
Portefølje % | ΔPortefølje % |
|---|---|---|---|---|
| 0,00 | 0,40 | 0,2400 | -1,0057 | |
| 1,33 | 42,31 | 25,1292 | -0,4894 | |
| 0,00 | 0,00 | -0,2638 | ||
| 0,03 | 2,39 | 1,4217 | -0,1887 | |
| 0,09 | 2,50 | 1,4843 | -0,1446 | |
| 0,00 | 1,20 | 0,7110 | -0,1357 | |
| 0,01 | 2,63 | 1,5646 | -0,1339 | |
| 0,04 | 1,98 | 1,1776 | -0,1335 | |
| 0,01 | 0,41 | 0,2415 | -0,1311 | |
| 0,01 | 2,19 | 1,3034 | -0,1266 |
13F og Fondsarkivering
Denne formular blev indsendt den 2025-08-13 for rapporteringsperioden 2025-06-30. Klik på linkikonet for at se den fulde transaktionshistorik.
Opgrader for at låse op for premium-data og eksportere til Excel ![]() .
.
| Sikkerhed | Type | Gennemsnitlig aktiekurs | Aktier (MM) |
Δ Aktier (%) |
Δ Aktier (%) |
Værdi ($MM) |
Portefølje (%) |
ΔPortefølje (%) |
|
|---|---|---|---|---|---|---|---|---|---|
| ZECP / Zacks Trust - Zacks Earnings Consistent Portfolio ETF | 1,33 | 1,71 | 42,31 | 8,44 | 25,1292 | -0,4894 | |||
| NVDA / NVIDIA Corporation | 0,10 | -1,39 | 15,43 | 37,22 | 9,1673 | 1,7812 | |||
| META / Meta Platforms, Inc. | 0,01 | -8,94 | 8,14 | 14,43 | 4,8367 | 0,1641 | |||
| AMZN / Amazon.com, Inc. | 0,04 | -1,01 | 7,79 | 17,38 | 4,6260 | 0,2692 | |||
| MSFT / Microsoft Corporation | 0,01 | -1,19 | 5,79 | 13,44 | 3,4386 | 0,0873 | |||
| AVGO / Broadcom Inc. | 0,02 | 4,18 | 5,35 | 43,50 | 3,1807 | 0,7308 | |||
| PLTR / Palantir Technologies Inc. | 0,03 | -2,57 | 3,45 | 22,03 | 2,0463 | 0,1922 | |||
| SPOT / Spotify Technology S.A. | 0,00 | -0,93 | 3,04 | 20,14 | 1,8035 | 0,1438 | |||
| AAPL / Apple Inc. | 0,01 | -1,47 | 2,63 | 1,86 | 1,5646 | -0,1339 | |||
| PYLD / PIMCO ETF Trust - PIMCO Multisector Bond Active Exchange-Traded Fund | 0,09 | -1,39 | 2,50 | 0,77 | 1,4843 | -0,1446 | |||
| AXON / Axon Enterprise, Inc. | 0,00 | -2,84 | 2,46 | 33,71 | 1,4630 | 0,2533 | |||
| UBER / Uber Technologies, Inc. | 0,03 | -2,42 | 2,45 | 6,10 | 1,4576 | -0,0616 | |||
| XOM / Exxon Mobil Corporation | 0,02 | -0,91 | 2,41 | 2,03 | 1,4329 | -0,1199 | |||
| BOND / PIMCO ETF Trust - PIMCO Active Bond Exchange-Traded Fund | 0,03 | -3,69 | 2,39 | -2,41 | 1,4217 | -0,1887 | |||
| GOOGL / Alphabet Inc. | 0,01 | -1,92 | 2,37 | 5,91 | 1,4056 | -0,0618 | |||
| V / Visa Inc. | 0,01 | -1,33 | 2,19 | 0,78 | 1,3034 | -0,1266 | |||
| JPM / JPMorgan Chase & Co. | 0,01 | 21,60 | 2,18 | 41,46 | 1,2932 | 0,2824 | |||
| NFLX / Netflix, Inc. | 0,00 | -2,08 | 2,15 | 15,26 | 1,2742 | 0,0521 | |||
| BBHY / J.P. Morgan Exchange-Traded Fund Trust - JPMorgan BetaBuilders USD High Yield Corporate Bond ETF | 0,04 | -3,37 | 1,98 | -0,70 | 1,1776 | -0,1335 | |||
| PANW / Palo Alto Networks, Inc. | 0,01 | 9,34 | 1,74 | 18,58 | 1,0313 | 0,0699 | |||
| CVX / Chevron Corporation | 0,01 | -4,91 | 1,71 | 0,41 | 1,0174 | -0,1026 | |||
| XLK / The Select Sector SPDR Trust - The Technology Select Sector SPDR Fund | 0,01 | -1,43 | 1,71 | 16,79 | 1,0166 | 0,0546 | |||
| JCPB / J.P. Morgan Exchange-Traded Fund Trust - JPMorgan Core Plus Bond ETF | 0,03 | -2,98 | 1,49 | -1,65 | 0,8856 | -0,1098 | |||
| ABBV / AbbVie Inc. | 0,01 | 4,48 | 1,48 | 3,65 | 0,8764 | -0,0585 | |||
| TSLA / Tesla, Inc. | 0,00 | -1,65 | 1,44 | 13,42 | 0,8540 | 0,0219 | |||
| PG / The Procter & Gamble Company | 0,01 | -1,45 | 1,42 | -1,39 | 0,8430 | -0,1021 | |||
| PWR / Quanta Services, Inc. | 0,00 | 150,17 | 1,38 | 198,06 | 0,8197 | 0,5154 | |||
| HD / The Home Depot, Inc. | 0,00 | -1,15 | 1,29 | 0,86 | 0,7684 | -0,0737 | |||
| CAT / Caterpillar Inc. | 0,00 | -2,08 | 1,21 | 18,47 | 0,7166 | 0,0478 | |||
| AJG / Arthur J. Gallagher & Co. | 0,00 | -1,92 | 1,20 | -7,21 | 0,7110 | -0,1357 | |||
| MCK / McKesson Corporation | 0,00 | 228,93 | 1,15 | 238,94 | 0,6829 | 0,4602 | |||
| TMUS / T-Mobile US, Inc. | 0,00 | 1,50 | 1,14 | -4,76 | 0,6782 | -0,1087 | |||
| BR / Broadridge Financial Solutions, Inc. | 0,00 | -2,50 | 1,12 | 1,45 | 0,6651 | -0,0596 | |||
| BAC / Bank of America Corporation | 0,02 | 0,22 | 1,12 | 16,15 | 0,6627 | 0,0318 | |||
| DE / Deere & Company | 0,00 | -3,01 | 1,10 | 3,78 | 0,6527 | -0,0425 | |||
| SHOP / Shopify Inc. | 0,01 | -4,14 | 1,08 | 17,92 | 0,6410 | 0,0397 | |||
| JEPI / J.P. Morgan Exchange-Traded Fund Trust - JPMorgan Equity Premium Income ETF | 0,02 | -1,34 | 0,97 | 1,26 | 0,5747 | -0,0527 | |||
| CACI / CACI International Inc | 0,00 | -2,92 | 0,95 | -1,76 | 0,5649 | -0,0714 | |||
| BRK.B / Berkshire Hathaway Inc. | 0,00 | -2,25 | 0,89 | -7,31 | 0,5271 | -0,1016 | |||
| VRTX / Vertex Pharmaceuticals Incorporated | 0,00 | 9,48 | 0,87 | 8,36 | 0,5159 | -0,0107 | |||
| COST / Costco Wholesale Corporation | 0,00 | -2,68 | 0,86 | -4,64 | 0,5133 | -0,0819 | |||
| CRWD / CrowdStrike Holdings, Inc. | 0,00 | 0,06 | 0,86 | 15,07 | 0,5079 | 0,0196 | |||
| APO / Apollo Global Management, Inc. | 0,01 | -3,09 | 0,84 | 6,30 | 0,5018 | -0,0200 | |||
| COP / ConocoPhillips | 0,01 | 0,44 | 0,84 | 2,93 | 0,5007 | -0,0374 | |||
| RCL / Royal Caribbean Cruises Ltd. | 0,00 | 0,80 | 0,4776 | 0,4776 | |||||
| NET / Cloudflare, Inc. | 0,00 | -2,53 | 0,79 | 56,02 | 0,4704 | 0,1372 | |||
| JPIE / J.P. Morgan Exchange-Traded Fund Trust - JPMorgan Income ETF | 0,02 | -1,52 | 0,78 | -0,38 | 0,4633 | -0,0503 | |||
| ITRI / Itron, Inc. | 0,01 | -0,59 | 0,77 | 22,66 | 0,4598 | 0,0454 | |||
| GOOG / Alphabet Inc. | 0,00 | -0,58 | 0,76 | 6,78 | 0,4493 | -0,0160 | |||
| LLY / Eli Lilly and Company | 0,00 | -3,41 | 0,66 | -2,79 | 0,3940 | -0,0543 | |||
| CBRE / CBRE Group, Inc. | 0,00 | -3,16 | 0,64 | 9,42 | 0,3800 | -0,0035 | |||
| CASY / Casey's General Stores, Inc. | 0,00 | -3,26 | 0,64 | 5,65 | 0,3782 | -0,0175 | |||
| TOST / Toast, Inc. | 0,01 | -1,26 | 0,60 | 24,27 | 0,3562 | 0,0392 | |||
| ROL / Rollins, Inc. | 0,01 | -2,37 | 0,59 | -2,95 | 0,3518 | -0,0493 | |||
| ZS / Zscaler, Inc. | 0,00 | -1,68 | 0,59 | 32,36 | 0,3502 | 0,0578 | |||
| A / Agilent Technologies, Inc. | 0,00 | 0,00 | 0,58 | 12,04 | 0,3431 | 0,0048 | |||
| PHM / PulteGroup, Inc. | 0,01 | 1,10 | 0,55 | 5,75 | 0,3284 | -0,0150 | |||
| HOOD / Robinhood Markets, Inc. | 0,01 | -2,33 | 0,55 | 87,71 | 0,3269 | 0,1345 | |||
| GEV / GE Vernova Inc. | 0,00 | 0,54 | 0,3212 | 0,3212 | |||||
| HWM / Howmet Aerospace Inc. | 0,00 | -0,92 | 0,54 | 18,46 | 0,3203 | 0,0211 | |||
| ACA / Arcosa, Inc. | 0,01 | -3,25 | 0,53 | -2,41 | 0,3126 | -0,0415 | |||
| LRCX / Lam Research Corporation | 0,01 | 0,52 | 0,3079 | 0,3079 | |||||
| FN / Fabrinet | 0,00 | -1,05 | 0,50 | 42,17 | 0,2968 | 0,0663 | |||
| CPNG / Coupang, Inc. | 0,02 | 0,47 | 0,2787 | 0,2787 | |||||
| STLD / Steel Dynamics, Inc. | 0,00 | -3,77 | 0,44 | -6,22 | 0,2601 | -0,0461 | |||
| PSTG / Pure Storage, Inc. | 0,01 | -40,79 | 0,41 | -28,40 | 0,2415 | -0,1311 | |||
| UNH / UnitedHealth Group Incorporated | 0,00 | -73,07 | 0,40 | -78,70 | 0,2400 | -1,0057 | |||
| APH / Amphenol Corporation | 0,00 | 0,40 | 0,2366 | 0,2366 | |||||
| ZM / Zoom Communications Inc. | 0,01 | -1,63 | 0,39 | -1,75 | 0,2345 | -0,0293 | |||
| TWLO / Twilio Inc. | 0,00 | -2,25 | 0,39 | 20,43 | 0,2313 | 0,0191 | |||
| TSM / Taiwan Semiconductor Manufacturing Company Limited - Depositary Receipt (Common Stock) | 0,00 | -1,50 | 0,39 | 29,53 | 0,2298 | 0,0336 | |||
| BJ / BJ's Wholesale Club Holdings, Inc. | 0,00 | 0,23 | 0,38 | -9,67 | 0,2276 | -0,0514 | |||
| ANET / Arista Networks Inc | 0,00 | -0,56 | 0,37 | 12,31 | 0,2169 | 0,0030 | |||
| FANG / Diamondback Energy, Inc. | 0,00 | 0,00 | 0,35 | 4,12 | 0,2107 | -0,0130 | |||
| ORCL / Oracle Corporation | 0,00 | 6,36 | 0,35 | 57,33 | 0,2106 | 0,0627 | |||
| MLM / Martin Marietta Materials, Inc. | 0,00 | 0,00 | 0,34 | 2,70 | 0,2031 | -0,0157 | |||
| GILD / Gilead Sciences, Inc. | 0,00 | 2,69 | 0,33 | 16,38 | 0,1989 | 0,0099 | |||
| PLD / Prologis, Inc. | 0,00 | 0,06 | 0,33 | 0,60 | 0,1980 | -0,0194 | |||
| BXP / Boston Properties, Inc. | 0,00 | 0,29 | 0,33 | 5,73 | 0,1973 | -0,0089 | |||
| ORLY / O'Reilly Automotive, Inc. | 0,00 | 1.400,00 | 0,32 | -2,73 | 0,1911 | -0,0256 | |||
| OKTA / Okta, Inc. | 0,00 | 7,99 | 0,32 | -7,83 | 0,1894 | -0,0377 | |||
| EAT / Brinker International, Inc. | 0,00 | 0,29 | 0,1701 | 0,1701 | |||||
| MWA / Mueller Water Products, Inc. | 0,01 | 0,29 | 0,28 | -4,73 | 0,1679 | -0,0270 | |||
| CARR / Carrier Global Corporation | 0,00 | 0,28 | 0,1652 | 0,1652 | |||||
| POR / Portland General Electric Company | 0,01 | -0,63 | 0,24 | -5,18 | 0,1416 | -0,0235 | |||
| AIZ / Assurant, Inc. | 0,00 | 0,24 | 0,1398 | 0,1398 | |||||
| IVW / iShares Trust - iShares S&P 500 Growth ETF | 0,00 | 0,00 | 0,23 | 14,71 | 0,1392 | 0,0048 | |||
| VRT / Vertiv Holdings Co | 0,00 | 0,22 | 0,1315 | 0,1315 | |||||
| WMT / Walmart Inc. | 0,00 | 0,00 | 0,22 | -0,45 | 0,1301 | -0,0149 | |||
| JNJ / Johnson & Johnson | 0,00 | 0,00 | 0,21 | -0,94 | 0,1257 | -0,0148 | |||
| GE / General Electric Company | 0,00 | 0,21 | 0,1255 | 0,1255 | |||||
| COR / Cencora, Inc. | 0,00 | 0,00 | 0,21 | 2,97 | 0,1238 | -0,0089 | |||
| KO / The Coca-Cola Company | 0,00 | 0,00 | 0,20 | -1,47 | 0,1199 | -0,0145 | |||
| CTRA / Coterra Energy Inc. | 0,00 | -100,00 | 0,00 | 0,0000 | |||||
| SBUX / Starbucks Corporation | 0,00 | -100,00 | 0,00 | 0,0000 | |||||
| DOC / Healthpeak Properties, Inc. | 0,00 | -100,00 | 0,00 | 0,0000 | |||||
| GPK / Graphic Packaging Holding Company | 0,00 | -100,00 | 0,00 | 0,0000 | |||||
| SKY / Champion Homes, Inc. | 0,00 | -100,00 | 0,00 | 0,0000 | |||||
| INTA / Intapp, Inc. | 0,00 | -100,00 | 0,00 | 0,0000 | |||||
| OC / Owens Corning | 0,00 | -100,00 | 0,00 | 0,0000 | |||||
| WTFC / Wintrust Financial Corporation | 0,00 | -100,00 | 0,00 | 0,0000 | |||||
| PFE / Pfizer Inc. | 0,00 | -100,00 | 0,00 | 0,0000 | |||||
| EME / EMCOR Group, Inc. | 0,00 | -100,00 | 0,00 | 0,0000 | |||||
| TEAM / Atlassian Corporation | 0,00 | -100,00 | 0,00 | 0,0000 | |||||
| HUBS / HubSpot, Inc. | 0,00 | -100,00 | 0,00 | 0,0000 | |||||
| ZTS / Zoetis Inc. | 0,00 | -100,00 | 0,00 | 0,0000 | |||||
| MRVL / Marvell Technology, Inc. | 0,00 | -100,00 | 0,00 | -100,00 | -0,2638 |