Grundlæggende statistik
| Institutionelle ejere | 714 total, 682 long only, 3 short only, 29 long/short - change of 7,30% MRQ |
| Gennemsnitlig porteføljeallokering | 0.3077 % - change of -7,22% MRQ |
| Institutionelle aktier (lange) | 102.149.958 (ex 13D/G) - change of -0,41MM shares -0,50% MRQ |
| Institutionel værdi (lang) | $ 6.088.047 USD ($1000) |
Institutionelt ejerskab og aktionærer
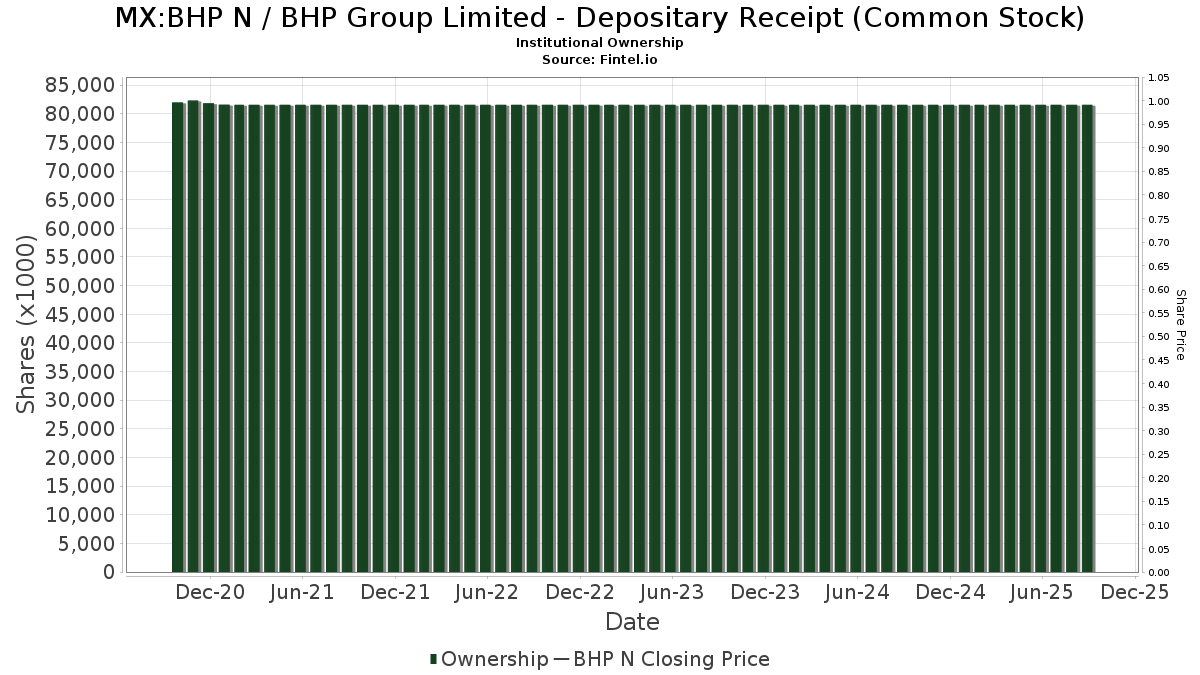
BHP Group Limited - Depositary Receipt (Common Stock) (MX:BHP N) har 714 institutionelle ejere og aktionærer, der har indsendt 13D/G- eller 13F-formularer til Securities Exchange Commission (SEC). Disse institutioner har i alt 102,149,958 aktier. Største aktionærer omfatter Fisher Asset Management, LLC, Morgan Stanley, Goldman Sachs Group Inc, Wellington Management Group Llp, Dimensional Fund Advisors Lp, Bank Of America Corp /de/, BlackRock, Inc., Neuberger Berman Group LLC, Northern Trust Corp, and Citigroup Inc .
BHP Group Limited - Depositary Receipt (Common Stock) (BMV:BHP N) institutionel ejerskabsstruktur viser aktuelle positioner i virksomheden efter institutioner og fonde, samt seneste ændringer i positionsstørrelse. Større aktionærer kan omfatte individuelle investorer, investeringsforeninger, hedgefonde eller institutioner. Skema 13D angiver, at investoren besidder (eller besidder) mere end 5 % af virksomheden og har til hensigt (eller har til hensigt at) aktivt at forfølge en ændring i forretningsstrategi. Skema 13G indikerer en passiv investering på over 5%.
Fondens stemningsscore
Fund Sentiment Score (fka Ownership Accumulation Score) finder de aktier, der bliver mest købt af fonde. Det er resultatet af en sofistikeret, multi-faktor kvantitativ model, der identificerer virksomheder med de højeste niveauer af institutionel akkumulering. Scoringsmodellen bruger en kombination af den samlede stigning i oplyste ejere, ændringerne i porteføljeallokeringer i disse ejere og andre målinger. Tallet går fra 0 til 100, hvor højere tal indikerer et højere niveau af akkumulering for sine jævnaldrende, og 50 er gennemsnittet.
Opdateringsfrekvens: Dagligt
Se Ownership Explorer, som giver en liste over højest rangerende virksomheder.
AI+ Ask Fintel’s AI assistant about BHP Group Limited - Depositary Receipt (Common Stock).
Select a question to share a public post with an AI-crafted answer.
Thinking of good questions…
13F og NPORT arkivering
Detaljer om 13F-arkivering er gratis. Detaljer om NP-ansøgninger kræver et premium-medlemskab. Grønne rækker angiver nye positioner. Røde rækker angiver lukkede positioner. Klik på linket ikon for at se den fulde transaktionshistorik.
Opgrader
for at låse premium-data op og eksportere til Excel ![]() .
.
| Fil dato | Kilde | Investor | Type | Gennemsnitlig pris (Øst) |
Aktier | Δ Aktier (%) |
Rapporteret Værdi ($1000) |
Δ Værdi (%) |
Port Alloc (%) |
|
|---|---|---|---|---|---|---|---|---|---|---|
| 2026-02-12 | 13F | Principal Securities, Inc. | 14.185 | 4,06 | 856 | 12,78 | ||||
| 2026-04-28 | 13F | Integral Investment Advisors, Inc. | 3.477 | -16,82 | 253 | 0,00 | ||||
| 2026-02-10 | 13F | Peapack Gladstone Financial Corp | 48.910 | -7,74 | 3 | 0,00 | ||||
| 2026-02-10 | 13F | Envestnet Asset Management Inc | 275.792 | -43,34 | 16.650 | -38,65 | ||||
| 2025-11-14 | 13F | Credit Agricole S A | 0 | -100,00 | 0 | |||||
| 2026-02-11 | 13F | Fox Run Management, L.l.c. | 6.739 | 407 | ||||||
| 2026-04-20 | 13F | Sowell Financial Services LLC | 5.770 | -15,90 | 420 | 1,21 | ||||
| 2026-02-04 | 13F | Marco Investment Management Llc | 28.934 | -5,55 | 1.747 | 2,28 | ||||
| 2026-02-11 | 13F | SOUTH STATE Corp | 30.361 | 2,63 | 1.833 | 11,10 | ||||
| 2026-01-15 | 13F | Royal Fund Management, LLC | 27.497 | 26,30 | 1.660 | 36,77 | ||||
| 2026-01-26 | 13F | AE Wealth Management LLC | 9.227 | 4,50 | 557 | 13,21 | ||||
| 2026-02-19 | 13F | Mcguire Capital Advisors Inc | 20 | 1 | ||||||
| 2026-01-30 | 13F | Laurel Wealth Advisors LLC | 88 | 5 | ||||||
| 2026-04-15 | 13F | Myriad Asset Management US LP | 12.243 | 891 | ||||||
| 2025-11-12 | 13F | CIBC Bancorp USA Inc. | 759.337 | 42.333 | ||||||
| 2026-02-13 | 13F | Schroder Investment Management Group | 17.557 | -6,25 | 1.070 | 1,62 | ||||
| 2026-02-17 | 13F | Palogic Value Management, L.P. | 86.039 | 0,66 | 5.194 | 9,00 | ||||
| 2026-04-07 | 13F | CoreCap Advisors, LLC | 1.967 | 51,08 | 143 | 83,33 | ||||
| 2026-02-09 | 13F | Frazier Financial Advisors, LLC | 500 | -2,72 | 30 | 7,14 | ||||
| 2025-11-14 | 13F | Strategic Wealth Partners, Ltd. | 209 | 0,00 | 12 | 10,00 | ||||
| 2026-04-20 | 13F | Breakwater Capital Group | 7.639 | -0,65 | 556 | 19,61 | ||||
| 2026-01-28 | 13F | Geneos Wealth Management Inc. | 207 | -49,14 | 12 | -45,45 | ||||
| 2026-02-11 | 13F | Zions Bancorporation, National Association /ut/ | 202 | 13,48 | 12 | 33,33 | ||||
| 2026-04-08 | 13F | Olistico Wealth, LLC | 100 | 0,00 | 7 | 16,67 | ||||
| 2025-11-14 | 13F | Gluskin Sheff & Assoc Inc | 0 | -100,00 | 0 | |||||
| 2026-02-09 | 13F | Summitry Llc | 0 | -100,00 | 0 | |||||
| 2026-04-23 | 13F | Oppenheimer & Co Inc | 28.605 | 2.081 | ||||||
| 2026-02-04 | 13F | Ameritas Advisory Services, LLC | 0 | -100,00 | 0 | |||||
| 2026-03-04 | 13F | SHP Wealth Management | 267 | 16 | ||||||
| 2025-11-14 | 13F | ICONIQ Capital, LLC | 0 | -100,00 | 0 | |||||
| 2026-02-13 | 13F | Focused Alpha, Llc | 6.150 | 371 | ||||||
| 2026-01-12 | 13F | Salem Investment Counselors Inc | 0 | -100,00 | 0 | |||||
| 2026-04-16 | 13F | SG Americas Securities, LLC | Put | 0 | -100,00 | 0 | ||||
| 2026-02-10 | 13F | Argent Trust Co | 14.177 | -2,07 | 856 | 5,95 | ||||
| 2026-04-21 | 13F | Venturi Wealth Management, LLC | 11.184 | 49,76 | 814 | 80,67 | ||||
| 2026-02-06 | 13F | Lsv Asset Management | 65.595 | -17,07 | 4 | -25,00 | ||||
| 2026-02-10 | 13F | Pinnacle West Asset Management, Inc. | 9.375 | -1,06 | 1 | |||||
| 2026-04-22 | 13F | Spire Wealth Management | 996 | -36,92 | 72 | -24,21 | ||||
| 2026-02-10 | 13F | Lido Advisors, LLC | 6.989 | 1,47 | 391 | 1,56 | ||||
| 2026-02-13 | 13F | Kestra Advisory Services, LLC | 0 | -100,00 | 0 | |||||
| 2026-02-13 | 13F | Johnson Investment Counsel Inc | 0 | -100,00 | 0 | |||||
| 2026-02-17 | 13F | Creative Planning | 354.310 | 22,70 | 21.390 | 32,87 | ||||
| 2026-04-21 | 13F | Wesbanco Bank Inc | 4.725 | -1,40 | 344 | 18,69 | ||||
| 2026-04-10 | 13F | Centurion Wealth Management LLC | 4.700 | 0,00 | 342 | 20,49 | ||||
| 2026-02-17 | 13F | Clear Street Markets Llc | 2.200 | 0,00 | 133 | 8,20 | ||||
| 2026-04-27 | 13F | Mount Yale Investment Advisors, LLC | 3.045 | 221 | ||||||
| 2026-02-13 | 13F | Integrated Wealth Concepts LLC | 7.428 | -45,43 | 448 | -40,90 | ||||
| 2026-02-13 | 13F | AlTi Global, Inc. | 3.976 | 5,30 | 240 | 14,29 | ||||
| 2026-02-13 | 13F | Mosaic Financial Group, Llc | 10.000 | 0,00 | 1 | |||||
| 2026-04-02 | 13F | Ares Financial Consulting, LLC | 549 | 40 | ||||||
| 2026-02-12 | 13F | Intesa Sanpaolo Wealth Management | 800 | 48 | ||||||
| 2026-02-17 | 13F | Quantinno Capital Management LP | 406.226 | 28,61 | 24.524 | 39,26 | ||||
| 2026-02-12 | 13F | Dimensional Fund Advisors Lp | 3.625.889 | -6,53 | 218.903 | 1,21 | ||||
| 2026-02-13 | 13F | Corps Capital Advisors, LLC | 4.000 | 241 | ||||||
| 2026-02-13 | 13F | NLB Skladi, upravljanje premozenja, d.o.o. | 113.144 | 6.831 | ||||||
| 2026-02-17 | 13F | XTX Topco Ltd | 52.976 | 94,71 | 3.198 | 110,95 | ||||
| 2025-11-04 | 13F | Flaharty Asset Management, LLC | 0 | -100,00 | 0 | -100,00 | ||||
| 2026-04-09 | 13F | Pacifica Partners Inc. | 8.358 | 608 | ||||||
| 2026-02-17 | 13F | Citadel Advisors Llc | Call | 256.600 | 15,02 | 15.491 | 24,55 | |||
| 2026-02-17 | 13F | Citadel Advisors Llc | Put | 579.000 | 219,71 | 34.954 | 246,22 | |||
| 2026-02-17 | 13F | Citadel Advisors Llc | 1.280.623 | 446,32 | 77.311 | 491,61 | ||||
| 2026-02-17 | 13F | IHT Wealth Management, LLC | 8.012 | -3,94 | 484 | 4,09 | ||||
| 2026-01-15 | 13F | Allspring Global Investments Holdings, LLC | 19.137 | 41,50 | 1.203 | 62,87 | ||||
| 2026-02-05 | 13F | AlphaCore Capital LLC | 15.418 | -11,06 | 931 | -3,73 | ||||
| 2026-01-20 | 13F | SOA Wealth Advisors, LLC. | 225 | -49,32 | 14 | -45,83 | ||||
| 2026-04-10 | 13F | Armstrong Advisory Group, Inc | 160 | 0,00 | 12 | 22,22 | ||||
| 2026-02-13 | 13F | Williams Jones Wealth Management, LLC. | 5.069 | 0,00 | 306 | 8,51 | ||||
| 2026-02-10 | 13F | Savant Capital, LLC | 15.031 | 14,16 | 907 | 23,57 | ||||
| 2026-02-12 | 13F | CIBC Private Wealth Group, LLC | 788.140 | 4,02 | 47.580 | 12,64 | ||||
| 2026-02-17 | 13F | Tower Research Capital LLC (TRC) | 249 | -99,36 | 15 | -99,31 | ||||
| 2026-02-04 | 13F | HighPoint Advisor Group LLC | 4.448 | 11,17 | 269 | 20,18 | ||||
| 2026-04-09 | 13F | Moody National Bank Trust Division | 17.333 | -5,94 | 1.261 | 13,31 | ||||
| 2026-02-17 | 13F | Qube Research & Technologies Ltd | 144.880 | 768,06 | 6.516 | 600,65 | ||||
| 2026-01-23 | 13F | Westside Investment Management, Inc. | 197 | 0,00 | 12 | 20,00 | ||||
| 2026-02-12 | 13F | Hikari Tsushin, Inc. | 0 | -100,00 | 0 | |||||
| 2026-01-12 | 13F | Rialto Wealth Management, LLC | 91 | 0,00 | 5 | 0,00 | ||||
| 2026-02-04 | 13F | BCJ Capital Management, LLC | 4.212 | 13,41 | 254 | 22,71 | ||||
| 2026-02-17 | 13F | Qube Research & Technologies Ltd | Put | 3.600 | 0,00 | 217 | 8,50 | |||
| 2026-04-13 | 13F | Augustine Asset Management Inc | 63.580 | 19,90 | 4.625 | 44,45 | ||||
| 2026-02-17 | 13F | Balyasny Asset Management Llc | Put | 33.200 | 1.008 | |||||
| 2026-04-22 | 13F | Traveka Wealth, LLC | 5.078 | 4,12 | 369 | 25,51 | ||||
| 2026-02-17 | 13F | MIRAE ASSET GLOBAL ETFS HOLDINGS Ltd. | 44.347 | 162,16 | 2.677 | 183,88 | ||||
| 2026-02-12 | 13F | XY Capital Ltd | 0 | -100,00 | 0 | |||||
| 2025-11-07 | 13F | Beacon Capital Management, LLC | 0 | -100,00 | 0 | |||||
| 2026-04-23 | 13F | SevenBridge Financial Group, LLC | 9.264 | -1,44 | 746 | 17,30 | ||||
| 2026-01-28 | 13F | Retirement Planning Co of New England, Inc. | 5.082 | -1,65 | 307 | 6,25 | ||||
| 2026-02-09 | 13F | Knights of Columbus Asset Advisors LLC | 4.808 | 0,00 | 290 | 8,21 | ||||
| 2026-02-13 | 13F | Transamerica Financial Advisors, Inc. | 274 | 17 | ||||||
| 2026-04-09 | 13F | Nelson, Van Denburg & Campbell Wealth Management Group, LLC | 5.230 | 10,55 | 380 | 33,33 | ||||
| 2026-02-13 | 13F | Minot DeBlois Advisors LLC | 8.543 | 3,08 | 516 | 11,47 | ||||
| 2026-02-05 | 13F | Bessemer Group Inc | 6.856 | 3,78 | 0 | |||||
| 2026-02-23 | 13F | Wealth Preservation Advisors, LLC | 200 | -74,46 | 12 | -45,45 | ||||
| 2026-02-11 | 13F | Jpmorgan Chase & Co | 578.034 | 102,78 | 34.896 | 119,59 | ||||
| 2026-02-11 | 13F | Jpmorgan Chase & Co | Put | 50.000 | 0,00 | 3.018 | 8,29 | |||
| 2026-02-24 | 13F | DGS Capital Management, LLC | 23.361 | 5,80 | 1.410 | 14,54 | ||||
| 2026-02-10 | 13F | Td Asset Management Inc | 0 | -100,00 | 0 | |||||
| 2026-02-17 | 13F | Laird Norton Trust Company, Llc | 51.244 | 3.094 | ||||||
| 2026-01-29 | 13F | Dunhill Financial, LLC | 585 | -41,50 | 35 | -36,36 | ||||
| 2026-01-20 | 13F | Stratos Wealth Advisors, LLC | 0 | -100,00 | 0 | |||||
| 2026-02-05 | 13F | Roberts Glore & Co Inc /il/ | 4.265 | -1,16 | 257 | 7,08 | ||||
| 2026-03-12 | 13F/A | Peak6 Llc | Call | 1.438.400 | -13,36 | 86.836 | -6,18 | |||
| 2026-03-12 | 13F/A | Peak6 Llc | Put | 882.900 | 0,56 | 53.301 | 8,89 | |||
| 2026-04-08 | 13F | Arlington Trust Co LLC | 125 | 9 | ||||||
| 2026-01-23 | 13F | Rsm Us Wealth Management Llc | 20.565 | -42,46 | 1.253 | -37,15 | ||||
| 2026-02-12 | 13F | Quadrant Capital Group Llc | 66.308 | -1,25 | 4.003 | 6,95 | ||||
| 2026-04-09 | 13F | Acropolis Investment Management, LLC | 1.998 | 145 | ||||||
| 2026-04-07 | 13F | U.S. Capital Wealth Advisors, LLC | 12.800 | -14,70 | 931 | 2,87 | ||||
| 2026-02-17 | 13F | SageView Advisory Group, LLC | 429 | 26 | ||||||
| 2026-04-10 | 13F | Pure Financial Advisors, Inc. | 5.855 | 16,03 | 426 | 39,80 | ||||
| 2026-04-20 | 13F | Norway Savings Bank | 9.937 | -4,75 | 723 | 14,79 | ||||
| 2026-02-17 | 13F | LaSalle St. Investment Advisors, LLC | 7.286 | 5,67 | 0 | |||||
| 2026-02-13 | 13F | Centiva Capital, LP | Put | 1.048.800 | 63.316 | |||||
| 2026-02-03 | 13F | Manske Wealth Management | 13.384 | -4,60 | 808 | 3,20 | ||||
| 2026-02-11 | 13F | LPL Financial LLC | 247.963 | 20,97 | 14.970 | 31,00 | ||||
| 2026-02-10 | 13F | New Republic Capital, LLC | 7.554 | 456 | ||||||
| 2026-04-16 | 13F | Connective Portfolio Management, LLC | 20.000 | 1.455 | ||||||
| 2026-02-13 | 13F | Manufacturers Life Insurance Company, The | 0 | -100,00 | 0 | |||||
| 2026-02-14 | 13F | Frec Markets, Inc. | 5.010 | 302 | ||||||
| 2026-02-17 | 13F | Blair William & Co/il | 5.478 | 14,39 | 331 | 24,06 | ||||
| 2026-04-23 | 13F | Harbor Investment Advisory, Llc | 52 | 0,00 | 4 | 0,00 | ||||
| 2026-02-13 | 13F | Cornerstone Financial Management LLC | 86 | 5 | ||||||
| 2025-12-18 | 13F/A | Westwood Global Investments, LLC | 1.476.010 | 1,23 | 72.074 | -20,41 | ||||
| 2026-04-13 | 13F | Fractal Investments LLC | 9.000 | 0,00 | 655 | 20,44 | ||||
| 2025-11-07 | 13F | Sierra Ocean, Llc | 0 | -100,00 | 0 | -100,00 | ||||
| 2026-04-13 | 13F | Trust Co | 12 | 0,00 | 1 | |||||
| 2026-04-27 | 13F | Td Private Client Wealth Llc | 2.527 | 1.404,17 | 184 | 1.730,00 | ||||
| 2025-11-13 | 13F | Capital International Investors | 0 | -100,00 | 0 | |||||
| 2026-02-10 | 13F | Natixis Advisors, L.p. | 216.187 | -8,12 | 13 | 0,00 | ||||
| 2026-02-02 | 13F | Cornerstone Planning Group LLC | 232 | 25,41 | 16 | 60,00 | ||||
| 2025-11-14 | 13F | Atom Investors LP | 0 | -100,00 | 0 | |||||
| 2026-02-17 | 13F | Limestone Investment Advisors LP | Call | 17.800 | 1.075 | |||||
| 2026-01-26 | 13F | Private Trust Co Na | 301 | 0,00 | 18 | 12,50 | ||||
| 2026-02-17 | 13F | Limestone Investment Advisors LP | Put | 9.600 | 580 | |||||
| 2026-02-09 | 13F | Optimist Retirement Group LLC | 44.246 | -3,13 | 2.671 | 4,91 | ||||
| 2026-01-13 | 13F | Stephens Consulting, LLC | 98 | 6 | ||||||
| 2026-02-02 | 13F | Avidian Wealth Solutions, LLC | 7.531 | -0,63 | 455 | 7,58 | ||||
| 2026-02-17 | 13F | Sandler Capital Management | 46.732 | -18,11 | 2.821 | -11,32 | ||||
| 2026-01-21 | 13F | Newbridge Financial Services Group, Inc. | 168 | 0,00 | 10 | 11,11 | ||||
| 2026-02-17 | 13F | Tudor Investment Corp Et Al | Call | 0 | -100,00 | 0 | -100,00 | |||
| 2026-02-17 | 13F | Old Mission Capital Llc | 28.165 | 1.700 | ||||||
| 2026-01-28 | 13F | Salomon & Ludwin, LLC | 1.115 | 61,36 | 70 | 84,21 | ||||
| 2026-02-05 | 13F | Cambridge Investment Research Advisors, Inc. | 63.637 | -6,84 | 4 | 0,00 | ||||
| 2026-04-28 | 13F | Sage Rhino Capital Llc | 11.432 | 0,09 | 832 | 20,61 | ||||
| 2026-02-12 | 13F | Raiffeisen Bank International AG | Call | 0 | -100,00 | 0 | -100,00 | |||
| 2026-02-17 | 13F | Summit Trail Advisors, Llc | 0 | -100,00 | 0 | |||||
| 2026-02-09 | 13F | Hartland & Co., LLC | 384 | 562,07 | 23 | 666,67 | ||||
| 2026-02-10 | 13F | Foundations Investment Advisors, LLC | 207.331 | 12.517 | ||||||
| 2026-04-21 | 13F | Aaron Wealth Advisors LLC | 29.907 | 46,43 | 2.175 | 76,40 | ||||
| 2026-04-27 | 13F | Burford Brothers, Inc. | 12.628 | 4,56 | 919 | 25,93 | ||||
| 2026-02-03 | 13F | Washington Trust Advisors, Inc. | 0 | -100,00 | 0 | |||||
| 2026-02-09 | 13F | Avalon Trust Co | 400 | 24 | ||||||
| 2026-02-13 | 13F | Motiv8 Investments LLC | 377 | 0 | ||||||
| 2026-02-12 | 13F | Great Valley Advisor Group, Inc. | 3.742 | 0,59 | 226 | 8,70 | ||||
| 2026-01-28 | 13F | Chicago Partners Investment Group LLC | 7.465 | 0,59 | 504 | 19,15 | ||||
| 2026-02-13 | 13F | Northwest Bancshares, Inc. | 14.917 | -5,54 | 901 | 2,27 | ||||
| 2026-04-17 | 13F | HHM Wealth Advisors, LLC | 1.230 | 23,00 | 89 | 48,33 | ||||
| 2026-02-12 | 13F | Groupe la Francaise | 0 | -100,00 | 0 | |||||
| 2026-01-21 | 13F | Signature Resources Capital Management, LLC | 102 | 0,00 | 6 | 20,00 | ||||
| 2026-02-17 | 13F | American Trust Investment Advisors, LLC | 6.072 | 0,00 | 367 | 8,28 | ||||
| 2026-02-13 | 13F | Umb Bank N A/mo | 1.468 | -12,36 | 89 | -5,38 | ||||
| 2026-02-17 | 13F | Shelton Capital Management | 6.300 | 0,00 | 380 | 8,26 | ||||
| 2026-02-17 | 13F | Advisor Group Holdings, Inc. | 110.865 | 36,49 | 6.696 | 47,40 | ||||
| 2026-04-23 | 13F | Sawyer & Company, Inc | 450 | 0,00 | 33 | 18,52 | ||||
| 2026-01-30 | 13F | AMG National Trust Bank | 5.284 | 28,16 | 319 | 38,86 | ||||
| 2026-04-08 | 13F | Sapient Capital Llc | 3.295 | -8,98 | 240 | 8,64 | ||||
| 2026-04-13 | 13F | Nvest Wealth Strategies, Inc. | 7 | 1 | ||||||
| 2025-11-14 | 13F | 1832 Asset Management L.P. | 0 | -100,00 | 0 | |||||
| 2026-02-13 | 13F | Beutel, Goodman & Co Ltd. | 300 | 0,00 | 0 | |||||
| 2026-02-17 | 13F | Quadrature Capital Ltd | 56.192 | 3.392 | ||||||
| 2026-02-19 | 13F | Rare Wolf Capital LLC | 9.906 | 598 | ||||||
| 2026-04-06 | 13F | Rosenberg Matthew Hamilton | 2.406 | 0,00 | 175 | 20,69 | ||||
| 2026-02-02 | 13F | Mutual Advisors, LLC | 7.225 | -1,98 | 436 | 7,13 | ||||
| 2026-02-13 | 13F | Icon Advisers Inc/co | 40.000 | -28,57 | 2.415 | -22,68 | ||||
| 2026-02-17 | 13F | Jain Global LLC | 23.009 | 1.389 | ||||||
| 2026-02-03 | 13F | Providence First Trust Co | 5.656 | 341 | ||||||
| 2026-02-12 | 13F | Adviser Investments LLC | 4.350 | 0,00 | 263 | 8,26 | ||||
| 2026-02-13 | 13F | First Trust Advisors Lp | 32.156 | -59,83 | 1.941 | -56,51 | ||||
| 2026-01-26 | 13F | Townsend & Associates, Inc | 626.081 | 1,34 | 41.340 | 20,38 | ||||
| 2026-04-23 | 13F | Comprehensive Money Management Services LLC | 6.036 | 1,68 | 439 | 22,63 | ||||
| 2026-02-17 | 13F | Cape Investment Advisory, Inc. | 240 | 14 | ||||||
| 2026-02-19 | 13F | CI Private Wealth, LLC | 323.596 | -0,12 | 19.537 | 8,17 | ||||
| 2026-02-06 | 13F | Berbice Capital Management LLC | 500 | 0,00 | 30 | 11,11 | ||||
| 2026-02-13 | 13F | Van Eck Associates Corp | 297.488 | 241,83 | 18 | 325,00 | ||||
| 2026-02-17 | 13F | Ancora Advisors, LLC | 798 | 17,35 | 48 | 29,73 | ||||
| 2026-02-13 | 13F | Charles Schwab Investment Management Inc | 381.106 | 14,39 | 23.007 | 23,87 | ||||
| 2026-02-12 | 13F | Insigneo Advisory Services, Llc | 4.428 | -5,24 | 267 | 2,69 | ||||
| 2026-02-12 | 13F | Cibc World Markets Corp | 11.512 | 695 | ||||||
| 2026-02-17 | 13F | Jones Financial Companies Lllp | 38.983 | 10,33 | 2.353 | 21,66 | ||||
| 2026-02-17 | 13F | Point72 Asset Management, L.P. | 621.383 | 37.513 | ||||||
| 2026-01-21 | 13F | Persium Advisors, LLC | 15.293 | 3,91 | 923 | 12,56 | ||||
| 2026-02-11 | 13F | Saturna Capital CORP | 12.025 | 726 | ||||||
| 2026-04-23 | 13F | Castellan Group, LLC | 27.083 | 0,00 | 1.970 | 20,49 | ||||
| 2026-01-20 | 13F | Independence Bank of Kentucky | 91 | 5 | ||||||
| 2026-04-13 | 13F | Successful Portfolios LLC | 5.146 | -15,94 | 367 | -2,92 | ||||
| 2026-02-13 | 13F | Alerus Financial Na | 344 | 0,00 | 21 | 5,26 | ||||
| 2026-04-27 | 13F | Sound Income Strategies, LLC | 470 | 11,37 | 35 | 25,93 | ||||
| 2025-11-12 | 13F | Creekmur Asset Management LLC | 75 | 0,00 | 4 | 33,33 | ||||
| 2026-01-29 | 13F | UBS Group AG | Put | 636.600 | 45,81 | 38.432 | 57,89 | |||
| 2026-02-23 | 13F | Mv Capital Management, Inc. | 28 | 2 | ||||||
| 2026-01-29 | 13F | UBS Group AG | Call | 281.600 | -4,09 | 17.000 | 3,86 | |||
| 2026-01-29 | 13F | UBS Group AG | 389.336 | -30,92 | 23.504 | -25,19 | ||||
| 2026-01-23 | 13F | Freestone Capital Holdings, LLC | 3.558 | 215 | ||||||
| 2026-02-17 | 13F | Two Sigma Advisers, Lp | 5.201 | 314 | ||||||
| 2025-11-14 | 13F | AXA Investment Managers S.A. | 5.240 | 292 | ||||||
| 2026-04-28 | 13F | Flagship Harbor Advisors, Llc | 0 | -100,00 | 0 | |||||
| 2026-02-13 | 13F | American Century Companies Inc | 1.028.917 | 11,80 | 62.116 | 21,07 | ||||
| 2026-04-23 | 13F | CWM Advisors, LLC | 4.736 | -4,99 | 345 | 14,67 | ||||
| 2026-02-11 | 13F | Holowesko Partners Ltd. | 116.800 | 27,09 | 7.051 | 37,63 | ||||
| 2026-04-24 | 13F | Profund Advisors Llc | 17.104 | 5,57 | 1.244 | 27,20 | ||||
| 2026-02-12 | 13F | Triumph Capital Management | 100 | 334,78 | 6 | 500,00 | ||||
| 2026-02-13 | 13F | Pathstone Holdings, LLC | 44.735 | 7,79 | 2.701 | 16,73 | ||||
| 2026-04-22 | 13F | Vicus Capital | 214.845 | -2,14 | 15.628 | 17,91 | ||||
| 2026-02-11 | 13F | State Farm Mutual Automobile Insurance Co | 1.348.932 | 0,00 | 81.435 | 8,29 | ||||
| 2026-02-11 | 13F | Havemeyer Place LP | 2.876 | 174 | ||||||
| 2026-02-13 | 13F | Invictus Private Wealth, Llc | 0 | -100,00 | 0 | |||||
| 2026-04-24 | 13F | Eagle Bay Advisors LLC | 0 | -100,00 | 0 | |||||
| 2026-02-17 | 13F | Capital Fund Management S.a. | Call | 20.300 | -9,38 | 1.226 | -1,84 | |||
| 2026-02-11 | 13F | West Family Investments, Inc. | 11.551 | 0,00 | 697 | 8,40 | ||||
| 2026-02-17 | 13F | Capital Fund Management S.a. | Put | 11.400 | -57,46 | 688 | -53,95 | |||
| 2026-02-02 | 13F | Oppenheimer Asset Management Inc. | 0 | -100,00 | 0 | |||||
| 2026-02-17 | 13F | Schonfeld Strategic Advisors LLC | 52.368 | 3.161 | ||||||
| 2026-02-13 | 13F | Baird Financial Group, Inc. | 32.581 | -1,18 | 1.967 | 6,96 | ||||
| 2026-04-23 | 13F | SJS Investment Consulting Inc. | 414 | -6,12 | 30 | 15,38 | ||||
| 2026-02-18 | 13F | EP Wealth Advisors, Inc. | 8.129 | 44,18 | 491 | 80,81 | ||||
| 2026-04-20 | 13F | LVW Advisors, LLC | 5.478 | 398 | ||||||
| 2026-04-21 | 13F | PDS Planning, Inc | 9.277 | -2,15 | 675 | 17,83 | ||||
| 2026-02-12 | 13F | Investment Research Partners LLC | 6.369 | -1,55 | 385 | 2,67 | ||||
| 2026-01-13 | 13F | Kathmere Capital Management, LLC | 11.681 | 3,96 | 705 | 12,62 | ||||
| 2026-02-06 | 13F | Gsa Capital Partners Llp | 5.654 | 0 | ||||||
| 2026-02-17 | 13F | Raymond James Financial Inc | 525.154 | 3,28 | 31.704 | 11,84 | ||||
| 2026-02-13 | 13F | MAI Capital Management | 15.103 | -1,00 | 912 | 7,18 | ||||
| 2026-02-06 | 13F | EverSource Wealth Advisors, LLC | 3.353 | 2,76 | 202 | 11,60 | ||||
| 2026-02-13 | 13F | Corient IA LLC | 0 | -100,00 | 0 | |||||
| 2025-11-13 | 13F | Twin Tree Management, LP | 0 | -100,00 | 0 | -100,00 | ||||
| 2026-04-27 | 13F | Exencial Wealth Advisors, Llc | 3.835 | 12,20 | 279 | 34,95 | ||||
| 2026-04-24 | 13F | Keybank National Association/oh | 23.623 | 35,65 | 1.718 | 63,46 | ||||
| 2026-02-13 | 13F | Morgan Stanley | 13.800.183 | 22,81 | 833.117 | 32,98 | ||||
| 2026-02-13 | 13F | Pin Oak Investment Advisors Inc | 4 | -98,71 | 0 | -100,00 | ||||
| 2026-04-16 | 13F | True Vision MN LLC | 9.811 | 714 | ||||||
| 2026-04-21 | 13F | Founders Capital Management | 0 | -100,00 | 0 | |||||
| 2025-11-06 | 13F | Savvy Advisors, Inc. | 0 | -100,00 | 0 | |||||
| 2026-02-17 | 13F | Amundi | 91.930 | -2,41 | 5.550 | 5,25 | ||||
| 2026-02-09 | 13F | Harbour Investments, Inc. | 2.093 | 0,58 | 126 | 8,62 | ||||
| 2025-11-04 | 13F | High Note Wealth, LLC | 0 | -100,00 | 0 | |||||
| 2026-02-05 | 13F | Lockheed Martin Investment Management Co | 37.460 | -29,27 | 2.261 | -23,41 | ||||
| 2026-02-23 | 13F | Walser Wealth Management Company, A Ltd Liability Co | 3.593 | 217 | ||||||
| 2025-11-14 | 13F | Concentric Capital Strategies, LP | 0 | -100,00 | 0 | |||||
| 2026-02-13 | 13F | Inspire Advisors, LLC | 11.302 | -8,69 | 682 | -1,16 | ||||
| 2026-01-23 | 13F | Bridgewater Advisors Inc. | 6.193 | 5,52 | 406 | 24,54 | ||||
| 2026-02-10 | 13F | CIBC Asset Management Inc | 30.115 | 306,90 | 1.818 | 341,26 | ||||
| 2026-01-30 | 13F/A | M&t Bank Corp | 19.550 | 30,73 | 1.180 | 41,66 | ||||
| 2026-04-16 | 13F | Strong Tower Advisory Services | 66.921 | -1,75 | 4.868 | 18,39 | ||||
| 2026-02-05 | 13F | Rossmore Private Capital | 14.695 | -10,72 | 887 | -3,27 | ||||
| 2026-02-13 | 13F | Rhumbline Advisers | 21.179 | 43,66 | 1.279 | 55,66 | ||||
| 2026-04-22 | 13F | Caldwell Trust Co | 660 | 0,00 | 48 | 23,08 | ||||
| 2026-02-17 | 13F | North Capital, Inc. | 0 | -100,00 | 0 | |||||
| 2026-04-10 | 13F | Country Trust Bank | 0 | -100,00 | 0 | |||||
| 2026-04-07 | 13F | Eastern Bank | 425 | 0,00 | 31 | 20,00 | ||||
| 2026-02-11 | 13F | Dorsey & Whitney Trust CO LLC | 12.849 | 5,81 | 776 | 14,64 | ||||
| 2026-02-12 | 13F | Brinker Capital Investments, LLC | 24.909 | -12,88 | 1.504 | -5,65 | ||||
| 2026-02-23 | 13F | Beaird Harris Wealth Management, LLC | 6 | 0,00 | 0 | |||||
| 2026-01-26 | 13F | Cordatus Wealth Management LLC | 10.033 | -3,44 | 606 | 4,49 | ||||
| 2026-01-29 | 13F | Rakuten Securities, Inc. | 291 | 15,02 | 18 | 21,43 | ||||
| 2026-04-20 | 13F | Naples Global Advisors, Llc | 5.358 | 2,19 | 390 | 23,10 | ||||
| 2026-02-13 | 13F | PCM Encore, LLC | 9.372 | 566 | ||||||
| 2026-04-06 | 13F | GAMMA Investing LLC | 8.289 | 31,36 | 603 | 58,42 | ||||
| 2026-04-17 | 13F | 55 North Private Wealth, LLC | 4.580 | 25,62 | 333 | 51,36 | ||||
| 2026-01-12 | 13F | DAVENPORT & Co LLC | 0 | -100,00 | 0 | |||||
| 2025-11-14 | 13F | Aigen Investment Management, Lp | 0 | -100,00 | 0 | |||||
| 2026-04-10 | 13F | Kessler Investment Group, LLC | 100.963 | 7.344 | ||||||
| 2026-02-09 | 13F | Cary Street Partners Financial Llc | 855 | 11,33 | 52 | 21,43 | ||||
| 2026-02-11 | 13F | GW&K Investment Management, LLC | 421 | 0,00 | 0 | |||||
| 2026-04-14 | 13F | Jeppson Wealth Management, Llc | 17.741 | 8,27 | 1.290 | 30,43 | ||||
| 2026-02-06 | 13F | Plan A Wealth LLC | 10.058 | 4,75 | 607 | 13,46 | ||||
| 2026-04-28 | 13F | Cherokee Insurance Co | 3.700 | -21,28 | 269 | -4,95 | ||||
| 2026-02-11 | 13F | MCF Advisors LLC | 0 | -100,00 | 0 | |||||
| 2025-11-14 | 13F | Mangrove Partners | 0 | -100,00 | 0 | |||||
| 2026-02-13 | 13F | Knollwood Investment Advisory, LLC | 4.150 | 0,00 | 251 | 8,23 | ||||
| 2026-02-13 | 13F | Walleye Capital LLC | Put | 129.000 | 7.788 | |||||
| 2026-02-17 | 13F | Susquehanna International Group, Llp | Call | 1.437.700 | 43,61 | 86.794 | 55,51 | |||
| 2026-02-18 | 13F | Caitlin John, LLC | 85 | 5 | ||||||
| 2026-01-23 | 13F | Optima Capital Llc | 278 | 17 | ||||||
| 2026-02-09 | 13F | Kingsview Wealth Management, LLC | 12.247 | 27,24 | 739 | 37,87 | ||||
| 2026-02-13 | 13F | Walleye Capital LLC | 80.941 | 4.886 | ||||||
| 2026-02-17 | 13F | Susquehanna International Group, Llp | 44.404 | 204,20 | 2.681 | 229,64 | ||||
| 2026-02-13 | 13F | Walleye Capital LLC | Call | 59.500 | 3.592 | |||||
| 2026-02-17 | 13F | Susquehanna International Group, Llp | Put | 632.500 | -4,24 | 38.184 | 3,70 | |||
| 2026-02-17 | 13F | Boreal Capital Management LLC | 330 | 0,00 | 20 | 5,56 | ||||
| 2026-04-24 | 13F | Essex Financial Services, Inc. | 4.253 | -13,12 | 309 | 4,75 | ||||
| 2026-03-06 | 13F | Hsbc Holdings Plc | 5.117 | -51,02 | 309 | -46,45 | ||||
| 2026-04-27 | 13F | Truist Financial Corp | 15.470 | 1,90 | 1.125 | 22,82 | ||||
| 2026-02-13 | 13F | Financial Sense Advisors, Inc. | 6.000 | -61,97 | 362 | -58,82 | ||||
| 2026-02-12 | 13F | Chilton Capital Management Llc | 690 | 0,00 | 42 | 7,89 | ||||
| 2025-11-12 | 13F | NewSquare Capital LLC | 0 | -100,00 | 0 | -100,00 | ||||
| 2026-02-17 | 13F | Fmr Llc | 2.066.768 | 6,56 | 124.771 | 15,39 | ||||
| 2025-11-10 | 13F | Raiffeisen Bank International AG | 0 | -100,00 | 0 | -100,00 | ||||
| 2026-01-26 | 13F | Cwm, Llc | 6.579 | -1,22 | 0 | |||||
| 2026-02-05 | 13F | Mission Wealth Management, Lp | 10.162 | 0,20 | 613 | 8,50 | ||||
| 2026-02-06 | 13F | Bare Financial Services, Inc | 0 | -100,00 | 0 | |||||
| 2026-02-12 | 13F | Sit Investment Associates Inc | 16.050 | -22,84 | 1 | -100,00 | ||||
| 2025-11-14 | 13F | Engineers Gate Manager LP | 0 | -100,00 | 0 | |||||
| 2026-04-16 | 13F | SG Americas Securities, LLC | Call | 50.000 | 0 | |||||
| 2026-04-20 | 13F | Benedict Financial Advisors Inc | 7.273 | 1,04 | 529 | 21,89 | ||||
| 2026-01-15 | 13F | Lodestone Wealth Management LLC | 11 | 1 | ||||||
| 2026-02-06 | 13F | Pnc Financial Services Group, Inc. | 72.102 | -6,62 | 4.353 | 1,12 | ||||
| 2026-02-13 | 13F | Brown Advisory Inc | 17.495 | 26,49 | 1.056 | 36,96 | ||||
| 2026-04-24 | 13F | Root Financial Partners, LLC | 978 | -21,26 | 71 | -5,33 | ||||
| 2026-04-14 | 13F | Corecam Pte. Ltd. | 3.470 | 252 | ||||||
| 2026-02-13 | 13F | Kayne Anderson Rudnick Investment Management Llc | 42 | 0,00 | 3 | 0,00 | ||||
| 2026-02-11 | 13F | TT Capital Management LLC | 4.867 | -7,59 | 294 | 0,00 | ||||
| 2026-02-13 | 13F | Strategic Global Advisors, LLC | 29.295 | 8,50 | 1.769 | 17,48 | ||||
| 2026-01-12 | 13F | CVA Family Office, LLC | 3.600 | 0,00 | 217 | 8,50 | ||||
| 2026-02-12 | 13F | SWAN Capital LLC | 27 | 0,00 | 2 | 0,00 | ||||
| 2026-02-09 | 13F | Morningstar Investment Management LLC | 0 | -100,00 | 0 | |||||
| 2026-02-11 | 13F | Rise Advisors, LLC | 0 | -100,00 | 0 | |||||
| 2026-02-11 | 13F | Ovata Capital Management Ltd | 46.187 | 103,58 | 2.806 | 120,08 | ||||
| 2026-02-10 | 13F/A | Northwestern Mutual Wealth Management Co | 37.647 | 13,94 | 2.273 | 23,41 | ||||
| 2026-04-07 | 13F | Farther Finance Advisors, LLC | 51.327 | 18,98 | 3.776 | 44,97 | ||||
| 2026-01-22 | 13F | Bartlett & Co. Wealth Management Llc | 2.008 | 0,00 | 121 | 9,01 | ||||
| 2026-02-10 | 13F | Rothschild Investment Llc | 969 | -5,09 | 58 | 3,57 | ||||
| 2026-02-10 | 13F | Bearing Point Capital, Llc | 125.425 | 9,61 | 7.572 | 18,69 | ||||
| 2026-04-10 | 13F | Quaker Wealth Management, LLC | 0 | -100,00 | 0 | |||||
| 2026-04-13 | 13F | Jackson Square Capital, Llc | 13.124 | 132,74 | 955 | 180,59 | ||||
| 2026-02-17 | 13F | SIH Partners, LLLP | 306.158 | -83,51 | 18.483 | -82,14 | ||||
| 2026-04-15 | 13F | Murphy, Middleton, Hinkle & Parker, Inc. | 0 | -100,00 | 0 | |||||
| 2026-02-11 | 13F | Erste Asset Management GmbH | 0 | 0 | ||||||
| 2026-02-17 | 13F | Russell Investments Group, Ltd. | 43.892 | 33,18 | 2.650 | 44,20 | ||||
| 2026-04-07 | 13F | Retirement Wealth Solutions LLC | 268 | 47,25 | 19 | 90,00 | ||||
| 2026-02-14 | 13F | Whipplewood Advisors, LLC | 5 | 0 | ||||||
| 2026-02-09 | 13F | Hantz Financial Services, Inc. | 68.872 | 75,98 | 4 | 100,00 | ||||
| 2026-02-12 | 13F | New York State Common Retirement Fund | 8.100 | 158,70 | 489 | 180,46 | ||||
| 2026-04-27 | 13F | Y-Intercept (Hong Kong) Ltd | 13.043 | -95,99 | 949 | -95,17 | ||||
| 2026-04-14 | 13F | Kozak & Associates, Inc. | 65 | 0,00 | 5 | 25,00 | ||||
| 2026-02-13 | 13F | Centiva Capital, LP | Call | 40.000 | 2.415 | |||||
| 2026-02-13 | 13F | Centiva Capital, LP | 56.436 | 156,88 | 3.407 | 178,35 | ||||
| 2026-01-26 | 13F | Main Street Group, LTD | 0 | -100,00 | 0 | |||||
| 2026-02-06 | 13F | Associated Banc-corp | 36.629 | -1,47 | 2.211 | 6,71 | ||||
| 2026-02-12 | 13F | Federation des caisses Desjardins du Quebec | 8.272 | 24,97 | 499 | 35,23 | ||||
| 2026-02-10 | 13F | Connor, Clark & Lunn Investment Management Ltd. | 198.144 | -57,31 | 11.962 | -53,77 | ||||
| 2026-04-17 | 13F | Western Pacific Wealth Management, LP | 52 | 1,96 | 4 | 0,00 | ||||
| 2026-02-13 | 13F | Fairfield, Bush & Co. | 14.887 | 0,00 | 899 | 8,32 | ||||
| 2026-02-17 | 13F | Price T Rowe Associates Inc /md/ | 171.734 | 0,00 | 10 | 11,11 | ||||
| 2026-02-10 | 13F | Dynasty Wealth Management, Llc | 14.414 | 7,91 | 870 | 16,94 | ||||
| 2026-02-11 | 13F | Group One Trading, L.p. | Put | 65.700 | 83,52 | 3.966 | 98,80 | |||
| 2026-02-05 | 13F | Center for Financial Planning, Inc. | 500 | 0,00 | 30 | 11,11 | ||||
| 2026-02-11 | 13F | Group One Trading, L.p. | 27.926 | -38,28 | 1.686 | -33,19 | ||||
| 2026-02-11 | 13F | Group One Trading, L.p. | Call | 122.700 | -18,04 | 7.407 | -11,24 | |||
| 2026-02-13 | 13F | Bollard Group LLC | 8.324 | -15,18 | 1 | |||||
| 2026-04-21 | 13F | Montgomery Investment Management Inc | 16.150 | 0,00 | 1.175 | 20,53 | ||||
| 2026-04-08 | 13F | Birchbrook, Inc. | 93 | 0,00 | 7 | 20,00 | ||||
| 2026-02-06 | 13F | Harmony Asset Management Llc | 5.583 | 15,76 | 337 | 25,75 | ||||
| 2026-04-22 | 13F | Pinnacle Bancorp, Inc. | 300 | 0,00 | 22 | 16,67 | ||||
| 2026-02-05 | 13F | Gabelli Funds Llc | 524.400 | 18,27 | 31.658 | 28,07 | ||||
| 2026-02-17 | 13F | Captrust Financial Advisors | 18.401 | -52,53 | 1.111 | -48,61 | ||||
| 2026-02-17 | 13F | Agf Management Ltd | 5.200 | 0,00 | 314 | 8,30 | ||||
| 2026-02-17 | 13F | Greenline Partners, LLC | 123.288 | 23,05 | 7.443 | 33,25 | ||||
| 2026-02-17 | 13F | Sig Brokerage, Lp | Call | 35.700 | 0,00 | 2.155 | 8,29 | |||
| 2026-02-17 | 13F | Quantitative Investment Management, LLC | 0 | -100,00 | 0 | |||||
| 2026-04-17 | 13F | Bell Investment Advisors, Inc | 1.182 | -2,48 | 86 | 16,44 | ||||
| 2026-02-11 | 13F | Empowered Funds, LLC | 5.800 | 350 | ||||||
| 2026-02-13 | 13F | Smartleaf Asset Management LLC | 15.011 | 8,61 | 914 | 17,63 | ||||
| 2025-11-06 | 13F | Abich Financial Wealth Management LLC | 43 | 2 | ||||||
| 2026-04-22 | 13F | Viewpoint Investment Partners Corp | 22.680 | 344,71 | 1.728 | 462,54 | ||||
| 2026-02-12 | 13F | Pitcairn Co | 0 | -100,00 | 0 | |||||
| 2026-01-23 | 13F | Factory Mutual Insurance Co | 89.252 | 0,00 | 5.388 | 8,30 | ||||
| 2026-01-26 | 13F | Asset Dedication, LLC | 450 | 0,00 | 27 | 8,00 | ||||
| 2026-02-03 | 13F | International Assets Investment Management, Llc | 8.542 | -7,06 | 516 | 15,21 | ||||
| 2025-11-14 | 13F | Wolverine Trading, Llc | Call | 83.600 | 4.700 | |||||
| 2026-01-28 | 13F | Aspen Wealth Strategies, LLC | 4.200 | 1,03 | 254 | 9,52 | ||||
| 2025-11-14 | 13F | Wolverine Trading, Llc | Put | 69.900 | 3.930 | |||||
| 2026-02-09 | 13F | Atlantic Trust, LLC | 0 | -100,00 | 0 | |||||
| 2026-02-17 | 13F | Abel Hall, LLC | 15.221 | 103,87 | 919 | 120,67 | ||||
| 2025-12-08 | 13F | NWF Advisory Services Inc. | 4.047 | 20,34 | 276 | 38,00 | ||||
| 2026-02-17 | 13F | Pinnacle Financial Partners, Inc. | 4.955 | 299 | ||||||
| 2025-11-14 | 13F | Wolverine Trading, Llc | 7.220 | 406 | ||||||
| 2026-02-04 | 13F | Legacy Financial Advisors, Inc. | 0 | -100,00 | 0 | |||||
| 2026-04-27 | 13F | Boyd Watterson Asset Management Llc/oh | 297 | 0,00 | 22 | 23,53 | ||||
| 2026-02-02 | 13F | One Wealth Advisors, LLC | 0 | -100,00 | 0 | |||||
| 2026-02-12 | 13F | Qtron Investments LLC | 0 | -100,00 | 0 | |||||
| 2026-04-15 | 13F | Riversedge Advisors, Llc | 4.347 | 15,27 | 316 | 39,21 | ||||
| 2026-02-13 | 13F | Arrowstreet Capital, Limited Partnership | 575.410 | 17,79 | 34.738 | 27,55 | ||||
| 2026-02-17 | 13F | Fairscale Capital, LLC | 322 | 0,00 | 19 | 11,76 | ||||
| 2026-02-20 | 13F | Kovitz Investment Group Partners, LLC | 0 | -100,00 | 0 | |||||
| 2026-02-03 | 13F | Gallacher Capital Management LLC | 9.967 | -0,05 | 602 | 8,29 | ||||
| 2026-04-24 | 13F | Redwood Wealth Management Group, LLC | 5.886 | 0,98 | 428 | 21,94 | ||||
| 2025-11-13 | 13F | Jump Financial, LLC | 0 | -100,00 | 0 | |||||
| 2026-04-28 | 13F | Stratos Wealth Partners, LTD. | 19.741 | -0,23 | 1.436 | 20,18 | ||||
| 2026-02-12 | 13F | CoreCommodity Management, LLC | 8.828 | 0,00 | 533 | 8,13 | ||||
| 2025-11-14 | 13F | Intrepid Family Office Llc | 0 | -100,00 | 0 | -100,00 | ||||
| 2026-02-13 | 13F | Ubs Asset Management Americas Inc | 7.634 | 461 | ||||||
| 2026-02-17 | 13F | Optiver Holding B.V. | Call | 682.200 | 37,73 | 41.184 | 49,15 | |||
| 2026-02-17 | 13F | Optiver Holding B.V. | Put | 660.000 | 51,13 | 39.844 | 63,66 | |||
| 2026-04-15 | 13F | Trust Point Inc. | 6.796 | 28,88 | 494 | 55,35 | ||||
| 2026-02-09 | 13F | Keating Financial Advisory Services, Inc. | 148 | 9 | ||||||
| 2026-04-23 | 13F | BXM Wealth LLC | 3.375 | 0,00 | 245 | 20,69 | ||||
| 2026-02-13 | 13F | Walleye Trading LLC | 523 | 32 | ||||||
| 2026-02-13 | 13F | Walleye Trading LLC | Put | 179.500 | 34,96 | 10.836 | 46,16 | |||
| 2026-01-23 | 13F | Avion Wealth | 89 | 0,00 | 0 | |||||
| 2026-02-12 | 13F | Commonwealth Equity Services, Llc | 87.743 | 3,17 | 5.297 | 132.325,00 | ||||
| 2026-02-13 | 13F | Walleye Trading LLC | Call | 203.000 | 103,00 | 12.255 | 119,82 | |||
| 2026-04-22 | 13F | Old Point Trust & Financial Services N A | 143 | 0,00 | 10 | 25,00 | ||||
| 2026-01-29 | 13F | IMC-Chicago, LLC | Put | 71.200 | 101,70 | 4.298 | 118,51 | |||
| 2026-01-29 | 13F | IMC-Chicago, LLC | Call | 99.300 | 146,40 | 5.995 | 166,87 | |||
| 2026-02-13 | 13F | SPX Equities Gestao de Recursos Ltda | 0 | 0 | ||||||
| 2026-01-27 | 13F | Zurcher Kantonalbank (Zurich Cantonalbank) | 1.241 | 23,48 | 75 | 32,14 | ||||
| 2026-02-13 | 13F | 1248 Management, LLC | 0 | -100,00 | 0 | |||||
| 2026-04-27 | 13F | Oxbow Advisors, LLC | 127.211 | 6,03 | 9.253 | 27,77 | ||||
| 2026-02-13 | 13F | Centerpoint Advisors, LLC | 275 | 0,00 | 0 | |||||
| 2026-02-13 | 13F | Stifel Financial Corp | 163.343 | -0,70 | 9.861 | 7,54 | ||||
| 2026-04-17 | 13F | Vermillion Wealth Management, Inc. | 1.487 | 1,85 | 108 | 22,73 | ||||
| 2026-02-14 | 13F | Rockefeller Capital Management L.P. | 420.018 | 37,32 | 25.297 | 48,35 | ||||
| 2026-02-12 | 13F | Nuveen, LLC | 0 | -100,00 | 0 | |||||
| 2025-11-14 | 13F | Decade Renewable Partners Lp | 0 | -100,00 | 0 | |||||
| 2026-04-21 | 13F | Torrey Growth & Income Advisors | 3.530 | 0,00 | 252 | 18,31 | ||||
| 2026-04-23 | 13F | Catalyst Investment Management LLC | 5.051 | 406 | ||||||
| 2026-04-15 | 13F | Valley National Advisers Inc | 400 | 0,00 | 0 | |||||
| 2025-11-21 | 13F/A | CIBC Bancorp USA Inc. | Call | 310.300 | 17.299 | |||||
| 2026-02-13 | 13F | Wright Wealth Llc | 4.657 | 281 | ||||||
| 2026-02-13 | 13F | Citigroup Inc | Call | 385.000 | 196,15 | 23.242 | 220,71 | |||
| 2026-02-13 | 13F | Citigroup Inc | Put | 315.000 | 61,54 | 19.017 | 74,92 | |||
| 2026-02-11 | 13F | Deutsche Bank Ag\ | 482.650 | 64.253,33 | 29.138 | 70.965,85 | ||||
| 2026-04-07 | 13F | First Financial Corp /in/ | 7.894 | -12,17 | 574 | 5,90 | ||||
| 2026-01-30 | 13F | Bogart Wealth, LLC | 18 | -91,13 | 1 | -90,91 | ||||
| 2026-02-13 | 13F | Citigroup Inc | 2.251.802 | -30,35 | 135.941 | -24,58 | ||||
| 2026-02-12 | 13F | Callan Family Office, LLC | 86.329 | 10,17 | 5.212 | 19,30 | ||||
| 2026-04-16 | 13F | Petredis Investment Advisors Llc | 63.898 | -0,75 | 4.648 | 19,58 | ||||
| 2026-02-11 | 13F | Franklin Resources Inc | 338.213 | 774,93 | 20.418 | 818,86 | ||||
| 2026-02-12 | 13F | Godshalk Welsh Capital Management, Inc. | 4.050 | -5,81 | 244 | 2,09 | ||||
| 2026-02-12 | 13F | BlackRock, Inc. | 2.627.868 | -4,86 | 158.644 | 3,02 | ||||
| 2026-02-05 | 13F | May Hill Capital, LLC | 14.330 | 114,55 | 865 | 132,53 | ||||
| 2026-02-10 | 13F | Bnp Paribas Arbitrage, Sa | 14.603 | -97,22 | 882 | -96,99 | ||||
| 2025-11-13 | 13F | FORA Capital, LLC | 0 | -100,00 | 0 | -100,00 | ||||
| 2026-01-22 | 13F | Northcape Wealth Management, Llc | 44.874 | -2,65 | 2.709 | 5,45 | ||||
| 2026-02-10 | 13F | Bnp Paribas Arbitrage, Sa | Put | 1.391 | -27,17 | 8.397 | -21,14 | |||
| 2026-02-10 | 13F | Bnp Paribas Arbitrage, Sa | Call | 966 | -53,08 | 5.832 | -49,20 | |||
| 2026-01-27 | 13F | Evergreen Capital Management Llc | 36.584 | 7,87 | 2.209 | 16,83 | ||||
| 2026-02-09 | 13F | Huntington National Bank | 1.183 | -20,12 | 71 | -13,41 | ||||
| 2026-02-03 | 13F | Ballentine Partners, LLC | 13.110 | 0,88 | 791 | 9,25 | ||||
| 2026-01-07 | 13F | Harbour Capital Advisors, LLC | 15.565 | 0,06 | 961 | 12,00 | ||||
| 2026-01-20 | 13F | Family Legacy Financial Solutions, LLC | 0 | -100,00 | 0 | |||||
| 2026-02-06 | 13F/A | Rathbone Brothers plc | 4.616 | 0,00 | 279 | 8,17 | ||||
| 2026-04-23 | 13F | North Star Investment Management Corp. | 159 | 0,00 | 12 | 22,22 | ||||
| 2026-02-17 | 13F | Royal Bank Of Canada | 1.050.956 | -11,21 | 63.447 | -3,85 | ||||
| 2026-02-13 | 13F | Gts Securities Llc | 12.092 | 730 | ||||||
| 2026-02-13 | 13F | Solstein Capital, LLC | 1.459 | 110,23 | 88 | 131,58 | ||||
| 2026-02-13 | 13F | Shelter Mutual Insurance Co | 94.680 | 0,00 | 5.716 | 8,28 | ||||
| 2026-02-17 | 13F | Ameriflex Group, Inc. | 359 | -50,00 | 22 | -47,50 | ||||
| 2025-10-31 | 13F | Whittier Trust Co Of Nevada Inc | 0 | -100,00 | 0 | |||||
| 2026-04-22 | 13F | Louisbourg Investments Inc. | 12.680 | 14,44 | 922 | 38,02 | ||||
| 2026-02-10 | 13F | CIBC World Markets Inc. | 184.200 | 224,29 | 11.120 | 251,23 | ||||
| 2026-02-03 | 13F | Garner Asset Management Corp | 6.411 | -9,77 | 387 | -2,27 | ||||
| 2026-04-13 | 13F | GoalVest Advisory LLC | 1.000 | 0,00 | 73 | 20,00 | ||||
| 2026-02-17 | 13F | Cetera Investment Advisers | 207.917 | 9,40 | 12.552 | 18,46 | ||||
| 2026-04-22 | 13F | Stone House Investment Management, LLC | 106 | 0,00 | 8 | 16,67 | ||||
| 2026-01-28 | 13F | CAPROCK Group, Inc. | 39.306 | 11,70 | 2.373 | 20,90 | ||||
| 2026-02-13 | 13F | Entropy Technologies, LP | 12.033 | 726 | ||||||
| 2026-04-16 | 13F | Uhlmann Price Securities, Llc | 3.482 | -0,74 | 253 | 19,91 | ||||
| 2026-04-23 | 13F | Rexford Capital Inc | 2.711 | 4,83 | 197 | 26,28 | ||||
| 2026-01-27 | 13F | Brighton Jones Llc | 0 | -100,00 | 0 | |||||
| 2026-02-19 | 13F | Invesco Ltd. | 11.283 | -9,05 | 681 | -1,45 | ||||
| 2026-02-09 | 13F | Smithfield Trust Co | 40 | 0 | ||||||
| 2026-02-05 | 13F | IMG Wealth Management, Inc. | 39 | 0,00 | 2 | 0,00 | ||||
| 2026-02-13 | 13F | Mariner, LLC | 143.219 | -18,96 | 8.652 | -12,20 | ||||
| 2026-02-06 | 13F | Aviance Capital Partners, LLC | 3.991 | -16,03 | 241 | -9,09 | ||||
| 2025-11-04 | 13F | Raleigh Capital Management Inc. | 0 | -100,00 | 0 | |||||
| 2025-11-12 | 13F | Quantbot Technologies LP | 0 | -100,00 | 0 | |||||
| 2026-02-17 | 13F | Bedell Frazier Investment Counseling, LLC | 12.375 | 3,50 | 747 | 12,16 | ||||
| 2025-11-14 | 13F | BlueCrest Capital Management Ltd | 12.541 | 699 | ||||||
| 2026-02-17 | 13F | Buckland Partners Management Co LLC | 6.000 | 925 | ||||||
| 2025-11-14 | 13F | Prelude Capital Management, Llc | 0 | -100,00 | 0 | |||||
| 2026-01-15 | 13F | J. Safra Sarasin Holding AG | 4.000 | 0,00 | 241 | 8,07 | ||||
| 2026-02-17 | 13F | Aquatic Capital Management LLC | 151.226 | 746,97 | 9.130 | 817,49 | ||||
| 2026-02-03 | 13F | Costello Asset Management, INC | 438 | 0,00 | 26 | 8,33 | ||||
| 2026-01-16 | 13F | Empirical Financial Services, LLC d.b.a. Empirical Wealth Management | 12.490 | 66,02 | 754 | 79,95 | ||||
| 2026-02-17 | 13F | Two Sigma Investments, Lp | 5.209 | 314 | ||||||
| 2026-02-13 | 13F | Ieq Capital, Llc | 50.200 | 13,85 | 3.031 | 23,27 | ||||
| 2026-04-17 | 13F | CENTRAL TRUST Co | 3.308 | -0,39 | 241 | 20,00 | ||||
| 2026-02-12 | 13F | Marex Group plc | 9.975 | 602 | ||||||
| 2026-02-10 | 13F | REAP Financial Group, LLC | 0 | -100,00 | 0 | |||||
| 2026-04-21 | 13F | Old National Bancorp /in/ | 5.059 | -0,65 | 368 | 19,54 | ||||
| 2025-10-31 | 13F | Whittier Trust Co | 0 | -100,00 | 0 | -100,00 | ||||
| 2026-04-27 | 13F | Moran Wealth Management, LLC | 151.956 | 9,75 | 11.053 | 32,24 | ||||
| 2026-04-24 | 13F | Bayban | 416 | 0,00 | 30 | 20,00 | ||||
| 2026-02-04 | 13F | Hallmark Capital Management Inc | 96 | 6 | ||||||
| 2026-02-13 | 13F | Glen Eagle Advisors, LLC | 57 | -9,52 | 3 | 0,00 | ||||
| 2026-02-17 | 13F | United Capital Financial Advisers, Llc | 16.246 | 19,36 | 981 | 29,29 | ||||
| 2026-04-21 | 13F | Nemes Rush Group LLC | 58 | 544,44 | 4 | |||||
| 2026-04-22 | 13F | Coston, McIsaac & Partners | 234 | 0,00 | 0 | |||||
| 2026-02-04 | 13F | Bailard, Inc. | 12.395 | 1,42 | 748 | 9,84 | ||||
| 2026-04-23 | 13F | Farmers & Merchants Trust Co of Chambersburg PA | 3.000 | 0,00 | 0 | |||||
| 2026-02-11 | 13F | O'shaughnessy Asset Management, Llc | 207.441 | 12,62 | 12.523 | 21,96 | ||||
| 2026-02-13 | 13F | Fiduciary Trust Co | 15.568 | 0,40 | 940 | 8,68 | ||||
| 2026-01-09 | 13F | 180 Wealth Advisors, Llc | 25.987 | 5,16 | 1.569 | 13,87 | ||||
| 2026-04-10 | 13F | Novem Group | 19.009 | 2,66 | 1.383 | 23,72 | ||||
| 2026-04-20 | 13F | Ritholtz Wealth Management | 51.721 | 26,88 | 3.762 | 52,93 | ||||
| 2026-01-27 | 13F | Checchi Capital Advisers, LLC | 16.107 | -1,73 | 972 | 6,46 | ||||
| 2026-02-11 | 13F | Buckingham Strategic Partners | 0 | -100,00 | 0 | |||||
| 2025-11-04 | 13F | Guerra Advisors Inc | 126 | 7 | ||||||
| 2026-02-06 | 13F | Intrust Bank Na | 7.233 | 12,49 | 437 | 21,79 | ||||
| 2026-01-29 | 13F | DecisionPoint Financial, LLC | 100 | 6 | ||||||
| 2026-04-20 | 13F | Ronald Blue Trust, Inc. | 10.102 | -12,33 | 735 | 5,61 | ||||
| 2026-03-20 | 13F/A | Hsbc Holdings Plc | Put | 21.100 | 1.276 | |||||
| 2026-02-17 | 13F | Graham Capital Management, L.P. | 39.245 | -1,89 | 2.369 | 6,23 | ||||
| 2026-02-02 | 13F | Nicholas Hoffman & Company, LLC. | 11.552 | 0,38 | 697 | 8,74 | ||||
| 2026-02-12 | 13F | BRYN MAWR TRUST Co | 0 | -100,00 | 0 | |||||
| 2026-02-17 | 13F | Advisory Services Network, LLC | 4.248 | -44,44 | 256 | -39,91 | ||||
| 2026-02-06 | 13F | Cullen/frost Bankers, Inc. | 3.951 | 7,57 | 239 | 16,67 | ||||
| 2026-02-13 | 13F | Quinn Opportunity Partners LLC | 14.300 | 0,00 | 863 | 8,28 | ||||
| 2026-01-27 | 13F | Lorne Steinberg Wealth Management Inc. | 3.260 | 197 | ||||||
| 2026-02-13 | 13F | Flow Traders U.s. Llc | 40.324 | 2 | ||||||
| 2026-02-12 | 13F | Sprott Inc. | 14.521 | -2,11 | 877 | 6,05 | ||||
| 2026-04-09 | 13F | Wedmont Private Capital | 5.603 | -26,84 | 431 | -11,86 | ||||
| 2026-04-28 | 13F | Nbt Bank N A /ny | 2.212 | 1,84 | 161 | 20,30 | ||||
| 2026-02-17 | 13F | Scopus Asset Management, L.p. | Put | 450.000 | 27.166 | |||||
| 2026-04-24 | 13F | UMA Financial Services, Inc. | 259 | 7,02 | 19 | 28,57 | ||||
| 2026-04-15 | 13F | Addenda Capital Inc. | 129.200 | 0,00 | 9.398 | 20,50 | ||||
| 2026-04-10 | 13F | Abound Wealth Management | 108 | -29,41 | 8 | -22,22 | ||||
| 2026-04-15 | 13F | City Holding Co | 67 | 0,00 | 5 | 0,00 | ||||
| 2026-02-09 | 13F | St. Louis Trust Co | 33.687 | 2.034 | ||||||
| 2026-01-14 | 13F | ORG Partners LLC | 172 | 0,00 | 10 | 11,11 | ||||
| 2026-02-05 | 13F | Thrivent Financial For Lutherans | 3.792 | -8,34 | 0 | |||||
| 2026-04-02 | 13F | Hilltop National Bank | 675 | 0,00 | 49 | 22,50 | ||||
| 2026-01-12 | 13F | Byrne Asset Management LLC | 0 | -100,00 | 0 | |||||
| 2026-04-15 | 13F | Albert D Mason Inc | 11.942 | -1,08 | 869 | 19,23 | ||||
| 2026-04-10 | 13F | Naviter Wealth, LLC | 48.872 | 3,65 | 3.555 | 24,88 | ||||
| 2026-02-06 | 13F | Callahan Advisors, LLC | 36.168 | -13,60 | 2.183 | -6,43 | ||||
| 2026-02-13 | 13F | Parkside Financial Bank & Trust | 5.528 | 298,85 | 334 | 332,47 | ||||
| 2026-02-04 | 13F | Independent Advisor Alliance | 17.455 | 20,75 | 1.054 | 30,81 | ||||
| 2025-11-14 | 13F | Squarepoint Ops LLC | 0 | -100,00 | 0 | -100,00 | ||||
| 2026-02-11 | 13F | Manchester Capital Management LLC | 1.862 | 112 | ||||||
| 2026-02-13 | 13F | Recurrent Investment Advisors LLC | 26.071 | -4,80 | 1.574 | 3,08 | ||||
| 2026-02-13 | 13F | Cozad Asset Management Inc | 3.330 | 201 | ||||||
| 2026-04-21 | 13F | Alpine Bank Wealth Management | 0 | -100,00 | 0 | |||||
| 2026-02-04 | 13F | Hikari Power Ltd | 147.400 | 0,00 | 9 | 0,00 | ||||
| 2026-02-05 | 13F | Baader Bank INC | 14.668 | 24,31 | 882 | 34,50 | ||||
| 2026-02-13 | 13F | Aptus Capital Advisors, LLC | 12.688 | -3,71 | 766 | 4,22 | ||||
| 2026-04-21 | 13F | Wedbush Securities Inc | 8.183 | 1,19 | 1 | |||||
| 2026-01-21 | 13F | Prime Capital Investment Advisors, LLC | 6.160 | 0,21 | 372 | 8,48 | ||||
| 2026-02-06 | 13F | GPS Wealth Strategies Group, LLC | 85 | -73,68 | 5 | -72,22 | ||||
| 2026-01-27 | 13F | First Horizon Corp | 2.293 | -24,45 | 138 | -18,34 | ||||
| 2026-02-06 | 13F | Adell Harriman & Carpenter Inc | 3.669 | 222 | ||||||
| 2026-02-12 | 13F | Skopos Labs, Inc. | 89.504 | 541,28 | 5.405 | 697,20 | ||||
| 2026-04-28 | 13F | Belpointe Asset Management LLC | 3.580 | 5,51 | 260 | 27,45 | ||||
| 2026-02-11 | 13F | Prestige Wealth Management Group LLC | 100 | 0,00 | 6 | 20,00 | ||||
| 2026-02-17 | 13F | Harding Loevner Lp | 70.086 | -99,10 | 4.231 | -99,03 | ||||
| 2026-02-17 | 13F | Wiley Bros.-aintree Capital, Llc | 47.666 | 24,98 | 2.879 | 35,37 | ||||
| 2026-01-29 | 13F | Integras Partners LLC | 57.132 | -5,09 | 3.449 | 2,80 | ||||
| 2026-04-13 | 13F | True Wealth Design, LLC | 1.089 | 36,30 | 79 | 64,58 | ||||
| 2026-02-11 | 13F | Simplex Trading, Llc | 8.070 | 25,64 | 487 | |||||
| 2026-02-11 | 13F | Simplex Trading, Llc | Call | 169.200 | 57,10 | 10.215 | 170.133,33 | |||
| 2026-02-11 | 13F | Simplex Trading, Llc | Put | 150.700 | -3,71 | 9.098 | 113.612,50 | |||
| 2026-02-17 | 13F | Millennium Management Llc | 0 | -100,00 | 0 | |||||
| 2026-04-22 | 13F | Abundance Wealth Counselors | 3.644 | 265 | ||||||
| 2026-02-04 | 13F | LRI Investments, LLC | 2.522 | -5,44 | 152 | 2,70 | ||||
| 2026-02-17 | 13F | TIG Advisors, LLC | Put | 0 | -100,00 | 0 | ||||
| 2026-02-18 | 13F | Vident Advisory, LLC | 74.446 | -0,60 | 4.494 | 7,64 | ||||
| 2026-02-02 | 13F | Kornitzer Capital Management Inc /ks | 163.930 | -3,72 | 9.896 | 4,26 | ||||
| 2026-02-06 | 13F | Cadence Wealth Management LLC | 16.164 | 2,06 | 976 | 10,54 | ||||
| 2025-11-13 | 13F | Glenmede Investment Management, LP | 8.133 | -14,19 | 453 | -0,44 | ||||
| 2026-04-20 | 13F | First PREMIER Bank | 1.276 | -1,54 | 0 | |||||
| 2026-01-21 | 13F | Touchstone Capital, Inc. | 0 | -100,00 | 0 | |||||
| 2026-02-13 | 13F | Atlas Capital Advisors Llc | 10.370 | 568,17 | 626 | 745,95 | ||||
| 2026-04-16 | 13F | Toth Financial Advisory Corp | 0 | -100,00 | 0 | |||||
| 2026-02-10 | 13F | Hazlett, Burt & Watson, Inc. | 198 | 482,35 | 0 | |||||
| 2026-02-10 | 13F | State of Wyoming | 2.040 | -7,69 | 123 | 0,00 | ||||
| 2026-01-23 | 13F | Sumitomo Mitsui Trust Holdings, Inc. | 91.178 | -4,01 | 5.504 | 3,95 | ||||
| 2026-02-05 | 13F | Passumpsic Savings Bank | 7.458 | 53,05 | 450 | 89,87 | ||||
| 2026-02-06 | 13F | Global Retirement Partners, LLC | 8.762 | 464,20 | 529 | 513,95 | ||||
| 2026-02-13 | 13F | Colony Group, LLC | 26.858 | 36,79 | 1.621 | 38,31 | ||||
| 2026-04-17 | 13F | Murphy & Mullick Capital Management Corp | 71 | -1,39 | 5 | 25,00 | ||||
| 2026-04-06 | 13F | Versant Capital Management, Inc | 16.463 | 18,07 | 1.198 | 42,33 | ||||
| 2026-02-04 | 13F | Tls Advisors Llc | 4.460 | 0 | ||||||
| 2026-04-15 | 13F | Exchange Traded Concepts, Llc | 48.429 | 172,82 | 3.523 | 228,85 | ||||
| 2026-02-11 | 13F | Twin Tree Management, LP | Call | 146.400 | 460,92 | 8.838 | 507,42 | |||
| 2026-02-11 | 13F | Twin Tree Management, LP | Put | 5.600 | 338 | |||||
| 2026-01-12 | 13F | Kempner Capital Management Inc. | 7.408 | -9,13 | 438 | -3,52 | ||||
| 2026-02-12 | 13F | Brown Brothers Harriman & Co | 929 | 9,68 | 56 | 19,15 | ||||
| 2026-02-12 | 13F | Steward Partners Investment Advisory, Llc | 7.863 | 6,70 | 475 | 15,61 | ||||
| 2026-02-17 | 13F | Aqr Capital Management Llc | 181.750 | 29,23 | 10.972 | 39,95 | ||||
| 2026-04-27 | 13F | Ethic Inc. | 13.870 | 16,42 | 1.009 | 40,19 | ||||
| 2026-02-06 | 13F | New Millennium Group LLC | 2.736 | 151,47 | 165 | 175,00 | ||||
| 2026-04-24 | 13F | Key FInancial Inc | 134 | 282,86 | 10 | 350,00 | ||||
| 2026-01-30 | 13F | Us Bancorp \de\ | 176.695 | -24,02 | 10.667 | -17,72 | ||||
| 2026-04-13 | 13F | Highland Capital Management, Llc | 20.113 | -0,25 | 1.463 | 20,21 | ||||
| 2026-02-06 | 13F | Nano Cap New Millennium Growth Fund L P | 10.750 | 649 | ||||||
| 2026-02-13 | 13F | National Bank Of Canada /fi/ | 111.579 | 0,27 | 6.734 | 8,58 | ||||
| 2026-01-14 | 13F | Wolff Wiese Magana Llc | 0 | -100,00 | 0 | |||||
| 2026-01-30 | 13F | American Capital Advisory, LLC | 36 | -5,26 | 2 | 0,00 | ||||
| 2026-04-10 | 13F | Viking Fund Management Llc | 5.000 | 0,00 | 364 | 20,60 | ||||
| 2026-02-03 | 13F | Rnc Capital Management Llc | 9.331 | -1,53 | 563 | 6,63 | ||||
| 2026-02-17 | 13F | Tudor Investment Corp Et Al | Put | 13.800 | -35,51 | 833 | -30,18 | |||
| 2026-01-21 | 13F | Westfuller Advisors, LLC | 49 | -44,94 | 3 | -50,00 | ||||
| 2026-02-17 | 13F | Tudor Investment Corp Et Al | 523.099 | 31.579 | ||||||
| 2026-02-19 | 13F | Atomi Financial Group, Inc. | 31.493 | 18,81 | 1.901 | 28,71 | ||||
| 2026-04-15 | 13F | Uncommon Cents Investing LLC | 8.415 | 12,73 | 612 | 36,00 | ||||
| 2026-02-12 | 13F | Scotia Capital Inc. | 72.241 | -2,43 | 4.361 | 5,67 | ||||
| 2025-11-12 | 13F | Riverview Capital Advisers, LLC | 0 | -100,00 | 0 | -100,00 | ||||
| 2026-01-20 | 13F | Wall Street Access Asset Management, LLC | 6.542 | 0,00 | 395 | 8,24 | ||||
| 2026-02-03 | 13F | Sequoia Financial Advisors, LLC | 49.391 | 0,21 | 2.982 | 8,52 | ||||
| 2026-02-17 | 13F | Cresset Asset Management, LLC | 0 | -100,00 | 0 | -100,00 | ||||
| 2026-04-27 | 13F | PFG Investments, LLC | 3.982 | -22,63 | 290 | -6,77 | ||||
| 2026-02-17 | 13F | Cresset Asset Management, LLC | Put | 0 | -100,00 | 0 | -100,00 | |||
| 2026-02-12 | 13F | Mindset Wealth Management, Llc | 0 | -100,00 | 0 | |||||
| 2026-04-08 | 13F | Grove Bank & Trust | 857 | 0,00 | 62 | 21,57 | ||||
| 2026-02-13 | 13F | Natixis | 1.274 | 32,85 | 77 | 43,40 | ||||
| 2026-01-27 | 13F | TD Waterhouse Canada Inc. | 29.718 | 14,21 | 1.793 | 23,66 | ||||
| 2026-04-15 | 13F | Wealthcare Capital Partners, LLC | 3.685 | 1,38 | 268 | 22,37 | ||||
| 2026-02-12 | 13F | Earnest Partners Llc | 97.456 | 9,89 | 5.883 | 18,99 | ||||
| 2026-02-12 | 13F | Bank of Jackson Hole Trust | 70 | 0,00 | 4 | 33,33 | ||||
| 2026-02-10 | 13F | Nomura Asset Management Co Ltd | 0 | 0 | ||||||
| 2026-01-28 | 13F | WPG Advisers, LLC | 8 | 0,00 | 0 | |||||
| 2026-02-12 | 13F | Campbell & CO Investment Adviser LLC | 232.558 | 14.040 | ||||||
| 2026-02-13 | 13F | Allianz Se | 0 | -100,00 | 0 | |||||
| 2026-04-28 | 13F | Golden State Wealth Management, LLC | 143 | 0,70 | 10 | 25,00 | ||||
| 2026-02-17 | 13F | Driehaus Capital Management Llc | 0 | -100,00 | 0 | |||||
| 2026-04-14 | 13F | Shrier Wealth Management, Llc | 46.324 | 6,35 | 3.370 | 28,15 | ||||
| 2026-02-10 | 13F | Carnegie Lake Advisors LLC | 5.800 | 0,00 | 350 | 8,36 | ||||
| 2025-11-13 | 13F | Bridgewater Associates, LP | 0 | -100,00 | 0 | |||||
| 2026-02-17 | 13F | Two Sigma Securities, Llc | 4.367 | 264 | ||||||
| 2026-02-13 | 13F | State Street Corp | 9.884 | 0,00 | 597 | 8,17 | ||||
| 2026-02-02 | 13F | Horizon Investments, LLC | 0 | -100,00 | 0 | |||||
| 2026-04-15 | 13F | Trust Co Of Toledo Na /oh/ | 1.700 | 0,00 | 124 | 20,59 | ||||
| 2026-02-12 | 13F | Wealthspire Advisors, LLC | 3.966 | 135,65 | 239 | 156,99 | ||||
| 2026-04-14 | 13F | Cohen Capital Management, Inc. | 3.419 | 0,00 | 249 | 20,39 | ||||
| 2026-01-22 | 13F | Harwood Advisory Group, LLC | 0 | -100,00 | 0 | -100,00 | ||||
| 2026-01-15 | 13F | Frank, Rimerman Advisors LLC | 37.148 | 0,73 | 2.243 | 9,05 | ||||
| 2026-02-03 | 13F | Strengthening Families & Communities, LLC | 226 | -34,49 | 14 | -31,58 | ||||
| 2026-01-15 | 13F | Range Financial Group LLC | 9.710 | 3,96 | 586 | 12,69 | ||||
| 2026-04-15 | 13F | Seacrest Wealth Management, Llc | 6.221 | 65,06 | 453 | 88,33 | ||||
| 2026-04-14 | 13F | Prospera Financial Services Inc | 16.174 | 0,41 | 1.177 | 20,99 | ||||
| 2026-02-10 | 13F | Goldman Sachs Group Inc | 6.986.149 | -32,80 | 421.754 | -27,23 | ||||
| 2026-02-13 | 13F | Evelyn Partners Investment Management Services Ltd | 155 | 0,00 | 9 | 12,50 | ||||
| 2026-02-17 | 13F | Wellington Management Group Llp | 3.637.463 | -21,80 | 219.594 | -15,32 | ||||
| 2026-02-10 | 13F | Goldman Sachs Group Inc | Call | 145.200 | 161,62 | 8.766 | 183,29 | |||
| 2026-02-11 | 13F | Nikko Asset Management Americas, Inc. | 91.178 | 5.504 | ||||||
| 2026-04-28 | 13F | Southern Michigan Bank & Trust | 185 | 13 | ||||||
| 2026-02-10 | 13F | Goldman Sachs Group Inc | Put | 153.000 | 175,68 | 9.237 | 198,51 | |||
| 2026-04-08 | 13F | Ausbil Investment Management Ltd | Put | 40.000 | 12 | |||||
| 2025-11-04 | 13F | IMC-Chicago, LLC | 0 | -100,00 | 0 | -100,00 | ||||
| 2026-02-12 | 13F | Advisors Asset Management, Inc. | 32.702 | -8,16 | 1.974 | -0,55 | ||||
| 2026-02-17 | 13F | FIL Ltd | 0 | -100,00 | 0 | |||||
| 2026-04-23 | 13F | American National Bank | 370 | -0,27 | 27 | 18,18 | ||||
| 2026-02-05 | 13F | Pacific Heights Asset Management Llc | 425.000 | 21,43 | 25.657 | 31,49 | ||||
| 2026-02-11 | 13F | Greykasell Wealth Strategies, Inc. | 120 | 7 | ||||||
| 2026-02-12 | 13F | Cibc World Markets Corp | Call | 0 | -100,00 | 0 | -100,00 | |||
| 2026-01-22 | 13F | Willis Investment Counsel | 474.843 | -5,82 | 28.666 | 1,98 | ||||
| 2026-02-13 | 13F | VPR Management LLC | 20.000 | 0,00 | 1.207 | 8,25 | ||||
| 2026-02-11 | 13F | Cerity Partners LLC | 111.504 | -6,02 | 6.731 | 1,77 | ||||
| 2026-02-13 | 13F | Squarepoint Ops LLC | Put | 225.000 | -10,61 | 13.583 | -3,20 | |||
| 2026-01-28 | 13F | Financial Perspectives, Inc | 365 | 0,00 | 22 | 10,00 | ||||
| 2026-04-07 | 13F | Park Avenue Securities Llc | 25.574 | 9,83 | 2 | 0,00 | ||||
| 2026-02-10 | 13F | Bruce G. Allen Investments, LLC | 1.175 | -32,47 | 71 | -27,84 | ||||
| 2026-02-13 | 13F | Squarepoint Ops LLC | Call | 247.000 | -0,12 | 14.911 | 8,16 | |||
| 2026-04-21 | 13F | GHP Investment Advisors, Inc. | 865 | 2,73 | 63 | 24,00 | ||||
| 2026-02-03 | 13F | Canal Insurance CO | 60.000 | 0,00 | 4 | 0,00 | ||||
| 2025-11-14 | 13F | Capstone Investment Advisors, Llc | Call | 14.700 | 820 | |||||
| 2026-04-21 | 13F | Mesirow Financial Investment Management, Inc. | 11.094 | 9,31 | 807 | 31,70 | ||||
| 2026-01-23 | 13F | Stephenson National Bank & Trust | 0 | -100,00 | 0 | |||||
| 2026-02-03 | 13F | Manning & Napier Advisors Llc | 126.696 | -2,55 | 7.718 | 5,60 | ||||
| 2025-11-14 | 13F | Capstone Investment Advisors, Llc | Put | 6.000 | 334 | |||||
| 2026-04-24 | 13F | Yousif Capital Management, Llc | 30.326 | 0,00 | 2.206 | 12,96 | ||||
| 2026-04-28 | 13F | SBI Securities Co., Ltd. | 26.626 | 8,11 | 1.937 | 30,28 | ||||
| 2026-04-08 | 13F | Legacy Wealth Asset Management, LLC | 34.655 | 33,60 | 2.521 | 61,02 | ||||
| 2026-04-27 | 13F | Meramec Financial Planners, LLC | 32 | 0,00 | 3 | 0,00 | ||||
| 2026-02-17 | 13F | Northern Trust Corp | 2.273.182 | -6,97 | 137.232 | 0,74 | ||||
| 2025-11-14 | 13F | Axa S.a. | 0 | -100,00 | 0 | |||||
| 2026-02-17 | 13F | Millennium Management Llc | Put | 14.000 | -97,47 | 845 | -97,26 | |||
| 2026-02-09 | 13F | Choate Investment Advisors | 7.228 | -6,95 | 436 | 0,69 | ||||
| 2026-02-17 | 13F | Millennium Management Llc | Call | 57.400 | 229,89 | 3.465 | 257,22 | |||
| 2025-11-17 | 13F | FSA Wealth Management LLC | 250 | 0,00 | 14 | 8,33 | ||||
| 2026-02-11 | 13F | Syon Capital Llc | 43.124 | 2.603 | ||||||
| 2026-04-09 | 13F | Veracity Capital LLC | 5.840 | 425 | ||||||
| 2026-02-05 | 13F | Elyxium Wealth, LLC | 78 | 5 | ||||||
| 2026-02-13 | 13F | Palisade Asset Management, LLC | 0 | -100,00 | 0 | |||||
| 2026-02-12 | 13F | DRW Securities, LLC | 6.081 | 367 | ||||||
| 2026-01-15 | 13F | Nisa Investment Advisors, Llc | 1.628 | 16,29 | 98 | 25,64 | ||||
| 2026-02-03 | 13F | We Are One Seven, LLC | 7.749 | -4,30 | 468 | 3,55 | ||||
| 2026-01-28 | 13F | Hoey Investments, Inc | 1.000 | 0,00 | 60 | 9,09 | ||||
| 2026-01-28 | 13F | U S Global Investors Inc | 3.500 | 0,00 | 211 | 8,21 | ||||
| 2026-02-12 | 13F | Tocqueville Asset Management L.p. | 25.185 | 0,14 | 1.520 | 8,42 | ||||
| 2026-02-18 | 13F | Beacon Pointe Advisors, LLC | 12.148 | -27,67 | 733 | -21,69 | ||||
| 2026-02-17 | 13F | Signature Equity Partners, LLC | 165 | 10 | ||||||
| 2026-02-06 | 13F | Hartford Funds Management Co LLC | 12.730 | -0,83 | 769 | 7,41 | ||||
| 2025-11-14 | 13F | Hrt Financial Lp | 0 | -100,00 | 0 | |||||
| 2026-04-16 | 13F | Evolve Private Wealth, Llc | 4.587 | 334 | ||||||
| 2026-04-23 | 13F | Orca Investment Management, LLC | 31.690 | 2.305 | ||||||
| 2026-02-06 | 13F | Addison Advisors LLC | 751 | 31,75 | 45 | 45,16 | ||||
| 2026-02-13 | 13F | SRS Capital Advisors, Inc. | 4.016 | 8,92 | 242 | 18,05 | ||||
| 2026-04-13 | 13F | Affinity Capital Advisors, LLC | 3.670 | 267 | ||||||
| 2026-04-27 | 13F | Qrg Capital Management, Inc. | 171.764 | 27,86 | 12.494 | 54,08 | ||||
| 2026-01-27 | 13F | WealthCollab, LLC | 126 | 50,00 | 8 | 75,00 | ||||
| 2026-04-23 | 13F | Farmers & Merchants Investments Inc | 500 | 0,00 | 36 | 20,00 | ||||
| 2026-04-21 | 13F | Financial Consulate, Inc | 466 | 142,71 | 34 | 200,00 | ||||
| 2026-02-11 | 13F | IMA Wealth, Inc. | 95 | 6 | ||||||
| 2026-02-02 | 13F | Breakwater Investment Management | 160 | 0,00 | 10 | 12,50 | ||||
| 2026-02-13 | 13F | Kilter Group LLC | 26 | 116,67 | 2 | |||||
| 2026-02-03 | 13F | Anfield Capital Management, LLC | 1.931 | 0,00 | 117 | 8,41 | ||||
| 2026-02-24 | 13F | MidFirst Bank | 33.096 | 1.987 | ||||||
| 2026-04-20 | 13F | Keudell/Morrison Wealth Management | 3.200 | 233 | ||||||
| 2026-04-14 | 13F | Baldwin Brothers Inc/ma | 2.750 | 200 | ||||||
| 2026-04-28 | 13F | Quent Capital, LLC | 0 | -100,00 | 0 | |||||
| 2026-01-21 | 13F/A | Euro Pacific Asset Management, LLC | 58.343 | 0,02 | 3 | 0,00 | ||||
| 2026-04-13 | 13F | Creative Financial Designs Inc /adv | 256 | 56,10 | 19 | 100,00 | ||||
| 2026-04-20 | 13F | YANKCOM Partnership | 0 | -100,00 | 0 | |||||
| 2026-04-17 | 13F | AdvisorNet Financial, Inc | 500 | -12,43 | 36 | 5,88 | ||||
| 2026-04-16 | 13F | XML Financial, LLC | 8.540 | -1,84 | 621 | 18,29 | ||||
| 2026-04-21 | 13F | Vise Technologies, Inc. | 37.241 | 0,00 | 2.248 | 0,00 | ||||
| 2026-02-10 | 13F | Welch & Forbes Llc | 3.619 | -29,30 | 218 | -23,51 | ||||
| 2026-04-08 | 13F | Wealth Enhancement Advisory Services, Llc | 55.348 | -32,81 | 4.054 | -24,06 | ||||
| 2026-04-24 | 13F | Oakworth Capital, Inc. | 52 | 0,00 | 4 | 0,00 | ||||
| 2026-03-24 | 13F/A | Barclays Plc | Call | 0 | -100,00 | 0 | -100,00 | |||
| 2026-04-20 | 13F | Hilton Head Capital Partners, LLC | 427 | 0,00 | 31 | 24,00 | ||||
| 2026-01-08 | 13F | Gryphon Financial Partners LLC | 17.595 | 72,15 | 1.062 | 86,64 | ||||
| 2026-01-29 | 13F | Aprio Wealth Management, LLC | 7.466 | 32,45 | 451 | 43,31 | ||||
| 2026-01-05 | 13F | Coastline Trust Co | 0 | -100,00 | 0 | |||||
| 2025-11-03 | 13F | Stonegate Investment Group, LLC | 49.897 | 2,23 | 2.782 | 18,49 | ||||
| 2026-03-03 | 13F/A | Caitong International Asset Management Co., Ltd | 6.974 | 136,41 | 421 | 156,71 | ||||
| 2026-04-24 | 13F | Private Advisor Group, LLC | 12.638 | -29,59 | 919 | -15,14 | ||||
| 2026-02-18 | 13F | GWM Advisors LLC | 0 | -100,00 | 0 | |||||
| 2026-02-13 | 13F | Ingalls & Snyder Llc | 51.219 | -11,16 | 3 | 0,00 | ||||
| 2026-02-17 | 13F | Ameriprise Financial Inc | 692.562 | 76,38 | 41.801 | 90,98 | ||||
| 2026-02-17 | 13F | Capital Fund Management S.a. | 100.524 | 6.069 | ||||||
| 2026-01-15 | 13F | Gleason Group, Inc. | 14.747 | 0,00 | 890 | 8,27 | ||||
| 2026-02-13 | 13F | OpenArc Corporate Advisory, LLC | 5.374 | 324 | ||||||
| 2026-01-22 | 13F | Accordant Advisory Group Inc | 3 | 0 | ||||||
| 2026-04-06 | 13F | CX Institutional | 0 | -100,00 | 0 | |||||
| 2026-04-22 | 13F | Larry Mathis Financial Planning, LLC | 8.247 | -2,41 | 600 | 17,45 | ||||
| 2026-02-06 | 13F | Envestnet Portfolio Solutions, Inc. | 5.602 | -1,55 | 338 | 6,62 | ||||
| 2026-02-09 | 13F | Coldstream Capital Management Inc | 6.885 | 6,73 | 416 | 15,60 | ||||
| 2026-02-09 | 13F | Delta Asset Management Llc/tn | 1.733 | 0,00 | 105 | 8,33 | ||||
| 2026-04-28 | 13F | Cohen Investment Advisors LLC | 64.768 | -0,12 | 4.711 | 20,36 | ||||
| 2026-02-04 | 13F | Raelipskie Partnership | 17.527 | -6,41 | 1.058 | 1,34 | ||||
| 2025-11-14 | 13F | D. E. Shaw & Co., Inc. | Call | 0 | -100,00 | 0 | -100,00 | |||
| 2026-04-20 | 13F | Kestra Private Wealth Services, Llc | 16.862 | -2,68 | 1.227 | 17,21 | ||||
| 2026-02-12 | 13F | Stamos Capital Partners, L.p. | 9.820 | 9,68 | 593 | 18,64 | ||||
| 2026-01-23 | 13F | Assetmark, Inc | 2.658 | 14,18 | 160 | 24,03 | ||||
| 2026-02-13 | 13F | JustInvest LLC | 112.793 | -1,04 | 6.809 | 7,14 | ||||
| 2026-04-23 | 13F | MQS Management LLC | 14.771 | -43,86 | 1.074 | -32,37 | ||||
| 2026-02-17 | 13F | Parallax Volatility Advisers, L.P. | Call | 73.800 | 18.350,00 | 4.455 | 20.150,00 | |||
| 2026-02-17 | 13F | Parallax Volatility Advisers, L.P. | 20.316 | 39,93 | 1.226 | 51,55 | ||||
| 2026-02-17 | 13F | Parallax Volatility Advisers, L.P. | Put | 68.400 | 4.129 | |||||
| 2026-02-17 | 13F | Bank Of America Corp /de/ | 3.076.353 | -11,23 | 185.719 | -3,87 | ||||
| 2026-02-12 | 13F | Rossby Financial, LCC | 458 | 4,81 | 28 | 12,50 | ||||
| 2026-02-17 | 13F | Toronto Dominion Bank | 970 | 0,00 | 59 | 7,27 | ||||
| 2026-02-03 | 13F | NewEdge Wealth, LLC | 97.082 | 8,80 | 5.861 | 18,31 | ||||
| 2026-02-06 | 13F | Larson Financial Group LLC | 1.952 | -18,16 | 118 | -11,36 | ||||
| 2026-04-20 | 13F | Williams & Novak, LLC | 4.689 | 345 | ||||||
| 2026-04-20 | 13F | Jfs Wealth Advisors, Llc | 801 | 0,00 | 58 | 20,83 | ||||
| 2026-02-06 | 13F | Vestmark Advisory Solutions, Inc. | 0 | -100,00 | 0 | |||||
| 2026-04-06 | 13F | Highline Wealth Partners Llc | 436 | 1,16 | 32 | 19,23 | ||||
| 2026-02-03 | 13F | Primoris Wealth Advisors, Llc | 23.000 | 1.389 | ||||||
| 2026-02-13 | 13F | WealthTrust Axiom LLC | 13.678 | -4,54 | 826 | 3,38 | ||||
| 2026-04-22 | 13F | Janney Montgomery Scott LLC | 210.867 | -9,52 | 15 | 7,14 | ||||
| 2026-01-30 | 13F | Turning Point Benefit Group, Inc. | 6 | 0,00 | 0 | |||||
| 2026-02-12 | 13F | Jane Street Group, Llc | Put | 38.200 | 285,86 | 2.306 | 318,51 | |||
| 2026-02-13 | 13F | Pingora Partners LLC | 689 | 0,00 | 42 | 7,89 | ||||
| 2026-02-17 | 13F | Mercer Global Advisors Inc /adv | 107.339 | 2,29 | 6.480 | 10,77 | ||||
| 2026-02-05 | 13F | Plante Moran Financial Advisors, LLC | 50 | 3 | ||||||
| 2026-04-23 | 13F | J.w. Cole Advisors, Inc. | 3.633 | 264 | ||||||
| 2026-04-27 | 13F | Jamison Private Wealth Management, Inc. | 81.583 | 0,60 | 5.934 | 21,23 | ||||
| 2026-02-03 | 13F | Chesapeake Capital Corp /il/ | 14.640 | 27,48 | 884 | 37,97 | ||||
| 2026-02-17 | 13F | Grantham, Mayo, Van Otterloo & Co. LLC | 130.841 | 16,38 | 7.899 | 26,03 | ||||
| 2025-11-07 | 13F | King Luther Capital Management Corp | 0 | -100,00 | 0 | |||||
| 2026-02-05 | 13F | Allworth Financial LP | 5.801 | 25,08 | 350 | 35,66 | ||||
| 2026-01-07 | 13F | Sagespring Wealth Partners, Llc | 14.789 | 8,52 | 893 | 17,52 | ||||
| 2026-04-16 | 13F | Smith Thornton Advisors LLC | 2.800 | 204 | ||||||
| 2026-02-13 | 13F | Wells Fargo & Company/mn | Call | 151.000 | 9.116 | |||||
| 2026-02-13 | 13F | Panagora Asset Management Inc | 52.409 | 4,59 | 3.164 | 13,25 | ||||
| 2026-02-17 | 13F | Gotham Asset Management, LLC | 7.436 | 17,21 | 449 | 26,91 | ||||
| 2026-02-13 | 13F | Wells Fargo & Company/mn | 299.878 | 6,66 | 18.104 | 15,50 | ||||
| 2026-04-27 | 13F | Leonteq Securities AG | 3.138 | -6,22 | 228 | 13,43 | ||||
| 2026-04-15 | 13F | Eaton Financial Holdings Company, LLC | 8.983 | 2,06 | 653 | 22,98 | ||||
| 2026-02-17 | 13F | Warren Averett Asset Management, LLC | 187.375 | 11.312 | ||||||
| 2026-02-09 | 13F | Cary Street Partner Investment Advisory Llc | 3.216 | 4,15 | 194 | 12,79 | ||||
| 2026-04-23 | 13F | Forum Financial Management, LP | 0 | -100,00 | 0 | |||||
| 2026-01-29 | 13F | Nichols & Pratt Advisers Llp /ma | 72.539 | -1,31 | 4.379 | 6,88 | ||||
| 2026-01-30 | 13F | Jackson Hole Capital Partners, LLC | 22.046 | 0,00 | 1.331 | 8,22 | ||||
| 2026-01-27 | 13F | Elevated Capital Advisors, LLC | 39 | 2 | ||||||
| 2026-02-02 | 13F | Montag A & Associates Inc | 1.387 | 133,90 | 84 | 151,52 | ||||
| 2026-04-15 | 13F | Merit Financial Group, LLC | 13.764 | 3,68 | 1.001 | 24,97 | ||||
| 2026-04-13 | 13F | IFP Advisors, Inc | 1.115 | -7,39 | 81 | 12,50 | ||||
| 2026-02-12 | 13F | Jane Street Group, Llc | 193.477 | -63,22 | 11.680 | -60,17 | ||||
| 2026-02-12 | 13F | Jane Street Group, Llc | Call | 754.000 | 76,21 | 45.519 | 90,81 | |||
| 2026-04-13 | 13F | Mather Group, Llc. | 3.423 | 0,80 | 249 | 20,98 | ||||
| 2026-02-17 | 13F | D. E. Shaw & Co., Inc. | 520.118 | -2,76 | 31.400 | 5,30 | ||||
| 2026-02-17 | 13F | D. E. Shaw & Co., Inc. | Put | 6.800 | 411 | |||||
| 2026-04-03 | 13F | Ridgewood Investments LLC | 9.780 | -44,97 | 711 | -28,18 | ||||
| 2026-02-10 | 13F | Moors & Cabot, Inc. | 30.179 | -4,32 | 1.822 | 3,58 | ||||
| 2026-04-10 | 13F | Marshall Financial Group LLC | 13.231 | 0,08 | 962 | 20,55 | ||||
| 2026-02-10 | 13F | Bank of New York Mellon Corp | 140.061 | 2,96 | 8.455 | 11,48 | ||||
| 2026-04-17 | 13F | Anchyra Partners Llc | 6.409 | 17,30 | 466 | 41,64 | ||||
| 2026-04-15 | 13F | Activest Wealth Management | 0 | 0 | ||||||
| 2026-04-27 | 13F | HB Wealth Management, LLC | 8.034 | 29,58 | 584 | 56,15 | ||||
| 2026-04-07 | 13F | Signaturefd, Llc | 42.882 | 4,42 | 3.119 | 25,82 | ||||
| 2026-04-15 | 13F | Radnor Capital Management, LLC | 7.600 | 0,00 | 553 | 20,52 | ||||
| 2026-04-13 | 13F | Moody Lynn & Lieberson, Llc | 38.891 | 2.829 | ||||||
| 2026-02-03 | 13F | Denali Advisors Llc | 5.662 | 0,69 | 342 | 8,95 | ||||
| 2026-02-13 | 13F | Arkadios Wealth Advisors | 21.815 | -0,02 | 1.317 | 8,31 | ||||
| 2026-04-16 | 13F | SG Americas Securities, LLC | 31.262 | -78,15 | 2 | -75,00 | ||||
| 2026-04-01 | 13F | Bangor Savings Bank | 447 | 0,00 | 33 | 23,08 | ||||
| 2026-04-15 | 13F | Financial Management Professionals, Inc. | 6.957 | 8,08 | 506 | 30,41 | ||||
| 2026-02-17 | 13F | Perritt Capital Management Inc | 0 | -100,00 | 0 | |||||
| 2026-02-18 | 13F | Garton & Associates Financial Advisors LLC | 428 | 26 | ||||||
| 2026-04-14 | 13F | Nbc Securities, Inc. | 393 | 1,55 | 29 | 21,74 | ||||
| 2025-11-14 | 13F | Cubist Systematic Strategies, LLC | 59.754 | 3.331 | ||||||
| 2026-04-27 | 13F | Greenleaf Trust | 20.710 | 1,29 | 1.506 | 22,04 | ||||
| 2026-02-17 | 13F | Snowden Capital Advisors LLC | 7.752 | 468 | ||||||
| 2026-02-17 | 13F | Guardian Partners Inc. | 105.953 | -2,10 | 7.625 | 26,37 | ||||
| 2026-02-12 | 13F | JPL Wealth Management, LLC | 0 | -100,00 | 0 | |||||
| 2026-04-28 | 13F | K.J. Harrison & Partners Inc | 49.005 | -2,00 | 3.565 | 18,09 | ||||
| 2026-01-20 | 13F | Cromwell Holdings LLC | 5.015 | 19,26 | 303 | 29,06 | ||||
| 2026-02-02 | 13F | Chung Wu Investment Group, LLC | 268 | 0,00 | 16 | 14,29 | ||||
| 2026-04-13 | 13F | Bank of New Hampshire | 3.000 | 0,00 | 218 | 20,44 | ||||
| 2026-04-27 | 13F | Albion Financial Group /ut | 0 | -100,00 | 0 | |||||
| 2026-04-17 | 13F/A | Founders Financial Securities Llc | 13.375 | 3,23 | 1.033 | 31,97 | ||||
| 2026-02-17 | 13F | Farringdon Capital, Ltd. | 12.401 | 183,58 | 749 | 207,82 | ||||
| 2026-02-11 | 13F | Marks Group Wealth Management, Inc | 0 | -100,00 | 0 | |||||
| 2026-01-14 | 13F | Hourglass Capital, Llc | 94.706 | 10,71 | 5.717 | 19,88 | ||||
| 2026-02-11 | 13F | CoreFirst Bank & Trust | 0 | -100,00 | 0 | |||||
| 2026-02-05 | 13F | Berkeley Capital Partners, LLC | 14.251 | -1,60 | 860 | 6,57 | ||||
| 2025-11-14 | 13F | Bridgefront Capital, LLC | 0 | -100,00 | 0 | -100,00 | ||||
| 2026-02-04 | 13F | Fusion Capital, LLC | 127.726 | 1,43 | 7.711 | 7,32 | ||||
| 2026-02-10 | 13F | Basepoint Wealth LLC | 298 | 18 | ||||||
| 2026-02-06 | 13F | Redmont Wealth Advisors Llc | 135 | 0,00 | 8 | 14,29 | ||||
| 2026-01-30 | 13F | Pekin Hardy Strauss, Inc. | 3.378 | 204 | ||||||
| 2026-02-20 | 13F | Sunbelt Securities, Inc. | 1.284 | 0,00 | 78 | 8,45 | ||||
| 2026-02-12 | 13F | ROSS\JOHNSON & Associates LLC | 1.070 | 0,00 | 65 | 8,47 | ||||
| 2026-04-21 | 13F | SmartHarvest Portfolios, LLC | 3.354 | 244 | ||||||
| 2026-04-20 | 13F | Legal Advantage Investments, Inc. | 8.307 | 0,00 | 604 | 20,56 | ||||
| 2025-11-14 | 13F | Peak6 Llc | 0 | -100,00 | 0 | -100,00 | ||||
| 2026-01-29 | 13F | D.a. Davidson & Co. | 30.828 | -8,77 | 1.861 | -1,22 | ||||
| 2026-02-13 | 13F | Acumen Wealth Advisors, LLC | 75 | 5 | ||||||
| 2025-10-30 | 13F | Twin Peaks Wealth Advisors, LLC | 0 | -100,00 | 0 | |||||
| 2026-02-10 | 13F | ESL Trust Services, LLC | 0 | -100,00 | 0 | |||||
| 2026-02-13 | 13F | Barclays Plc | 219.779 | -21,11 | 13.268 | -14,58 | ||||
| 2026-02-13 | 13F | Barclays Plc | Put | 250.000 | 0,00 | 15.092 | 8,29 | |||
| 2026-02-13 | 13F | Pinnacle Wealth Planning Services, Inc. | 6.598 | -0,42 | 398 | 7,86 | ||||
| 2026-02-17 | 13F | Scarborough Advisors, LLC | 0 | -100,00 | 0 | |||||
| 2026-04-09 | 13F | Boit C F David | 2.000 | 0,00 | 145 | 17,89 | ||||
| 2026-04-17 | 13F | Brown, Lisle/cummings, Inc. | 40 | 122,22 | 3 | 100,00 | ||||
| 2026-02-05 | 13F | Tucker Asset Management Llc | 109 | 7 | ||||||
| 2026-02-03 | 13F | Crossmark Global Holdings, Inc. | 158.772 | -12,26 | 9.585 | -4,99 | ||||
| 2026-02-17 | 13F | TCG Advisory Services, LLC | 4.987 | 301 | ||||||
| 2026-02-13 | 13F | Icon Wealth Advisors, LLC | 0 | -100,00 | 0 | |||||
| 2025-11-03 | 13F | Summit Global Investments | 0 | -100,00 | 0 | |||||
| 2026-04-08 | 13F | Violich Capital Management, Inc. | 186.929 | 0,32 | 13.597 | 20,88 | ||||
| 2026-02-05 | 13F | Bank Julius Baer & Co. Ltd, Zurich | 306.229 | 66,23 | 18.487 | 80,01 | ||||
| 2026-02-04 | 13F | Valeo Financial Advisors, LLC | 10.845 | 1,00 | 655 | 9,36 | ||||
| 2026-04-23 | 13F | Simmons Bank | 45.138 | 3,01 | 3.283 | 24,12 | ||||
| 2026-04-22 | 13F | Motco | 200 | 0,00 | 15 | 16,67 | ||||
| 2026-01-30 | 13F | R Squared Ltd | 10.957 | -43,35 | 661 | -38,68 | ||||
| 2026-02-13 | 13F | Neuberger Berman Group LLC | 2.368.647 | -3,25 | 142.995 | 4,77 | ||||
| 2026-02-13 | 13F | Mml Investors Services, Llc | 26.933 | -3,41 | 1.626 | 4,57 | ||||
| 2026-02-17 | 13F | Glenmede Trust Co Na | 9.019 | 2,05 | 544 | 27,10 | ||||
| 2026-02-23 | 13F | Virtu Financial LLC | 10.191 | 1 | ||||||
| 2025-11-14 | 13F | Wetherby Asset Management Inc | 32.292 | -1,41 | 1.800 | 14,29 | ||||
| 2026-01-27 | 13F | Regions Financial Corp | 3.955 | -64,47 | 239 | -61,61 | ||||
| 2026-02-11 | 13F | Capital Analysts, Inc. | 0 | -100,00 | 0 | |||||
| 2026-02-02 | 13F | Fifth Third Bancorp | 2.013 | -93,38 | 122 | -92,86 | ||||
| 2026-02-11 | 13F | Strategy Asset Managers Llc | 118.357 | 17,96 | 7.145 | 27,75 | ||||
| 2026-04-21 | 13F | Maseco Llp | 193 | 14 | ||||||
| 2025-11-07 | 13F | Synovus Financial Corp | 26.881 | 0,36 | 1.499 | 16,30 | ||||
| 2026-04-28 | 13F | Timber Creek Capital Management LLC | 5.000 | 0,00 | 364 | 20,60 | ||||
| 2026-02-13 | 13F | Sei Investments Co | 83.446 | 39,09 | 5.038 | 50,61 | ||||
| 2026-04-28 | 13F | Fortis Capital Advisors, LLC | 3.580 | 5,51 | 260 | 27,45 | ||||
| 2026-01-30 | 13F | Archer Investment Corp | 690 | -22,47 | 42 | -16,33 | ||||
| 2026-04-23 | 13F | Kohmann Bosshard Financial Services, LLC | 2.444 | 178 | ||||||
| 2026-02-09 | 13F | Fisher Asset Management, LLC | 23.402.474 | 1,09 | 1.412.807 | 9,47 | ||||
| 2026-04-17 | 13F | PKO Investment Management Joint-Stock Co | 94.008 | 23,36 | 6.838 | 48,65 | ||||
| 2026-02-12 | 13F | Stonebridge Capital Advisors LLC | 0 | -100,00 | 0 | |||||
| 2026-04-24 | 13F | Walker Asset Management, LLC | 3.085 | 224 | ||||||
| 2025-11-14 | 13F | Binnacle Investments Inc | 248 | 51,22 | 14 | 85,71 | ||||
| 2026-01-20 | 13F | Ascent Group, LLC | 4.625 | -11,16 | 279 | -3,79 | ||||
| 2026-02-10 | 13F | Principia Wealth Advisory, LLC | 157 | 0,00 | 9 | 12,50 | ||||
| 2026-02-13 | 13F | Toroso Investments, LLC | 164.262 | 26,47 | 9.916 | 36,94 | ||||
| 2026-04-21 | 13F | Abbington Investment Group | 71.096 | 2,61 | 5.172 | 23,65 | ||||
| 2026-02-17 | 13F | Guggenheim Capital Llc | 15.407 | 5,43 | 930 | 14,25 | ||||
| 2026-02-10 | 13F | Norges Bank | 421.334 | 25.436 | ||||||
| 2026-02-06 | 13F | HighTower Advisors, LLC | 181.052 | 0,79 | 10.930 | 9,15 | ||||
| 2026-02-09 | 13F | MTM Investment Management, LLC | 1.100 | 0,00 | 66 | 8,20 | ||||
| 2026-02-05 | 13F | Atria Investments Llc | 0 | -100,00 | 0 | |||||
| 2026-02-10 | 13F | Sivia Capital Partners, LLC | 10.441 | 132,75 | 630 | 152,00 | ||||
| 2026-02-11 | 13F | Parallel Advisors, LLC | 12.039 | 1,26 | 727 | 9,67 | ||||
| 2026-04-22 | 13F | Sterling Capital Management LLC | 340 | -0,58 | 25 | 20,00 | ||||
| 2026-03-12 | 13F | Winthrop Partners - Wny, Llc | 0 | -100,00 | 0 | |||||
| 2026-02-04 | 13F | Community Bank, N.A. | 150 | 0,00 | 9 | 12,50 | ||||
| 2026-02-12 | 13F | Bank Of Montreal /can/ | 1.358.585 | 264,44 | 82.018 | 294,64 | ||||
| 2026-04-20 | 13F | City State Bank | 25 | 0,00 | 2 | 0,00 |