Grundlæggende statistik
| Institutionelle ejere | 361 total, 361 long only, 0 short only, 0 long/short - change of 6,18% MRQ |
| Gennemsnitlig porteføljeallokering | 0.7251 % - change of -4,17% MRQ |
| Institutionelle aktier (lange) | 58.742.570 (ex 13D/G) - change of 2,58MM shares 4,60% MRQ |
| Institutionel værdi (lang) | $ 2.726.675 USD ($1000) |
Institutionelt ejerskab og aktionærer
Vanguard Bond Index Funds - Vanguard Ultra-Short Bond ETF (US:VUSB) har 361 institutionelle ejere og aktionærer, der har indsendt 13D/G- eller 13F-formularer til Securities Exchange Commission (SEC). Disse institutioner har i alt 58,742,570 aktier. Største aktionærer omfatter Jpmorgan Chase & Co, Bank Of America Corp /de/, Bramshill Investments, LLC, Wells Fargo & Company/mn, Ronald Blue Trust, Inc., Wharton Business Group, LLC, Alpine Bank Wealth Management, Avion Wealth, HighTower Advisors, LLC, and LPL Financial LLC .
Vanguard Bond Index Funds - Vanguard Ultra-Short Bond ETF (BATS:VUSB) institutionel ejerskabsstruktur viser aktuelle positioner i virksomheden efter institutioner og fonde, samt seneste ændringer i positionsstørrelse. Større aktionærer kan omfatte individuelle investorer, investeringsforeninger, hedgefonde eller institutioner. Skema 13D angiver, at investoren besidder (eller besidder) mere end 5 % af virksomheden og har til hensigt (eller har til hensigt at) aktivt at forfølge en ændring i forretningsstrategi. Skema 13G indikerer en passiv investering på over 5%.
The share price as of September 12, 2025 is 49,89 / share. Previously, on September 16, 2024, the share price was 49,86 / share. This represents an increase of 0,05% over that period.

Fondens stemningsscore
Fund Sentiment Score (fka Ownership Accumulation Score) finder de aktier, der bliver mest købt af fonde. Det er resultatet af en sofistikeret, multi-faktor kvantitativ model, der identificerer virksomheder med de højeste niveauer af institutionel akkumulering. Scoringsmodellen bruger en kombination af den samlede stigning i oplyste ejere, ændringerne i porteføljeallokeringer i disse ejere og andre målinger. Tallet går fra 0 til 100, hvor højere tal indikerer et højere niveau af akkumulering for sine jævnaldrende, og 50 er gennemsnittet.
Opdateringsfrekvens: Dagligt
Se Ownership Explorer, som giver en liste over højest rangerende virksomheder.
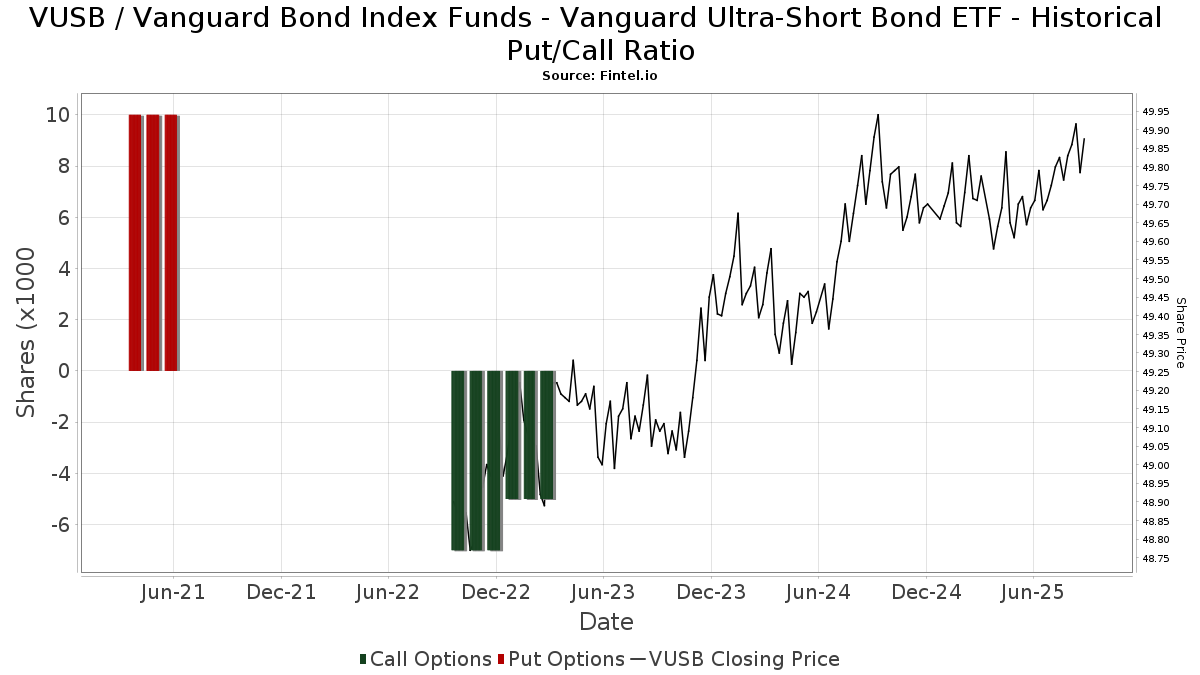
Institutionel Put/Call-forhold
Ud over at indberette standardaktie- og gældsudstedelser skal institutter med mere end 100 mill. aktiver under forvaltning også oplyse deres put- og call-optionsbeholdninger. Da salgsoptioner generelt indikerer negativ stemning, og købsoptioner indikerer positiv stemning, kan vi få en fornemmelse af den overordnede institutionelle stemning ved at plotte forholdet mellem put og kald. Diagrammet til højre viser det historiske put/call-forhold for dette instrument.
Brug af Put/Call Ratio som en indikator for investorernes stemning overvinder en af de vigtigste mangler ved at bruge totalt institutionelt ejerskab, som er, at en betydelig mængde af aktiver under forvaltning investeres passivt for at spore indekser. Passivt forvaltede fonde køber typisk ikke optioner, så indikatoren for put/call-forholdet følger mere nøje følelsen af aktivt forvaltede fonde.
13F og NPORT arkivering
Detaljer om 13F-arkivering er gratis. Detaljer om NP-ansøgninger kræver et premium-medlemskab. Grønne rækker angiver nye positioner. Røde rækker angiver lukkede positioner. Klik på linket ikon for at se den fulde transaktionshistorik.
Opgrader
for at låse premium-data op og eksportere til Excel ![]() .
.
| Fil dato | Kilde | Investor | Type | Gennemsnitlig pris (Øst) |
Aktier | Δ Aktier (%) |
Rapporteret Værdi ($1000) |
Δ Værdi (%) |
Port Alloc (%) |
|
|---|---|---|---|---|---|---|---|---|---|---|
| 2025-08-11 | 13F | CFS Investment Advisory Services, LLC | 4.101 | -12,82 | 0 | |||||
| 2025-08-05 | 13F | Bank Of Montreal /can/ | 136.839 | -1,36 | 6.823 | -1,34 | ||||
| 2025-07-03 | 13F | Garde Capital, Inc. | 704 | 0,00 | 35 | 0,00 | ||||
| 2025-04-09 | 13F | St Germain D J Co Inc | 0 | -100,00 | 0 | -100,00 | ||||
| 2025-08-11 | 13F | Rothschild Investment Llc | 0 | -100,00 | 0 | |||||
| 2025-07-10 | 13F | Cypress Point Wealth Management, LLC | 11.873 | 12,93 | 592 | 12,98 | ||||
| 2025-07-15 | 13F | Regatta Capital Group, Llc | 19.849 | -29,26 | 990 | -29,26 | ||||
| 2025-04-23 | 13F | Mascagni Wealth Management, Inc. | 0 | -100,00 | 0 | -100,00 | ||||
| 2025-08-14 | 13F/A | Zazove Associates Llc | 100.000 | 0,00 | 4.986 | 0,02 | ||||
| 2025-07-28 | 13F | Harbour Investments, Inc. | 5.159 | 257 | ||||||
| 2025-07-30 | 13F | Wbh Advisory Inc | 12.606 | -5,29 | 629 | -5,28 | ||||
| 2025-07-02 | 13F | HBW Advisory Services LLC | 41.254 | 5,09 | 2.057 | 5,11 | ||||
| 2025-08-08 | 13F | Pnc Financial Services Group, Inc. | 5.135 | 0,00 | 256 | 0,00 | ||||
| 2025-07-10 | 13F | Bath Savings Trust Co | 6.400 | 0,00 | 319 | 0,00 | ||||
| 2025-05-15 | 13F | Fairview Capital Investment Management, Llc | 0 | -100,00 | 0 | |||||
| 2025-09-04 | 13F/A | Advisor Group Holdings, Inc. | 123.094 | 15,49 | 6.138 | 15,49 | ||||
| 2025-08-13 | 13F | Jones Financial Companies Lllp | 11.847 | 164,97 | 590 | 165,77 | ||||
| 2025-08-14 | 13F | Peapack Gladstone Financial Corp | 37.460 | -0,35 | 2 | 0,00 | ||||
| 2025-07-15 | 13F | Patriot Investment Management Inc. | 12.608 | -5,67 | 629 | -5,71 | ||||
| 2025-08-11 | 13F | Lowe Brockenbrough & Co Inc | 307.248 | 11,22 | 15.321 | 11,24 | ||||
| 2025-05-02 | 13F | Fortis Group Advisors, LLC | 0 | -100,00 | 0 | |||||
| 2025-05-14 | 13F | Partners Capital Investment Group, Llp | 0 | -100,00 | 0 | |||||
| 2025-07-28 | 13F | Ritholtz Wealth Management | 5.006 | 250 | ||||||
| 2025-08-07 | 13F | Kestra Private Wealth Services, Llc | 10.572 | -37,10 | 527 | -37,04 | ||||
| 2025-08-19 | 13F | Anchor Investment Management, LLC | 2.309 | 1,23 | 115 | 1,77 | ||||
| 2025-08-14 | 13F | Integrated Wealth Concepts LLC | 66.545 | -5,61 | 3.318 | -5,58 | ||||
| 2025-08-14 | 13F | Wharton Business Group, LLC | 1.310.019 | -5,43 | 65 | -5,80 | ||||
| 2025-07-08 | 13F/A | Salem Investment Counselors Inc | 80.941 | 4,83 | 4.036 | 4,86 | ||||
| 2025-07-10 | 13F | CWC Advisors, LLC. | 97.440 | 2,54 | 4.859 | 2,55 | ||||
| 2025-07-15 | 13F | North Star Investment Management Corp. | 1.460 | 144,15 | 73 | 148,28 | ||||
| 2025-07-22 | 13F | Siligmueller & Norvid Wealth Advisors LLC | 145.823 | 80,37 | 7.255 | 80,00 | ||||
| 2025-07-16 | 13F | Castleview Partners, Llc | 6.730 | -0,15 | 336 | -0,30 | ||||
| 2025-05-12 | 13F | WealthPlan Investment Management, LLC | 0 | -100,00 | 0 | |||||
| 2025-07-17 | 13F | Alpine Bank Wealth Management | 1.253.578 | 58,75 | 62.510 | 58,79 | ||||
| 2025-07-10 | 13F | Websterrogers Financial Advisors, Llc | 82.412 | -1,21 | 4.110 | -1,20 | ||||
| 2025-08-29 | NP | BHILX - BHILL Fund Managed Account Completion Shares | 141.902 | 7.076 | ||||||
| 2025-05-05 | 13F | Partners in Financial Planning | 0 | -100,00 | 0 | -100,00 | ||||
| 2025-08-04 | 13F | Roble, Belko & Company, Inc | 28.842 | -25,42 | 1 | 0,00 | ||||
| 2025-08-04 | 13F | Creekmur Asset Management LLC | 1.574 | 0,00 | 78 | 0,00 | ||||
| 2025-08-14 | 13F | Mariner, LLC | 97.858 | 12,28 | 4.880 | 12,29 | ||||
| 2025-08-07 | 13F | WESCAP Management Group, Inc. | 16.429 | -4,69 | 819 | -4,66 | ||||
| 2025-07-28 | 13F | RFG Advisory, LLC | 12.426 | 23,01 | 620 | 23,06 | ||||
| 2025-07-16 | 13F | Fischer Financial Services, Inc. | 80.640 | 16,20 | 4.016 | 16,07 | ||||
| 2025-07-28 | 13F | CGC Financial Services, LLC | 20.044 | 12,47 | 1.000 | 12,50 | ||||
| 2025-07-23 | 13F | Prime Capital Investment Advisors, LLC | 6.873 | 1,21 | 343 | 1,18 | ||||
| 2025-08-07 | 13F | Allworth Financial LP | 9.138 | 7,37 | 456 | 7,57 | ||||
| 2025-08-14 | 13F | Raymond James Financial Inc | 422.712 | 40,39 | 21.078 | 40,42 | ||||
| 2025-08-06 | 13F | Robinson Smith Wealth Advisors Llc | 6.158 | 5,12 | 307 | 5,14 | ||||
| 2025-08-14 | 13F | Lebenthal Global Advisors, LLC | 56.594 | 145,48 | 2.822 | 145,60 | ||||
| 2025-07-28 | 13F | Cutler Investment Counsel Llc | 14.770 | 7,29 | 737 | 7,29 | ||||
| 2025-08-07 | 13F | McClarren Financial Advisors, Inc. | 241.995 | 53,09 | 12.067 | 100.458,33 | ||||
| 2025-08-04 | 13F | Grant Street Asset Management, Inc. | 5.169 | -2,31 | 258 | -2,28 | ||||
| 2025-08-19 | 13F/A | Pitcairn Co | 65.155 | 0,00 | 3.249 | 0,00 | ||||
| 2025-08-08 | 13F | CWS Financial Advisors, LLC | 42.659 | -2,74 | 2.127 | -2,70 | ||||
| 2025-07-16 | 13F | Strategic Investment Solutions, Inc. /IL | 40.835 | -3,55 | 2.033 | -3,69 | ||||
| 2025-07-09 | 13F | Market Street Wealth Management Advisors Llc | 12.042 | 21,05 | 600 | 21,21 | ||||
| 2025-07-11 | 13F | Pinnacle Bancorp, Inc. | 200 | 0,00 | 10 | 0,00 | ||||
| 2025-08-06 | 13F | Valtinson Bruner Financial Planning LLC | 397.267 | 15,57 | 19.810 | 15,59 | ||||
| 2025-08-14 | 13F | Paragon Private Wealth Management, LLC | 61.001 | 40,47 | 3.042 | 40,46 | ||||
| 2025-05-05 | 13F | Eagle Bay Advisors LLC | 0 | -100,00 | 0 | |||||
| 2025-08-13 | 13F | Per Stirling Capital Management, LLC. | 12.054 | 13,33 | 601 | 13,40 | ||||
| 2025-07-30 | 13F | Avidian Wealth Solutions, LLC | 46.952 | -22,78 | 2.341 | -22,76 | ||||
| 2025-08-07 | 13F | PFG Advisors | 0 | -100,00 | 0 | |||||
| 2025-08-13 | 13F | Advisory Research Inc | 21.243 | 0,00 | 1.059 | 0,00 | ||||
| 2025-08-18 | 13F/A | National Bank Of Canada /fi/ | 1.437 | 0,00 | 72 | 0,00 | ||||
| 2025-08-15 | 13F | Keel Point, LLC | 10.224 | 0,61 | 510 | 0,59 | ||||
| 2025-07-21 | 13F | Crews Bank & Trust | 119.863 | 1,76 | 5.977 | 1,77 | ||||
| 2025-07-17 | 13F | HB Wealth Management, LLC | 24.888 | -0,54 | 1.241 | -0,48 | ||||
| 2025-08-11 | 13F | VSM Wealth Advisory, LLC | 1.383 | 0,00 | 69 | 0,00 | ||||
| 2025-07-08 | 13F | Nbc Securities, Inc. | 863 | 1,17 | 0 | |||||
| 2025-08-11 | 13F | Capital Square, LLC | 6.518 | -75,97 | 324 | -76,04 | ||||
| 2025-04-14 | 13F | Greenspring Advisors, LLC | 8.452 | 12,90 | 421 | 13,48 | ||||
| 2025-08-14 | 13F | Sagard Holdings Management Inc. | 70.180 | 3.500 | ||||||
| 2025-04-02 | 13F/A | Industrial Alliance Investment Management Inc. | 0 | -100,00 | 0 | |||||
| 2025-07-17 | 13F | Janney Montgomery Scott LLC | 13.753 | 12,08 | 1 | |||||
| 2025-08-01 | 13F | Zhang Financial LLC | 18.099 | 195,40 | 903 | 195,74 | ||||
| 2025-07-17 | 13F | David Kennon Inc | 526.886 | 1,14 | 26.273 | 1,16 | ||||
| 2025-07-15 | 13F | Evanson Asset Management, LLC | 13.440 | -32,21 | 670 | -32,19 | ||||
| 2025-07-31 | 13F | Curio Wealth, Llc | 4.938 | 164.500,00 | 246 | 0,41 | ||||
| 2025-07-25 | 13F | Atria Wealth Solutions, Inc. | 0 | -100,00 | 0 | |||||
| 2025-05-15 | 13F | Cyrus J. Lawrence, LLC | 0 | -100,00 | 0 | |||||
| 2025-08-13 | 13F | Renaissance Technologies Llc | 0 | -100,00 | 0 | |||||
| 2025-08-06 | 13F | Golden State Wealth Management, LLC | 700 | 0,00 | 35 | 0,00 | ||||
| 2025-07-15 | 13F | Fortitude Family Office, LLC | 10.900 | 544 | ||||||
| 2025-07-23 | 13F | Mainsail Asset Management, Llc | 19.542 | 0,31 | 974 | 0,31 | ||||
| 2025-08-14 | 13F | Jane Street Group, Llc | 87.863 | -16,03 | 4.381 | -16,01 | ||||
| 2025-08-14 | 13F | Mml Investors Services, Llc | 394.701 | 298,52 | 20 | 375,00 | ||||
| 2025-08-01 | 13F | Ashton Thomas Private Wealth, LLC | 110.948 | -6,98 | 5.532 | -6,96 | ||||
| 2025-07-30 | 13F | Klingenstein Fields & Co Lp | 4.930 | -79,22 | 246 | -79,27 | ||||
| 2025-07-17 | 13F | Washington Capital Management Inc | 10.000 | 499 | ||||||
| 2025-08-04 | 13F | Leeward Financial Partners, LLC | 122.922 | 216,54 | 6.130 | 216,58 | ||||
| 2025-07-31 | 13F | Red Wave Investments LLC | 626.285 | -0,90 | 31.230 | -0,88 | ||||
| 2025-08-04 | 13F | Pensionmark Financial Group, Llc | 51.332 | 0,00 | 2.560 | 0,00 | ||||
| 2025-08-14 | 13F | TrueWealth Financial Partners | 40.967 | -1,72 | 2.043 | -1,73 | ||||
| 2025-04-16 | 13F | Lam Group, Inc. | 0 | -100,00 | 0 | -100,00 | ||||
| 2025-07-16 | 13F | Exeter Financial, LLC | 13.380 | 2,07 | 667 | 2,14 | ||||
| 2025-07-18 | 13F | GEN Financial Management, INC. | 31.068 | 1.549 | ||||||
| 2025-08-13 | 13F | Sanibel Captiva Trust Company, Inc. | 17.870 | 191,66 | 891 | 192,13 | ||||
| 2025-08-12 | 13F | Palisades Hudson Asset Management, L.P. | 113.481 | 42,08 | 6 | 66,67 | ||||
| 2025-07-10 | 13F | Exchange Traded Concepts, Llc | 0 | -100,00 | 0 | |||||
| 2025-08-12 | 13F | MAI Capital Management | 68.763 | -1,49 | 3.429 | -1,49 | ||||
| 2025-07-01 | 13F | Harbor Investment Advisory, Llc | 1.713 | 0,00 | 85 | 0,00 | ||||
| 2025-05-02 | 13F | Whittier Trust Co Of Nevada Inc | 0 | -100,00 | 0 | |||||
| 2025-08-15 | 13F | CI Private Wealth, LLC | 246.600 | 50,04 | 12.297 | 50,06 | ||||
| 2025-07-23 | 13F | HTG Investment Advisors, Inc. | 87.137 | 13,40 | 4.345 | 13,45 | ||||
| 2025-07-29 | 13F | Private Trust Co Na | 1.508 | 0,00 | 75 | 0,00 | ||||
| 2025-07-29 | 13F | Aspiriant, Llc | 62.926 | 31,52 | 3.138 | 31,53 | ||||
| 2025-07-22 | 13F | Belpointe Asset Management LLC | 26.820 | -19,41 | 1.337 | -19,41 | ||||
| 2025-07-22 | 13F | SOL Capital Management CO | 15.215 | -2,15 | 1 | |||||
| 2025-09-03 | 13F | Ballentine Capital Advisors, Inc | 10.772 | -20,58 | 537 | -20,56 | ||||
| 2025-08-04 | 13F | Murphy Pohlad Asset Management LLC | 5.635 | 16,07 | 281 | 15,70 | ||||
| 2025-07-07 | 13F | Schulz Wealth, LTD. | 167.518 | -0,78 | 8.353 | -0,76 | ||||
| 2025-07-17 | 13F | Eclectic Associates Inc /adv | 199.468 | 7,93 | 9.946 | 7,96 | ||||
| 2025-07-21 | 13F | Life Planning Partners, Inc | 13.976 | -2,68 | 697 | -2,66 | ||||
| 2025-08-14 | 13F | Ancora Advisors, LLC | 509 | 0,00 | 25 | 0,00 | ||||
| 2025-08-13 | 13F | Flow Traders U.s. Llc | 24.471 | 1 | ||||||
| 2025-07-29 | NP | TSPX - Twin Oak Active Opportunities ETF | 0 | -100,00 | 0 | -100,00 | ||||
| 2025-07-07 | 13F | Life Line Wealth Management Llc | 12.218 | 1,21 | 609 | 1,33 | ||||
| 2025-08-07 | 13F | Beese Fulmer Investment Management, Inc. | 25.570 | 0,00 | 1.275 | 0,08 | ||||
| 2025-07-22 | 13F | Apexium Financial, Lp | 19.813 | 113,73 | 988 | 113,64 | ||||
| 2025-08-12 | NP | KAGCX - Kensington Dynamic Growth Fund Class C Shares | 69.090 | 3.445 | ||||||
| 2025-07-17 | 13F | Enclave Advisors LLC | 139.038 | -8,87 | 6.933 | -8,85 | ||||
| 2025-07-23 | 13F | TriaGen Wealth Management LLC | 29.360 | 48,16 | 1.464 | 48,33 | ||||
| 2025-07-22 | 13F | Warwick Investment Management, Inc. | 50.216 | 9,95 | 2.504 | 10,02 | ||||
| 2025-08-11 | 13F | TD Waterhouse Canada Inc. | 20.759 | 1.168,11 | 1.035 | 1.177,78 | ||||
| 2025-08-12 | 13F | Accredited Wealth Management, LLC | 260 | 0,00 | 13 | 0,00 | ||||
| 2025-07-24 | 13F | Ronald Blue Trust, Inc. | 1.858.230 | 7,62 | 92.661 | 7,64 | ||||
| 2025-08-08 | 13F | Bouchey Financial Group Ltd | 25.351 | -10,34 | 1.264 | -10,29 | ||||
| 2025-05-12 | 13F | Fmr Llc | 0 | -100,00 | 0 | |||||
| 2025-07-15 | 13F | SJS Investment Consulting Inc. | 7.167 | -1,54 | 357 | -1,38 | ||||
| 2025-04-14 | 13F | Investment Advisory Group, LLC | 0 | -100,00 | 0 | |||||
| 2025-08-12 | 13F | Clearwater Capital Advisors, LLC | 36.323 | 5,87 | 1.811 | 5,91 | ||||
| 2025-07-07 | 13F | TruWealth Advisors, LLC | 245.580 | 17,59 | 12.246 | 17,60 | ||||
| 2025-08-14 | 13F | Two Sigma Securities, Llc | 10.047 | 501 | ||||||
| 2025-08-12 | 13F | XTX Topco Ltd | 0 | -100,00 | 0 | |||||
| 2025-07-16 | 13F | MontVue Capital Management, Inc. | 34.640 | -1,18 | 1.727 | -1,14 | ||||
| 2025-07-22 | 13F | Olistico Wealth, LLC | 525 | 22,66 | 26 | 23,81 | ||||
| 2025-08-12 | 13F | Titleist Asset Management, Llc | 134.267 | 1,59 | 6.695 | 1,61 | ||||
| 2025-07-29 | 13F | SAM Advisors, LLC | 9.337 | 4,59 | 466 | 4,49 | ||||
| 2025-08-01 | 13F | Planning Directions Inc | 7.433 | -10,15 | 371 | -10,19 | ||||
| 2025-08-01 | 13F | MorganRosel Wealth Management, LLC | 116.066 | 1,72 | 5.788 | 1,74 | ||||
| 2025-08-11 | 13F | Private Advisor Group, LLC | 7.929 | 3,95 | 395 | 3,95 | ||||
| 2025-07-10 | 13F | Focus Financial Network, Inc. | 82.758 | 0,93 | 4.127 | 0,93 | ||||
| 2025-07-30 | 13F | Retirement Planning Group | 19.490 | 0,78 | 972 | 0,73 | ||||
| 2025-07-15 | 13F | Alpha Omega Wealth Management LLC | 285.864 | 4.415,31 | 14.255 | 4.425,08 | ||||
| 2025-08-12 | 13F | Global Retirement Partners, LLC | 77 | 4 | ||||||
| 2025-04-22 | 13F | Elser Financial Planning, Inc | 0 | -100,00 | 0 | -100,00 | ||||
| 2025-08-05 | 13F | Dunhill Financial, LLC | 1.018 | 51 | ||||||
| 2025-05-15 | 13F/A | Orion Portfolio Solutions, LLC | 11.232 | -5,64 | 560 | -5,25 | ||||
| 2025-08-12 | 13F | Coldstream Capital Management Inc | 0 | -100,00 | 0 | |||||
| 2025-07-24 | 13F | Us Bancorp \de\ | 3.296 | -6,36 | 164 | -6,29 | ||||
| 2025-08-04 | 13F | L.m. Kohn & Company | 4.555 | 227 | ||||||
| 2025-07-11 | 13F | Walker Financial Services, Inc. | 55.237 | 2.754 | ||||||
| 2025-08-14 | 13F | Core Wealth Advisors, Inc. | 21.191 | 19,95 | 1.057 | 20,00 | ||||
| 2025-07-16 | 13F | Signaturefd, Llc | 20 | 0,00 | 1 | |||||
| 2025-08-11 | 13F | Principal Securities, Inc. | 2.374 | -1,41 | 118 | -0,84 | ||||
| 2025-07-08 | 13F | Apella Capital, LLC | 165.460 | -4,81 | 8.220 | -4,62 | ||||
| 2025-08-06 | 13F | Convergence Financial, LLC | 18.233 | -57,92 | 909 | -57,92 | ||||
| 2025-08-18 | 13F | Pacific Center for Financial Services | 968.310 | -0,28 | 48.285 | -0,26 | ||||
| 2025-08-04 | 13F | Mesirow Financial Investment Management, Inc. | 288.614 | 2,75 | 14.392 | 2,77 | ||||
| 2025-08-13 | 13F | Cresset Asset Management, LLC | 0 | -100,00 | 0 | |||||
| 2025-07-14 | 13F | U.S. Capital Wealth Advisors, LLC | 53.255 | 2,02 | 2.656 | 2,04 | ||||
| 2025-04-24 | 13F | Mirae Asset Global Investments Co., Ltd. | 0 | -100,00 | 0 | |||||
| 2025-08-13 | 13F | Allegheny Financial Group LTD | 8.346 | 0,00 | 416 | 0,00 | ||||
| 2025-08-11 | 13F | NewEdge Wealth, LLC | 93.024 | -43,73 | 4.630 | -43,84 | ||||
| 2025-07-17 | 13F | Prepared Retirement Institute LLC | 6.033 | -6,98 | 301 | -7,12 | ||||
| 2025-07-18 | 13F | Mountain Pacific Investment Advisers Inc/id | 53.988 | -0,96 | 2.692 | -0,92 | ||||
| 2025-08-12 | 13F | AlphaCore Capital LLC | 60.000 | 0,00 | 2.992 | 0,00 | ||||
| 2025-08-14 | 13F | Peak Asset Management, LLC | 12.662 | 0,00 | 631 | 0,00 | ||||
| 2025-07-22 | 13F | Strid Group, LLC | 0 | -100,00 | 0 | |||||
| 2025-08-11 | 13F | Vanguard Group Inc | 5.605 | 5,18 | 279 | 5,28 | ||||
| 2025-08-07 | 13F/A | Joseph Group Capital Management | 29.568 | -4,71 | 1.474 | -4,66 | ||||
| 2025-04-17 | 13F | Hanson & Doremus Investment Management | 0 | -100,00 | 0 | |||||
| 2025-08-14 | 13F | Stifel Financial Corp | 286.514 | -2,83 | 14.287 | -2,80 | ||||
| 2025-08-14 | 13F | Hrt Financial Lp | 53.586 | 31,03 | 3 | 0,00 | ||||
| 2025-08-14 | 13F | Colony Group, LLC | 313.023 | -16,07 | 15.609 | -16,05 | ||||
| 2025-05-06 | 13F | Quadrant Private Wealth Management, LLC | 0 | -100,00 | 0 | |||||
| 2025-05-07 | 13F | Anson Capital, Inc. | 0 | -100,00 | 0 | |||||
| 2025-08-06 | 13F | Nvwm, Llc | 156.927 | 10,60 | 7.825 | 10,63 | ||||
| 2025-07-31 | 13F | Planning Center, Inc. | 7.282 | 363 | ||||||
| 2025-07-31 | 13F | CVA Family Office, LLC | 4.683 | 15,03 | 234 | 15,35 | ||||
| 2025-07-16 | 13F | Kathmere Capital Management, LLC | 94.167 | -34,24 | 4.696 | -34,23 | ||||
| 2025-07-30 | 13F | LGT Financial Advisors LLC | 2.000 | 0,00 | 100 | 0,00 | ||||
| 2025-08-07 | 13F | Fonville Wealth Management LLC | 427.592 | 11,93 | 21.322 | 11,94 | ||||
| 2025-08-14 | 13F | Federation des caisses Desjardins du Quebec | 857 | 0,00 | 43 | 0,00 | ||||
| 2025-07-30 | 13F | BlueChip Wealth Advisors LLC | 209.098 | 62,59 | 10.427 | 62,63 | ||||
| 2025-08-14 | 13F | Kovitz Investment Group Partners, LLC | 6.471 | 1,75 | 323 | 1,58 | ||||
| 2025-07-11 | 13F | First PREMIER Bank | 3.060 | -11,56 | 0 | |||||
| 2025-07-14 | 13F | AdvisorNet Financial, Inc | 1.972 | 0,00 | 98 | 0,00 | ||||
| 2025-08-11 | 13F | Hopwood Financial Services, Inc. | 5.000 | 0,00 | 249 | 0,00 | ||||
| 2025-08-14 | 13F | Betterment LLC | 110.052 | -58,96 | 5 | -61,54 | ||||
| 2025-08-11 | 13F | Tidemark, LLC | 410 | 20 | ||||||
| 2025-07-16 | 13F | Gradient Capital Advisors, LLC | 12.431 | -10,02 | 620 | -10,03 | ||||
| 2025-08-11 | 13F | TAGStone Capital, Inc. | 8.805 | -37,18 | 438 | |||||
| 2025-07-31 | 13F | Harbour Investment Management Llc | 46.028 | 37,07 | 2.295 | 37,10 | ||||
| 2025-05-08 | 13F | Essential Planning, LLC. | 0 | -100,00 | 0 | |||||
| 2025-07-31 | 13F/A | Avion Wealth | 1.149.310 | 5,69 | 57 | 7,55 | ||||
| 2025-08-12 | 13F | LPL Financial LLC | 1.049.744 | 4,77 | 52.345 | 4,79 | ||||
| 2025-08-14 | 13F | Smartleaf Asset Management LLC | 6.394 | 55,99 | 319 | 55,88 | ||||
| 2025-08-13 | 13F | EverSource Wealth Advisors, LLC | 18.176 | 0,93 | 906 | 1,00 | ||||
| 2025-08-11 | 13F | Regal Investment Advisors LLC | 5.592 | -0,18 | 279 | -0,36 | ||||
| 2025-08-13 | 13F | SageView Advisory Group, LLC | 0 | -100,00 | 0 | |||||
| 2025-08-14 | 13F | GWM Advisors LLC | 13.680 | 123,97 | 682 | 124,34 | ||||
| 2025-05-13 | 13F | Centerpoint Advisors, LLC | 0 | -100,00 | 0 | |||||
| 2025-05-16 | 13F | Coppell Advisory Solutions LLC | 0 | -100,00 | 0 | |||||
| 2025-08-06 | 13F | Modera Wealth Management, LLC | 103.069 | -5,71 | 5.140 | -5,69 | ||||
| 2025-08-14 | 13F | Wells Fargo & Company/mn | 2.430.521 | 114,81 | 121.198 | 114,85 | ||||
| 2025-08-14 | 13F | Bramshill Investments, LLC | 2.456.407 | 22,64 | 122.489 | 22,67 | ||||
| 2025-07-17 | 13F | Halbert Hargrove Global Advisors, Llc | 0 | -100,00 | 0 | |||||
| 2025-07-21 | 13F | Verus Financial Partners, Inc. | 27.912 | -0,03 | 1.388 | 0,22 | ||||
| 2025-08-07 | 13F | Allen Investment Management LLC | 4.089 | 0,00 | 204 | 0,00 | ||||
| 2025-08-07 | 13F | Resources Investment Advisors, LLC. | 117.922 | 13,90 | 5.880 | 13,93 | ||||
| 2025-08-12 | 13F | Pettyjohn, Wood & White, Inc | 4.538 | 0,00 | 226 | 0,00 | ||||
| 2025-07-17 | 13F | Applied Capital LLC | 32.124 | 22,79 | 1.602 | 22,78 | ||||
| 2025-08-12 | 13F | Horizon Kinetics Asset Management Llc | 362.083 | -8,41 | 18.055 | -8,39 | ||||
| 2025-07-18 | 13F | Naples Global Advisors, Llc | 29.250 | -17,14 | 1.459 | -17,11 | ||||
| 2025-07-23 | 13F | SpringVest Wealth Management LLC | 190.511 | 3,53 | 9.500 | 3,54 | ||||
| 2025-07-31 | 13F | Buckingham Strategic Partners | 17.110 | 2,25 | 853 | 2,28 | ||||
| 2025-08-07 | 13F | Compass Financial Group, Inc. | 40.453 | 0,37 | 2.017 | 0,40 | ||||
| 2025-08-04 | 13F | Creative Financial Designs Inc /adv | 750 | 0,00 | 37 | 0,00 | ||||
| 2025-08-11 | 13F | Plum Street Advisors, LLC | 4.312 | 1,22 | 215 | 0,94 | ||||
| 2025-08-08 | 13F | Kingsview Wealth Management, LLC | 9.613 | 23,42 | 479 | 23,45 | ||||
| 2025-08-13 | 13F | Capital Analysts, Inc. | 161.383 | -1,56 | 8 | 0,00 | ||||
| 2025-07-17 | 13F | Sage Rhino Capital Llc | 44.727 | -13,07 | 2.230 | -13,06 | ||||
| 2025-08-14 | 13F | McIlrath & Eck, LLC | 2.542 | 0,00 | 127 | 0,00 | ||||
| 2025-08-12 | 13F | O'shaughnessy Asset Management, Llc | 1 | 0,00 | 0 | |||||
| 2025-08-15 | 13F | Kestra Advisory Services, LLC | 207.872 | 6,08 | 10.366 | 6,10 | ||||
| 2025-08-14 | 13F | Diversify Wealth Management, Llc | 4.920 | 0,39 | 245 | 0,41 | ||||
| 2025-08-15 | 13F | Equitable Holdings, Inc. | 11.958 | 47,10 | 596 | 47,16 | ||||
| 2025-08-07 | 13F | Cahill Financial Advisors Inc | 26.332 | -1,75 | 1.313 | -1,72 | ||||
| 2025-08-13 | 13F | Avestar Capital, LLC | 8.020 | 400 | ||||||
| 2025-08-06 | 13F | Savant Capital, LLC | 8.650 | -4,59 | 431 | -4,43 | ||||
| 2025-08-15 | 13F | Morgan Stanley | 11.280 | 23,82 | 562 | 23,79 | ||||
| 2025-08-12 | 13F | Steward Partners Investment Advisory, Llc | 107.059 | -2,33 | 5.339 | -2,31 | ||||
| 2025-08-14 | 13F | Camarda Financial Advisors, LLC | 35.565 | 9,67 | 1.773 | 9,72 | ||||
| 2025-07-29 | 13F | Financial Futures Ltd Liability Co. | 9.486 | 473 | ||||||
| 2025-07-31 | 13F | Oppenheimer & Co Inc | 9.298 | 63,81 | 464 | 64,18 | ||||
| 2025-07-23 | 13F | Pillar Financial Advisors, LLC | 75.674 | 2,52 | 3.773 | 2,53 | ||||
| 2025-07-08 | 13F | Parallel Advisors, LLC | 1.425 | 0,00 | 71 | 0,00 | ||||
| 2025-07-31 | 13F | BIP Wealth, LLC | 0 | -100,00 | 0 | |||||
| 2025-07-11 | 13F | William Howard & Co Financial Advisors Inc | 12.476 | 0,00 | 622 | 0,16 | ||||
| 2025-08-11 | 13F | Dorsey & Whitney Trust CO LLC | 24.212 | 0,00 | 1.207 | 0,00 | ||||
| 2025-07-29 | 13F | Wingate Wealth Advisors, Inc. | 32.370 | 22,69 | 1.614 | 22,74 | ||||
| 2025-07-17 | 13F | Northwest Wealth Management, Llc | 17.110 | 2,25 | 853 | 2,28 | ||||
| 2025-07-17 | 13F | Catalytic Wealth RIA, LLC | 44.807 | 38,35 | 2.234 | 38,41 | ||||
| 2025-08-08 | 13F | Chandler Asset Management, Inc. | 2.170 | 108 | ||||||
| 2025-08-13 | 13F | Elgethun Capital Management | 113 | -97,48 | 6 | -97,76 | ||||
| 2025-08-14 | 13F | Brasada Capital Management, Lp | 6.684 | -27,47 | 332 | -27,19 | ||||
| 2025-04-28 | NP | FMCE - FM Compounders Equity ETF | 0 | -100,00 | 0 | -100,00 | ||||
| 2025-07-29 | 13F | Two West Capital Advisors LLC | 41.698 | -3,14 | 2.077 | -2,49 | ||||
| 2025-07-15 | 13F | Financial Management Professionals, Inc. | 1.807 | -18,93 | 90 | -18,92 | ||||
| 2025-05-16 | 13F | Laidlaw Wealth Management LLC | 0 | -100,00 | 0 | |||||
| 2025-08-14 | 13F | Royal Bank Of Canada | 337.394 | 56,30 | 16.824 | 56,34 | ||||
| 2025-08-14 | 13F | Susquehanna International Group, Llp | 7.191 | 35,30 | 359 | 35,61 | ||||
| 2025-08-01 | 13F | Envestnet Asset Management Inc | 170.424 | 103,99 | 8.498 | 104,03 | ||||
| 2025-08-12 | 13F | Proequities, Inc. | 0 | 0 | ||||||
| 2025-08-13 | 13F | Northwestern Mutual Wealth Management Co | 8.987 | 391,09 | 448 | 392,31 | ||||
| 2025-08-11 | 13F | Western Wealth Management, LLC | 5.654 | 282 | ||||||
| 2025-08-12 | 13F | Pathstone Holdings, LLC | 4.742 | -48,32 | 236 | -48,36 | ||||
| 2025-08-06 | 13F | Commonwealth Equity Services, Llc | 312.940 | 17,98 | 16 | 15,38 | ||||
| 2025-08-04 | 13F | Wealth Management Associates, Inc. | 7.450 | 0,00 | 371 | 0,00 | ||||
| 2025-08-11 | 13F | Root Financial Partners, LLC | 20.050 | -1,59 | 1.000 | -1,58 | ||||
| 2025-08-18 | 13F | Front Row Advisors LLC | 600 | 30 | ||||||
| 2025-08-11 | 13F | Hexagon Capital Partners LLC | 0 | -100,00 | 0 | |||||
| 2025-07-30 | 13F | Capstone Triton Financial Group, LLC | 15.939 | -1,21 | 795 | -0,75 | ||||
| 2025-07-11 | 13F | Farther Finance Advisors, LLC | 10.421 | -22,70 | 520 | -22,42 | ||||
| 2025-07-10 | 13F | Wealth Enhancement Advisory Services, Llc | 222.442 | 87,57 | 11.052 | 86,94 | ||||
| 2025-07-24 | 13F | Galvin, Gaustad & Stein, LLC | 4.527 | 226 | ||||||
| 2025-08-11 | 13F | Outlook Wealth Advisors, LLC | 22.035 | 0,00 | 1.099 | 0,00 | ||||
| 2025-08-13 | 13F | Scotia Capital Inc. | 14.887 | -25,24 | 742 | -25,20 | ||||
| 2025-07-29 | 13F | Kraft, Davis & Associates, LLC | 32.005 | 87,75 | 1.595 | 88,42 | ||||
| 2025-08-12 | 13F | CIBC Private Wealth Group, LLC | 0 | -100,00 | 0 | |||||
| 2025-07-28 | 13F | Founders Grove Wealth Partners, Llc | 216.366 | 4,87 | 10.789 | 4,89 | ||||
| 2025-07-09 | 13F | Chesley Taft & Associates LLC | 59.589 | -2,88 | 2.971 | -2,84 | ||||
| 2025-08-04 | 13F | Flagship Harbor Advisors, Llc | 41.145 | -8,06 | 2.052 | -8,07 | ||||
| 2025-07-23 | 13F | Colony Family Offices, LLC | 264.000 | -12,69 | 13.164 | -12,68 | ||||
| 2025-07-23 | 13F | Fortis Advisors, LLC | 345.067 | 0,46 | 17.207 | 0,48 | ||||
| 2025-08-14 | 13F/A | Rockefeller Capital Management L.P. | 53.627 | 3,27 | 2.674 | 3,28 | ||||
| 2025-08-15 | 13F | Captrust Financial Advisors | 146.878 | 7.324 | ||||||
| 2025-08-27 | 13F/A | Brinker Capital Investments, LLC | 13.293 | 18,35 | 663 | 18,43 | ||||
| 2025-08-04 | 13F | HBK Sorce Advisory LLC | 5.664 | -2,88 | 282 | -2,76 | ||||
| 2025-08-13 | 13F | Cerity Partners LLC | 11.003 | 103,95 | 549 | 104,48 | ||||
| 2025-05-15 | 13F | Baird Financial Group, Inc. | 0 | -100,00 | 0 | |||||
| 2025-07-07 | 13F | Wesbanco Bank Inc | 6.437 | 0,00 | 321 | 0,00 | ||||
| 2025-08-01 | 13F | Bank of Jackson Hole Trust | 744 | 0,00 | 37 | 0,00 | ||||
| 2025-07-25 | 13F | Hazlett, Burt & Watson, Inc. | 170 | -58,54 | 0 | |||||
| 2025-07-30 | 13F | Berkeley Capital Partners, LLC | 5.799 | 28,24 | 289 | 28,44 | ||||
| 2025-07-24 | 13F | Stonebridge Financial Group, LLC | 0 | -100,00 | 0 | |||||
| 2025-08-14 | 13F | Hurley Capital, LLC | 0 | -100,00 | 0 | |||||
| 2025-07-07 | 13F | Kings Path Partners LLC | 9.346 | -42,88 | 466 | -42,82 | ||||
| 2025-07-16 | 13F | Badgley Phelps Wealth Managers, LLC | 5.186 | 259 | ||||||
| 2025-08-14 | 13F | RMB Capital Management, LLC | 6.574 | 0,00 | 328 | 0,00 | ||||
| 2025-08-04 | 13F | Terril Brothers, Inc. | 5.700 | 284 | ||||||
| 2025-08-14 | 13F | Aberdeen Wealth Management LLC | 69.953 | 10,30 | 3.488 | 10,34 | ||||
| 2025-08-14 | 13F | IHT Wealth Management, LLC | 25.982 | 1.296 | ||||||
| 2025-08-07 | 13F | CENTRAL TRUST Co | 75.223 | -4,89 | 3.751 | -4,89 | ||||
| 2025-07-08 | 13F | Ballew Advisors, Inc | 26.459 | -0,71 | 1.315 | -0,30 | ||||
| 2025-08-11 | 13F | HighTower Advisors, LLC | 1.074.033 | 30,23 | 53.557 | 30,25 | ||||
| 2025-07-10 | 13F | PMV Capital Advisers, LLC | 0 | -100,00 | 0 | |||||
| 2025-08-05 | 13F | GPS Wealth Strategies Group, LLC | 56 | 9,80 | 3 | 0,00 | ||||
| 2025-08-06 | 13F | AE Wealth Management LLC | 228.300 | -19,33 | 11.384 | -19,31 | ||||
| 2025-08-06 | 13F | Founders Financial Securities Llc | 129.703 | 5,63 | 6.468 | 5,79 | ||||
| 2025-08-08 | 13F | TD Capital Management LLC | 48.597 | -19,79 | 2.423 | -19,77 | ||||
| 2025-08-12 | 13F | Holderness Investments Co | 4.245 | 0,00 | 212 | 0,00 | ||||
| 2025-08-27 | NP | FFSAX - Touchstone Flexible Income Fund Class A | 396.982 | 0,00 | 19.796 | 0,02 | ||||
| 2025-08-07 | 13F | Keynote Financial Services Llc | 55.740 | 1.231,90 | 2.779 | 1.236,06 | ||||
| 2025-08-01 | 13F | Gwn Securities Inc. | 0 | -100,00 | 0 | |||||
| 2025-08-12 | 13F | Coston, McIsaac & Partners | 4.918 | 0 | ||||||
| 2025-07-25 | 13F | Northwest Capital Management Inc | 67.900 | -32,39 | 3.386 | -32,38 | ||||
| 2025-08-04 | 13F | Assetmark, Inc | 154 | 0,00 | 8 | 0,00 | ||||
| 2025-07-23 | 13F | Sax Wealth Advisors, Llc | 9.762 | 487 | ||||||
| 2025-04-22 | 13F | Rappaport Reiches Capital Management, LLC | 4.295 | 0,00 | 214 | 0,47 | ||||
| 2025-07-24 | 13F | IFP Advisors, Inc | 7.865 | -18,88 | 392 | -18,84 | ||||
| 2025-08-15 | 13F | Tower Research Capital LLC (TRC) | 15.244 | 760 | ||||||
| 2025-08-05 | 13F | Bank of New York Mellon Corp | 261.586 | 13.044 | ||||||
| 2025-07-15 | 13F | Legacy Solutions, Llc | 30.075 | 19,83 | 1.500 | 19,82 | ||||
| 2025-07-17 | 13F | Chatham Capital Group, Inc. | 42.955 | 11,20 | 2.142 | 11,22 | ||||
| 2025-07-22 | 13F | Compass Financial Group, INC/SD | 16.000 | 7,10 | 798 | 7,12 | ||||
| 2025-08-14 | 13F | Kintayl Capital LP | 120.600 | 0,00 | 6.014 | 0,02 | ||||
| 2025-08-08 | 13F | Creative Planning | 73.035 | 20,38 | 3.642 | 20,40 | ||||
| 2025-08-14 | 13F | Bank Of America Corp /de/ | 2.518.007 | 74,52 | 125.560 | 74,55 | ||||
| 2025-08-08 | 13F | Cetera Investment Advisers | 149.041 | 17,08 | 7.432 | 17,10 | ||||
| 2025-05-02 | 13F | Napatree Capital Llc | 15.234 | 0,00 | 759 | 0,53 | ||||
| 2025-08-14 | 13F | Old Mission Capital Llc | 5.182 | 258 | ||||||
| 2025-07-31 | 13F | Glass Jacobson Investment Advisors llc | 4.073 | 203 | ||||||
| 2025-07-09 | 13F | Bulwark Capital Corp | 7.068 | 352 | ||||||
| 2025-07-30 | 13F | Capital Investment Services of America, Inc. | 82.085 | 1,18 | 4.093 | 1,21 | ||||
| 2025-07-30 | 13F | Cookson Peirce & Co Inc | 4.523 | 226 | ||||||
| 2025-07-17 | 13F | XY Planning Network, Inc. | 14.156 | 706 | ||||||
| 2025-08-13 | 13F | Townsquare Capital Llc | 0 | -100,00 | 0 | |||||
| 2025-07-11 | 13F | Busey Wealth Management | 50.353 | 0,00 | 2.511 | 0,00 | ||||
| 2025-08-13 | 13F | Daner Wealth Management, LLC | 15.798 | 787 | ||||||
| 2025-07-15 | 13F | Signal Tree Financial Partners Llc | 36.538 | 5,66 | 1.822 | 5,63 | ||||
| 2025-04-14 | 13F | CJM Wealth Advisers, Ltd. | 0 | -100,00 | 0 | |||||
| 2025-07-29 | 13F | International Assets Investment Management, Llc | 7.243 | -66,53 | 361 | -66,51 | ||||
| 2025-07-30 | 13F | Financial Perspectives, Inc | 4.042 | 297,44 | 202 | 302,00 | ||||
| 2025-08-14 | 13F | Graney & King, LLC | 2.729 | 79,07 | 136 | 81,33 | ||||
| 2025-08-08 | 13F | Avalon Trust Co | 1.000 | 50 | ||||||
| 2025-07-30 | 13F | Mills Wealth Advisors LLC | 12.415 | -20,03 | 619 | -20,03 | ||||
| 2025-08-12 | 13F | Hanover Advisors Inc | 5.070 | 0,00 | 253 | 0,00 | ||||
| 2025-08-14 | 13F | Coyle Financial Counsel LLC | 286.325 | 8,69 | 14.278 | 8,71 | ||||
| 2025-08-12 | 13F | Manchester Capital Management LLC | 21.030 | 0,00 | 1.049 | 0,00 | ||||
| 2025-07-22 | 13F | Valpey Financial Services, LLC | 9.511 | 474 | ||||||
| 2025-07-25 | 13F | Ruedi Wealth Management, Inc. | 16.276 | 1,21 | 812 | 1,25 | ||||
| 2025-07-23 | 13F | Hager Investment Management Services, Llc | 10.453 | 0,00 | 521 | 0,00 | ||||
| 2025-07-09 | 13F | Inspirion Wealth Advisors, Llc | 5.166 | 1,21 | 258 | 1,18 | ||||
| 2025-07-30 | 13F | Crewe Advisors LLC | 2.034 | 0,00 | 101 | 0,00 | ||||
| 2025-08-14 | 13F | Kitching Partners, Llc | 206.287 | 6,51 | 10.286 | 6,54 | ||||
| 2025-05-15 | 13F | Intrepid Family Office Llc | 0 | -100,00 | 0 | |||||
| 2025-07-09 | 13F | GSG Advisors LLC | 7.768 | 0,47 | 387 | 1,04 | ||||
| 2025-08-14 | 13F | Benjamin Edwards Inc | 14.471 | 14,79 | 722 | 14,81 | ||||
| 2025-08-14 | 13F | Pine Harbor Wealth Management, LLC | 113.539 | 5,86 | 5.662 | 5,89 | ||||
| 2025-07-22 | 13F | Clarius Group, LLC | 304.681 | 0,64 | 15.165 | 0,67 | ||||
| 2025-08-07 | 13F | Aegis Wealth Management LLC | 5.330 | 0,00 | 266 | 0,00 | ||||
| 2025-05-08 | 13F | Tiaa Trust, National Association | 0 | -100,00 | 0 | -100,00 | ||||
| 2025-04-17 | 13F | RHS Financial, LLC | 0 | -100,00 | 0 | |||||
| 2025-08-14 | 13F | Beaird Harris Wealth Management, LLC | 10.191 | 0,00 | 508 | 0,00 | ||||
| 2025-07-18 | 13F | Lowery Thomas, Llc | 51.948 | 26,49 | 2.590 | 26,53 | ||||
| 2025-07-30 | 13F | Brookstone Capital Management | 13.386 | -14,08 | 667 | -14,05 | ||||
| 2025-07-23 | 13F | Valmark Advisers, Inc. | 51.449 | 2,67 | 2.566 | 2,68 | ||||
| 2025-07-25 | 13F | Cwm, Llc | 92.545 | -7,94 | 5 | -20,00 | ||||
| 2025-08-12 | 13F | Jpmorgan Chase & Co | 21.748.273 | 11,30 | 1.084.478 | 11,32 | ||||
| 2025-08-14 | 13F | Warren Averett Asset Management, LLC | 426.555 | 0,16 | 21.270 | 0,18 | ||||
| 2025-07-30 | 13F | Loring Wolcott & Coolidge Fiduciary Advisors Llp/ma | 23.445 | 0,00 | 1.169 | 0,43 | ||||
| 2025-08-11 | 13F | Culbertson A N & Co Inc | 7.195 | -4,00 | 359 | -4,02 | ||||
| 2025-07-21 | 13F | Ameritas Advisory Services, LLC | 4.182 | -73,05 | 209 | -73,02 | ||||
| 2025-04-29 | 13F | Financial Network Wealth Management LLC | 6.065 | 30,46 | 0 | |||||
| 2025-08-14 | 13F | Aqr Capital Management Llc | 6.100 | 0,00 | 304 | 0,00 | ||||
| 2025-08-12 | 13F | Gladstone Institutional Advisory LLC | 16.881 | 0,20 | 842 | 0,24 | ||||
| 2025-07-21 | 13F | Family CFO Inc | 11.546 | 0,00 | 576 | 0,00 | ||||
| 2025-08-06 | 13F | Rialto Wealth Management, LLC | 426 | 0,00 | 21 | 0,00 | ||||
| 2025-07-15 | 13F | Christensen, King & Associates Investment Services, Inc. | 9.733 | 2,51 | 485 | 2,75 | ||||
| 2025-07-23 | 13F | Roberts Wealth Advisors, LLC | 199.397 | -26,52 | 9.943 | -26,51 | ||||
| 2025-08-14 | 13F | AllSquare Wealth Management LLC | 1.601 | 0,00 | 80 | 0,00 | ||||
| 2025-07-17 | 13F | Willow Creek Wealth Management Inc. | 24.324 | -1,47 | 1.213 | -1,46 | ||||
| 2025-08-04 | 13F | Amplius Wealth Advisors, LLC | 18.738 | 934 | ||||||
| 2025-08-06 | 13F | SP Asset Management LLC | 73.820 | -0,13 | 3.681 | -0,11 | ||||
| 2025-08-14 | 13F | Citadel Advisors Llc | 176.621 | 43,86 | 8.807 | 43,91 | ||||
| 2025-07-16 | 13F | Global Wealth Management, LLC | 570.979 | -3,89 | 28.395 | -4,13 | ||||
| 2025-08-13 | 13F | GeoWealth Management, LLC | 44.807 | 38,35 | 2.234 | 38,41 | ||||
| 2025-07-21 | 13F | Corundum Group, Inc. | 5.469 | 0,00 | 273 | 0,00 | ||||
| 2025-07-18 | 13F | Bartlett & Co. Wealth Management Llc | 13.985 | 0,00 | 697 | 0,00 | ||||
| 2025-07-14 | 13F | Infinity Wealth Counsel, LLC | 25.280 | -0,00 | 1.261 | 0,00 | ||||
| 2025-08-13 | 13F | Willis Johnson & Associates, Inc. | 4.164 | -10,72 | 208 | -10,78 | ||||
| 2025-07-29 | 13F | Latitude Advisors, LLC | 12.717 | -0,04 | 634 | 0,00 | ||||
| 2025-07-28 | 13F | Mutual Advisors, LLC | 7.764 | -0,15 | 387 | 0,00 | ||||
| 2025-07-17 | 13F | Lakewood Asset Management LLC | 27.391 | 7,44 | 1.366 | 7,40 | ||||
| 2025-05-12 | 13F | C2P Capital Advisory Group, LLC d.b.a. Prosperity Capital Advisors | 0 | -100,00 | 0 | -100,00 | ||||
| 2025-07-18 | 13F | Truist Financial Corp | 21.881 | 1.091 | ||||||
| 2025-08-14 | 13F | Cardiff Park Advisors, Llc | 29.893 | 77,01 | 1.491 | 77,17 | ||||
| 2025-08-07 | 13F | Prudent Man Investment Management, Inc. | 35.315 | 0,00 | 1.752 | 0,00 | ||||
| 2025-08-13 | 13F | Boston Family Office Llc | 38.127 | 11,49 | 2 | 0,00 | ||||
| 2025-08-06 | 13F | Texas Yale Capital Corp. | 14.600 | -73,26 | 728 | -73,25 | ||||
| 2025-08-06 | 13F | Equity Investment Corp | 45.600 | 0,00 | 2.274 | 0,00 | ||||
| 2025-07-24 | 13F | Blair William & Co/il | 174.327 | -0,55 | 8.693 | -0,54 | ||||
| 2025-08-13 | 13F | Cary Street Partners Financial Llc | 63.521 | -1,47 | 3.167 | -1,43 | ||||
| 2025-07-17 | 13F | CWA Asset Management Group, LLC | 11.200 | -9,68 | 558 | -9,71 | ||||
| 2025-08-01 | 13F | Signature Wealth Management Group | 86.959 | 1,04 | 4.336 | 1,07 | ||||
| 2025-03-28 | 13F/A | Berkeley, Inc | 0 | -100,00 | 0 | -100,00 | ||||
| 2025-08-14 | 13F | UBS Group AG | 288 | -60,66 | 14 | -61,11 | ||||
| 2025-07-17 | 13F | Sound Income Strategies, LLC | 306 | 0,00 | 15 | 0,00 | ||||
| 2025-08-04 | 13F | WNY Asset Management, LLC | 5.565 | 0,25 | 278 | 0,36 | ||||
| 2025-07-30 | 13F | Blume Capital Management, Inc. | 2.819 | 0,00 | 141 | 0,00 | ||||
| 2025-07-09 | 13F | Hummer Financial Advisory Services Inc | 4.200 | 0,00 | 209 | 0,00 | ||||
| 2025-08-07 | 13F | Commerce Bank | 4.726 | 236 | ||||||
| 2025-08-18 | 13F | Geneos Wealth Management Inc. | 33 | 0,00 | 2 | 0,00 | ||||
| 2025-07-17 | 13F | Nelson, Van Denburg & Campbell Wealth Management Group, LLC | 30.201 | 4,65 | 1.506 | 4,66 | ||||
| 2025-08-12 | 13F | Kensington Asset Management, LLC | 69.090 | 3.445 | ||||||
| 2025-07-07 | 13F | New Capital Management LP | 10.499 | -14,73 | 524 | -14,68 | ||||
| 2025-08-14 | 13F | Ausdal Financial Partners, Inc. | 11.683 | -33,51 | 583 | -33,49 | ||||
| 2025-07-29 | 13F | Chicago Partners Investment Group LLC | 71.485 | 5,24 | 3.560 | 5,55 | ||||
| 2025-07-31 | 13F | Cambridge Investment Research Advisors, Inc. | 182.076 | 9,10 | 9 | 12,50 | ||||
| 2025-08-14 | 13F | Comerica Bank | 4.859 | -36,41 | 242 | -36,32 |