Grundlæggende statistik
| Institutionelle aktier (lange) | 337.469.484 - 70,18% (ex 13D/G) - change of -27,95MM shares -7,65% MRQ |
| Institutionel værdi (lang) | $ 20.248.854 USD ($1000) |
Institutionelt ejerskab og aktionærer
Nutrien Ltd. (US:NTR) har 710 institutionelle ejere og aktionærer, der har indsendt 13D/G- eller 13F-formularer til Securities Exchange Commission (SEC). Disse institutioner har i alt 337,469,484 aktier. Største aktionærer omfatter Royal Bank Of Canada, Vanguard Group Inc, Wellington Management Group Llp, Bank Of Montreal /can/, Arrowstreet Capital, Limited Partnership, First Eagle Investment Management, LLC, Fmr Llc, Deutsche Bank Ag\, Td Asset Management Inc, and Canada Pension Plan Investment Board .
Nutrien Ltd. (NYSE:NTR) institutionel ejerskabsstruktur viser aktuelle positioner i virksomheden efter institutioner og fonde, samt seneste ændringer i positionsstørrelse. Større aktionærer kan omfatte individuelle investorer, investeringsforeninger, hedgefonde eller institutioner. Skema 13D angiver, at investoren besidder (eller besidder) mere end 5 % af virksomheden og har til hensigt (eller har til hensigt at) aktivt at forfølge en ændring i forretningsstrategi. Skema 13G indikerer en passiv investering på over 5%.
The share price as of April 27, 2026 is 72,37 / share. Previously, on April 28, 2025, the share price was 55,57 / share. This represents an increase of 30,23% over that period.

Fondens stemningsscore
Fund Sentiment Score (fka Ownership Accumulation Score) finder de aktier, der bliver mest købt af fonde. Det er resultatet af en sofistikeret, multi-faktor kvantitativ model, der identificerer virksomheder med de højeste niveauer af institutionel akkumulering. Scoringsmodellen bruger en kombination af den samlede stigning i oplyste ejere, ændringerne i porteføljeallokeringer i disse ejere og andre målinger. Tallet går fra 0 til 100, hvor højere tal indikerer et højere niveau af akkumulering for sine jævnaldrende, og 50 er gennemsnittet.
Opdateringsfrekvens: Dagligt
Se Ownership Explorer, som giver en liste over højest rangerende virksomheder.
AI+ Ask Fintel’s AI assistant about Nutrien Ltd..
Select a question to share a public post with an AI-crafted answer.
Thinking of good questions…
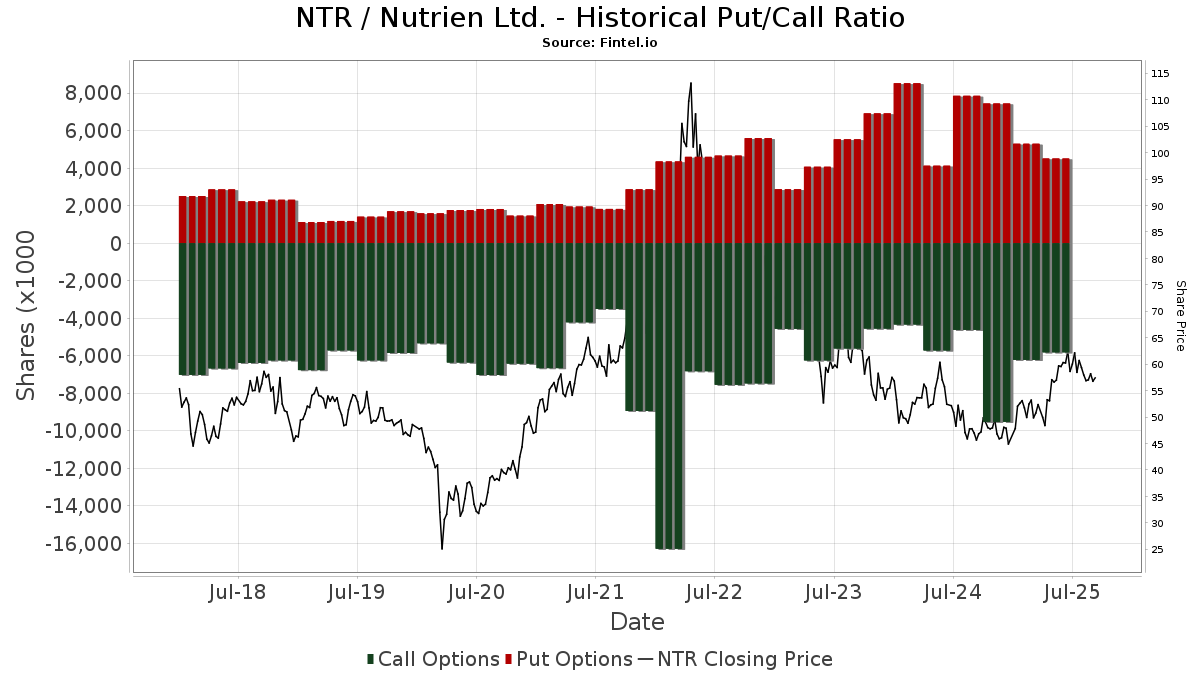
Institutionel Put/Call-forhold
Ud over at indberette standardaktie- og gældsudstedelser skal institutter med mere end 100 mill. aktiver under forvaltning også oplyse deres put- og call-optionsbeholdninger. Da salgsoptioner generelt indikerer negativ stemning, og købsoptioner indikerer positiv stemning, kan vi få en fornemmelse af den overordnede institutionelle stemning ved at plotte forholdet mellem put og kald. Diagrammet til højre viser det historiske put/call-forhold for dette instrument.
Brug af Put/Call Ratio som en indikator for investorernes stemning overvinder en af de vigtigste mangler ved at bruge totalt institutionelt ejerskab, som er, at en betydelig mængde af aktiver under forvaltning investeres passivt for at spore indekser. Passivt forvaltede fonde køber typisk ikke optioner, så indikatoren for put/call-forholdet følger mere nøje følelsen af aktivt forvaltede fonde.
13D/G-arkivering
Vi præsenterer 13D/G ansøgninger separat fra 13F ansøgninger på grund af den forskellige behandling af SEC. 13D/G-ansøgninger kan indgives af grupper af investorer (med én ledende), hvorimod 13F-ansøgninger ikke kan. Dette resulterer i situationer, hvor en investor kan indsende en 13D/G, der rapporterer én værdi for de samlede aktier (der repræsenterer alle de aktier, der ejes af investorgruppen), men derefter indsender en 13F, der rapporterer en anden værdi for de samlede aktier (der udelukkende repræsenterer deres egne) ejendomsret). Det betyder, at aktieejerskab af 13D/G-arkiver og 13F-arkiveringer ofte ikke er direkte sammenlignelige, så vi præsenterer dem separat.
Bemærk: Fra den 16. maj 2021 viser vi ikke længere ejere, der ikke har indsendt en 13D/G inden for det seneste år. Tidligere viste vi den fulde historie af 13D/G-arkiver. Generelt skal enheder, der er forpligtet til at indgive 13D/G-ansøgninger, indgive mindst årligt, før de indsender en afsluttende ansøgning. Dog forlader fonde nogle gange positioner uden at indsende en afsluttende ansøgning (dvs. de afvikler), så visning af den fulde historie resulterede nogle gange i forvirring om det nuværende ejerskab. For at undgå forvirring viser vi nu kun 'aktuelle' ejere - det vil sige - ejere, der har anmeldt inden for det seneste år.
Upgrade to unlock premium data.
| Fil dato | Form | Investor | Forrige Aktier |
Seneste Aktier |
Δ Aktier (Procent) |
Ejendomsret (Procent) |
Δ Ejerskab (Procent) |
|
|---|---|---|---|---|---|---|---|---|
| 2026-01-21 | BlackRock, Inc. | 24,820,750 | 23,787,129 | -4.16 | 4.90 | -3.92 |
13F og NPORT arkivering
Detaljer om 13F-arkivering er gratis. Detaljer om NP-ansøgninger kræver et premium-medlemskab. Grønne rækker angiver nye positioner. Røde rækker angiver lukkede positioner. Klik på linket ikon for at se den fulde transaktionshistorik.
Opgrader
for at låse premium-data op og eksportere til Excel ![]() .
.
| Fil dato | Kilde | Investor | Type | Gennemsnitlig pris (Øst) |
Aktier | Δ Aktier (%) |
Rapporteret Værdi ($1000) |
Δ Værdi (%) |
Port Alloc (%) |
|
|---|---|---|---|---|---|---|---|---|---|---|
| 2026-02-12 | 13F | Summit Financial, LLC | 98.423 | 0,23 | 6.128 | 6,30 | ||||
| 2026-02-13 | 13F | Public Sector Pension Investment Board | 0 | -100,00 | 0 | |||||
| 2026-02-17 | 13F | Modern Wealth Management, LLC | 4.949 | 6,43 | 305 | 11,72 | ||||
| 2026-02-13 | 13F | De Lisle Partners LLP | 32.000 | -23,81 | 1.975 | -19,95 | ||||
| 2026-04-21 | 13F | Fruth Investment Management | 15.096 | -0,43 | 1 | |||||
| 2026-02-06 | 13F | Addison Advisors LLC | 23 | 0,00 | 1 | 0,00 | ||||
| 2026-02-12 | 13F | DJE Kapital AG | 104.161 | -3,91 | 6.586 | 5,60 | ||||
| 2026-03-20 | 13F | Purpose Unlimited Inc. | 169.225 | 10.445 | ||||||
| 2026-02-05 | 13F | Bank Julius Baer & Co. Ltd, Zurich | 1.352 | 0,07 | 83 | 5,06 | ||||
| 2026-02-17 | 13F | Tower Research Capital LLC (TRC) | 3.737 | 26.592,86 | 231 | |||||
| 2026-02-10 | 13F | Eurizon Capital SGR S.p.A. | 39.586 | 2.443 | ||||||
| 2026-02-13 | 13F | Kestra Advisory Services, LLC | 17.972 | 8,79 | 1.109 | 14,45 | ||||
| 2025-10-28 | 13F | Munro Partners | 0 | -100,00 | 0 | -100,00 | ||||
| 2026-04-28 | 13F | Flagship Harbor Advisors, Llc | 0 | -100,00 | 0 | |||||
| 2026-04-24 | 13F | UMA Financial Services, Inc. | 20 | 0,00 | 2 | 0,00 | ||||
| 2026-02-13 | 13F | Resources Management Corp /ct/ /adv | 334 | 0,00 | 0 | |||||
| 2026-01-27 | 13F | Zurcher Kantonalbank (Zurich Cantonalbank) | 184.179 | -39,15 | 11.383 | -35,98 | ||||
| 2026-02-13 | 13F | Quarry LP | 0 | -100,00 | 0 | |||||
| 2026-04-24 | 13F | Key FInancial Inc | 20 | -37,50 | 2 | 0,00 | ||||
| 2026-02-11 | 13F | Sunrise Financial Services, LLC | 25 | 2 | ||||||
| 2026-04-13 | 13F | IFP Advisors, Inc | 62.071 | 12,07 | 4.684 | 37,01 | ||||
| 2026-04-20 | 13F | Hilton Head Capital Partners, LLC | 38 | 0,00 | 3 | 0,00 | ||||
| 2026-01-27 | 13F | WealthCollab, LLC | 79 | 0,00 | 5 | 0,00 | ||||
| 2026-04-27 | 13F | Leonteq Securities AG | 5.912 | 84,40 | 446 | 126,40 | ||||
| 2026-02-13 | 13F | Wexford Capital Lp | 662 | 12,01 | 41 | 17,65 | ||||
| 2026-02-09 | 13F | Arnhold LLC | 84.595 | 0,00 | 5.221 | 5,13 | ||||
| 2026-02-09 | 13F | Putnam Fl Investment Management Co | 7.763 | 0,75 | 479 | 5,97 | ||||
| 2026-02-17 | 13F | Ameriprise Financial Inc | 1.373.293 | 63,31 | 84.823 | 71,71 | ||||
| 2026-04-15 | 13F | Trust Co Of Toledo Na /oh/ | 840 | 0,00 | 63 | 23,53 | ||||
| 2026-03-05 | 13F | Mengis Capital Management, Inc. | 23.760 | -1,61 | 1.466 | 3,46 | ||||
| 2026-04-27 | 13F | Truist Financial Corp | 4.127 | 311 | ||||||
| 2025-11-14 | 13F | Wetherby Asset Management Inc | 4.146 | 4,04 | 243 | 4,74 | ||||
| 2026-02-13 | 13F | Acumen Wealth Advisors, LLC | 68 | 4 | ||||||
| 2026-02-17 | 13F | Alphadyne Asset Management, LLC | 11.284 | 696 | ||||||
| 2026-04-14 | 13F | Prospera Financial Services Inc | 13.675 | -2,89 | 1.032 | 18,76 | ||||
| 2026-02-17 | 13F | Alphadyne Asset Management, LLC | Call | 24.300 | 1.500 | |||||
| 2026-02-17 | 13F | Alphadyne Asset Management, LLC | Put | 48.800 | 3.012 | |||||
| 2026-04-21 | 13F | Foster & Motley Inc | 6.162 | -2,52 | 0 | |||||
| 2026-04-15 | 13F | Exchange Traded Concepts, Llc | 320.358 | 47,04 | 24.174 | 79,77 | ||||
| 2026-04-20 | 13F | CWA Asset Management Group, LLC | 30.064 | 39,23 | 2.269 | 70,27 | ||||
| 2026-02-13 | 13F | SRS Capital Advisors, Inc. | 1.525 | 23,48 | 94 | 30,56 | ||||
| 2025-11-06 | 13F | Claudia M.p. Batlle, Crp (r) Llc | 0 | -100,00 | 0 | |||||
| 2026-02-12 | 13F | Litman Gregory Asset Management LLC | 30 | 2 | ||||||
| 2026-04-15 | 13F | Radnor Capital Management, LLC | 4.200 | 0,00 | 317 | 22,01 | ||||
| 2026-02-10 | 13F | Bank of New York Mellon Corp | 456.936 | 1,87 | 28.202 | 7,10 | ||||
| 2026-02-23 | 13F | Wealth Preservation Advisors, LLC | 263 | 0,00 | 16 | 6,67 | ||||
| 2026-02-09 | 13F | Geode Capital Management, Llc | 4.833.284 | 6,83 | 304.217 | 12,63 | ||||
| 2026-02-11 | 13F | Capital International Investors | 5.575.762 | 0,65 | 344.161 | 5,79 | ||||
| 2026-01-07 | 13F | New England Research & Management, Inc. | 5.050 | 312 | ||||||
| 2026-04-23 | 13F | SevenBridge Financial Group, LLC | 10.125 | 0,00 | 724 | 1,83 | ||||
| 2026-01-30 | 13F | Mitsubishi UFJ Trust & Banking Corp | 11.585 | -92,21 | 707 | -91,92 | ||||
| 2026-02-17 | 13F | Graham Capital Management, L.P. | 0 | -100,00 | 0 | |||||
| 2026-02-17 | 13F | State Of Wisconsin Investment Board | 170.354 | 10.529 | ||||||
| 2026-02-03 | 13F | CORDA Investment Management, LLC. | 545.614 | 0,77 | 33.675 | 5,94 | ||||
| 2025-11-12 | 13F | 111 Capital | 0 | -100,00 | 0 | -100,00 | ||||
| 2026-02-18 | 13F | GWM Advisors LLC | 7.156 | -4,05 | 442 | 0,92 | ||||
| 2026-01-07 | 13F | Covea Finance | 0 | -100,00 | 0 | |||||
| 2026-02-11 | 13F | Twin Tree Management, LP | Call | 165.700 | 568,15 | 10.227 | 602,40 | |||
| 2025-11-14 | 13F | Strategic Wealth Partners, Ltd. | 50 | -21,88 | 3 | -33,33 | ||||
| 2026-02-13 | 13F | Ieq Capital, Llc | 14.978 | 6,93 | 924 | 12,41 | ||||
| 2026-01-20 | 13F | Cromwell Holdings LLC | 1.707 | 0,00 | 106 | 4,95 | ||||
| 2026-02-13 | 13F | Mariner, LLC | 14.959 | 6,58 | 924 | 12,27 | ||||
| 2025-11-04 | 13F | Gitterman Wealth Management, LLC | 0 | -100,00 | 0 | |||||
| 2025-11-14 | 13F | Virtu Financial LLC | 0 | -100,00 | 0 | |||||
| 2026-01-27 | 13F | Jackson, Grant Investment Advisers, Inc. | 500 | 0,00 | 31 | 3,45 | ||||
| 2026-02-05 | 13F | Stephens Inc /ar/ | 72.055 | 0,59 | 4.447 | 5,76 | ||||
| 2025-10-29 | 13F | JCIC Asset Management Inc. | 0 | -100,00 | 0 | -100,00 | ||||
| 2026-04-24 | 13F | Mitchell & Pahl Private Wealth, Llc | 13.347 | 2,06 | 1.007 | 24,78 | ||||
| 2026-04-07 | 13F | Mb, Levis & Associates, Llc | 187 | 0,00 | 14 | 27,27 | ||||
| 2026-02-09 | 13F | Cary Street Partner Investment Advisory Llc | 523 | 21,63 | 32 | 28,00 | ||||
| 2025-11-14 | 13F | Walnut Level Capital LLC | 0 | -100,00 | 0 | |||||
| 2026-02-10 | 13F | Grandfield & Dodd, Llc | 30.960 | 0,00 | 1.911 | 5,12 | ||||
| 2026-04-21 | 13F | Corecam AG | Call | 0 | -100,00 | 0 | ||||
| 2026-02-17 | 13F | Guardian Partners Inc. | 358.454 | 4,15 | 25.497 | 30,56 | ||||
| 2026-02-03 | 13F | We Are One Seven, LLC | 8.536 | 112,71 | 527 | 123,83 | ||||
| 2026-02-20 | 13F | Ruggaard & Associates LLC | 5.105 | 0,00 | 315 | 5,35 | ||||
| 2026-04-23 | 13F | Forum Financial Management, LP | 0 | -100,00 | 0 | |||||
| 2026-01-23 | 13F | LOM Asset Management Ltd | 230 | 19 | ||||||
| 2026-01-23 | 13F | Smith, Moore & Co. | 7.289 | -4,62 | 450 | 0,22 | ||||
| 2026-02-19 | 13F | Atomi Financial Group, Inc. | 5.371 | 6,93 | 332 | 12,59 | ||||
| 2026-04-28 | 13F | K.J. Harrison & Partners Inc | 23.770 | -64,35 | 1.791 | -56,56 | ||||
| 2026-04-21 | 13F | GHP Investment Advisors, Inc. | 446 | 0,00 | 34 | 22,22 | ||||
| 2026-02-13 | 13F | Korea Investment CORP | 421.632 | 148,67 | 26.059 | 161,66 | ||||
| 2025-11-14 | 13F | Ion Asset Management Ltd. | 14.150 | 0,00 | 831 | 0,73 | ||||
| 2026-02-13 | 13F | Arkadios Wealth Advisors | 19.624 | -0,24 | 1.211 | 4,94 | ||||
| 2026-04-22 | 13F | Pictet Asset Management Holding SA | 258.039 | -0,02 | 19.417 | 21,72 | ||||
| 2026-02-09 | 13F | Mediolanum International Funds Ltd | 40.436 | -5,25 | 2.530 | 2,64 | ||||
| 2026-04-09 | 13F | Pacifica Partners Inc. | 33.195 | -12,77 | 2.501 | 4,38 | ||||
| 2026-04-17 | 13F | CENTRAL TRUST Co | 321 | -0,93 | 24 | 20,00 | ||||
| 2026-02-12 | 13F | Renaissance Technologies Llc | 0 | -100,00 | 0 | |||||
| 2026-02-13 | 13F | Minot DeBlois Advisors LLC | 9.032 | 1,85 | 557 | 7,12 | ||||
| 2026-04-27 | 13F | S.A. Mason LLC | 1.365 | 103 | ||||||
| 2026-02-10 | 13F | Acadian Asset Management Llc | 40.300 | -91,24 | 2 | -92,59 | ||||
| 2026-02-06 | 13F | Princeton Capital Management Llc | 5.320 | 0,00 | 328 | 5,13 | ||||
| 2026-02-13 | 13F | Natixis | 75.627 | -13,87 | 4.668 | -9,47 | ||||
| 2026-04-23 | 13F | SJS Investment Consulting Inc. | 49 | 0,00 | 4 | 0,00 | ||||
| 2026-02-13 | 13F | Aptus Capital Advisors, LLC | 10.657 | 2,57 | 658 | 7,88 | ||||
| 2026-02-02 | 13F | Montag A & Associates Inc | 423 | 310,68 | 26 | 333,33 | ||||
| 2026-04-28 | 13F | Fortis Capital Advisors, LLC | 12.372 | 934 | ||||||
| 2026-01-30 | 13F | American Capital Advisory, LLC | 147 | 0,00 | 9 | 12,50 | ||||
| 2025-10-28 | 13F | Arlington Trust Co LLC | 0 | -100,00 | 0 | |||||
| 2026-01-23 | 13F | Burney Co/ | 12.029 | 742 | ||||||
| 2026-02-03 | 13F | Sequoia Financial Advisors, LLC | 8.801 | 30,77 | 543 | 37,47 | ||||
| 2026-02-13 | 13F | Entropy Technologies, LP | 14.220 | -50,18 | 878 | -47,64 | ||||
| 2025-11-07 | 13F | Sierra Ocean, Llc | 0 | -100,00 | 0 | -100,00 | ||||
| 2026-02-13 | 13F | Beutel, Goodman & Co Ltd. | 5.997.348 | 7,41 | 371 | 13,15 | ||||
| 2026-02-13 | 13F | Level Four Advisory Services, Llc | 8.294 | 35,99 | 512 | 42,74 | ||||
| 2026-04-17 | 13F | Ambassador Advisors, LLC | 66.276 | 1,49 | 5.001 | 24,09 | ||||
| 2026-01-16 | 13F | Banque Pictet & Cie Sa | 0 | -100,00 | 0 | -100,00 | ||||
| 2026-01-27 | 13F | Hedges Asset Management LLC | 10.400 | -0,95 | 642 | 4,06 | ||||
| 2026-02-11 | 13F | Fiera Capital Corp | 654.487 | -21,41 | 40.411 | -17,39 | ||||
| 2026-02-11 | 13F | Jpmorgan Chase & Co | 2.539.016 | -5,47 | 156.708 | -0,62 | ||||
| 2026-04-20 | 13F | Banque Cantonale Vaudoise | 1.198 | 15,86 | 90 | 40,63 | ||||
| 2026-02-13 | 13F | Cornerstone Financial Management LLC | 23 | 1 | ||||||
| 2026-02-11 | 13F | Metis Global Partners, LLC | 232.686 | 5,46 | 14.362 | 10,84 | ||||
| 2026-04-13 | 13F | Hm Payson & Co | 3.004 | 42,50 | 227 | 73,85 | ||||
| 2026-01-30 | 13F | ARGA Investment Management, LP | 5.308.601 | -10,83 | 327.639 | -6,30 | ||||
| 2026-02-17 | 13F | Toronto Dominion Bank | 5.115.137 | 71,96 | 315.739 | 80,90 | ||||
| 2026-02-12 | 13F | Campbell & CO Investment Adviser LLC | 0 | -100,00 | 0 | |||||
| 2026-02-17 | 13F | Toronto Dominion Bank | Put | 3.600 | -87,05 | 222 | -86,40 | |||
| 2026-02-11 | 13F | Franklin Resources Inc | 334.943 | -6,80 | 20.674 | -2,02 | ||||
| 2026-01-27 | 13F | TD Waterhouse Canada Inc. | 2.359.022 | 4,17 | 145.257 | 13,07 | ||||
| 2026-02-05 | 13F | Cambridge Investment Research Advisors, Inc. | 12.986 | 17,54 | 1 | |||||
| 2026-04-08 | 13F | Seed Wealth Management, Inc. | 3.435 | 0,00 | 259 | 22,17 | ||||
| 2026-04-21 | 13F | Venturi Wealth Management, LLC | 6.543 | 23,99 | 494 | 51,69 | ||||
| 2026-02-17 | 13F | Captrust Financial Advisors | 769.890 | 4,25 | 47.520 | 9,60 | ||||
| 2026-02-12 | 13F | DRW Securities, LLC | 0 | -100,00 | 0 | -100,00 | ||||
| 2026-02-03 | 13F | Crossmark Global Holdings, Inc. | 22.487 | -16,75 | 1.388 | -12,49 | ||||
| 2025-10-29 | 13F | Massachusetts Financial Services Co /ma/ | 0 | -100,00 | 0 | |||||
| 2026-02-12 | 13F | DRW Securities, LLC | Call | 0 | -100,00 | 0 | -100,00 | |||
| 2026-04-10 | 13F | Country Trust Bank | 95 | 0,00 | 7 | 40,00 | ||||
| 2026-04-21 | 13F | Vise Technologies, Inc. | 11.364 | 0,00 | 701 | 0,00 | ||||
| 2026-04-21 | 13F | Financial Consulate, Inc | 4 | 0 | ||||||
| 2026-04-23 | 13F | Comprehensive Money Management Services LLC | 4.610 | 2,56 | 348 | 25,27 | ||||
| 2026-02-11 | 13F | Picton Mahoney Asset Management | 228.431 | 494,97 | 14.120 | 705.850,00 | ||||
| 2026-02-11 | 13F | West Family Investments, Inc. | 4.128 | 0,00 | 255 | 4,96 | ||||
| 2026-02-17 | 13F | Signature Equity Partners, LLC | 175 | 11 | ||||||
| 2026-02-02 | 13F | Benjamin Edwards Inc | 4.220 | 23,18 | 261 | 29,35 | ||||
| 2025-11-14 | 13F | Point72 (DIFC) Ltd | Put | 0 | -100,00 | 0 | -100,00 | |||
| 2025-12-09 | 13F/A | Tudor Investment Corp Et Al | 380.918 | 22.364 | ||||||
| 2026-02-09 | 13F | Diversified Investment Strategies, LLC | 95.242 | -0,53 | 5.878 | 4,57 | ||||
| 2025-11-14 | 13F | Point72 (DIFC) Ltd | Call | 0 | -100,00 | 0 | -100,00 | |||
| 2025-10-30 | 13F | Twin Peaks Wealth Advisors, LLC | 0 | -100,00 | 0 | -100,00 | ||||
| 2026-02-11 | 13F | Flagship Wealth Advisors, Llc | 0 | -100,00 | 0 | |||||
| 2026-02-06 | 13F | Keystone Financial Group | 0 | -100,00 | 0 | |||||
| 2026-01-26 | 13F | Townsend & Associates, Inc | 612.842 | 1,41 | 41.569 | 19,80 | ||||
| 2026-02-18 | 13F | Guardian Capital Lp | 526.741 | 101,76 | 32.528 | 112,13 | ||||
| 2026-02-12 | 13F | JT Stratford LLC | 3.427 | -10,73 | 212 | -6,22 | ||||
| 2026-02-12 | 13F | Barings Llc | 126.808 | 55,22 | 7.827 | 63,18 | ||||
| 2025-11-14 | 13F | Wood Tarver Financial Group, LLC | 0 | -100,00 | 0 | |||||
| 2026-01-26 | 13F | Main Street Group, LTD | 0 | -100,00 | 0 | -100,00 | ||||
| 2026-04-06 | 13F | Rosenberg Matthew Hamilton | 952 | 0,00 | 72 | 22,41 | ||||
| 2026-02-17 | 13F | Parallax Volatility Advisers, L.P. | Call | 125.000 | 0,00 | 7.715 | 5,14 | |||
| 2026-02-17 | 13F | Parallax Volatility Advisers, L.P. | Put | 125.000 | 0,00 | 7.715 | 5,14 | |||
| 2026-04-14 | 13F | Banque Pictet & Cie Sa | Call | 85.612 | 0,00 | 6.442 | 21,74 | |||
| 2026-02-17 | 13F | SummitTX Capital, L.P. | 4.251 | 262 | ||||||
| 2026-04-14 | 13F | Banque Pictet & Cie Sa | Put | 5.000 | 376 | |||||
| 2026-04-13 | 13F | True Wealth Design, LLC | 113 | 17,71 | 9 | 60,00 | ||||
| 2026-02-17 | 13F | Gotham Asset Management, LLC | 35.623 | 87,78 | 2.199 | 97,48 | ||||
| 2026-02-13 | 13F | Berkley W R Corp | 0 | -100,00 | 0 | -100,00 | ||||
| 2026-04-15 | 13F | Fortitude Family Office, LLC | 30 | 0,00 | 2 | 100,00 | ||||
| 2026-04-13 | 13F | Artemis Investment Management LLP | 64.545 | 23,55 | 4.871 | 51,05 | ||||
| 2025-11-12 | 13F | NewSquare Capital LLC | 0 | -100,00 | 0 | |||||
| 2026-04-27 | 13F | Sound Income Strategies, LLC | 102 | 78,95 | 8 | 133,33 | ||||
| 2026-02-17 | 13F | Numerai GP LLC | 18.698 | 1.154 | ||||||
| 2026-02-13 | 13F | National Bank Of Canada /fi/ | Put | 1.399 | -23,97 | 8.634 | -20,10 | |||
| 2026-03-18 | 13F | Employees Provident Fund Board | 0 | -100,00 | 0 | |||||
| 2026-02-10 | 13F | Nomura Asset Management Co Ltd | 135.560 | -14,85 | 8.367 | -10,49 | ||||
| 2026-02-17 | 13F | Point72 Asset Management, L.P. | Call | 37.200 | -84,03 | 2.296 | -83,22 | |||
| 2026-02-04 | 13F | Marco Investment Management Llc | 3.400 | 210 | ||||||
| 2026-02-13 | 13F | National Bank Of Canada /fi/ | Call | 3.105 | 45,98 | 19.164 | 53,40 | |||
| 2026-02-17 | 13F | Point72 Asset Management, L.P. | Put | 63.000 | 98,74 | 3.888 | 108,92 | |||
| 2026-02-17 | 13F | Shelton Capital Management | 3.400 | 210 | ||||||
| 2026-04-20 | 13F | Ronald Blue Trust, Inc. | 6.462 | -6,69 | 488 | 14,05 | ||||
| 2026-02-13 | 13F | BNP Paribas Asset Management Holding S.A. | 41.591 | 4 | ||||||
| 2025-11-14 | 13F | Skopos Labs, Inc. | 0 | -100,00 | 0 | |||||
| 2026-04-14 | 13F | Howland Capital Management Llc | 5.720 | 0,00 | 435 | 21,91 | ||||
| 2026-02-04 | 13F | Swiss Life Asset Management Ltd | 90.797 | 13,82 | 5.604 | 19,46 | ||||
| 2026-02-09 | 13F | Shufro Rose & Co Llc | 22.263 | -2,10 | 1.374 | 21,70 | ||||
| 2026-02-12 | 13F | Advisors Asset Management, Inc. | 85.118 | 22,13 | 5.253 | 28,40 | ||||
| 2026-02-10 | 13F | Westpac Banking Corp | 3.137 | 194 | ||||||
| 2026-04-20 | 13F | Miller Howard Investments Inc /ny | 610.106 | -0,04 | 46.039 | 22,21 | ||||
| 2026-01-30 | 13F | Pekin Hardy Strauss, Inc. | 15.863 | 35,11 | 981 | 42,24 | ||||
| 2026-02-17 | 13F | Nomura Holdings Inc | 72.875 | -24,77 | 4.498 | -20,92 | ||||
| 2026-04-08 | 13F | PBU - The Pension Fund of Early Childhood & Youth Educators | 119.988 | 1.943 | ||||||
| 2026-02-13 | 13F | Nfj Investment Group, Llc | 436.521 | 3.125,60 | 27.253 | 2.366,24 | ||||
| 2026-02-17 | 13F | Royal Bank Of Canada | Put | 992.000 | 892,00 | 61.226 | 942,68 | |||
| 2026-02-17 | 13F | Royal Bank Of Canada | Call | 170.000 | -17,27 | 10.492 | -13,04 | |||
| 2026-02-17 | 13F | Royal Bank Of Canada | 30.992.227 | -10,82 | 1.912.839 | -6,25 | ||||
| 2026-02-24 | 13F | MidFirst Bank | 77 | 5 | ||||||
| 2025-11-14 | 13F | Gluskin Sheff & Assoc Inc | 0 | -100,00 | 0 | |||||
| 2026-02-17 | 13F | Millennium Management Llc | Call | 94.800 | 5.851 | |||||
| 2026-02-17 | 13F | Millennium Management Llc | Put | 62.500 | 3.858 | |||||
| 2026-02-10 | 13F | Minneapolis Portfolio Management Group, LLC | 368.608 | 0,87 | 22.750 | 6,04 | ||||
| 2026-02-17 | 13F | Millennium Management Llc | 181.739 | -67,29 | 11.221 | -65,61 | ||||
| 2026-02-12 | 13F | Skandinaviska Enskilda Banken AB (publ) | 65.161 | -2,20 | 4.022 | 2,81 | ||||
| 2026-02-17 | 13F | Altshuler Shaham Ltd | 1.853.201 | -13,53 | 114.380 | -9,10 | ||||
| 2026-02-13 | 13F | Verition Fund Management LLC | Put | 22.200 | -83,96 | 1.370 | -83,14 | |||
| 2026-04-09 | 13F | Moody National Bank Trust Division | 21.519 | -0,83 | 1.624 | 21,21 | ||||
| 2026-02-17 | 13F | Wiley Bros.-aintree Capital, Llc | 11.097 | 13,15 | 685 | 19,16 | ||||
| 2026-04-24 | 13F | Secured Retirement Advisors, Llc | 0 | -100,00 | 0 | |||||
| 2026-02-05 | 13F | Allworth Financial LP | 1.150 | -10,16 | 71 | -6,67 | ||||
| 2026-04-17 | 13F | Bourne Lent Asset Management Inc | 33.332 | 0,12 | 2.515 | 22,44 | ||||
| 2026-02-13 | 13F | NLB Skladi, upravljanje premozenja, d.o.o. | 42.782 | 2.641 | ||||||
| 2026-02-12 | 13F | Adviser Investments LLC | 4.906 | 0,00 | 303 | 4,86 | ||||
| 2026-04-28 | 13F | Golden State Wealth Management, LLC | 71 | 0,00 | 5 | 25,00 | ||||
| 2026-01-30 | 13F | United Community Bank | 0 | -100,00 | 0 | -100,00 | ||||
| 2026-04-22 | 13F | JNBA Financial Advisors | 78 | -38,58 | 6 | -28,57 | ||||
| 2026-04-24 | 13F | Triasima Portfolio Management inc. | 16.827 | 1.266 | ||||||
| 2026-02-13 | 13F | Williams Jones Wealth Management, LLC. | 4.288 | 0,00 | 265 | 5,18 | ||||
| 2026-02-13 | 13F | Prudential Financial Inc | 43.033 | 51,60 | 2.660 | 59,51 | ||||
| 2026-02-11 | 13F | Clearbridge Investments, LLC | 0 | -100,00 | 0 | |||||
| 2026-02-17 | 13F | ION Fund Management Ltd | 14.150 | 873 | ||||||
| 2026-02-09 | 13F | Knights of Columbus Asset Advisors LLC | 9.017 | -4,21 | 557 | 0,72 | ||||
| 2026-02-04 | 13F | Westport Asset Management Inc | 11.150 | 0,00 | 655 | 0,00 | ||||
| 2026-02-17 | 13F | Delaware Management Holdings, Inc. | 331.948 | 20.488 | ||||||
| 2026-02-17 | 13F | Wellington Management Group Llp | 16.338.606 | 440,16 | 1.008.713 | 467,79 | ||||
| 2026-02-06 | 13F | Associated Banc-corp | 4.680 | 0,00 | 289 | 5,11 | ||||
| 2025-11-10 | 13F | ANTIPODES PARTNERS Ltd | 0 | -100,00 | 0 | |||||
| 2026-04-02 | 13F | Somerset Trust Co | 9.852 | 6,38 | 743 | 30,12 | ||||
| 2026-01-26 | 13F | Greenwood Capital Associates Llc | 22.880 | 4,97 | 1.412 | 10,40 | ||||
| 2026-02-11 | 13F | Capital International Inc /ca/ | 645.764 | 3,50 | 39.859 | 8,78 | ||||
| 2026-02-12 | 13F | UniSuper Management Pty Ltd | 9.800 | 16,67 | 830 | 20,99 | ||||
| 2026-01-12 | 13F | Horizon Financial Services, Llc | 0 | -100,00 | 0 | |||||
| 2026-02-13 | 13F | Financial Sense Advisors, Inc. | 126.872 | 111,29 | 7.831 | 122,13 | ||||
| 2026-02-13 | 13F | Zuckerman Investment Group, LLC | 0 | -100,00 | 0 | |||||
| 2026-02-26 | 13F | TD Capital Management LLC | 100 | 0,00 | 6 | 20,00 | ||||
| 2026-01-28 | 13F | Legacy Capital Group California, Inc. | 11.129 | -0,77 | 687 | 4,26 | ||||
| 2026-02-17 | 13F | Russell Investments Group, Ltd. | 604.356 | 84,50 | 37.340 | 94,40 | ||||
| 2026-04-20 | 13F | Cardinal Point Capital Management, ULC | 9.353 | 4,47 | 705 | 27,31 | ||||
| 2025-11-12 | 13F | Hager Investment Management Services, Llc | 0 | -100,00 | 0 | |||||
| 2026-02-12 | 13F | Bank Of Nova Scotia Trust Co | 222.701 | -0,49 | 13.745 | 4,62 | ||||
| 2026-02-17 | 13F | Aquatic Capital Management LLC | 0 | -100,00 | 0 | |||||
| 2025-11-14 | 13F | Concentric Capital Strategies, LP | 0 | -100,00 | 0 | -100,00 | ||||
| 2026-04-14 | 13F | Corecam Pte. Ltd. | Call | 0 | -100,00 | 0 | ||||
| 2026-02-17 | 13F | Citadel Advisors Llc | 169.982 | -93,82 | 10.491 | -93,51 | ||||
| 2026-02-17 | 13F | Citadel Advisors Llc | Call | 59.900 | -74,53 | 3.697 | -73,23 | |||
| 2025-11-13 | 13F | Twin Tree Management, LP | Put | 0 | -100,00 | 0 | -100,00 | |||
| 2026-01-29 | 13F | Matisse Capital | 10.256 | 0,00 | 633 | 5,15 | ||||
| 2026-02-17 | 13F | Citadel Advisors Llc | Put | 630.300 | -0,72 | 38.902 | 4,37 | |||
| 2026-02-10 | 13F | Goldman Sachs Group Inc | 1.247.268 | -63,52 | 76.981 | -61,65 | ||||
| 2026-02-10 | 13F | Goldman Sachs Group Inc | Put | 30.000 | 0,00 | 1.852 | 5,11 | |||
| 2026-02-17 | 13F | Banco Bilbao Vizcaya Argentaria, S.a. | 38.808 | -5,95 | 2.396 | -0,91 | ||||
| 2026-02-10 | 13F | Bnp Paribas | 2.908 | 0,00 | 179 | 5,29 | ||||
| 2026-02-10 | 13F | Envestnet Asset Management Inc | 241.156 | 2,28 | 14.889 | 7,54 | ||||
| 2026-01-29 | 13F | Vanguard Group Inc | 22.463.277 | 2,18 | 1.386.546 | 7,40 | ||||
| 2026-04-24 | 13F | Root Financial Partners, LLC | 593 | -12,41 | 45 | 7,32 | ||||
| 2026-04-21 | 13F | Sicart Associates LLC | 80.667 | 0,00 | 6.071 | 21,74 | ||||
| 2026-02-17 | 13F | Canada Pension Plan Investment Board | 8.509.304 | 17,03 | 525.243 | 23,04 | ||||
| 2026-04-22 | 13F | Princeton Global Asset Management LLC | 1.000 | 0,00 | 75 | 22,95 | ||||
| 2026-02-12 | 13F | Ensign Peak Advisors, Inc | 21.239 | 0,00 | 1.313 | 5,21 | ||||
| 2026-01-29 | 13F | IMC-Chicago, LLC | 32.225 | 1.989 | ||||||
| 2026-01-29 | 13F | IMC-Chicago, LLC | Put | 219.700 | 7,96 | 13.560 | 13,49 | |||
| 2026-01-29 | 13F | IMC-Chicago, LLC | Call | 150.300 | -38,68 | 9.277 | -35,53 | |||
| 2026-02-12 | 13F | JPL Wealth Management, LLC | 0 | -100,00 | 0 | |||||
| 2026-02-13 | 13F | Bollard Group LLC | 72.500 | -0,27 | 4 | 0,00 | ||||
| 2025-11-05 | 13F | SOUTH STATE Corp | 0 | -100,00 | 0 | -100,00 | ||||
| 2026-02-17 | 13F | Guggenheim Capital Llc | 6.628 | 2,24 | 409 | 7,63 | ||||
| 2026-02-11 | 13F | Cedar Mountain Advisors, LLC | 39 | 0,00 | 2 | 0,00 | ||||
| 2026-02-17 | 13F | Lighthouse Investment Partners, LLC | 0 | -100,00 | 0 | |||||
| 2026-02-17 | 13F | Glenmede Trust Co Na | 6.529 | 30,35 | 403 | 62,10 | ||||
| 2026-02-06 | 13F | Hardy Reed LLC | 4.963 | -1,25 | 306 | 3,73 | ||||
| 2026-04-24 | 13F | Peregrine Asset Advisers, Inc. | 12.175 | -2,40 | 919 | 19,38 | ||||
| 2026-02-11 | 13F | O'shaughnessy Asset Management, Llc | 159.680 | 65,10 | 9.856 | 73,58 | ||||
| 2026-02-17 | 13F | Price T Rowe Associates Inc /md/ | 49.575 | 14,49 | 3 | 50,00 | ||||
| 2026-02-18 | 13F | State of Tennessee, Treasury Department | 272.559 | -0,97 | 18.870 | 16,71 | ||||
| 2026-02-04 | 13F | Versor Investments LP | 0 | -100,00 | 0 | |||||
| 2026-02-13 | 13F | JustInvest LLC | 19.371 | 5,67 | 1.196 | 11,06 | ||||
| 2026-02-13 | 13F | Ubs Asset Management Americas Inc | 2.014 | 124 | ||||||
| 2026-04-03 | 13F | Investors Research Corp | 7.719 | -70,50 | 582 | -63,96 | ||||
| 2026-02-13 | 13F | Dixon Mitchell Investment Counsel Inc. | 6.542 | -96,94 | 408 | -96,76 | ||||
| 2026-04-23 | 13F | First Pacific Financial | 37 | 3 | ||||||
| 2026-01-23 | 13F | Steigerwald, Gordon & Koch Inc. | 85 | 5 | ||||||
| 2026-02-17 | 13F | Lazard Asset Management Llc | 72.589 | 60,44 | 4.480 | 68,67 | ||||
| 2025-11-14 | 13F | ExodusPoint Capital Management, LP | 76.763 | 233,35 | 4.507 | 450.500,00 | ||||
| 2026-04-13 | 13F | Jackson Square Capital, Llc | 0 | -100,00 | 0 | |||||
| 2025-11-14 | 13F | Mount Yale Investment Advisors, LLC | 0 | -100,00 | 0 | |||||
| 2026-04-20 | 13F | Assenagon Asset Management S.A. | 15.822 | 1,17 | 1.191 | 23,19 | ||||
| 2026-02-10 | 13F | Close Asset Management Ltd | 34.855 | -0,50 | 2 | 0,00 | ||||
| 2026-02-17 | 13F | XTX Topco Ltd | 0 | -100,00 | 0 | -100,00 | ||||
| 2026-01-27 | 13F | Birch Hill Investment Advisors LLC | 10.850 | 0,00 | 670 | 5,02 | ||||
| 2026-04-23 | 13F | Farmers & Merchants Investments Inc | 360 | 0,00 | 27 | 22,73 | ||||
| 2026-01-23 | 13F | Sumitomo Mitsui Trust Holdings, Inc. | 92.926 | -4,07 | 5.735 | 0,86 | ||||
| 2026-02-12 | 13F | Moerus Capital Management LLC | 519.789 | -12,73 | 32.081 | -8,26 | ||||
| 2026-02-10 | 13F | Quantbot Technologies LP | 45.807 | -78,39 | 2.827 | -77,28 | ||||
| 2026-02-04 | 13F | Ameritas Advisory Services, LLC | 0 | -100,00 | 0 | |||||
| 2026-02-17 | 13F | Clear Street Markets Llc | 6.800 | 420 | ||||||
| 2026-02-17 | 13F | Maryland State Retirement & Pension System | 127.356 | 1,43 | 7.865 | 6,63 | ||||
| 2026-04-24 | 13F | Vision Financial Markets Llc | 3.000 | 226 | ||||||
| 2026-02-10 | 13F | State of Wyoming | 4.135 | -61,83 | 255 | -59,91 | ||||
| 2026-01-30 | 13F | AMG National Trust Bank | 6.097 | 22,28 | 376 | 28,77 | ||||
| 2025-11-13 | 13F | Dodge & Cox | 0 | -100,00 | 0 | |||||
| 2026-02-09 | 13F | Frazier Financial Advisors, LLC | 100 | 0,00 | 6 | 20,00 | ||||
| 2026-02-17 | 13F | Bank Of America Corp /de/ | Call | 0 | -100,00 | 0 | -100,00 | |||
| 2026-02-17 | 13F | Voloridge Investment Management, Llc | 0 | -100,00 | 0 | -100,00 | ||||
| 2026-04-20 | 13F | Kestra Private Wealth Services, Llc | 9.081 | 4,67 | 685 | 28,04 | ||||
| 2026-02-12 | 13F | Qtron Investments LLC | 11.989 | 81,73 | 741 | 91,21 | ||||
| 2026-02-17 | 13F | Jones Financial Companies Lllp | 380.026 | 3,09 | 23.455 | 8,17 | ||||
| 2026-02-13 | 13F | Alerus Financial Na | 288 | 0,00 | 18 | 6,25 | ||||
| 2026-04-17 | 13F | Brown, Lisle/cummings, Inc. | 6.638 | -58,07 | 501 | -48,82 | ||||
| 2025-11-07 | 13F/A | Abn Amro Investment Solutions | 658.257 | 4,13 | 40.654 | 8,91 | ||||
| 2026-02-10 | 13F | Norges Bank | 6.685.047 | 412.635 | ||||||
| 2026-04-13 | 13F | Nvest Wealth Strategies, Inc. | 3 | 0 | ||||||
| 2026-02-17 | 13F | Bank Of America Corp /de/ | Put | 0 | -100,00 | 0 | -100,00 | |||
| 2026-04-20 | 13F | Jfs Wealth Advisors, Llc | 141 | 0,00 | 11 | 25,00 | ||||
| 2026-01-15 | 13F | Lodestone Wealth Management LLC | 44 | 3 | ||||||
| 2026-02-13 | 13F | Macquarie Group Ltd | 0 | -100,00 | 0 | -100,00 | ||||
| 2026-01-15 | 13F | Mn Services Vermogensbeheer B.V. | 188.125 | 3,03 | 12 | 10,00 | ||||
| 2026-02-13 | 13F | Great West Life Assurance Co /can/ | 233.118 | -21,30 | 14 | -17,65 | ||||
| 2025-11-10 | 13F | Raiffeisen Bank International AG | 0 | -100,00 | 0 | -100,00 | ||||
| 2026-02-17 | 13F | OmniStar Financial Group, Inc. | 0 | -100,00 | 0 | |||||
| 2026-02-13 | 13F | Kempen Capital Management N.v. | 255.952 | 0,00 | 21.684 | 3,60 | ||||
| 2026-02-13 | 13F | Estabrook Capital Management | 650 | 0,00 | 40 | 5,26 | ||||
| 2026-02-17 | 13F | PharVision Advisers, LLC | 0 | -100,00 | 0 | |||||
| 2026-04-16 | 13F | Toth Financial Advisory Corp | 4 | 0,00 | 0 | |||||
| 2026-04-21 | 13F | Montgomery Investment Management Inc | 3.550 | 268 | ||||||
| 2026-02-13 | 13F | Meixler Investment Management, Ltd. | 0 | -100,00 | 0 | -100,00 | ||||
| 2026-04-20 | 13F | Oak Family Advisors, Llc | 7.840 | 592 | ||||||
| 2026-02-12 | 13F | BRYN MAWR TRUST Co | 89.031 | -0,80 | 5.495 | 4,27 | ||||
| 2026-02-13 | 13F | Towarzystwo Funduszy Inwestycyjnych Pzu Sa | 0 | -100,00 | 0 | |||||
| 2026-02-13 | 13F | Barclays Plc | Put | 1.660.000 | 176,67 | 102.455 | 190,85 | |||
| 2026-02-10 | 13F | Argent Trust Co | 5.570 | -26,42 | 344 | -22,75 | ||||
| 2026-02-13 | 13F | Barclays Plc | 190.233 | 24,18 | 11.741 | 30,56 | ||||
| 2026-01-23 | 13F | Halbert Hargrove Global Advisors, Llc | 0 | -100,00 | 0 | |||||
| 2026-01-29 | 13F | Munich Reinsurance Co Stock Corp in Munich | 29.510 | -17,51 | 1.846 | -12,14 | ||||
| 2025-11-14 | 13F | Financial Network Wealth Management LLC | 0 | -100,00 | 0 | |||||
| 2026-01-27 | 13F | Emissary Wealth LLC | 10.291 | 635 | ||||||
| 2026-02-17 | 13F | Woodline Partners LP | 424.789 | 26.218 | ||||||
| 2026-02-13 | 13F | Fairfield, Bush & Co. | 13.162 | -2,21 | 812 | 2,78 | ||||
| 2026-02-10 | 13F | Peapack Gladstone Financial Corp | 5.134 | 0,08 | 0 | |||||
| 2026-02-17 | 13F | Advisory Services Network, LLC | 0 | -100,00 | 0 | |||||
| 2026-04-24 | 13F | Raiffeisen Bank International AG | Call | 65 | 0,00 | 5 | 33,33 | |||
| 2026-01-30 | 13F | Archer Investment Corp | 34 | 0,00 | 2 | 100,00 | ||||
| 2026-02-17 | 13F | Private Capital Management, LLC | 20.287 | -18,15 | 1.252 | -13,95 | ||||
| 2025-11-14 | 13F | Sagard Holdings Management Inc. | 25.930 | 0,00 | 1.522 | 0,73 | ||||
| 2026-04-13 | 13F | Fractal Investments LLC | 7.700 | 0,00 | 581 | 22,32 | ||||
| 2025-11-13 | 13F | Barometer Capital Management Inc. | 0 | -100,00 | 0 | -100,00 | ||||
| 2026-01-20 | 13F | Cigna Investments Inc /new | 8.885 | 0,00 | 1 | |||||
| 2026-04-13 | 13F | Mather Group, Llc. | 1.725 | 130 | ||||||
| 2026-02-12 | 13F | Penserra Capital Management LLC | 30 | -28,57 | 0 | |||||
| 2026-02-17 | 13F | Capital Fund Management S.a. | Put | 57.600 | 8,88 | 3.555 | 14,49 | |||
| 2026-02-17 | 13F | Capital Fund Management S.a. | Call | 42.200 | -27,74 | 2.605 | -24,04 | |||
| 2026-02-12 | 13F | Hrt Financial Lp | 88.100 | 755,34 | 5 | |||||
| 2026-03-04 | 13F | SHP Wealth Management | 64 | 4 | ||||||
| 2026-02-17 | 13F | Laird Norton Trust Company, Llc | 11.965 | 745 | ||||||
| 2026-04-27 | 13F | Oxbow Advisors, LLC | 152.059 | 6,35 | 11.474 | 30,03 | ||||
| 2026-02-13 | 13F | Colony Group, LLC | 81.042 | 726,71 | 5.002 | 769,91 | ||||
| 2026-02-13 | 13F | Kilter Group LLC | 38 | 442,86 | 2 | |||||
| 2026-03-03 | 13F/A | Caitong International Asset Management Co., Ltd | 4.012 | 1.699,10 | 248 | 1.800,00 | ||||
| 2026-04-08 | 13F | M.e. Allison & Co., Inc. | 3.265 | 0,00 | 246 | 22,39 | ||||
| 2026-04-17 | 13F | Kentucky Trust Co | 40 | 0,00 | 3 | 50,00 | ||||
| 2026-02-17 | 13F | Blackstone Group Inc | 0 | -100,00 | 0 | -100,00 | ||||
| 2026-04-15 | 13F | Avanza Fonder AB | 7.208 | 757 | ||||||
| 2026-01-28 | 13F | Barrett & Company, Inc. | 101 | 0,00 | 6 | 20,00 | ||||
| 2026-02-17 | 13F | Jain Global LLC | 5.100 | 315 | ||||||
| 2025-10-31 | 13F | Whittier Trust Co Of Nevada Inc | 0 | -100,00 | 0 | |||||
| 2026-02-17 | 13F | FIL Ltd | 4.099.609 | 28,87 | 253.046 | 35,45 | ||||
| 2026-04-17 | 13F | Cidel Asset Management Inc | 4.576 | -1,49 | 344 | 19,86 | ||||
| 2026-02-09 | 13F | Genus Capital Management Inc. | 221.481 | 33,95 | 13.689 | 40,94 | ||||
| 2026-02-17 | 13F | Utah Retirement Systems | 54.727 | 0,00 | 3.382 | 5,23 | ||||
| 2026-02-17 | 13F | Jump Financial, LLC | 145.070 | 8.954 | ||||||
| 2026-04-09 | 13F | Park Place Capital Corp | 1.409 | 106 | ||||||
| 2026-02-06 | 13F | Global Retirement Partners, LLC | 130 | 78,08 | 8 | 100,00 | ||||
| 2026-02-03 | 13F | Orion Capital Management LLC | 49 | 0,00 | 3 | 50,00 | ||||
| 2026-02-12 | 13F | Quadrant Capital Group Llc | 16.259 | 0,00 | 1.004 | 5,14 | ||||
| 2026-02-17 | 13F | Quadrature Capital Ltd | 41.625 | -82,71 | 2.573 | -81,80 | ||||
| 2025-11-12 | 13F | Erste Asset Management GmbH | 0 | -100,00 | 0 | |||||
| 2026-04-23 | 13F | Oppenheimer Asset Management Inc. | 3.181 | -36,43 | 240 | -22,08 | ||||
| 2026-02-09 | 13F | Bleakley Financial Group, LLC | 61.759 | 25,20 | 3.812 | 31,60 | ||||
| 2026-04-20 | 13F | Provenance Wealth Advisors, LLC | 535 | -1,83 | 40 | 21,21 | ||||
| 2026-02-11 | 13F | Cerity Partners LLC | 18.121 | 47,34 | 1.118 | 54,85 | ||||
| 2026-02-12 | 13F | Swiss Re Ltd | 300 | 19 | ||||||
| 2025-11-14 | 13F | AXA Investment Managers S.A. | 70.204 | 4.122 | ||||||
| 2026-04-22 | 13F | Union Bancaire Privee, UBP SA | 185.692 | 6.831,39 | 13.419 | 9.349,30 | ||||
| 2026-02-13 | 13F | Charles Schwab Investment Management Inc | 2.149.484 | 1,87 | 132.850 | 7,19 | ||||
| 2025-11-14 | 13F | Squarepoint Ops LLC | 0 | -100,00 | 0 | -100,00 | ||||
| 2026-02-13 | 13F | Rhumbline Advisers | 5.210 | -10,34 | 322 | -5,87 | ||||
| 2026-02-23 | 13F | Mv Capital Management, Inc. | 5 | 0 | ||||||
| 2026-02-09 | 13F | Fft Wealth Management Llc | 29.942 | 0,00 | 1.864 | 5,07 | ||||
| 2026-02-17 | 13F | Boreal Capital Management LLC | 144 | 0,00 | 9 | 0,00 | ||||
| 2026-04-13 | 13F | Cascade Investment Advisors, Inc. | 7.450 | -75,50 | 562 | -70,04 | ||||
| 2026-02-06 | 13F | Cumberland Partners Ltd | 75.650 | -3,07 | 4.675 | 2,03 | ||||
| 2026-01-21 | 13F | Newbridge Financial Services Group, Inc. | 0 | -100,00 | 0 | |||||
| 2026-02-13 | 13F | Walleye Capital LLC | Put | 18.800 | -39,35 | 1.160 | -36,26 | |||
| 2025-10-31 | 13F | BCJ Capital Management, LLC | 0 | -100,00 | 0 | -100,00 | ||||
| 2026-02-13 | 13F | Walleye Capital LLC | 1 | -99,82 | 0 | -100,00 | ||||
| 2026-02-13 | 13F | Walleye Capital LLC | Call | 55.700 | 38,90 | 3.438 | 46,01 | |||
| 2026-02-17 | 13F | Credit Agricole S A | 67.523 | 1,20 | 4.168 | 6,38 | ||||
| 2026-02-13 | 13F | Neuberger Berman Group LLC | 770.420 | 47,04 | 47.575 | 54,62 | ||||
| 2026-02-13 | 13F | PCM Encore, LLC | 10.913 | 674 | ||||||
| 2026-02-13 | 13F/A | Ontario Teachers Pension Plan Board | 0 | -100,00 | 0 | |||||
| 2026-02-06 | 13F | EverSource Wealth Advisors, LLC | 983 | 21,81 | 61 | 27,66 | ||||
| 2026-02-10 | 13F | Moors & Cabot, Inc. | 39.516 | -0,84 | 2.439 | 4,23 | ||||
| 2026-02-17 | 13F | Creative Planning | 78.918 | 11,84 | 4.871 | 17,58 | ||||
| 2026-02-17 | 13F | Mork Capital Management, LLC | 17.600 | 1.086 | ||||||
| 2026-02-11 | 13F | TruNorth Capital Management, LLC | 0 | -100,00 | 0 | |||||
| 2026-01-29 | 13F | Dunhill Financial, LLC | 0 | -100,00 | 0 | -100,00 | ||||
| 2026-04-22 | 13F | Louisbourg Investments Inc. | 72.059 | -14,41 | 5.429 | 4,30 | ||||
| 2026-02-17 | 13F | Man Group plc | 43.511 | -94,39 | 2.687 | -94,11 | ||||
| 2026-02-13 | 13F | Toroso Investments, LLC | 24.087 | 32,41 | 1.487 | 39,27 | ||||
| 2026-02-11 | 13F | Zions Bancorporation, National Association /ut/ | 65 | 44,44 | 4 | 100,00 | ||||
| 2026-02-09 | 13F | Strategic Financial Concepts, LLC | 0 | -100,00 | 0 | -100,00 | ||||
| 2026-02-11 | 13F | Tacita Capital Inc | 4.244 | -5,56 | 262 | -0,76 | ||||
| 2025-11-14 | 13F | Mangrove Partners | 0 | -100,00 | 0 | |||||
| 2026-02-17 | 13F | Warren Averett Asset Management, LLC | 0 | -100,00 | 0 | -100,00 | ||||
| 2025-11-14 | 13F | Wolverine Trading, Llc | 9.922 | -26,08 | 573 | -26,67 | ||||
| 2025-11-14 | 13F | Wolverine Trading, Llc | Call | 118.000 | 9,06 | 6.814 | 8,37 | |||
| 2025-11-14 | 13F | Wolverine Trading, Llc | Put | 112.600 | 5,73 | 6.503 | 5,06 | |||
| 2025-11-13 | 13F | Kayne Anderson Rudnick Investment Management Llc | 0 | -100,00 | 0 | -100,00 | ||||
| 2026-02-09 | 13F | Harbour Investments, Inc. | 704 | 97,20 | 43 | 115,00 | ||||
| 2026-02-10 | 13F | Savant Capital, LLC | 3.305 | -13,41 | 204 | -8,93 | ||||
| 2026-04-27 | 13F | Exencial Wealth Advisors, Llc | 0 | -100,00 | 0 | |||||
| 2026-04-27 | 13F | Evolution Wealth Management Inc. | 425 | 32 | ||||||
| 2026-02-05 | 13F | Western Wealth Management, LLC | 3.701 | 6,75 | 228 | 12,32 | ||||
| 2026-04-24 | 13F | Palouse Capital Management, Inc. | 0 | -100,00 | 0 | |||||
| 2026-02-10 | 13F | Rothschild Investment Llc | 982 | 1,13 | 61 | 5,26 | ||||
| 2026-02-13 | 13F | Mufg Securities (canada), Ltd. | 736.138 | -8,63 | 45.448 | -3,94 | ||||
| 2026-04-13 | 13F | BKA Wealth Consulting, Inc. | 3.794 | -2,57 | 286 | 19,17 | ||||
| 2026-02-12 | 13F | Beck Mack & Oliver Llc | 186.640 | 0,00 | 11.519 | 5,13 | ||||
| 2026-02-11 | 13F | Buckingham Strategic Partners | 3.715 | -0,96 | 229 | 4,09 | ||||
| 2026-02-13 | 13F | Schroder Investment Management Group | 353.165 | -1,86 | 21.873 | 5,25 | ||||
| 2026-04-14 | 13F | Jeppson Wealth Management, Llc | 2.788 | 210 | ||||||
| 2026-02-10 | 13F | CIBC World Markets Inc. | Call | 0 | -100,00 | 0 | -100,00 | |||
| 2026-02-13 | 13F | Marshall Wace, Llp | 6.593 | 407 | ||||||
| 2026-02-03 | 13F | Credit Capital Investments LLC | 49.300 | 0,00 | 3.043 | 5,11 | ||||
| 2026-02-10 | 13F | Hillsdale Investment Management Inc. | 212.320 | 60,90 | 13.129 | 69,46 | ||||
| 2026-02-13 | 13F | Parkside Financial Bank & Trust | 495 | 0,00 | 31 | 3,45 | ||||
| 2026-04-27 | 13F | HB Wealth Management, LLC | 4.477 | 12,88 | 337 | 37,55 | ||||
| 2026-04-21 | 13F | Pflug Koory, LLC | 10.074 | 0,00 | 760 | 22,38 | ||||
| 2026-01-29 | 13F | D.a. Davidson & Co. | 130.653 | -14,15 | 8.064 | -9,75 | ||||
| 2026-02-06 | 13F | Cullen/frost Bankers, Inc. | 7.272 | 106,30 | 449 | 117,48 | ||||
| 2026-02-12 | 13F | Ankerstar Wealth, LLC | 166 | 10 | ||||||
| 2026-02-12 | 13F | APG Asset Management N.V. | 305.340 | -7,47 | 16.068 | -2,59 | ||||
| 2026-02-13 | 13F | Promethos Capital, LLC | 243.824 | -10,38 | 15.051 | 1,66 | ||||
| 2026-02-13 | 13F | Black Creek Investment Management Inc. | 2.553.108 | 7,85 | 157.796 | 13,48 | ||||
| 2026-02-13 | 13F | Goehring & Rozencwajg Associates, LLC | 825.437 | 5,79 | 50.946 | 11,22 | ||||
| 2026-02-03 | 13F | Generali Asset Management SPA SGR | 47.021 | 70,05 | 3.984 | 76,32 | ||||
| 2026-02-12 | 13F | Insigneo Advisory Services, Llc | 3.562 | 220 | ||||||
| 2026-02-11 | 13F | Twin Tree Management, LP | 0 | -100,00 | 0 | -100,00 | ||||
| 2026-02-17 | 13F | Df Dent & Co Inc | 0 | -100,00 | 0 | -100,00 | ||||
| 2026-02-06 | 13F | Pnc Financial Services Group, Inc. | 25.734 | 7,80 | 1.588 | 13,35 | ||||
| 2026-02-12 | 13F | Logan Capital Management Inc | 18.578 | 0,00 | 1.147 | 5,14 | ||||
| 2026-04-10 | 13F | Pure Financial Advisors, Inc. | 3.057 | 231 | ||||||
| 2026-01-30 | 13F | Four Tree Island Advisory LLC | 11.163 | 0,00 | 689 | 5,04 | ||||
| 2026-04-24 | 13F | Yousif Capital Management, Llc | 6.532 | 0,00 | 493 | 12,07 | ||||
| 2026-02-17 | 13F | First Manhattan Co | 190.576 | -3,66 | 11.884 | 1,31 | ||||
| 2026-02-13 | 13F | Smartleaf Asset Management LLC | 119 | 20,20 | 7 | 40,00 | ||||
| 2026-02-17 | 13F | Trexquant Investment LP | 91.149 | 93,25 | 5.626 | 103,14 | ||||
| 2026-02-17 | 13F | Two Sigma Securities, Llc | 5.158 | 318 | ||||||
| 2026-02-11 | 13F | Deutsche Bank Ag\ | 9.798.196 | 1,97 | 604.745 | 7,20 | ||||
| 2025-11-12 | 13F | Burgundy Asset Management Ltd. | 165.000 | 0,00 | 9.504 | -0,97 | ||||
| 2026-02-06 | 13F | BOK Financial Private Wealth, Inc. | 765 | 0,00 | 48 | 4,44 | ||||
| 2026-02-03 | 13F | Manning & Napier Advisors Llc | 39.664 | -6,30 | 2.478 | -0,28 | ||||
| 2026-01-27 | 13F | Probity Advisors, Inc. | 26.077 | -12,78 | 1.609 | -8,32 | ||||
| 2026-01-23 | 13F | Evolution Advisers, Inc. | 867 | 0,00 | 0 | |||||
| 2026-02-10 | 13F | JTC Employer Solutions Trusteee Ltd | 0 | -100,00 | 0 | |||||
| 2026-04-07 | 13F | Eastern Bank | 696 | -0,43 | 53 | 20,93 | ||||
| 2026-02-13 | 13F | Thomist Capital Management, LP | Put | 0 | -100,00 | 0 | -100,00 | |||
| 2026-02-12 | 13F | Jane Street Group, Llc | Call | 122.900 | -52,62 | 7.585 | -50,19 | |||
| 2026-02-12 | 13F | Jane Street Group, Llc | Put | 524.400 | 3,82 | 32.366 | 9,14 | |||
| 2026-02-12 | 13F | Jane Street Group, Llc | 25.643 | -34,58 | 1.583 | -31,25 | ||||
| 2026-02-13 | 13F | Kopernik Global Investors, LLC | 1.753.659 | 38,45 | 108.236 | 45,55 | ||||
| 2025-11-07 | 13F | M&G Plc | 0 | -100,00 | 0 | |||||
| 2026-04-15 | 13F | Addenda Capital Inc. | 105.900 | 0,00 | 11.202 | 23,77 | ||||
| 2026-02-09 | 13F | Cary Street Partners Financial Llc | 63.551 | 0,39 | 3.922 | 5,54 | ||||
| 2026-02-12 | 13F | Bank Of Montreal /can/ | Put | 0 | -100,00 | 0 | -100,00 | |||
| 2026-02-13 | 13F | Police & Firemen's Retirement System of New Jersey | 65.521 | -7,34 | 4.050 | -2,50 | ||||
| 2026-03-06 | 13F | Hsbc Holdings Plc | 0 | -100,00 | 0 | |||||
| 2026-02-12 | 13F | Brown Brothers Harriman & Co | 2.567 | 11,08 | 158 | 17,04 | ||||
| 2026-02-02 | 13F | Fifth Third Bancorp | 140 | -40,43 | 9 | -38,46 | ||||
| 2026-02-11 | 13F | Capital Research Global Investors | 1.151.049 | 0,68 | 71.043 | 5,84 | ||||
| 2026-02-12 | 13F | Fortress Private Ledger, Llc | 6.180 | 67,12 | 381 | 75,58 | ||||
| 2026-04-09 | 13F | DHJJ Financial Advisors, Ltd. | 25 | 0,00 | 2 | 0,00 | ||||
| 2026-01-16 | 13F | Trust Co Of Vermont | 200 | -75,00 | 12 | -73,91 | ||||
| 2026-02-10 | 13F | Td Asset Management Inc | 8.928.534 | 21,17 | 551.821 | 27,49 | ||||
| 2026-02-12 | 13F | Sprott Inc. | 54.682 | 1,18 | 3.375 | 6,37 | ||||
| 2026-02-13 | 13F | Recurrent Investment Advisors LLC | 50.060 | 0,00 | 4.238 | 3,67 | ||||
| 2026-04-16 | 13F | Balboa Wealth Partners | 2.811 | 212 | ||||||
| 2026-02-05 | 13F | AlphaCore Capital LLC | 0 | -100,00 | 0 | -100,00 | ||||
| 2026-04-15 | 13F | FNY Investment Advisers, LLC | 0 | -100,00 | 0 | |||||
| 2026-04-23 | 13F | Asset Planning,Inc | 691 | 0,00 | 52 | 23,81 | ||||
| 2026-02-04 | 13F | Hikari Power Ltd | 216.310 | 0,00 | 13 | 8,33 | ||||
| 2026-04-07 | 13F | Cardinal Capital Management, Inc. | 473.902 | -9,96 | 35.661 | -20,02 | ||||
| 2026-02-17 | 13F | SIG North Trading, ULC | Put | 104.800 | -11,04 | 6.468 | -6,48 | |||
| 2026-02-17 | 13F | SIG North Trading, ULC | Call | 364.300 | -4,86 | 22.485 | 0,02 | |||
| 2026-02-17 | 13F | SIG North Trading, ULC | 51.628 | -46,32 | 3.186 | -43,57 | ||||
| 2026-02-13 | 13F | Gould Asset Management Llc /ca/ | 3.768 | 0,00 | 233 | 4,98 | ||||
| 2025-11-07 | 13F | Beacon Capital Management, LLC | 0 | -100,00 | 0 | -100,00 | ||||
| 2026-04-24 | 13F | Private Advisor Group, LLC | 6.655 | 56,33 | 502 | 91,60 | ||||
| 2026-01-30 | 13F | BancorpSouth Bank | 137.195 | 0,78 | 8.468 | 5,94 | ||||
| 2026-02-17 | 13F | Albar Capital Partners LLP | 4.506 | 278 | ||||||
| 2026-04-16 | 13F | SG Americas Securities, LLC | 91.528 | 1.974,52 | 7 | |||||
| 2026-04-27 | 13F | PFG Investments, LLC | 12.395 | 36,66 | 935 | 67,26 | ||||
| 2026-01-28 | 13F | DekaBank Deutsche Girozentrale | 534.983 | 0,00 | 32 | 3,33 | ||||
| 2026-02-10 | 13F | Goldman Sachs Group Inc | Call | 0 | -100,00 | 0 | -100,00 | |||
| 2026-02-17 | 13F | Cresset Asset Management, LLC | 155.994 | -0,37 | 9.727 | 4,78 | ||||
| 2026-02-11 | 13F | Simplex Trading, Llc | 18.681 | 668,45 | 1.153 | |||||
| 2026-02-17 | 13F | Murchinson Ltd. | 0 | -100,00 | 0 | -100,00 | ||||
| 2026-02-11 | 13F | Simplex Trading, Llc | Call | 33.500 | -80,32 | 2.068 | 22.866,67 | |||
| 2026-02-11 | 13F | Simplex Trading, Llc | Put | 145.000 | -0,55 | 8.949 | 111.762,50 | |||
| 2026-02-06 | 13F | Cadence Wealth Management LLC | 15.421 | 4,46 | 952 | 9,82 | ||||
| 2026-02-06 | 13F/A | Rathbone Brothers plc | 25.521 | -8,59 | 1.575 | -3,90 | ||||
| 2026-02-17 | 13F | Public Employees Retirement System Of Ohio | 214.068 | 0,12 | 13.219 | 5,26 | ||||
| 2026-04-15 | 13F | Bayforest Capital Ltd | 984 | 5.688,24 | 74 | 7.300,00 | ||||
| 2026-02-13 | 13F | MAI Capital Management | 4.398 | -0,72 | 271 | 4,23 | ||||
| 2026-04-23 | 13F | Oppenheimer & Co Inc | 4.390 | 0,02 | 331 | 22,59 | ||||
| 2026-04-27 | 13F | Ethic Inc. | 4.397 | 332 | ||||||
| 2026-02-18 | 13F/A | Empowered Funds, LLC | 5.206 | 321 | ||||||
| 2026-04-22 | 13F | Quintet Private Bank (Europe) S.A. | 0 | -100,00 | 0 | |||||
| 2026-02-19 | 13F | Invesco Ltd. | 1.415.304 | 3,50 | 87.353 | 8,80 | ||||
| 2026-02-04 | 13F | LRI Investments, LLC | 80 | 0,00 | 5 | 0,00 | ||||
| 2026-02-12 | 13F | Principal Securities, Inc. | 0 | -100,00 | 0 | |||||
| 2026-04-08 | 13F | First Heartland Consultants, Inc. | 0 | -100,00 | 0 | |||||
| 2026-01-27 | 13F | First Horizon Corp | 3.098 | 105,17 | 191 | 117,05 | ||||
| 2026-02-17 | 13F | Murchinson Ltd. | Put | 895.300 | 55.258 | |||||
| 2026-02-17 | 13F | Murchinson Ltd. | Call | 52.300 | 3.228 | |||||
| 2025-11-14 | 13F | Harvest Fund Management Co., Ltd | 0 | -100,00 | 0 | |||||
| 2026-01-21 | 13F | Modera Wealth Management, LLC | 69.352 | -3,50 | 4.280 | 1,45 | ||||
| 2026-04-22 | 13F | Janney Montgomery Scott LLC | 68.721 | -1,64 | 5 | 25,00 | ||||
| 2026-02-13 | 13F | Transamerica Financial Advisors, Inc. | 0 | 0 | ||||||
| 2026-02-13 | 13F | Healthcare Of Ontario Pension Plan Trust Fund | 270.323 | -56,95 | 16.684 | -54,75 | ||||
| 2026-01-27 | 13F | Lorne Steinberg Wealth Management Inc. | 108.055 | 0,99 | 6.679 | 6,34 | ||||
| 2026-02-06 | 13F | Harvest Portfolios Group Inc. | 51.305 | -1,61 | 3.167 | 3,40 | ||||
| 2026-02-17 | 13F | Susquehanna International Group, Llp | 38.545 | 56,04 | 2.379 | 64,00 | ||||
| 2026-02-13 | 13F | 1832 Asset Management L.P. | 7.832.048 | -2,35 | 483.394 | 2,66 | ||||
| 2026-02-17 | 13F | Susquehanna International Group, Llp | Put | 745.800 | 21,37 | 46.031 | 27,59 | |||
| 2026-02-17 | 13F | Susquehanna International Group, Llp | Call | 482.400 | -30,73 | 29.774 | -27,18 | |||
| 2026-02-12 | 13F | CoreCommodity Management, LLC | 5.631 | -70,12 | 348 | -68,63 | ||||
| 2025-11-12 | 13F | RiverGlades Family Offices LLC | 4.000 | 0,00 | 235 | 0,86 | ||||
| 2026-01-22 | 13F | Bfsg, Llc | 23.426 | -0,11 | 1.446 | 5,01 | ||||
| 2026-02-13 | 13F | Cohen & Steers, Inc. | 234.897 | -15,67 | 14 | -12,50 | ||||
| 2026-02-17 | 13F | Caption Management, LLC | Call | 0 | -100,00 | 0 | ||||
| 2026-02-17 | 13F | Polar Asset Management Partners Inc. | 50.000 | 3.087 | ||||||
| 2026-04-13 | 13F | Salem Investment Counselors Inc | 3 | 0 | ||||||
| 2026-04-24 | 13F | Essex Financial Services, Inc. | 2.973 | 224 | ||||||
| 2026-04-15 | 13F | Weatherly Asset Management L. P. | 47.328 | -0,94 | 3.594 | 20,98 | ||||
| 2026-02-11 | 13F | Allianz Asset Management GmbH | 1.914.185 | 39,43 | 118.307 | 46,67 | ||||
| 2026-02-13 | 13F | Evelyn Partners Investment Management LLP | 2.066 | 0,00 | 128 | 4,96 | ||||
| 2026-02-10 | 13F/A | Northwestern Mutual Wealth Management Co | 15.304 | 55,28 | 945 | 63,32 | ||||
| 2026-02-23 | 13F | Beaird Harris Wealth Management, LLC | 5 | 0,00 | 0 | |||||
| 2026-02-02 | 13F | Millstone Evans Group, LLC | 338 | 0,00 | 21 | 5,26 | ||||
| 2026-04-07 | 13F | U.S. Capital Wealth Advisors, LLC | 4.681 | 1,36 | 353 | 23,86 | ||||
| 2026-02-09 | 13F | Huntington National Bank | 356 | -45,73 | 22 | -44,74 | ||||
| 2026-04-22 | 13F | Viewpoint Investment Partners Corp | 49.060 | 3.734 | ||||||
| 2026-04-21 | 13F | PDS Planning, Inc | 3.624 | 0,95 | 273 | 23,53 | ||||
| 2026-02-18 | 13F | KKM Financial LLC | 90.464 | 17,32 | 5.583 | 23,35 | ||||
| 2026-02-13 | 13F | Walleye Trading LLC | Call | 128.800 | -38,26 | 7.950 | -35,09 | |||
| 2026-02-13 | 13F | Walleye Trading LLC | 22.327 | 1.378 | ||||||
| 2026-02-04 | 13F | Nwam Llc | 3.184 | 211 | ||||||
| 2026-02-13 | 13F | Alberta Investment Management Corp | 687.200 | 12,97 | 42.418 | 18,77 | ||||
| 2026-02-13 | 13F | Walleye Trading LLC | Put | 75.100 | 24,75 | 4.635 | 31,15 | |||
| 2026-02-13 | 13F | National Bank Of Canada /fi/ | 5.177.772 | 9,76 | 318.799 | 15,51 | ||||
| 2026-04-13 | 13F | LexAurum Advisors, LLC | 3.354 | 253 | ||||||
| 2026-04-21 | 13F | Grace & White Inc /ny | 88.100 | -15,77 | 6.648 | 2,99 | ||||
| 2026-02-17 | 13F | Cape Investment Advisory, Inc. | 198 | 25,32 | 12 | 33,33 | ||||
| 2026-02-13 | 13F | Royal London Asset Management Ltd | 52.252 | -2,59 | 3.225 | 2,38 | ||||
| 2026-04-28 | 13F | SBI Securities Co., Ltd. | 6.604 | 4,43 | 498 | 27,69 | ||||
| 2026-04-21 | 13F | Gilpin Wealth Management, Llc | 40 | 0,00 | 3 | 50,00 | ||||
| 2026-02-17 | 13F | Northern Trust Corp | 406.688 | 1,15 | 25.101 | 6,33 | ||||
| 2026-01-15 | 13F | Nisa Investment Advisors, Llc | 220 | 20,22 | 14 | 30,00 | ||||
| 2026-01-23 | 13F | Assetmark, Inc | 13.874 | 64,60 | 856 | 73,28 | ||||
| 2025-11-12 | 13F | Headlands Technologies LLC | 0 | -100,00 | 0 | |||||
| 2026-02-03 | 13F | Garner Asset Management Corp | 90 | 6 | ||||||
| 2026-04-13 | 13F | St Germain D J Co Inc | 1.545 | 0,00 | 117 | 22,11 | ||||
| 2026-02-17 | 13F | Two Sigma Advisers, Lp | 67.348 | 46,41 | 4.157 | 53,93 | ||||
| 2026-04-23 | 13F | American National Bank | 0 | -100,00 | 0 | |||||
| 2026-02-10 | 13F | CIBC Asset Management Inc | 505.327 | -34,07 | 31.218 | -30,58 | ||||
| 2026-04-23 | 13F | Cornerstone Wealth Management, LLC | 2.757 | 208 | ||||||
| 2026-02-13 | 13F | Sei Investments Co | 296.582 | 351,71 | 18.305 | 374,96 | ||||
| 2026-04-23 | 13F | Pathway Financial Advisers, LLC | 28.624 | -1,31 | 2.160 | 20,61 | ||||
| 2025-11-14 | 13F | Axa S.a. | 0 | -100,00 | 0 | |||||
| 2026-02-17 | 13F | DZ BANK AG Deutsche Zentral Genossenschafts Bank, Frankfurt am Main | 110.037 | 8,16 | 6.792 | 13,69 | ||||
| 2026-02-03 | 13F | Strengthening Families & Communities, LLC | 90 | 1,12 | 6 | 0,00 | ||||
| 2026-02-02 | 13F | Pittenger & Anderson Inc | 30 | 0,00 | 2 | 0,00 | ||||
| 2026-01-27 | 13F | Evergreen Capital Management Llc | 63.638 | -1,40 | 3.962 | 3,66 | ||||
| 2026-02-17 | 13F | Prelude Capital Management, Llc | 11.568 | 714 | ||||||
| 2026-02-17 | 13F | Blair William & Co/il | 24.172 | -7,59 | 1.492 | -2,87 | ||||
| 2026-04-14 | 13F | Thurston, Springer, Miller, Herd & Titak, Inc. | 43 | -33,85 | 3 | -25,00 | ||||
| 2026-02-17 | 13F | Janus Henderson Group Plc | 460.095 | 18,39 | 28.441 | 25,01 | ||||
| 2026-02-17 | 13F | Investment Management Corp of Ontario | 59.252 | 228,58 | 3.657 | 245,65 | ||||
| 2026-02-12 | 13F | Callan Family Office, LLC | 11.084 | 685 | ||||||
| 2026-02-13 | 13F | Stifel Financial Corp | 236.529 | 1,83 | 14.599 | 7,05 | ||||
| 2026-04-23 | 13F | Chelsea Counsel Co | 1.520 | 0,00 | 95 | 0,00 | ||||
| 2026-02-11 | 13F | Nikko Asset Management Americas, Inc. | 92.926 | 5.734 | ||||||
| 2026-02-13 | 13F | Pathstone Holdings, LLC | 10.719 | 2,11 | 662 | 7,31 | ||||
| 2026-02-10 | 13F | Bruce G. Allen Investments, LLC | 2.651 | 12,57 | 164 | 18,12 | ||||
| 2026-04-27 | 13F | Moran Wealth Management, LLC | 33.383 | 28,79 | 2.512 | 56,80 | ||||
| 2026-02-05 | 13F | Bessemer Group Inc | 999 | 6,62 | 0 | |||||
| 2026-02-02 | 13F | Danske Bank A/s | 2.672 | -22,71 | 165 | -17,50 | ||||
| 2026-04-22 | 13F | Pinnacle Bancorp, Inc. | 53 | -54,31 | 4 | -57,14 | ||||
| 2026-02-12 | 13F | First Western Trust Bank | 3.272 | 202 | ||||||
| 2026-02-13 | 13F | Wells Fargo & Company/mn | 251.974 | 10,59 | 15.563 | 16,25 | ||||
| 2026-02-17 | 13F | Optiver Holding B.V. | 0 | -100,00 | 0 | |||||
| 2026-04-22 | 13F | Canoe Financial LP | 1.319.947 | 99.603 | ||||||
| 2026-02-13 | 13F | DKRT Investments Corp. | 45.000 | 0,00 | 2.777 | 5,15 | ||||
| 2026-02-11 | 13F | Letko, Brosseau & Associates Inc | 2.910.084 | -0,17 | 179.859 | 5,04 | ||||
| 2026-04-24 | 13F | Keybank National Association/oh | 4.198 | 317 | ||||||
| 2026-03-31 | 13F/A | Barclays Plc | Call | 0 | -100,00 | 0 | -100,00 | |||
| 2026-01-23 | 13F | Altfest L J & Co Inc | 0 | -100,00 | 0 | |||||
| 2026-02-09 | 13F | Employees Retirement System of Texas | 5.125 | 0,00 | 0 | |||||
| 2026-02-05 | 13F | Blume Capital Management, Inc. | 32.091 | 0,00 | 1.981 | 5,10 | ||||
| 2026-02-05 | 13F | Pacific Heights Asset Management Llc | 400.000 | 33,33 | 24.688 | 40,17 | ||||
| 2026-02-17 | 13F | Aqr Capital Management Llc | 248.093 | 1.237,86 | 15.314 | 1.307,44 | ||||
| 2026-02-10 | 13F | PCJ Investment Counsel Ltd. | 23.930 | -14,84 | 1.477 | -10,43 | ||||
| 2026-02-13 | 13F | Bank Of Nova Scotia | Put | 850 | 0,00 | 52 | 6,12 | |||
| 2026-02-10 | 13F | Godfrey Financial Associates, Inc. | 19 | 1 | ||||||
| 2026-02-12 | 13F | Commonwealth Equity Services, Llc | 95.083 | 6,18 | 5.869 | 117.260,00 | ||||
| 2026-02-05 | 13F | Qsemble Capital Management, LP | 8.457 | -91,87 | 522 | -91,46 | ||||
| 2026-02-12 | 13F | Federation des caisses Desjardins du Quebec | 3.667.487 | 3,21 | 225.955 | 9,03 | ||||
| 2026-02-11 | 13F | Brandes Investment Partners, Lp | 1.859.268 | 3,99 | 114.755 | 9,32 | ||||
| 2026-02-12 | 13F | Northwest & Ethical Investments L.P. | 187.845 | 16,02 | 11.601 | 21,99 | ||||
| 2026-04-22 | 13F | Gold Investment Management Ltd. | 1.890 | 1,23 | 143 | 23,48 | ||||
| 2026-02-12 | 13F | Burkett Asset Management Ltd | 39.776 | 2.459 | ||||||
| 2026-02-10 | 13F | Natixis Advisors, L.p. | 36.450 | -32,90 | 2 | -33,33 | ||||
| 2025-10-30 | 13F | QV Investors Inc. | 0 | -100,00 | 0 | |||||
| 2026-02-10 | 13F | Private Wealth Asset Management, LLC | 1.347 | -1,68 | 83 | 3,75 | ||||
| 2026-02-06 | 13F | Intrust Bank Na | 7.424 | -2,01 | 458 | 3,15 | ||||
| 2026-02-10 | 13F | Robertson Opportunity Capital, LLC | 31.000 | 0,00 | 1.913 | 5,11 | ||||
| 2026-04-08 | 13F | Clarus Wealth Advisors | 3.019 | 232 | ||||||
| 2026-02-02 | 13F | Cornerstone Planning Group LLC | 89 | -97,61 | 6 | -85,71 | ||||
| 2026-02-17 | 13F | Advisor Group Holdings, Inc. | 37.908 | -2,05 | 2.345 | 4,69 | ||||
| 2026-04-16 | 13F | Uhlmann Price Securities, Llc | 4.050 | -5,57 | 306 | 15,53 | ||||
| 2026-01-27 | 13F | Elevated Capital Advisors, LLC | 3.398 | 210 | ||||||
| 2026-02-12 | 13F | Wealthspire Advisors, LLC | 0 | -100,00 | 0 | -100,00 | ||||
| 2025-11-07 | 13F | Shell Asset Management Co | 18.413 | -61,76 | 1 | -50,00 | ||||
| 2026-04-15 | 13F | McAlvany Wealth Management LLC | 43.900 | 7,47 | 3.361 | 33,28 | ||||
| 2026-02-12 | 13F | Aviva Plc | 410.795 | 5,60 | 25.376 | 11,18 | ||||
| 2025-12-16 | 13F | Garde Capital, Inc. | 0 | -100,00 | 0 | |||||
| 2026-02-09 | 13F | Kingsview Wealth Management, LLC | 10.622 | -5,72 | 656 | -0,91 | ||||
| 2026-02-17 | 13F | D. E. Shaw & Co., Inc. | Call | 358.700 | 0,00 | 22.142 | 5,14 | |||
| 2026-02-17 | 13F | D. E. Shaw & Co., Inc. | Put | 410.000 | 0,00 | 25.309 | 5,14 | |||
| 2026-01-28 | 13F | U S Global Investors Inc | 25.000 | 0,00 | 1.543 | 5,18 | ||||
| 2026-02-17 | 13F | D. E. Shaw & Co., Inc. | 81.232 | -71,64 | 5.014 | -70,19 | ||||
| 2026-02-13 | 13F | Bank Of Nova Scotia | 1.995.605 | -16,94 | 123.173 | -12,69 | ||||
| 2026-02-13 | 13F | Morgan Stanley | 3.372.403 | 0,06 | 208.145 | 5,19 | ||||
| 2026-02-20 | 13F | Kovitz Investment Group Partners, LLC | 0 | -100,00 | 0 | |||||
| 2026-04-20 | 13F | Live Oak Private Wealth LLC | 5.000 | -9,50 | 377 | 10,56 | ||||
| 2026-02-13 | 13F | Pinnacle Wealth Planning Services, Inc. | 2.722 | 168 | ||||||
| 2026-01-12 | 13F | CVA Family Office, LLC | 2.022 | 0,00 | 125 | 5,08 | ||||
| 2025-11-13 | 13F | Bridgewater Associates, LP | 0 | -100,00 | 0 | -100,00 | ||||
| 2026-02-04 | 13F | Glass Wealth Management Co LLC | 38.765 | -16,41 | 2.393 | -12,12 | ||||
| 2026-02-05 | 13F | Atria Investments Llc | 30.038 | 23,50 | 1.854 | 29,85 | ||||
| 2026-02-12 | 13F | Hollencrest Capital Management | 3.431 | 0,00 | 212 | 4,98 | ||||
| 2026-04-22 | 13F | Smallwood Wealth Investment Management, LLC | 51 | 0,00 | 4 | 0,00 | ||||
| 2026-01-22 | 13F | Bartlett & Co. Wealth Management Llc | 2.051 | 0,00 | 128 | 4,96 | ||||
| 2026-01-29 | 13F | Sava Infond d.o.o. | 34.050 | -2,01 | 2.102 | 2,99 | ||||
| 2026-04-27 | 13F | Td Private Client Wealth Llc | 43.646 | -2,29 | 3.285 | 18,94 | ||||
| 2026-04-27 | 13F | Y-Intercept (Hong Kong) Ltd | 39.767 | -8,58 | 3.001 | 11,77 | ||||
| 2026-02-17 | 13F | Tudor Investment Corp Et Al | Call | 5.300 | -83,44 | 327 | -82,59 | |||
| 2026-02-17 | 13F | Tudor Investment Corp Et Al | Put | 10.600 | 17,78 | 654 | 23,86 | |||
| 2026-02-12 | 13F | Swiss National Bank | 1.286.136 | -8,29 | 79.548 | -3,46 | ||||
| 2026-04-13 | 13F | Advocate Group Llc | 118.595 | -3,27 | 8.949 | 18,26 | ||||
| 2026-02-10 | 13F | Connor, Clark & Lunn Investment Management Ltd. | 1.050.919 | 22,03 | 64.868 | 28,29 | ||||
| 2026-02-13 | 13F | Baird Financial Group, Inc. | 148.672 | 8,55 | 9.176 | 14,12 | ||||
| 2026-02-03 | 13F | Tweedy, Browne Co LLC | 17.735 | 21,35 | 1.096 | 27,74 | ||||
| 2026-02-10 | 13F | Daiwa Securities Group Inc. | 3.000 | 0 | ||||||
| 2026-04-14 | 13F | Murphy Pohlad Asset Management LLC | 59.225 | -0,25 | 4.469 | 21,97 | ||||
| 2026-02-14 | 13F | Torrey Growth & Income Advisors | 0 | -100,00 | 0 | -100,00 | ||||
| 2026-04-27 | 13F | Fideuram - Intesa Sanpaolo Private Banking S.p.a. | 820 | 0,00 | 62 | 22,00 | ||||
| 2026-02-13 | 13F | Palisade Asset Management, LLC | 0 | -100,00 | 0 | |||||
| 2025-11-14 | 13F | Twinbeech Capital Lp | 0 | -100,00 | 0 | |||||
| 2026-04-13 | 13F | Massmutual Trust Co Fsb/adv | 879 | -12,62 | 66 | 6,45 | ||||
| 2026-04-21 | 13F | Capital Investment Counsel, Inc | 5.395 | -1,82 | 406 | 19,47 | ||||
| 2026-04-14 | 13F | Nbc Securities, Inc. | 2.531 | -46,93 | 191 | -35,03 | ||||
| 2026-02-17 | 13F | Alpine Woods Capital Investors, Llc | 5.875 | 0,00 | 363 | 5,23 | ||||
| 2026-02-17 | 13F | Schonfeld Strategic Advisors LLC | 143.072 | 47,17 | 8.830 | 54,72 | ||||
| 2026-02-17 | 13F | Agf Management Ltd | 1.138.537 | 1,20 | 87.402 | 5,24 | ||||
| 2026-04-13 | 13F | GoalVest Advisory LLC | 56 | 4 | ||||||
| 2026-02-04 | 13F | First Eagle Investment Management, LLC | 13.307.283 | 0,53 | 821.326 | 5,68 | ||||
| 2026-02-10 | 13F | Scheer, Rowlett & Associates Investment Management Ltd. | 458.531 | -24,05 | 28.303 | -20,15 | ||||
| 2026-02-06 | 13F | Marble Harbor Investment Counsel, LLC | 5.370 | 0,00 | 331 | 5,08 | ||||
| 2026-04-17 | 13F | Baker Ellis Asset Management LLC | 3.000 | 226 | ||||||
| 2026-04-21 | 13F | E&G Advisors, LP | 2.900 | 219 | ||||||
| 2026-02-10 | 13F | One Capital Management, LLC | 12.950 | 799 | ||||||
| 2026-02-12 | 13F | Bank Of Montreal /can/ | Call | 44.200 | 43,51 | 2.728 | 50,88 | |||
| 2026-04-20 | 13F | Ritholtz Wealth Management | 6.661 | 4,49 | 503 | 27,74 | ||||
| 2026-02-12 | 13F | Bank Of Montreal /can/ | 15.780.230 | -0,07 | 974.047 | 5,06 | ||||
| 2026-01-30 | 13F | Bogart Wealth, LLC | 9 | 0,00 | 1 | |||||
| 2026-02-17 | 13F | Quantinno Capital Management LP | 86.156 | 9,21 | 5.321 | 14,85 | ||||
| 2026-04-21 | 13F | Wedbush Securities Inc | 3.908 | -1,93 | 0 | |||||
| 2026-02-10 | 13F | Bnp Paribas Arbitrage, Sa | Put | 2.500 | 0,00 | 15.430 | 5,13 | |||
| 2026-02-17 | 13F | Zacks Investment Management | 3.641 | -11,90 | 225 | -7,44 | ||||
| 2026-02-10 | 13F | Bnp Paribas Arbitrage, Sa | 17.317 | -93,83 | 1.069 | -93,51 | ||||
| 2026-02-12 | 13F | Colrain Capital Llc | 143.820 | 12,23 | 8.960 | 17,97 | ||||
| 2026-02-13 | 13F | WealthTrust Axiom LLC | 103.780 | -0,86 | 6.405 | 4,23 | ||||
| 2026-04-22 | 13F | Larry Mathis Financial Planning, LLC | 2.770 | 209 | ||||||
| 2026-02-12 | 13F | Groupe la Francaise | 3.712 | 3,17 | 229 | 9,57 | ||||
| 2026-04-06 | 13F | Washington Trust Advisors, Inc. | 2.676 | 0,00 | 202 | 21,82 | ||||
| 2026-02-17 | 13F | LMR Partners LLP | Call | 14.400 | -33,33 | 889 | -29,97 | |||
| 2026-02-17 | 13F | LMR Partners LLP | Put | 15.900 | 0,00 | 981 | 5,14 | |||
| 2026-01-23 | 13F | Avion Wealth | 2 | 0 | ||||||
| 2026-02-11 | 13F | Horizon Kinetics Asset Management Llc | 51.872 | -0,10 | 3.202 | 5,02 | ||||
| 2026-04-24 | 13F | Syntax Research, Inc. | 300 | 0,00 | 23 | 22,22 | ||||
| 2026-02-17 | 13F | Parvin Asset Management, LLC | 6.255 | -51,29 | 386 | -48,74 | ||||
| 2026-02-13 | 13F | First Trust Advisors Lp | 158.739 | 30,61 | 9.798 | 37,31 | ||||
| 2026-04-07 | 13F | Farther Finance Advisors, LLC | 2.316 | 10,13 | 173 | 33,33 | ||||
| 2026-04-08 | 13F | Holos Integrated Wealth LLC | 51 | 0,00 | 4 | 0,00 | ||||
| 2026-02-13 | 13F | Centiva Capital, LP | 0 | -100,00 | 0 | -100,00 | ||||
| 2026-02-12 | 13F | Dimensional Fund Advisors Lp | 5.632.248 | 2,24 | 347.647 | 7,49 | ||||
| 2026-04-08 | 13F | Wealth Enhancement Advisory Services, Llc | 9.654 | 17,06 | 443 | -9,43 | ||||
| 2026-02-17 | 13F | Alliancebernstein L.p. | 71.540 | 1,92 | 4.415 | 7,13 | ||||
| 2026-01-30 | 13F | Lincluden Management Ltd | 518.869 | -4,14 | 44 | 38,71 | ||||
| 2026-04-22 | 13F | Coston, McIsaac & Partners | 3 | 0,00 | 0 | |||||
| 2026-02-11 | 13F | LPL Financial LLC | 140.851 | 4,63 | 8.693 | 10,00 | ||||
| 2026-02-12 | 13F | denkapparat Operations GmbH | 5.502 | 340 | ||||||
| 2026-02-11 | 13F | Group One Trading, L.p. | Call | 24.000 | -84,22 | 1.481 | -83,41 | |||
| 2026-02-17 | 13F | Amundi | 2.534.972 | 9,63 | 156.457 | 12,50 | ||||
| 2026-02-11 | 13F | Group One Trading, L.p. | Put | 65.000 | 1,88 | 4.012 | 7,10 | |||
| 2026-02-11 | 13F | Westerkirk Capital Inc. | 1.360 | -93,35 | 84 | -93,09 | ||||
| 2026-02-05 | 13F | Mesirow Financial Investment Management, Inc. | 0 | -100,00 | 0 | -100,00 | ||||
| 2026-02-11 | 13F | Group One Trading, L.p. | 14.008 | -37,19 | 865 | -34,00 | ||||
| 2025-11-13 | 13F | Jefferies Financial Group Inc. | 0 | -100,00 | 0 | |||||
| 2026-01-29 | 13F | Sanctuary Advisors, LLC | 41.051 | 8,28 | 2.536 | 13,88 | ||||
| 2026-02-12 | 13F | Sfam, Llc | 600 | 37 | ||||||
| 2026-04-24 | 13F | USS Investment Management Ltd | 44.437 | 0,00 | 3.350 | 22,32 | ||||
| 2026-04-16 | 13F | Everstar Asset Management, LLC | 11.405 | 861 | ||||||
| 2026-02-13 | 13F | Epoch Investment Partners, Inc. | 1.202.538 | -3,64 | 74.221 | 1,30 | ||||
| 2026-02-17 | 13F | Ancora Advisors, LLC | 1.011 | 1,30 | 62 | 6,90 | ||||
| 2026-04-23 | 13F | North Star Investment Management Corp. | 50 | 25,00 | 4 | 50,00 | ||||
| 2026-01-22 | 13F | Bear Mountain Capital, Inc. | 0 | -100,00 | 0 | |||||
| 2026-02-13 | 13F | OMERS ADMINISTRATION Corp | 1.240.184 | 5.891,23 | 76.650 | 6.208,64 | ||||
| 2026-02-17 | 13F | Engineers Gate Manager LP | 46.439 | -2,05 | 2.866 | 2,98 | ||||
| 2026-04-13 | 13F | Gateway Investment Advisers Llc | 29.272 | -48,38 | 2.209 | -36,91 | ||||
| 2026-04-20 | 13F | City State Bank | 3.015 | -13,49 | 228 | 5,58 | ||||
| 2026-02-17 | 13F | Susquehanna Fundamental Investments, Llc | 0 | -100,00 | 0 | |||||
| 2026-02-17 | 13F | Raymond James Financial Inc | 334.998 | 24,29 | 20.676 | 30,67 | ||||
| 2026-02-12 | 13F | Nuveen, LLC | 1.329.255 | 1,77 | 82.154 | 7,08 | ||||
| 2026-04-21 | 13F | Pinnacle Associates Ltd | 20.972 | -0,79 | 1.583 | 21,32 | ||||
| 2026-02-12 | 13F | Rossby Financial, LCC | 2.903 | -15,86 | 179 | -8,21 | ||||
| 2026-01-30 | 13F | Jackson Hole Capital Partners, LLC | 63.922 | -3,68 | 3.945 | 1,26 | ||||
| 2026-02-13 | 13F | Mml Investors Services, Llc | 13.833 | 24,14 | 854 | 30,43 | ||||
| 2025-11-14 | 13F | Marex Group plc | 0 | -100,00 | 0 | -100,00 | ||||
| 2026-01-22 | 13F | Accordant Advisory Group Inc | 5 | 0 | ||||||
| 2026-01-26 | 13F | AE Wealth Management LLC | 3.729 | 1,19 | 230 | 6,48 | ||||
| 2026-04-06 | 13F | CX Institutional | 0 | -100,00 | 0 | |||||
| 2026-04-27 | 13F | Pensionmark Financial Group, Llc | 5.586 | 11,92 | 421 | 36,69 | ||||
| 2026-01-08 | 13F | Chesapeake Asset Management Llc | 562 | 0,00 | 35 | 3,03 | ||||
| 2026-04-21 | 13F | Nemes Rush Group LLC | 6 | 0,00 | 0 | |||||
| 2026-01-15 | 13F | Hara Capital LLC | 140 | 0,00 | 9 | 0,00 | ||||
| 2026-02-05 | 13F | Intrua Financial, LLC | 0 | -100,00 | 0 | |||||
| 2026-02-17 | 13F | Bank Of America Corp /de/ | 3.301.614 | -16,70 | 203.776 | -12,43 | ||||
| 2026-04-28 | 13F | Belpointe Asset Management LLC | 16.567 | 295,11 | 1.250 | 384,50 | ||||
| 2026-01-21 | 13F | Prime Capital Investment Advisors, LLC | 3.918 | -11,28 | 242 | -6,95 | ||||
| 2026-02-17 | 13F | Two Sigma Investments, Lp | 15.800 | -23,67 | 975 | -19,75 | ||||
| 2025-11-12 | 13F | Easterly Investment Partners Llc | 0 | -100,00 | 0 | |||||
| 2026-04-06 | 13F | Highline Wealth Partners Llc | 7 | 0,00 | 1 | |||||
| 2026-02-02 | 13F | Principal Financial Group Inc | 302.196 | 26,54 | 18.677 | 33,15 | ||||
| 2026-01-30 | 13F | Us Bancorp \de\ | 34.531 | -0,18 | 2.131 | 4,92 | ||||
| 2026-02-10 | 13F | Gulf International Bank (UK) Ltd | 23.633 | 0,00 | 1 | 0,00 | ||||
| 2026-02-17 | 13F | SailingStone Capital Partners LLC | 171.619 | 147,71 | 10.592 | 160,44 | ||||
| 2026-02-17 | 13F | MIRAE ASSET GLOBAL ETFS HOLDINGS Ltd. | 18.211 | -21,37 | 1.124 | -17,37 | ||||
| 2026-02-18 | 13F | Mackenzie Financial Corp | 7.219.733 | 4,42 | 450.310 | 10,92 | ||||
| 2026-02-10 | 13F | Intech Investment Management Llc | 30.346 | -55,05 | 1.876 | -52,71 | ||||
| 2026-01-26 | 13F | Asset Dedication, LLC | 408 | 0,00 | 25 | 8,70 | ||||
| 2026-02-23 | 13F | Monetary Solutions, Ltd | 31 | 2 | ||||||
| 2026-04-23 | 13F | Fairway Wealth LLC | 68 | 5 | ||||||
| 2025-11-05 | 13F | Koesten, Hirschmann & Crabtree, INC. | 0 | -100,00 | 0 | |||||
| 2026-02-06 | 13F | Van Hulzen Asset Management, LLC | 3.845 | 0,00 | 237 | 5,33 | ||||
| 2026-02-03 | 13F | Chesapeake Capital Corp /il/ | 12.116 | 0,90 | 748 | 6,11 | ||||
| 2026-02-05 | 13F | Gabelli Funds Llc | 46.400 | 6,91 | 2.864 | 12,36 | ||||
| 2026-02-10 | 13F | Semanteon Capital Management, LP | 0 | -100,00 | 0 | -100,00 | ||||
| 2026-04-06 | 13F | Versant Capital Management, Inc | 3.058 | 24,21 | 230 | 51,32 | ||||
| 2026-04-23 | 13F | Lansforsakringar Fondforvaltning AB (publ) | 115.056 | -1,25 | 8.657 | 20,22 | ||||
| 2026-02-13 | 13F | Osmosis Investment Management UK Ltd | 32.099 | 1.998 | ||||||
| 2026-02-09 | 13F | Legal & General Group Plc | 2.705.643 | 6,92 | 167.223 | 12,50 | ||||
| 2026-01-30 | 13F | Citizens National Bank Trust Department | 5.985 | -0,58 | 369 | 4,53 | ||||
| 2026-02-13 | 13F | Aigen Investment Management, Lp | 6.313 | -43,83 | 390 | -57,63 | ||||
| 2026-01-30 | 13F/A | M&t Bank Corp | 12.272 | 14,97 | 757 | 20,93 | ||||
| 2026-02-04 | 13F | Beverly Hills Private Wealth, LLC | 3.937 | 0,00 | 231 | 0,00 | ||||
| 2026-01-15 | 13F | J. Safra Sarasin Holding AG | 24.134 | 16,50 | 1.492 | 22,62 | ||||
| 2026-02-05 | 13F/A | Fulcrum Asset Management LLP | 5.880 | 17,18 | 367 | 24,83 | ||||
| 2026-02-17 | 13F | Fmr Llc | 11.903.091 | -23,81 | 734.696 | -19,91 | ||||
| 2025-11-12 | 13F | Fox Run Management, L.l.c. | 0 | -100,00 | 0 | |||||
| 2025-10-30 | 13F | Ridgewood Investments LLC | Call | 0 | -100,00 | 0 | -100,00 | |||
| 2025-11-14 | 13F | Capstone Investment Advisors, Llc | 3.563 | 209 | ||||||
| 2026-04-15 | 13F | Uncommon Cents Investing LLC | 10.680 | -0,28 | 806 | 21,79 | ||||
| 2026-02-13 | 13F | State Street Corp | 1.749.901 | -5,74 | 108.937 | -0,94 | ||||
| 2026-01-20 | 13F/A | Miller Wealth Advisors, Llc | 45 | 0,00 | 3 | 0,00 | ||||
| 2026-02-12 | 13F | Tocqueville Asset Management L.p. | 367.723 | -3,35 | 22.696 | 1,61 | ||||
| 2026-02-17 | 13F | Armistice Capital, Llc | 0 | -100,00 | 0 | |||||
| 2026-01-30 | 13F | Caldwell Securities, Inc | 721 | 0,00 | 44 | 4,76 | ||||
| 2026-02-10 | 13F | Forsta Ap-fonden | 105.100 | -5,40 | 6.496 | -0,46 | ||||
| 2025-11-14 | 13F | Cubist Systematic Strategies, LLC | Put | 42.100 | 321,00 | 2.472 | 324,57 | |||
| 2026-02-10 | 13F | CIBC World Markets Inc. | Put | 60.000 | 0,00 | 3.704 | 5,14 | |||
| 2026-02-13 | 13F | Squarepoint Ops LLC | Put | 4.100 | -8,89 | 253 | -4,17 | |||
| 2026-02-10 | 13F | CIBC World Markets Inc. | 6.203.340 | 27,23 | 382.932 | 33,77 | ||||
| 2025-11-14 | 13F | Cubist Systematic Strategies, LLC | Call | 23.600 | 31,11 | 1.386 | 32,16 | |||
| 2026-02-06 | 13F | GPS Wealth Strategies Group, LLC | 0 | -100,00 | 0 | |||||
| 2026-01-26 | 13F | Cwm, Llc | 35.281 | -3,36 | 2 | 0,00 | ||||
| 2026-02-17 | 13F | Balyasny Asset Management Llc | Call | 8.600 | -57,21 | 531 | -55,08 | |||
| 2026-02-17 | 13F | Balyasny Asset Management Llc | Put | 28.600 | -23,12 | 1.765 | -19,18 | |||
| 2026-02-17 | 13F | Caption Management, LLC | 7.200 | 444 | ||||||
| 2026-02-13 | 13F | Atlas Capital Advisors Llc | 98 | 0,00 | 6 | 20,00 | ||||
| 2026-04-08 | 13F | Legacy Wealth Asset Management, LLC | 10.654 | 0,11 | 804 | 22,41 | ||||
| 2026-04-14 | 13F | Silchester International Investors LLP | 1.309.665 | -67,71 | 98.827 | -60,52 | ||||
| 2026-02-17 | 13F | Balyasny Asset Management Llc | 4.137 | -98,47 | 255 | -98,40 | ||||
| 2026-04-06 | 13F | GAMMA Investing LLC | 21 | 0,00 | 2 | 0,00 | ||||
| 2026-01-09 | 13F | 180 Wealth Advisors, Llc | 3.431 | -33,57 | 212 | -30,36 | ||||
| 2026-01-28 | 13F | N.E.W. Advisory Services LLC | 0 | -100,00 | 0 | -100,00 | ||||
| 2025-11-05 | 13F | Boyd Watterson Asset Management Llc/oh | 0 | -100,00 | 0 | -100,00 | ||||
| 2026-04-10 | 13F | Viking Fund Management Llc | 30.000 | 2.264 | ||||||
| 2026-02-06 | 13F | Aviance Capital Partners, LLC | 27.594 | -0,84 | 1.703 | 4,29 | ||||
| 2026-02-17 | 13F | Family Management Corp | 76.619 | 2,14 | 4.736 | 7,47 | ||||
| 2026-02-11 | 13F | CoreFirst Bank & Trust | 0 | -100,00 | 0 | |||||
| 2026-04-16 | 13F | SG Americas Securities, LLC | Put | 0 | -100,00 | 0 | ||||
| 2026-04-16 | 13F | SG Americas Securities, LLC | Call | 0 | -100,00 | 0 | ||||
| 2026-02-17 | 13F | Susquehanna Advisors Group, Inc. | 121.900 | 7.524 | ||||||
| 2025-11-14 | 13F | Point72 Europe (London) LLP | 0 | -100,00 | 0 | |||||
| 2026-02-06 | 13F | Mraz, Amerine & Associates, Inc. | 23.408 | -2,79 | 1.445 | 2,19 | ||||
| 2026-02-10 | 13F | Basepoint Wealth LLC | 5.692 | -34,66 | 352 | -31,31 | ||||
| 2026-02-13 | 13F | Hudson Bay Capital Management LP | 71.486 | -38,54 | 4.412 | -35,38 | ||||
| 2026-04-08 | 13F | NorthCrest Asset Manangement, LLC | 3.786 | -50,47 | 286 | -39,87 | ||||
| 2026-02-13 | 13F | Verition Fund Management LLC | Call | 0 | -100,00 | 0 | -100,00 | |||
| 2026-02-12 | 13F | Hikari Tsushin, Inc. | 0 | -100,00 | 0 | |||||
| 2026-02-13 | 13F | Verition Fund Management LLC | 0 | -100,00 | 0 | -100,00 | ||||
| 2026-04-22 | 13F | Silver Coast Investments LLC | 6.704 | 17,86 | 506 | 43,87 | ||||
| 2026-04-21 | 13F | Foundation Resource Management Inc | 186.276 | 7,83 | 14.056 | 31,83 | ||||
| 2026-02-13 | 13F | Vontobel Holding Ltd. | 21.455 | -1,00 | 1.324 | 4,09 | ||||
| 2026-02-17 | 13F | Qube Research & Technologies Ltd | Put | 2.500 | -59,02 | 154 | -56,98 | |||
| 2026-02-05 | 13F | O'Brien Greene & Co. Inc | 126.363 | 2,03 | 7.799 | 7,26 | ||||
| 2026-04-21 | 13F | BCS Private Wealth Management, Inc. | 69.293 | 5,13 | 5.267 | 28,31 | ||||
| 2026-02-13 | 13F | Manufacturers Life Insurance Company, The | 4.607.607 | -3,46 | 284.923 | 1,64 | ||||
| 2026-02-04 | 13F | Wsfs Capital Management, Llc | 131.681 | -1,29 | 8.128 | 3,77 | ||||
| 2026-02-13 | 13F | Van Eck Associates Corp | 1.762.523 | -4,97 | 109 | 0,00 | ||||
| 2026-04-17 | 13F | Bell Investment Advisors, Inc | 22 | 0,00 | 2 | 0,00 | ||||
| 2025-11-12 | 13F | Bahl & Gaynor Inc | 0 | -100,00 | 0 | |||||
| 2026-02-17 | 13F | Lombard Odier Asset Management (Switzerland) SA | 24.093 | 1.487 | ||||||
| 2026-02-17 | 13F | Cetera Investment Advisers | 42.639 | -4,45 | 2.635 | 0,53 | ||||
| 2026-02-17 | 13F | Silvercrest Asset Management Group Llc | 80.928 | 1,02 | 4.995 | 6,19 | ||||
| 2026-02-13 | 13F | Boston Partners | 2.967.179 | -8,63 | 245.103 | -5,59 | ||||
| 2026-02-17 | 13F | Advisor Group Holdings, Inc. | Call | 0 | -100,00 | 0 | ||||
| 2026-02-10 | 13F | Fielder Capital Group LLC | 4.008 | 0,23 | 247 | 5,56 | ||||
| 2026-02-13 | 13F | Clal Insurance Enterprises Holdings Ltd | 2.385.282 | -20,10 | 148 | -15,91 | ||||
| 2026-01-08 | 13F | Goodman Financial Corp | 262.474 | -0,34 | 16.200 | 4,76 | ||||
| 2026-02-04 | 13F | MONECO Advisors, LLC | 8.504 | -17,92 | 525 | -13,82 | ||||
| 2026-02-17 | 13F | Qube Research & Technologies Ltd | Call | 2.500 | 31,58 | 154 | 38,74 | |||
| 2026-02-17 | 13F | Qube Research & Technologies Ltd | 48.162 | -90,89 | 2.973 | -90,43 | ||||
| 2026-02-17 | 13F | United Capital Financial Advisers, Llc | 7.857 | 39,78 | 485 | 47,11 | ||||
| 2025-11-13 | 13F | Jefferies Financial Group Inc. | Call | 0 | -100,00 | 0 | ||||
| 2026-04-17 | 13F | PKO Investment Management Joint-Stock Co | 21.121 | 46,71 | 1.591 | 78,65 | ||||
| 2026-02-06 | 13F | HighTower Advisors, LLC | 14.032 | 3,96 | 866 | 9,34 | ||||
| 2026-02-17 | 13F | Occudo Quantitative Strategies Lp | 196.422 | 153,47 | 12.123 | 166,50 | ||||
| 2026-04-03 | 13F | Ridgewood Investments LLC | 3.473 | -58,15 | 262 | -29,38 | ||||
| 2026-02-17 | 13F | SageView Advisory Group, LLC | 19 | 1 | ||||||
| 2026-04-14 | 13F | American State Bank (Iowa) | 0 | -100,00 | 0 | |||||
| 2025-11-12 | 13F | CIBC Bancorp USA Inc. | 7.067 | 505 | ||||||
| 2026-02-17 | 13F | Grantham, Mayo, Van Otterloo & Co. LLC | 352.341 | -18,23 | 21.747 | -14,04 | ||||
| 2026-03-12 | 13F/A | Peak6 Llc | Call | 287.700 | -63,29 | 17.757 | -61,41 | |||
| 2026-02-17 | 13F | Mercer Global Advisors Inc /adv | 6.415 | 10,76 | 396 | 16,18 | ||||
| 2026-03-12 | 13F/A | Peak6 Llc | Put | 63.300 | 3.907 | |||||
| 2026-02-13 | 13F | Maven Securities LTD | Put | 31.500 | 0,00 | 1.945 | 5,14 | |||
| 2026-04-22 | 13F | Apollon Wealth Management, LLC | 4.880 | 368 | ||||||
| 2026-02-11 | 13F | Parallel Advisors, LLC | 1.801 | -3,28 | 111 | 1,83 | ||||
| 2026-02-14 | 13F | Rockefeller Capital Management L.P. | 12.308 | 4,26 | 760 | 9,52 | ||||
| 2025-11-13 | 13F | Glenmede Investment Management, LP | 6.528 | 47,46 | 383 | 49,03 | ||||
| 2026-04-08 | 13F | General Partner, Inc. | 107 | 0,00 | 8 | 33,33 | ||||
| 2026-01-23 | 13F | Transcend Wealth Collective, Llc | 3.616 | 223 | ||||||
| 2025-11-19 | 13F | Sunbelt Securities, Inc. | 0 | -100,00 | 0 | |||||
| 2026-02-17 | 13F | Caisse De Depot Et Placement Du Quebec | 1.281.563 | 31,23 | 79.208 | 38,08 | ||||
| 2026-02-06 | 13F | Larson Financial Group LLC | 20 | 66,67 | 1 | |||||
| 2026-01-23 | 13F | Westside Investment Management, Inc. | 417 | 0,00 | 26 | 13,04 | ||||
| 2026-04-10 | 13F | Perigon Wealth Management, LLC | 3.302 | 0,36 | 249 | 22,66 | ||||
| 2026-02-12 | 13F | Steward Partners Investment Advisory, Llc | 3.956 | -3,89 | 244 | 1,24 | ||||
| 2026-02-13 | 13F | Arrowstreet Capital, Limited Partnership | 13.669.590 | -3,88 | 843.726 | 1,05 | ||||
| 2026-04-24 | 13F | Sage Investment Counsel LLC | 3.600 | 0,00 | 272 | 22,07 | ||||
| 2026-02-12 | 13F | CIBC Private Wealth Group, LLC | 3.959 | -3,06 | 244 | 2,09 | ||||
| 2026-01-29 | 13F | DecisionPoint Financial, LLC | 20 | 0,00 | 1 | 0,00 | ||||
| 2026-02-12 | 13F | Brinker Capital Investments, LLC | 4.005 | 10,67 | 247 | 16,51 | ||||
| 2026-04-17 | 13F | Murphy & Mullick Capital Management Corp | 6 | 0,00 | 0 | |||||
| 2026-02-13 | 13F | Aviso Financial Inc. | 24.688 | -2,49 | 1.524 | 2,42 | ||||
| 2026-03-13 | 13F | Fund Advisors of America Inc/FL | 5.045 | 311 | ||||||
| 2026-01-22 | 13F | Mh & Associates Securities Management Corp /adv | 31.868 | 1.967 | ||||||
| 2026-02-09 | 13F | Hantz Financial Services, Inc. | 16.139 | -3,10 | 1 | |||||
| 2026-04-07 | 13F | CoreCap Advisors, LLC | 334 | 42,74 | 25 | 78,57 | ||||
| 2026-04-15 | 13F | DAVENPORT & Co LLC | 3.622 | -3,70 | 273 | 17,24 | ||||
| 2026-02-17 | 13F | Wealth Watch Advisors, INC | 46 | 0,00 | 3 | 0,00 | ||||
| 2026-02-17 | 13F | Worldquant Millennium Advisors Llc | 0 | -100,00 | 0 | |||||
| 2026-02-12 | 13F | Scotia Capital Inc. | 1.133.430 | -0,35 | 69.790 | 5,26 | ||||
| 2026-03-31 | 13F | Sankala Group LLC | 201 | 0,00 | 15 | 0,00 | ||||
| 2026-02-10 | 13F | ESL Trust Services, LLC | 0 | -100,00 | 0 | |||||
| 2026-01-28 | 13F | Geneos Wealth Management Inc. | 593 | 0,00 | 37 | 5,88 | ||||
| 2026-01-26 | 13F | Private Trust Co Na | 314 | 13,36 | 19 | 18,75 | ||||
| 2026-01-29 | 13F | UBS Group AG | 1.064.016 | -9,08 | 65.671 | -4,42 | ||||
| 2026-02-09 | 13F | Hartland & Co., LLC | 100 | 6 | ||||||
| 2026-04-28 | 13F | Stratos Wealth Partners, LTD. | 3.330 | 251 | ||||||
| 2026-02-13 | 13F | American Century Companies Inc | 402.205 | 11,54 | 24.826 | 17,24 | ||||
| 2026-04-27 | 13F | Lesa Sroufe & Co | 52.002 | 1,80 | 4 | 0,00 | ||||
| 2026-04-21 | 13F | Abbington Investment Group | 33.620 | 0,04 | 2.537 | 22,28 | ||||
| 2026-02-02 | 13F | Intact Investment Management Inc. | 1.056.505 | -6,09 | 65.210 | -1,31 | ||||
| 2026-02-17 | 13F | Toronto Dominion Bank | Call | 0 | -100,00 | 0 | ||||
| 2026-04-27 | 13F | Tsfg, Llc | 30 | 0,00 | 0 | |||||
| 2026-02-13 | 13F | BRITISH COLUMBIA INVESTMENT MANAGEMENT Corp | 852.399 | 204,19 | 52.615 | 219,80 | ||||
| 2026-04-07 | 13F | Signaturefd, Llc | 13.737 | 0,53 | 1.037 | 22,89 | ||||
| 2026-02-12 | 13F | Cloud Capital Management, LLC | 0 | -100,00 | 0 | |||||
| 2026-02-03 | 13F | Van Strum & Towne Inc. | 5.742 | -11,03 | 354 | -6,35 | ||||
| 2026-02-13 | 13F | Citigroup Inc | 250.672 | -35,27 | 15.493 | -31,89 | ||||
| 2026-02-13 | 13F | Citigroup Inc | Call | 62.000 | -50,04 | 3.832 | -47,44 | |||
| 2026-02-11 | 13F | Manchester Capital Management LLC | 813 | 50 | ||||||
| 2026-04-24 | 13F | Ninety One UK Ltd | 1.424.220 | 107.472 | ||||||
| 2026-02-13 | 13F | Citigroup Inc | Put | 300.000 | 0,00 | 18.542 | 5,22 | |||
| 2026-02-19 | 13F | CI Private Wealth, LLC | Put | 26 | 2 | |||||
| 2026-02-13 | 13F | Sofos Investments, Inc. | 7 | 0,00 | 0 | |||||
| 2026-02-19 | 13F | CI Private Wealth, LLC | 59.264 | 91,79 | 1.981 | 9,15 | ||||
| 2026-02-12 | 13F | Andra AP-fonden | 42.221 | 3.577 | ||||||
| 2026-01-21 | 13F/A | Euro Pacific Asset Management, LLC | 103.322 | -0,82 | 6 | 0,00 | ||||
| 2026-04-22 | 13F | Spire Wealth Management | 3.491 | 8,38 | 263 | 32,83 | ||||
| 2026-04-17 | 13F | AdvisorNet Financial, Inc | 31 | 2 | ||||||
| 2026-02-12 | 13F | BlackRock, Inc. | 2.969.474 | -0,46 | 183.276 | 4,64 | ||||
| 2026-01-14 | 13F | ORG Partners LLC | 3.055 | 0,00 | 189 | 5,03 | ||||
| 2026-02-03 | 13F | ASR Vermogensbeheer N.V. | 18.720 | 0,00 | 1.157 | 5,19 | ||||
| 2026-04-13 | 13F | Creative Financial Designs Inc /adv | 336 | 0,00 | 25 | 25,00 | ||||
| 2026-04-23 | 13F | MQS Management LLC | 11.954 | 902 |