Grundlæggende statistik
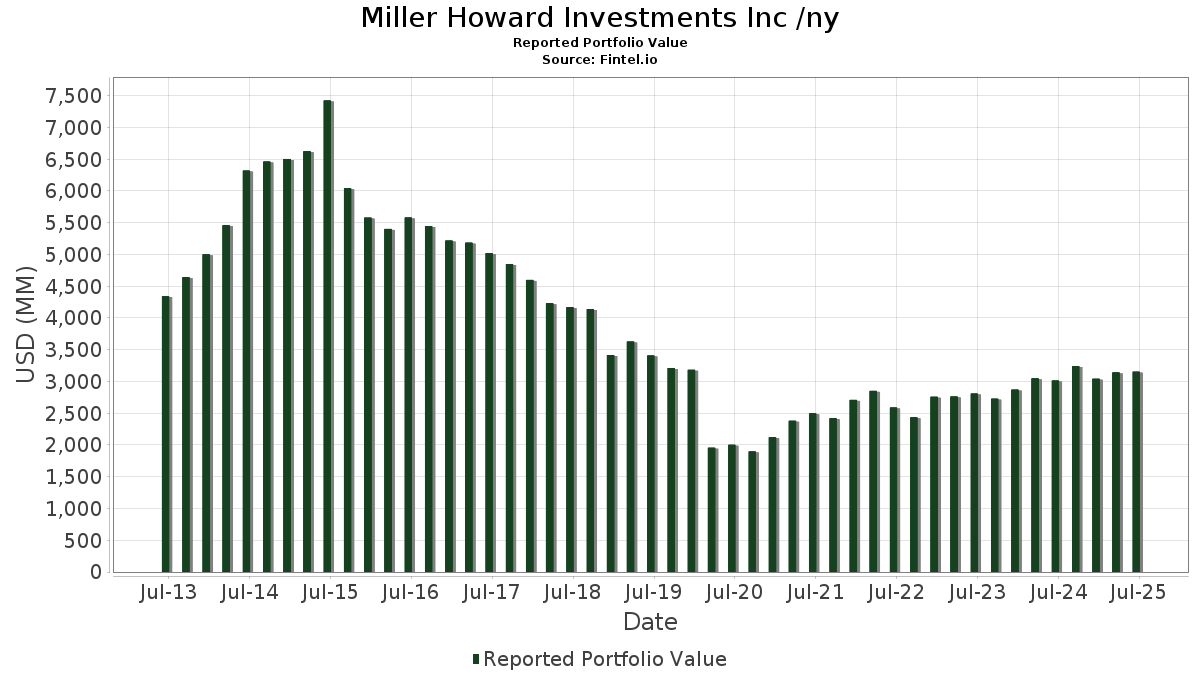
| Porteføljeværdi | $ 3.153.339.403 |
| Nuværende stillinger | 136 |
Seneste beholdninger, ydeevne, AUM (fra 13F, 13D)
Miller Howard Investments Inc /ny har afsløret 136 samlede besiddelser i deres seneste SEC-arkivering. Den seneste porteføljeværdi er beregnet til at være $ 3.153.339.403 USD. Faktiske aktiver under forvaltning (AUM) er denne værdi plus kontanter (som ikke er oplyst). Miller Howard Investments Inc /nys største beholdninger er MPLX LP - Limited Partnership (US:MPLX) , Enterprise Products Partners L.P. - Limited Partnership (US:EPD) , Energy Transfer LP - Limited Partnership (US:ET) , Cisco Systems, Inc. (US:CSCO) , and Paychex, Inc. (US:PAYX) .
Top øger dette kvartal
Vi bruger ændringen i porteføljeallokeringen, fordi dette er den mest meningsfulde metrik. Ændringer kan skyldes handler eller ændringer i aktiekurser.
| Sikkerhed | Aktier (MM) |
Værdi (MM$) |
Portefølje % | ΔPortefølje % |
|---|---|---|---|---|
| 1,15 | 56,30 | 1,7853 | 0,8906 | |
| 0,35 | 26,21 | 0,8313 | 0,8313 | |
| 0,60 | 64,33 | 2,0400 | 0,6870 | |
| 0,59 | 50,47 | 1,6006 | 0,5486 | |
| 0,91 | 56,85 | 1,8028 | 0,4538 | |
| 1,70 | 50,06 | 1,5875 | 0,4153 | |
| 0,23 | 66,65 | 2,1137 | 0,3219 | |
| 2,46 | 37,85 | 1,2004 | 0,3200 | |
| 1,25 | 86,66 | 2,7482 | 0,2995 | |
| 0,81 | 36,75 | 1,1654 | 0,2975 |
Top falder i dette kvartal
Vi bruger ændringen i porteføljeallokeringen, fordi dette er den mest meningsfulde metrik. Ændringer kan skyldes handler eller ændringer i aktiekurser.
| Sikkerhed | Aktier (MM) |
Værdi (MM$) |
Portefølje % | ΔPortefølje % |
|---|---|---|---|---|
| 0,06 | 7,90 | 0,2506 | -1,2511 | |
| 0,16 | 27,95 | 0,8863 | -0,6341 | |
| 0,25 | 20,50 | 0,6501 | -0,4954 | |
| 0,93 | 19,04 | 0,6037 | -0,3302 | |
| 3,36 | 104,14 | 3,3025 | -0,3206 | |
| 0,41 | 75,31 | 2,3883 | -0,3137 | |
| 2,24 | 115,39 | 3,6593 | -0,2927 | |
| 1,17 | 22,81 | 0,7234 | -0,2508 | |
| 0,52 | 79,12 | 2,5092 | -0,2253 | |
| 1,27 | 49,00 | 1,5540 | -0,1951 |
13F og Fondsarkivering
Denne formular blev indsendt den 2025-07-11 for rapporteringsperioden 2025-06-30. Klik på linkikonet for at se den fulde transaktionshistorik.
Opgrader for at låse op for premium-data og eksportere til Excel ![]() .
.
| Sikkerhed | Type | Gennemsnitlig aktiekurs | Aktier (MM) |
Δ Aktier (%) |
Δ Aktier (%) |
Værdi ($MM) |
Portefølje (%) |
ΔPortefølje (%) |
|
|---|---|---|---|---|---|---|---|---|---|
| MPLX / MPLX LP - Limited Partnership | 2,24 | -3,43 | 115,39 | -7,06 | 3,6593 | -0,2927 | |||
| EPD / Enterprise Products Partners L.P. - Limited Partnership | 3,36 | 0,73 | 104,14 | -8,50 | 3,3025 | -0,3206 | |||
| ET / Energy Transfer LP - Limited Partnership | 5,21 | 3,60 | 94,54 | 1,03 | 2,9981 | 0,0194 | |||
| CSCO / Cisco Systems, Inc. | 1,25 | 0,20 | 86,66 | 12,66 | 2,7482 | 0,2995 | |||
| PAYX / Paychex, Inc. | 0,54 | 0,19 | 79,20 | -5,54 | 2,5115 | -0,1573 | |||
| JNJ / Johnson & Johnson | 0,52 | 0,00 | 79,12 | -7,89 | 2,5092 | -0,2253 | |||
| ORI / Old Republic International Corporation | 2,02 | 0,14 | 77,69 | -1,85 | 2,4636 | -0,0561 | |||
| ABBV / AbbVie Inc. | 0,41 | 0,15 | 75,31 | -11,27 | 2,3883 | -0,3137 | |||
| GILD / Gilead Sciences, Inc. | 0,66 | -0,17 | 73,58 | -1,23 | 2,3335 | -0,0379 | |||
| BK / The Bank of New York Mellon Corporation | 0,79 | -0,16 | 71,69 | 8,46 | 2,2735 | 0,1693 | |||
| JPM / JPMorgan Chase & Co. | 0,23 | 0,19 | 66,65 | 18,41 | 2,1137 | 0,3219 | |||
| VICI / VICI Properties Inc. | 2,02 | 0,25 | 65,87 | 0,19 | 2,0890 | -0,0040 | |||
| STT / State Street Corporation | 0,60 | 27,42 | 64,33 | 51,34 | 2,0400 | 0,6870 | |||
| MDT / Medtronic plc | 0,73 | 0,13 | 63,89 | -2,87 | 2,0262 | -0,0678 | |||
| GSK / GSK plc - Depositary Receipt (Common Stock) | 1,66 | 0,79 | 63,74 | -0,09 | 2,0212 | -0,0096 | |||
| EWBC / East West Bancorp, Inc. | 0,62 | 0,05 | 63,02 | 12,56 | 1,9984 | 0,2162 | |||
| EXC / Exelon Corporation | 1,44 | 0,38 | 62,66 | -5,42 | 1,9872 | -0,1217 | |||
| VZ / Verizon Communications Inc. | 1,39 | 0,64 | 60,11 | -4,00 | 1,9064 | -0,0870 | |||
| WES / Western Midstream Partners, LP - Limited Partnership | 1,47 | 2,95 | 56,86 | -2,73 | 1,8032 | -0,0577 | |||
| WMB / The Williams Companies, Inc. | 0,91 | 27,64 | 56,85 | 34,15 | 1,8028 | 0,4538 | |||
| TRP / TC Energy Corporation | 1,15 | 93,81 | 56,30 | 100,30 | 1,7853 | 0,8906 | |||
| EBGEF / Enbridge Inc. - Preferred Stock | 1,23 | 11,12 | 55,56 | 13,65 | 1,7618 | 0,2057 | |||
| PAA / Plains All American Pipeline, L.P. - Limited Partnership | 2,86 | 0,10 | 52,48 | -8,31 | 1,6641 | -0,1576 | |||
| CMCSA / Comcast Corporation | 1,42 | 1,47 | 50,67 | -1,86 | 1,6070 | -0,0367 | |||
| ETR / Entergy Corporation | 0,61 | 1,10 | 50,56 | -1,70 | 1,6033 | -0,0340 | |||
| C / Citigroup Inc. | 0,59 | 27,38 | 50,47 | 52,73 | 1,6006 | 0,5486 | |||
| BAC / Bank of America Corporation | 1,06 | 0,14 | 50,16 | 13,55 | 1,5905 | 0,1845 | |||
| KMI / Kinder Morgan, Inc. | 1,70 | 31,92 | 50,06 | 35,94 | 1,5875 | 0,4153 | |||
| HESM / Hess Midstream LP | 1,27 | -2,06 | 49,00 | -10,82 | 1,5540 | -0,1951 | |||
| TTE / TotalEnergies SE - Depositary Receipt (Common Stock) | 0,80 | -0,16 | 48,89 | -5,25 | 1,5505 | -0,0922 | |||
| CNQ / Canadian Natural Resources Limited | 1,45 | 0,83 | 45,57 | 2,80 | 1,4452 | 0,0340 | |||
| LNG / Cheniere Energy, Inc. | 0,18 | 12,76 | 44,47 | 18,67 | 1,4104 | 0,2174 | |||
| IPG / The Interpublic Group of Companies, Inc. | 1,71 | 2,52 | 41,97 | -7,59 | 1,3308 | -0,1148 | |||
| CMS / CMS Energy Corporation | 0,57 | 0,73 | 39,58 | -7,09 | 1,2553 | -0,1009 | |||
| GSCE / GS Connect S&P GSCI Enhanced Commodity Total Return ETN | 0,05 | 0,19 | 38,79 | 29,81 | 1,2303 | 0,2789 | |||
| LAMR / Lamar Advertising Company | 0,32 | 0,42 | 38,76 | 7,11 | 1,2291 | 0,0772 | |||
| HST / Host Hotels & Resorts, Inc. | 2,46 | 26,61 | 37,85 | 36,86 | 1,2004 | 0,3200 | |||
| TXN / Texas Instruments Incorporated | 0,18 | 0,16 | 37,83 | 15,71 | 1,1996 | 0,1590 | |||
| SUN / Sunoco LP - Limited Partnership | 0,69 | 0,56 | 37,04 | -7,18 | 1,1745 | -0,0957 | |||
| USB / U.S. Bancorp | 0,81 | 25,76 | 36,75 | 34,79 | 1,1654 | 0,2975 | |||
| AM / Antero Midstream Corporation | 1,93 | 11,22 | 36,49 | 17,10 | 1,1571 | 0,1652 | |||
| NTR / Nutrien Ltd. | 0,62 | 0,15 | 36,14 | 17,44 | 1,1462 | 0,1665 | |||
| PSX / Phillips 66 | 0,28 | -0,72 | 33,82 | -4,08 | 1,0726 | -0,0498 | |||
| KO / The Coca-Cola Company | 0,46 | -0,37 | 32,53 | -1,58 | 1,0316 | -0,0206 | |||
| OGE / OGE Energy Corp. | 0,71 | 0,23 | 31,40 | -3,21 | 0,9959 | -0,0370 | |||
| HRB / H&R Block, Inc. | 0,56 | 1,27 | 30,81 | 1,24 | 0,9769 | 0,0083 | |||
| JEF / Jefferies Financial Group Inc. | 0,52 | 0,13 | 28,50 | 2,22 | 0,9037 | 0,0163 | |||
| TRGP / Targa Resources Corp. | 0,16 | -32,61 | 27,95 | -41,48 | 0,8863 | -0,6341 | |||
| EMN / Eastman Chemical Company | 0,35 | 26,21 | 0,8313 | 0,8313 | |||||
| GEL / Genesis Energy, L.P. - Limited Partnership | 1,49 | 20,79 | 25,65 | 32,64 | 0,8134 | 0,1978 | |||
| PAGP / Plains GP Holdings, L.P. - Limited Partnership | 1,17 | -18,06 | 22,81 | -25,46 | 0,7234 | -0,2508 | |||
| STAG / STAG Industrial, Inc. | 0,60 | -0,09 | 21,87 | 0,35 | 0,6935 | -0,0002 | |||
| OKE / ONEOK, Inc. | 0,25 | -30,76 | 20,50 | -43,03 | 0,6501 | -0,4954 | |||
| SOBO / South Bow Corporation | 0,75 | -8,68 | 19,34 | -7,29 | 0,6135 | -0,0507 | |||
| PBA / Pembina Pipeline Corporation | 0,51 | 15,93 | 19,09 | 8,63 | 0,6053 | 0,0460 | |||
| CAG / Conagra Brands, Inc. | 0,93 | -15,46 | 19,04 | -35,11 | 0,6037 | -0,3302 | |||
| DTM / DT Midstream, Inc. | 0,17 | -6,02 | 18,52 | 7,06 | 0,5872 | 0,0367 | |||
| KEYUF / Keyera Corp. | 0,55 | 27,35 | 17,95 | 33,76 | 0,5692 | 0,1420 | |||
| CEG / Constellation Energy Corporation | 0,04 | 4,64 | 12,32 | 67,50 | 0,3907 | 0,1566 | |||
| AMT / American Tower Corporation | 0,05 | 3,44 | 11,91 | 5,07 | 0,3777 | 0,0168 | |||
| CNP / CenterPoint Energy, Inc. | 0,30 | 2,75 | 11,06 | 4,20 | 0,3509 | 0,0129 | |||
| PPL / PPL Corporation | 0,32 | 2,84 | 10,82 | -3,49 | 0,3432 | -0,0137 | |||
| NI / NiSource Inc. | 0,26 | 3,64 | 10,32 | 4,28 | 0,3273 | 0,0122 | |||
| TMUS / T-Mobile US, Inc. | 0,04 | 1,14 | 9,59 | -9,65 | 0,3041 | -0,0337 | |||
| WM / Waste Management, Inc. | 0,04 | 2,45 | 8,91 | 1,25 | 0,2825 | 0,0024 | |||
| SRE / Sempra | 0,12 | 6,49 | 8,82 | 13,07 | 0,2796 | 0,0314 | |||
| NEE / NextEra Energy, Inc. | 0,12 | 3,73 | 8,65 | 1,59 | 0,2744 | 0,0032 | |||
| ATO / Atmos Energy Corporation | 0,05 | 3,48 | 8,25 | 3,17 | 0,2615 | 0,0071 | |||
| AEE / Ameren Corporation | 0,08 | 7,13 | 8,14 | 2,48 | 0,2583 | 0,0053 | |||
| GEI / Gibson Energy Inc. | 0,46 | 37,08 | 8,10 | 54,85 | 0,2568 | 0,0903 | |||
| DVY / iShares Trust - iShares Select Dividend ETF | 0,06 | -83,06 | 7,90 | -83,25 | 0,2506 | -1,2511 | |||
| ENFR / ALPS ETF Trust - Alerian Energy Infrastructure ETF | 0,24 | -23,12 | 7,68 | -24,37 | 0,2437 | -0,0797 | |||
| PEG / Public Service Enterprise Group Incorporated | 0,09 | 2,81 | 7,62 | 5,16 | 0,2415 | 0,0110 | |||
| MPC / Marathon Petroleum Corporation | 0,04 | 62,33 | 7,42 | 85,11 | 0,2353 | 0,1077 | |||
| T / AT&T Inc. | 0,25 | 2,48 | 7,15 | 4,87 | 0,2266 | 0,0097 | |||
| NGG / National Grid plc - Depositary Receipt (Common Stock) | 0,09 | 2,85 | 6,69 | 16,65 | 0,2122 | 0,0296 | |||
| CSX / CSX Corporation | 0,20 | 8,45 | 6,68 | 20,24 | 0,2118 | 0,0350 | |||
| UNP / Union Pacific Corporation | 0,03 | 0,96 | 5,93 | -1,67 | 0,1881 | -0,0039 | |||
| CQP / Cheniere Energy Partners, L.P. - Limited Partnership | 0,10 | 0,27 | 5,85 | -14,90 | 0,1856 | -0,0333 | |||
| XEL / Xcel Energy Inc. | 0,09 | 174,52 | 5,83 | 164,17 | 0,1847 | 0,1145 | |||
| AWK / American Water Works Company, Inc. | 0,04 | 3,81 | 5,42 | -2,11 | 0,1720 | -0,0044 | |||
| WCN / Waste Connections, Inc. | 0,03 | 19,85 | 5,33 | 14,66 | 0,1692 | 0,0211 | |||
| COP / ConocoPhillips | 0,06 | -6,72 | 5,05 | -20,29 | 0,1601 | -0,0415 | |||
| AR / Antero Resources Corporation | 0,13 | -7,66 | 5,04 | -8,03 | 0,1598 | -0,0146 | |||
| GPOR / Gulfport Energy Corporation | 0,02 | 84,38 | 4,90 | 101,48 | 0,1555 | 0,0780 | |||
| VST / Vistra Corp. | 0,02 | 5,73 | 4,47 | 74,52 | 0,1416 | 0,0601 | |||
| HES / Hess Corporation | 0,03 | -7,65 | 4,39 | -19,91 | 0,1391 | -0,0352 | |||
| SU / Suncor Energy Inc. | 0,11 | -7,70 | 4,00 | -10,72 | 0,1268 | -0,0158 | |||
| EQT / EQT Corporation | 0,07 | -7,68 | 3,88 | 0,78 | 0,1231 | 0,0005 | |||
| EQIX / Equinix, Inc. | 0,00 | 23,91 | 3,81 | 20,89 | 0,1208 | 0,0205 | |||
| KNTK / Kinetik Holdings Inc. | 0,08 | -48,03 | 3,58 | -55,92 | 0,1137 | -0,1452 | |||
| XOM / Exxon Mobil Corporation | 0,03 | -7,77 | 3,45 | -16,40 | 0,1093 | -0,0219 | |||
| OXY / Occidental Petroleum Corporation | 0,08 | -7,09 | 3,28 | -20,92 | 0,1041 | -0,0280 | |||
| RRC / Range Resources Corporation | 0,08 | -7,79 | 3,28 | -6,07 | 0,1040 | -0,0072 | |||
| SO / The Southern Company | 0,03 | 5,58 | 2,79 | 5,45 | 0,0883 | 0,0042 | |||
| AEP / American Electric Power Company, Inc. | 0,02 | 5,66 | 2,43 | 0,33 | 0,0771 | -0,0000 | |||
| UPS / United Parcel Service, Inc. | 0,02 | 5,01 | 2,27 | -3,60 | 0,0721 | -0,0030 | |||
| DUK / Duke Energy Corporation | 0,02 | 5,63 | 2,08 | 2,22 | 0,0658 | 0,0012 | |||
| D / Dominion Energy, Inc. | 0,04 | 6,82 | 2,04 | 7,67 | 0,0646 | 0,0044 | |||
| DTE / DTE Energy Company | 0,01 | 5,69 | 1,80 | 1,24 | 0,0571 | 0,0005 | |||
| WTTR / Select Water Solutions, Inc. | 0,21 | -7,09 | 1,78 | -23,55 | 0,0565 | -0,0177 | |||
| BKR / Baker Hughes Company | 0,04 | -7,71 | 1,68 | -19,50 | 0,0533 | -0,0132 | |||
| WEC / WEC Energy Group, Inc. | 0,02 | 5,67 | 1,60 | 1,08 | 0,0507 | 0,0003 | |||
| LNT / Alliant Energy Corporation | 0,02 | 5,56 | 1,50 | -0,80 | 0,0475 | -0,0006 | |||
| CVE / Cenovus Energy Inc. | 0,11 | -6,91 | 1,48 | -8,97 | 0,0470 | -0,0048 | |||
| LBRT / Liberty Energy Inc. | 0,12 | -7,68 | 1,34 | -33,07 | 0,0426 | -0,0213 | |||
| EVRG / Evergy, Inc. | 0,02 | 5,97 | 1,28 | 5,94 | 0,0407 | 0,0021 | |||
| CHRD / Chord Energy Corporation | 0,01 | -6,88 | 1,27 | -20,04 | 0,0403 | -0,0103 | |||
| VLO / Valero Energy Corporation | 0,01 | -6,63 | 1,23 | -5,00 | 0,0392 | -0,0022 | |||
| DINO / HF Sinclair Corporation | 0,03 | -6,20 | 1,20 | 17,20 | 0,0380 | 0,0055 | |||
| CTRA / Coterra Energy Inc. | 0,05 | -7,77 | 1,17 | -19,00 | 0,0371 | -0,0089 | |||
| AVGO / Broadcom Inc. | 0,00 | -15,28 | 1,14 | 39,51 | 0,0363 | 0,0102 | |||
| SM / SM Energy Company | 0,04 | -7,24 | 1,06 | -23,44 | 0,0335 | -0,0104 | |||
| PCG / PG&E Corporation | 0,08 | 6,79 | 1,05 | -13,34 | 0,0332 | -0,0053 | |||
| MDU / MDU Resources Group, Inc. | 0,06 | 5,63 | 0,99 | 4,10 | 0,0314 | 0,0011 | |||
| HAL / Halliburton Company | 0,05 | -6,91 | 0,97 | -25,23 | 0,0307 | -0,0105 | |||
| FTS / Fortis Inc. | 0,02 | 5,59 | 0,97 | 10,54 | 0,0306 | 0,0028 | |||
| CME / CME Group Inc. | 0,00 | 1,73 | 0,88 | 5,68 | 0,0278 | 0,0014 | |||
| OVV / Ovintiv Inc. | 0,02 | -7,73 | 0,88 | -17,99 | 0,0278 | -0,0062 | |||
| OGS / ONE Gas, Inc. | 0,01 | 5,68 | 0,85 | 0,47 | 0,0269 | 0,0000 | |||
| XLU / The Select Sector SPDR Trust - The Utilities Select Sector SPDR Fund | 0,01 | -67,46 | 0,84 | -66,29 | 0,0266 | -0,0526 | |||
| BKH / Black Hills Corporation | 0,01 | 5,59 | 0,76 | -2,44 | 0,0241 | -0,0007 | |||
| ES / Eversource Energy | 0,01 | 5,73 | 0,74 | 8,30 | 0,0236 | 0,0017 | |||
| CAH / Cardinal Health, Inc. | 0,00 | -5,99 | 0,68 | 14,75 | 0,0215 | 0,0027 | |||
| AES / The AES Corporation | 0,06 | -73,17 | 0,59 | -77,30 | 0,0186 | -0,0636 | |||
| RY / Royal Bank of Canada | 0,00 | -41,06 | 0,56 | -31,19 | 0,0176 | -0,0081 | |||
| RDN / Radian Group Inc. | 0,01 | -6,42 | 0,46 | 1,76 | 0,0147 | 0,0002 | |||
| NOMD / Nomad Foods Limited | 0,03 | 0,45 | 0,0142 | 0,0142 | |||||
| PFE / Pfizer Inc. | 0,02 | -4,39 | 0,39 | -8,62 | 0,0124 | -0,0012 | |||
| SON / Sonoco Products Company | 0,01 | -7,05 | 0,37 | -14,29 | 0,0118 | -0,0020 | |||
| OMC / Omnicom Group Inc. | 0,00 | -4,44 | 0,36 | -17,09 | 0,0114 | -0,0024 | |||
| TGT / Target Corporation | 0,00 | -4,38 | 0,28 | -9,71 | 0,0089 | -0,0010 | |||
| MAA / Mid-America Apartment Communities, Inc. | 0,00 | 31,29 | 0,27 | 16,24 | 0,0086 | 0,0012 | |||
| NTAP / NetApp, Inc. | 0,00 | 0,23 | 0,0072 | 0,0072 | |||||
| TSM / Taiwan Semiconductor Manufacturing Company Limited - Depositary Receipt (Common Stock) | 0,00 | 0,22 | 0,0070 | 0,0070 | |||||
| CPT / Camden Property Trust | 0,00 | 2,15 | 0,22 | -6,01 | 0,0070 | -0,0005 | |||
| EOG / EOG Resources, Inc. | 0,00 | -100,00 | 0,00 | 0,0000 | |||||
| IWD / iShares Trust - iShares Russell 1000 Value ETF | 0,00 | -100,00 | 0,00 | 0,0000 | |||||
| AESI / Atlas Energy Solutions Inc. | 0,00 | -100,00 | 0,00 | 0,0000 | |||||
| RHI / Robert Half Inc. | 0,00 | -100,00 | 0,00 | 0,0000 | |||||
| MRK / Merck & Co., Inc. | 0,00 | -100,00 | 0,00 | 0,0000 | |||||
| XLE / The Select Sector SPDR Trust - The Energy Select Sector SPDR Fund | 0,00 | -100,00 | 0,00 | 0,0000 | |||||
| AMLP / ALPS ETF Trust - Alerian MLP ETF | 0,00 | -100,00 | 0,00 | 0,0000 |