Grundlæggende statistik
| Institutionelle aktier (lange) | 75.716.909 - 79,68% (ex 13D/G) - change of -8,95MM shares -10,55% MRQ |
| Institutionel værdi (lang) | $ 5.732.791 USD ($1000) |
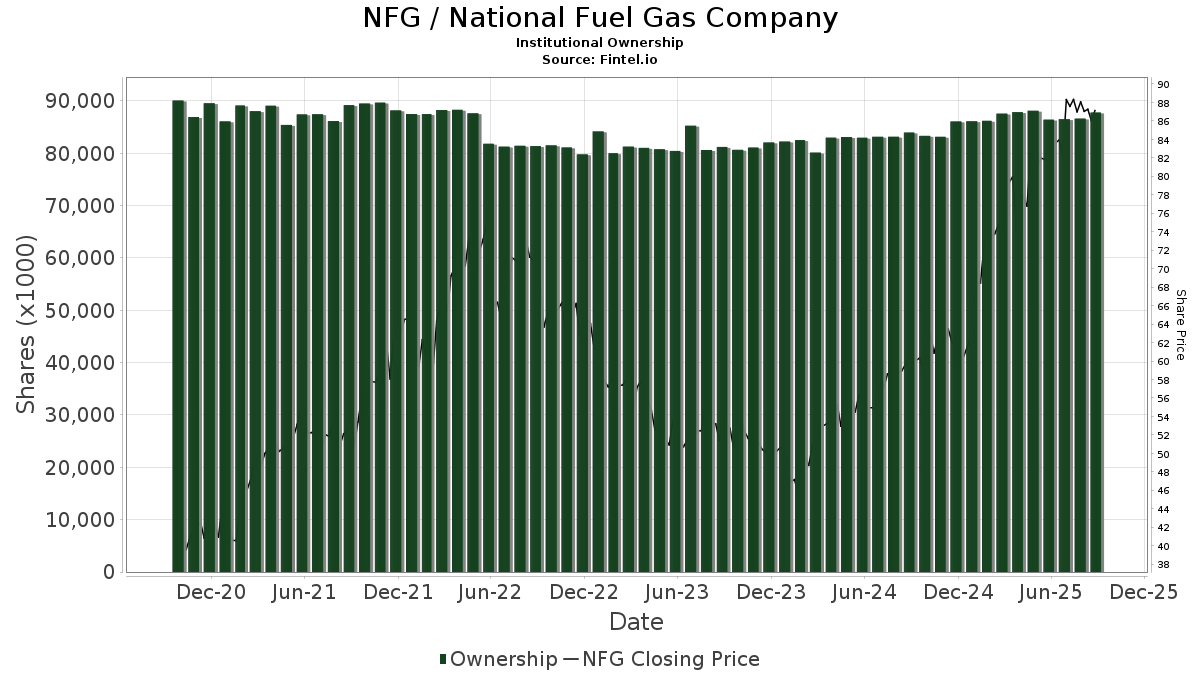
Institutionelt ejerskab og aktionærer
National Fuel Gas Company (US:NFG) har 634 institutionelle ejere og aktionærer, der har indsendt 13D/G- eller 13F-formularer til Securities Exchange Commission (SEC). Disse institutioner har i alt 75,716,909 aktier. Største aktionærer omfatter Vanguard Group Inc, BlackRock, Inc., State Street Corp, Energy Income Partners, LLC, Gabelli Funds Llc, Geode Capital Management, Llc, Lsv Asset Management, Aqr Capital Management Llc, Price T Rowe Associates Inc /md/, and Gamco Investors, Inc. Et Al .
National Fuel Gas Company (NYSE:NFG) institutionel ejerskabsstruktur viser aktuelle positioner i virksomheden efter institutioner og fonde, samt seneste ændringer i positionsstørrelse. Større aktionærer kan omfatte individuelle investorer, investeringsforeninger, hedgefonde eller institutioner. Skema 13D angiver, at investoren besidder (eller besidder) mere end 5 % af virksomheden og har til hensigt (eller har til hensigt at) aktivt at forfølge en ændring i forretningsstrategi. Skema 13G indikerer en passiv investering på over 5%.
The share price as of April 24, 2026 is 88,18 / share. Previously, on April 28, 2025, the share price was 78,35 / share. This represents an increase of 12,55% over that period.
Fondens stemningsscore
Fund Sentiment Score (fka Ownership Accumulation Score) finder de aktier, der bliver mest købt af fonde. Det er resultatet af en sofistikeret, multi-faktor kvantitativ model, der identificerer virksomheder med de højeste niveauer af institutionel akkumulering. Scoringsmodellen bruger en kombination af den samlede stigning i oplyste ejere, ændringerne i porteføljeallokeringer i disse ejere og andre målinger. Tallet går fra 0 til 100, hvor højere tal indikerer et højere niveau af akkumulering for sine jævnaldrende, og 50 er gennemsnittet.
Opdateringsfrekvens: Dagligt
Se Ownership Explorer, som giver en liste over højest rangerende virksomheder.
AI+ Ask Fintel’s AI assistant about National Fuel Gas Company.
Select a question to share a public post with an AI-crafted answer.
Thinking of good questions…
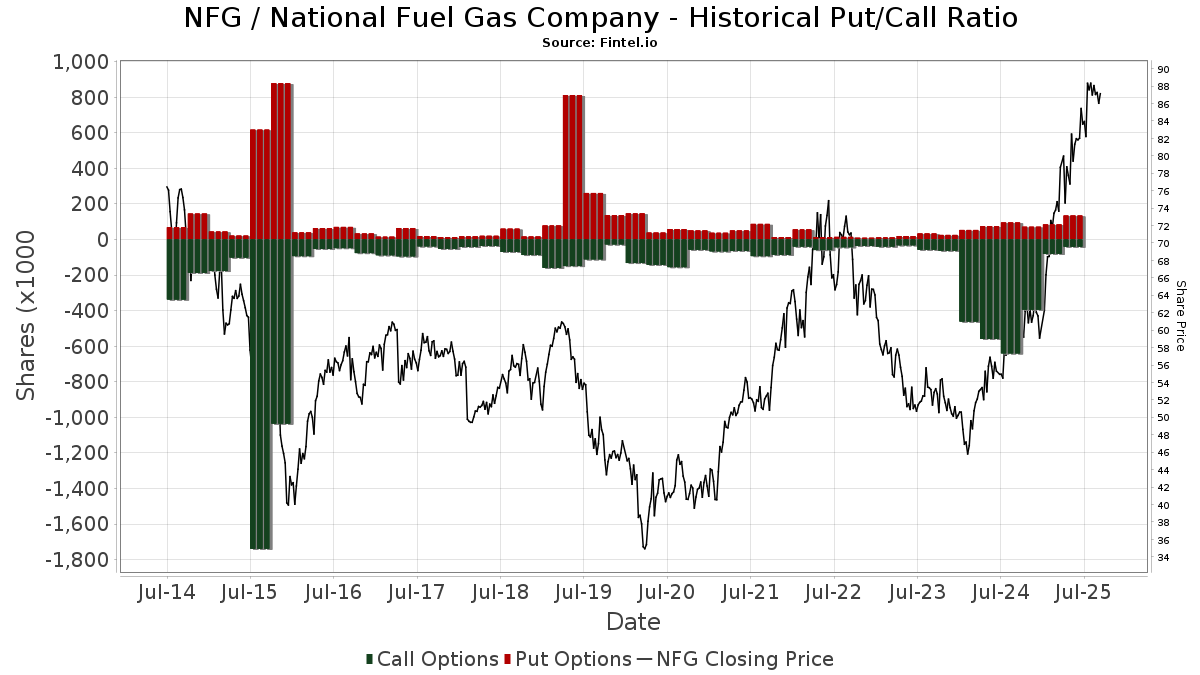
Institutionel Put/Call-forhold
Ud over at indberette standardaktie- og gældsudstedelser skal institutter med mere end 100 mill. aktiver under forvaltning også oplyse deres put- og call-optionsbeholdninger. Da salgsoptioner generelt indikerer negativ stemning, og købsoptioner indikerer positiv stemning, kan vi få en fornemmelse af den overordnede institutionelle stemning ved at plotte forholdet mellem put og kald. Diagrammet til højre viser det historiske put/call-forhold for dette instrument.
Brug af Put/Call Ratio som en indikator for investorernes stemning overvinder en af de vigtigste mangler ved at bruge totalt institutionelt ejerskab, som er, at en betydelig mængde af aktiver under forvaltning investeres passivt for at spore indekser. Passivt forvaltede fonde køber typisk ikke optioner, så indikatoren for put/call-forholdet følger mere nøje følelsen af aktivt forvaltede fonde.
13D/G-arkivering
Vi præsenterer 13D/G ansøgninger separat fra 13F ansøgninger på grund af den forskellige behandling af SEC. 13D/G-ansøgninger kan indgives af grupper af investorer (med én ledende), hvorimod 13F-ansøgninger ikke kan. Dette resulterer i situationer, hvor en investor kan indsende en 13D/G, der rapporterer én værdi for de samlede aktier (der repræsenterer alle de aktier, der ejes af investorgruppen), men derefter indsender en 13F, der rapporterer en anden værdi for de samlede aktier (der udelukkende repræsenterer deres egne) ejendomsret). Det betyder, at aktieejerskab af 13D/G-arkiver og 13F-arkiveringer ofte ikke er direkte sammenlignelige, så vi præsenterer dem separat.
Bemærk: Fra den 16. maj 2021 viser vi ikke længere ejere, der ikke har indsendt en 13D/G inden for det seneste år. Tidligere viste vi den fulde historie af 13D/G-arkiver. Generelt skal enheder, der er forpligtet til at indgive 13D/G-ansøgninger, indgive mindst årligt, før de indsender en afsluttende ansøgning. Dog forlader fonde nogle gange positioner uden at indsende en afsluttende ansøgning (dvs. de afvikler), så visning af den fulde historie resulterede nogle gange i forvirring om det nuværende ejerskab. For at undgå forvirring viser vi nu kun 'aktuelle' ejere - det vil sige - ejere, der har anmeldt inden for det seneste år.
Upgrade to unlock premium data.
| Fil dato | Form | Investor | Forrige Aktier |
Seneste Aktier |
Δ Aktier (Procent) |
Ejendomsret (Procent) |
Δ Ejerskab (Procent) |
|
|---|---|---|---|---|---|---|---|---|
| 2026-03-27 | VANGUARD GROUP INC | 13,208,477 | 0 | -100.00 | 0.00 | -100.00 |
13F og NPORT arkivering
Detaljer om 13F-arkivering er gratis. Detaljer om NP-ansøgninger kræver et premium-medlemskab. Grønne rækker angiver nye positioner. Røde rækker angiver lukkede positioner. Klik på linket ikon for at se den fulde transaktionshistorik.
Opgrader
for at låse premium-data op og eksportere til Excel ![]() .
.
| Fil dato | Kilde | Investor | Type | Gennemsnitlig pris (Øst) |
Aktier | Δ Aktier (%) |
Rapporteret Værdi ($1000) |
Δ Værdi (%) |
Port Alloc (%) |
|
|---|---|---|---|---|---|---|---|---|---|---|
| 2026-02-10 | 13F | Eurizon Capital SGR S.p.A. | 1.817 | 147 | ||||||
| 2026-04-15 | 13F | Hartford Financial Management Inc. | 7.066 | 0,00 | 664 | 17,35 | ||||
| 2026-04-17 | 13F | Nottingham Advisors, Inc. | 8.841 | 0,00 | 831 | 17,40 | ||||
| 2026-02-17 | 13F | Summit Global Investments | 25.518 | -49,36 | 2 | -50,00 | ||||
| 2026-02-17 | 13F | Wellington Management Group Llp | 24.617 | -54,15 | 1.971 | -60,27 | ||||
| 2026-04-24 | 13F | Root Financial Partners, LLC | 167 | 36,89 | 16 | 66,67 | ||||
| 2026-02-13 | 13F | Ontario Teachers Pension Plan Board | 0 | -100,00 | 0 | |||||
| 2026-04-23 | 13F | Folger Nolan Fleming Douglas Capital Management, Inc | 3.048 | 0,00 | 286 | 17,21 | ||||
| 2026-01-27 | 13F | WealthCollab, LLC | 62 | 0,00 | 5 | -20,00 | ||||
| 2026-02-13 | 13F | Williams Jones Wealth Management, LLC. | 7.635 | 611 | ||||||
| 2026-02-17 | 13F | Delaware Management Holdings, Inc. | 32.200 | 2.578 | ||||||
| 2025-11-04 | 13F | PAX Financial Group, LLC | 0 | -100,00 | 0 | |||||
| 2026-01-21 | 13F | Oak Thistle LLC | 0 | -100,00 | 0 | |||||
| 2026-04-16 | 13F | Capital Advisors, Ltd. LLC | 229 | 0,00 | 0 | |||||
| 2026-02-03 | 13F | SBI Securities Co., Ltd. | 761 | -9,51 | 61 | -22,08 | ||||
| 2026-02-13 | 13F | Prudential Financial Inc | 532.357 | 294,87 | 42.621 | 242,25 | ||||
| 2026-02-12 | 13F | Renaissance Technologies Llc | 21.300 | -85,93 | 1.705 | -87,81 | ||||
| 2026-02-13 | 13F | Caitong International Asset Management Co., Ltd | 146 | 12 | ||||||
| 2026-02-03 | 13F | NewEdge Wealth, LLC | 2.680 | 6,18 | 215 | 7,00 | ||||
| 2026-02-13 | 13F | Nicholas Investment Partners, LP | 11.942 | -60,80 | 956 | -66,01 | ||||
| 2026-02-02 | 13F | Nkcfo Llc | 0 | -100,00 | 0 | |||||
| 2026-02-13 | 13F | Manufacturers Life Insurance Company, The | 0 | -100,00 | 0 | |||||
| 2026-02-11 | 13F | Jpmorgan Chase & Co | 438.045 | 2,53 | 35.070 | -11,13 | ||||
| 2026-01-28 | 13F | WPG Advisers, LLC | 1.076 | -9,50 | 86 | -21,10 | ||||
| 2026-02-14 | 13F | Silver Grove Financial Group, Inc. | 2.800 | -12,50 | 224 | -24,07 | ||||
| 2026-04-08 | 13F | Cardinal Capital Management | 101.277 | 0,90 | 9.570 | 18,30 | ||||
| 2026-04-17 | 13F | Krilogy Financial LLC | 2.729 | 243 | ||||||
| 2026-01-30 | 13F | Mitsubishi UFJ Trust & Banking Corp | 53.762 | -10,12 | 4.304 | -22,09 | ||||
| 2026-04-06 | 13F | Highline Wealth Partners Llc | 106 | 1.225,00 | 10 | |||||
| 2026-02-09 | 13F | Keating Financial Advisory Services, Inc. | 29 | 2 | ||||||
| 2026-02-13 | 13F | FORA Capital, LLC | 10.574 | 805 | ||||||
| 2025-11-13 | 13F | Clear Street Markets Llc | 0 | -100,00 | 0 | |||||
| 2026-02-11 | 13F | Vaughan David Investments Inc/il | 0 | -100,00 | 0 | |||||
| 2026-04-24 | 13F | Key FInancial Inc | 23 | 0,00 | 2 | 100,00 | ||||
| 2025-11-14 | 13F | Wetherby Asset Management Inc | 3.253 | 21,88 | 300 | 32,74 | ||||
| 2026-02-09 | 13F | Putnam Fl Investment Management Co | 30.100 | -1,53 | 2.410 | -14,67 | ||||
| 2026-01-12 | 13F | Heartwood Wealth Advisors LLC | 0 | -100,00 | 0 | |||||
| 2026-02-17 | 13F | Schonfeld Strategic Advisors LLC | 0 | -100,00 | 0 | |||||
| 2026-04-20 | 13F | Hilton Head Capital Partners, LLC | 9 | 0,00 | 1 | |||||
| 2026-04-21 | 13F | Foster & Motley Inc | 79.631 | 6,55 | 7 | 40,00 | ||||
| 2026-02-13 | 13F | Verition Fund Management LLC | 71.183 | 67,50 | 5.699 | 45,17 | ||||
| 2026-02-17 | 13F | Shelton Capital Management | 3.014 | -7,09 | 241 | -19,40 | ||||
| 2026-02-12 | 13F | Principal Securities, Inc. | 11.184 | 23,95 | 895 | 7,44 | ||||
| 2026-01-27 | 13F | Zurcher Kantonalbank (Zurich Cantonalbank) | 25.311 | 2,48 | 2.026 | -11,18 | ||||
| 2026-04-20 | 13F | MBA Advisors LLC | 8.438 | -2,30 | 793 | 14,62 | ||||
| 2026-02-12 | 13F | South Dakota Investment Council | 26.748 | -6,63 | 2 | 0,00 | ||||
| 2026-04-15 | 13F | Radnor Capital Management, LLC | 18.432 | 0,00 | 1.732 | 17,36 | ||||
| 2026-02-12 | 13F | California Public Employees Retirement System | 217.383 | 3,88 | 17.404 | -9,96 | ||||
| 2026-04-24 | 13F | UMA Financial Services, Inc. | 21 | 0,00 | 2 | 0,00 | ||||
| 2026-02-17 | 13F | Millennium Management Llc | 110.706 | -44,91 | 8.863 | -52,25 | ||||
| 2026-01-23 | 13F | Sumitomo Mitsui Trust Holdings, Inc. | 0 | -100,00 | 0 | |||||
| 2026-02-17 | 13F | Energy Income Partners, LLC | 2.561.069 | 11,67 | 205.039 | -3,21 | ||||
| 2026-02-12 | 13F | Mcintyre Freedman & Flynn Investment Advisers Inc | 58.990 | -2,93 | 4.723 | -15,87 | ||||
| 2026-04-16 | 13F | BI Asset Management Fondsmaeglerselskab A/S | 63.440 | 6,05 | 6 | 25,00 | ||||
| 2026-04-10 | 13F | Linden Thomas Advisory Services, LLC | 20.660 | 4,53 | 1.941 | 22,69 | ||||
| 2026-04-20 | 13F | CWA Asset Management Group, LLC | 19.974 | 19,16 | 1.877 | 39,90 | ||||
| 2026-01-26 | 13F | Childress Capital Advisors, Llc | 5.389 | 47,40 | 431 | 27,89 | ||||
| 2026-02-04 | 13F | Oregon Public Employees Retirement Fund | 18.098 | -0,55 | 1.449 | -13,81 | ||||
| 2026-02-17 | 13F | Sherbrooke Park Advisers Llc | 0 | -100,00 | 0 | |||||
| 2026-04-15 | 13F | Exchange Traded Concepts, Llc | 239.704 | 14,86 | 22.523 | 34,81 | ||||
| 2026-01-30 | 13F | American Capital Advisory, LLC | 0 | -100,00 | 0 | |||||
| 2026-02-10 | 13F | Catalyst Capital Advisors LLC | 32.045 | 0,00 | 2.566 | -13,32 | ||||
| 2026-02-13 | 13F | Ieq Capital, Llc | 9.410 | -86,65 | 753 | -88,43 | ||||
| 2026-02-09 | 13F | Cary Street Partner Investment Advisory Llc | 82 | 182,76 | 7 | 200,00 | ||||
| 2026-02-17 | 13F | Advisory Services Network, LLC | 11.755 | -29,75 | 941 | -39,09 | ||||
| 2025-11-13 | 13F | Empowered Funds, LLC | 0 | -100,00 | 0 | -100,00 | ||||
| 2026-02-17 | 13F | Tower Research Capital LLC (TRC) | 2.587 | -16,14 | 207 | -27,11 | ||||
| 2026-04-27 | 13F | Truist Financial Corp | 9.517 | 25,04 | 894 | 46,80 | ||||
| 2026-02-12 | 13F | Keystone Financial Services | 3.012 | -0,03 | 241 | -13,31 | ||||
| 2026-02-05 | 13F | Gamco Investors, Inc. Et Al | 1.445.601 | 2,63 | 115.735 | -11,05 | ||||
| 2026-04-21 | 13F | Patton Albertson Miller Group, Llc | 3.596 | -0,66 | 338 | 16,61 | ||||
| 2026-04-27 | 13F | Citizens & Northern Corp | 4.012 | 0,00 | 377 | 17,13 | ||||
| 2026-02-13 | 13F | Morgan Stanley | 1.194.300 | 5,59 | 95.616 | -8,48 | ||||
| 2025-11-12 | 13F | CIBC Bancorp USA Inc. | 3.193 | 295 | ||||||
| 2026-02-13 | 13F | Golden State Wealth Management, LLC | 410 | 0,74 | 33 | -13,51 | ||||
| 2026-02-13 | 13F/A | Alberta Investment Management Corp | 0 | -100,00 | 0 | |||||
| 2026-02-05 | 13F | Allworth Financial LP | 4.122 | -32,29 | 330 | -41,46 | ||||
| 2026-02-12 | 13F | Founders Financial Alliance, LLC | 3.832 | 0,00 | 307 | -13,31 | ||||
| 2026-02-13 | 13F | Panagora Asset Management Inc | 310.810 | 43,15 | 24.883 | 24,07 | ||||
| 2026-02-10 | 13F | Quantbot Technologies LP | 0 | -100,00 | 0 | |||||
| 2025-11-13 | 13F | Capital Fund Management S.a. | 0 | -100,00 | 0 | |||||
| 2026-01-23 | 13F | Smith, Moore & Co. | 19.027 | 1,60 | 1.523 | -11,91 | ||||
| 2026-02-11 | 13F | Meeder Asset Management Inc | 20.890 | -77,70 | 1.672 | -80,67 | ||||
| 2026-02-13 | 13F | Aigen Investment Management, Lp | 0 | -100,00 | 0 | |||||
| 2026-04-14 | 13F | West Branch Capital LLC | 142 | 0,00 | 13 | 18,18 | ||||
| 2026-04-27 | 13F | New York State Teachers Retirement System | 87.564 | -18,08 | 8 | 0,00 | ||||
| 2026-02-13 | 13F | Brown Advisory Inc | 6.639 | 165,56 | 532 | 130,87 | ||||
| 2026-04-13 | 13F | IFP Advisors, Inc | 10.423 | 310,03 | 979 | 382,27 | ||||
| 2026-02-12 | 13F | JPL Wealth Management, LLC | 0 | -100,00 | 0 | |||||
| 2026-04-27 | 13F | New England Capital Financial Advisors LLC | 600 | 0,33 | 56 | 19,15 | ||||
| 2026-02-12 | 13F | New York State Common Retirement Fund | 54.194 | 29,17 | 4.339 | 11,95 | ||||
| 2026-02-18 | 13F | GWM Advisors LLC | 43.852 | 1,73 | 3.511 | -11,83 | ||||
| 2026-02-09 | 13F | Quest Partners LLC | 42.962 | 82,87 | 3.440 | 58,48 | ||||
| 2026-02-04 | 13F | Community Bank, N.A. | 1.800 | -73,53 | 144 | -77,07 | ||||
| 2026-02-09 | 13F | Geode Capital Management, Llc | 1.816.217 | 7,14 | 145.446 | -7,13 | ||||
| 2026-02-17 | 13F | Voloridge Investment Management, Llc | 73.045 | -68,66 | 5.848 | -72,84 | ||||
| 2026-02-17 | 13F | Public Employees Retirement System Of Ohio | 36.311 | -6,66 | 2.907 | -19,09 | ||||
| 2026-01-30 | 13F | Turning Point Benefit Group, Inc. | 4 | -20,00 | 0 | |||||
| 2026-02-10 | 13F | IAG Wealth Partners, LLC | 750 | 0,00 | 60 | -13,04 | ||||
| 2026-02-17 | 13F | Optiver Holding B.V. | 60 | -53,12 | 5 | -63,64 | ||||
| 2026-02-17 | 13F | RMB Capital Management, LLC | 2.818 | 227 | ||||||
| 2026-04-27 | 13F | Y-Intercept (Hong Kong) Ltd | 0 | -100,00 | 0 | |||||
| 2026-01-26 | 13F/A | Phocas Financial Corp. | 88.511 | 7.086 | ||||||
| 2026-02-02 | 13F | Montag A & Associates Inc | 14.178 | 0,00 | 1.142 | -13,22 | ||||
| 2026-02-10 | 13F | Sivia Capital Partners, LLC | 3.903 | -5,61 | 312 | -18,11 | ||||
| 2026-02-20 | 13F | Dorsey Wright & Associates | 0 | -100,00 | 0 | |||||
| 2026-02-06 | 13F | Leonteq Securities AG | 0 | -100,00 | 0 | |||||
| 2026-04-22 | 13F | Traphagen Investment Advisors Llc | 6.500 | 0,00 | 611 | 17,31 | ||||
| 2026-01-27 | 13F | TriaGen Wealth Management LLC | 0 | -100,00 | 0 | -100,00 | ||||
| 2026-04-07 | 13F | Carolina Wealth Advisors, LLC | 0 | -100,00 | 0 | |||||
| 2026-02-10 | 13F | Bank of New York Mellon Corp | 923.560 | -7,59 | 73.940 | -19,90 | ||||
| 2026-02-03 | 13F | We Are One Seven, LLC | 8.469 | -0,38 | 678 | -13,76 | ||||
| 2026-02-12 | 13F | Colonial Trust Co / SC | 82 | 0,00 | 7 | -14,29 | ||||
| 2026-02-13 | 13F | Neo Ivy Capital Management | 845 | 68 | ||||||
| 2026-02-05 | 13F | Stephens Inc /ar/ | 3.375 | -0,21 | 270 | -13,46 | ||||
| 2026-02-11 | 13F | Brandywine Global Investment Management, LLC | 58.681 | -0,90 | 4.698 | -14,10 | ||||
| 2026-02-13 | 13F | Icon Advisers Inc/co | 92.168 | -8,63 | 7.379 | -20,81 | ||||
| 2026-02-17 | 13F | Watershed Asset Management, L.L.C. | 4.228 | 338 | ||||||
| 2026-01-29 | 13F | Teachers Retirement System Of The State Of Kentucky | 28.441 | 0,00 | 2 | 0,00 | ||||
| 2026-02-13 | 13F | Wbi Investments, Inc. | 2.908 | 1,57 | 233 | -12,12 | ||||
| 2026-02-17 | 13F | Aster Capital Management (DIFC) Ltd | 0 | -100,00 | 0 | |||||
| 2026-02-11 | 13F | Picton Mahoney Asset Management | 4.501 | -77,44 | 360 | 35.900,00 | ||||
| 2026-02-17 | 13F | BTG Pactual Asset Management US LLC | 3.260 | 261 | ||||||
| 2026-02-13 | 13F | Kayne Anderson Capital Advisors Lp | 94.501 | -0,74 | 7.566 | -13,98 | ||||
| 2026-01-26 | 13F | Marion Wealth Management | 3.013 | 0,00 | 246 | -11,51 | ||||
| 2026-04-27 | 13F | Turtle Creek Wealth Advisors, LLC | 7.564 | 0,50 | 711 | 17,94 | ||||
| 2025-11-14 | 13F | Capstone Investment Advisors, Llc | 0 | -100,00 | 0 | |||||
| 2026-04-03 | 13F | Adirondack Trust Co | 275 | 0,00 | 26 | 13,64 | ||||
| 2026-01-23 | 13F | Halbert Hargrove Global Advisors, Llc | 0 | -100,00 | 0 | -100,00 | ||||
| 2026-02-17 | 13F | Jones Financial Companies Lllp | 4.186 | 24,84 | 335 | 6,69 | ||||
| 2025-11-07 | 13F | Beacon Capital Management, LLC | 0 | -100,00 | 0 | |||||
| 2026-02-17 | 13F | Brevan Howard Capital Management LP | 2.874 | -93,47 | 230 | -94,34 | ||||
| 2026-01-21 | 13F | Raleigh Capital Management Inc. | 1 | 0,00 | 0 | |||||
| 2026-02-12 | 13F | BRYN MAWR TRUST Co | 16.466 | 0,00 | 1.318 | -13,29 | ||||
| 2026-02-17 | 13F | Magnetar Financial LLC | 37.476 | 188,61 | 3.000 | 150,21 | ||||
| 2026-04-15 | 13F | Financial Management Professionals, Inc. | 378 | 0,53 | 36 | 16,67 | ||||
| 2026-01-28 | 13F | Teacher Retirement System Of Texas | 22.111 | -37,66 | 1.770 | -45,95 | ||||
| 2026-04-13 | 13F | Artemis Investment Management LLP | 0 | -100,00 | 0 | |||||
| 2026-04-13 | 13F | Hm Payson & Co | 366 | 0,00 | 34 | 17,24 | ||||
| 2026-02-13 | 13F | Change Path, LLC | 0 | -100,00 | 0 | |||||
| 2026-02-11 | 13F | Franklin Resources Inc | 243.215 | 14,11 | 19.472 | -1,10 | ||||
| 2025-11-14 | 13F | Wolverine Trading, Llc | 3.809 | 354 | ||||||
| 2026-04-15 | 13F | Spirit Of America Management Corp/ny | 4.650 | 8,14 | 437 | 26,74 | ||||
| 2026-04-10 | 13F | Country Trust Bank | 88 | 0,00 | 8 | 14,29 | ||||
| 2026-02-03 | 13F | Sequoia Financial Advisors, LLC | 7.497 | 0,89 | 600 | -12,54 | ||||
| 2026-02-10 | 13F | Principia Wealth Advisory, LLC | 1 | 0,00 | 0 | |||||
| 2026-02-11 | 13F | Rise Advisors, LLC | 0 | -100,00 | 0 | |||||
| 2026-04-16 | 13F | SG Americas Securities, LLC | 13.791 | -77,12 | 1 | -75,00 | ||||
| 2026-04-16 | 13F | Consolidated Planning Corp | 44.600 | 8,47 | 4.191 | 27,28 | ||||
| 2026-02-05 | 13F | Cambridge Investment Research Advisors, Inc. | 19.585 | 10,69 | 2 | 0,00 | ||||
| 2026-02-20 | 13F | Sunbelt Securities, Inc. | 10 | -37,50 | 1 | -100,00 | ||||
| 2026-02-05 | 13F | Thrivent Financial For Lutherans | 23.111 | 11,32 | 2 | 0,00 | ||||
| 2026-04-24 | 13F | CHICAGO TRUST Co NA | 5.048 | -33,52 | 474 | -21,91 | ||||
| 2026-02-12 | 13F | Rossby Financial, LCC | 15 | 25,00 | 1 | 0,00 | ||||
| 2026-01-30 | 13F | R Squared Ltd | 0 | -100,00 | 0 | |||||
| 2026-04-21 | 13F | Vise Technologies, Inc. | 5.791 | 0,00 | 464 | 0,00 | ||||
| 2026-04-21 | 13F | Financial Consulate, Inc | 1.203 | 1,01 | 113 | 18,95 | ||||
| 2026-02-04 | 13F | Virginia Retirement Systems Et Al | 321.220 | 0,60 | 25.717 | -12,81 | ||||
| 2026-02-13 | 13F | Barclays Plc | 70.258 | -45,87 | 5.625 | -53,09 | ||||
| 2026-02-20 | 13F | Kovitz Investment Group Partners, LLC | 24.806 | 1.986 | ||||||
| 2026-02-03 | 13F | Crossmark Global Holdings, Inc. | 8.077 | 0,29 | 647 | -13,06 | ||||
| 2026-02-11 | 13F | Illinois Municipal Retirement Fund | 29.625 | 53,51 | 2.372 | 33,05 | ||||
| 2026-01-27 | 13F | TD Waterhouse Canada Inc. | 2.732 | -91,45 | 219 | -92,63 | ||||
| 2026-02-26 | 13F | Anchor Investment Management, LLC | 1.400 | 0,00 | 112 | -13,18 | ||||
| 2026-04-09 | 13F | Generali Investments, Management Co LLC | 0 | -100,00 | 0 | |||||
| 2026-04-27 | 13F | Burford Brothers, Inc. | 12.495 | 1.174 | ||||||
| 2026-01-23 | 13F | Legacy Bridge, LLC | 17.927 | 0,74 | 1.435 | -12,66 | ||||
| 2026-02-10 | 13F | Peak Retirement Planning, Inc. | 5.064 | 0,64 | 405 | -12,72 | ||||
| 2026-02-17 | 13F | Captrust Financial Advisors | 58.965 | 240,68 | 4.721 | 195,37 | ||||
| 2026-02-17 | 13F | Ibex Wealth Advisors | 87.554 | 1,20 | 7.010 | -12,29 | ||||
| 2026-02-04 | 13F | Swiss Life Asset Management Ltd | 6.701 | 65,58 | 536 | 43,70 | ||||
| 2026-02-17 | 13F | Greenland Capital Management LP | 14.000 | -17,56 | 1.121 | -28,57 | ||||
| 2026-02-12 | 13F | Federated Hermes, Inc. | 13.655 | -6,96 | 1.093 | -19,34 | ||||
| 2026-02-17 | 13F | Gotham Asset Management, LLC | 496.762 | -4,82 | 39.771 | -17,51 | ||||
| 2026-04-22 | 13F | Cantor Fitzgerald Investment Adviser L.p. | 50.974 | -0,10 | 4.790 | 17,23 | ||||
| 2026-01-28 | 13F | Klp Kapitalforvaltning As | 46.800 | 4,70 | 3.768 | -9,18 | ||||
| 2026-01-21 | 13F | New Wave Wealth Advisors Llc | 4.093 | 4,49 | 330 | -9,37 | ||||
| 2026-02-12 | 13F | Ci Investments Inc. | 0 | -100,00 | 0 | |||||
| 2026-02-02 | 13F | Benjamin Edwards Inc | 4.429 | 0,75 | 355 | -12,59 | ||||
| 2026-04-21 | 13F | Fruth Investment Management | 2.200 | 0 | ||||||
| 2026-02-17 | 13F | Farringdon Capital, Ltd. | 0 | -100,00 | 0 | |||||
| 2026-01-29 | 13F | State Of Michigan Retirement System | 21.312 | -0,93 | 1.706 | -14,14 | ||||
| 2026-04-27 | 13F | Greenleaf Trust | 2.944 | 0,55 | 277 | 17,95 | ||||
| 2026-04-21 | 13F | Red Tortoise LLC | 74 | 0,00 | 7 | 20,00 | ||||
| 2026-02-17 | 13F | Citadel Advisors Llc | Call | 17.000 | -32,00 | 1.361 | -41,06 | |||
| 2026-04-13 | 13F | True Wealth Design, LLC | 172 | -35,82 | 16 | -23,81 | ||||
| 2026-02-17 | 13F | Citadel Advisors Llc | 5.905 | 473 | ||||||
| 2026-01-23 | 13F | Inlight Wealth Management, LLC | 500 | 0,00 | 40 | -13,04 | ||||
| 2026-02-17 | 13F | Citadel Advisors Llc | Put | 5.200 | -91,17 | 416 | -92,35 | |||
| 2026-02-10 | 13F | Nomura Asset Management Co Ltd | 930 | 0,00 | 74 | -12,94 | ||||
| 2026-02-09 | 13F | Investors Portfolio Services LLC | 27 | 2 | ||||||
| 2026-01-29 | 13F | Managed Asset Portfolios, Llc | 380.797 | -0,07 | 30.487 | -13,39 | ||||
| 2026-04-21 | 13F | Aull & Monroe Investment Management Corp | 15.233 | -0,10 | 1.431 | 17,30 | ||||
| 2026-03-09 | 13F | EMC Capital Management | 3.323 | -15,01 | 0 | |||||
| 2026-01-27 | 13F | Regions Financial Corp | 5.068 | 406 | ||||||
| 2026-02-13 | 13F | Johnson Investment Counsel Inc | 0 | -100,00 | 0 | |||||
| 2026-04-14 | 13F | Zrc Wealth Management, Llc | 8 | 1 | ||||||
| 2026-02-12 | 13F | Loomis Sayles & Co L P | 12.413 | 0,00 | 994 | -13,35 | ||||
| 2026-02-13 | 13F | Focused Alpha, Llc | 4.641 | 372 | ||||||
| 2025-11-14 | 13F | SummitTX Capital, L.P. | 0 | -100,00 | 0 | |||||
| 2025-11-14 | 13F | Centiva Capital, LP | 0 | -100,00 | 0 | |||||
| 2026-04-27 | 13F | Qrg Capital Management, Inc. | 5.713 | 36,84 | 537 | 60,48 | ||||
| 2026-02-03 | 13F | Bokf, Na | 37.529 | -4,64 | 3.005 | -17,36 | ||||
| 2026-02-11 | 13F | Los Angeles Capital Management Llc | 191.157 | -14,02 | 15.163 | -26,17 | ||||
| 2026-02-17 | 13F | Wiley Bros.-aintree Capital, Llc | 20.320 | 4,41 | 1.627 | -9,52 | ||||
| 2026-01-29 | 13F | Quent Capital, LLC | 1.602 | -0,31 | 128 | -13,51 | ||||
| 2026-02-13 | 13F | Epoch Investment Partners, Inc. | 0 | -100,00 | 0 | |||||
| 2026-01-30 | 13F | Canandaigua National Bank & Trust Co | 0 | -100,00 | 0 | |||||
| 2025-11-14 | 13F | Binnacle Investments Inc | 129 | 0,00 | 12 | 10,00 | ||||
| 2026-04-24 | 13F | Optas, LLC | 3.238 | 5,30 | 304 | 23,58 | ||||
| 2026-02-09 | 13F | Knights of Columbus Asset Advisors LLC | 132.779 | -14,49 | 10.630 | -25,89 | ||||
| 2026-04-27 | 13F | HB Wealth Management, LLC | 3.150 | 2,21 | 296 | 20,33 | ||||
| 2026-04-20 | 13F | Courier Capital Llc | 4.688 | -32,15 | 441 | -20,43 | ||||
| 2026-02-13 | 13F | Kestra Advisory Services, LLC | 0 | -100,00 | 0 | |||||
| 2026-02-11 | 13F | Gwn Securities Inc. | 7.278 | 583 | ||||||
| 2026-02-17 | 13F | Susquehanna International Group, Llp | Put | 6.300 | -3,08 | 504 | -16,00 | |||
| 2026-01-26 | 13F | Greenwood Capital Associates Llc | 6.014 | -1,72 | 481 | -14,87 | ||||
| 2026-02-17 | 13F | Susquehanna International Group, Llp | Call | 12.500 | 27,55 | 1.001 | 10,50 | |||
| 2026-02-17 | 13F | Westwood Holdings Group Inc | 366.629 | 47,22 | 29.352 | 27,60 | ||||
| 2026-02-17 | 13F | Susquehanna International Group, Llp | 17.378 | -63,96 | 1.391 | -68,76 | ||||
| 2026-04-14 | 13F | Beacon Investment Advisory Services, Inc. | 1.600 | 150 | ||||||
| 2026-02-11 | 13F | Twin Tree Management, LP | 0 | -100,00 | 0 | |||||
| 2026-04-17 | 13F | AdvisorNet Financial, Inc | 6 | 0,00 | 1 | |||||
| 2026-01-29 | 13F | Comerica Bank | 28.674 | -7,39 | 2.296 | -19,76 | ||||
| 2026-02-13 | 13F | Walleye Capital LLC | Call | 900 | -10,00 | 72 | -21,74 | |||
| 2026-04-24 | 13F | Yousif Capital Management, Llc | 28.986 | 0,73 | 2.724 | 17,02 | ||||
| 2026-02-05 | 13F | Arbejdsmarkedets Tillaegspension | 284.027 | 22.739 | ||||||
| 2026-02-13 | 13F | Walleye Capital LLC | Put | 2.100 | -75,86 | 168 | -79,08 | |||
| 2026-02-10 | 13F | CIBC World Markets Inc. | 0 | -100,00 | 0 | |||||
| 2026-02-13 | 13F | Walleye Capital LLC | 2.086 | 207,22 | 167 | 169,35 | ||||
| 2026-02-09 | 13F | Harbour Investments, Inc. | 545 | -12,24 | 44 | -24,56 | ||||
| 2025-10-27 | 13F | Kiker Wealth Management, LLC | 0 | -100,00 | 0 | |||||
| 2026-02-02 | 13F | Danske Bank A/s | 27.841 | -16,38 | 2.229 | -27,54 | ||||
| 2026-02-13 | 13F | Parkside Financial Bank & Trust | 4.343 | -0,05 | 348 | -13,47 | ||||
| 2026-02-02 | 13F | Vawter Financial, Ltd. | 2.725 | 0,00 | 218 | -13,15 | ||||
| 2026-02-11 | 13F | Vestor Capital, Llc | 963 | 13,29 | 0 | |||||
| 2026-04-20 | 13F | State of Alaska, Department of Revenue | 106.074 | 0,38 | 10 | 12,50 | ||||
| 2026-02-11 | 13F | Simplex Trading, Llc | 0 | -100,00 | 0 | |||||
| 2026-02-18 | 13F | EP Wealth Advisors, Inc. | 6.610 | -15,79 | 529 | -20,33 | ||||
| 2026-01-28 | 13F | Universal- Beteiligungs- und Servicegesellschaft mbH | 87.673 | 13,59 | 7.032 | -1,36 | ||||
| 2026-02-06 | 13F | Resona Asset Management Co.,Ltd. | 4.807 | 10,61 | 385 | -4,24 | ||||
| 2026-01-21 | 13F | Newbridge Financial Services Group, Inc. | 0 | 0 | ||||||
| 2026-02-13 | 13F | Public Employees Retirement Association Of Colorado | 7.197 | 0,00 | 1 | |||||
| 2026-02-17 | 13F | Point72 Asset Management, L.P. | 0 | -100,00 | 0 | -100,00 | ||||
| 2026-04-13 | 13F | Creative Financial Designs Inc /adv | 2.103 | -3,22 | 198 | 13,87 | ||||
| 2026-02-13 | 13F | Smartleaf Asset Management LLC | 1.053 | 0,29 | 86 | -12,37 | ||||
| 2026-02-18 | 13F | Mackenzie Financial Corp | 417.769 | -30,14 | 33.864 | -38,69 | ||||
| 2025-11-06 | 13F | Navellier & Associates Inc | 0 | -100,00 | 0 | |||||
| 2026-02-17 | 13F | Guggenheim Capital Llc | 6.402 | -3,23 | 513 | -16,20 | ||||
| 2026-02-06 | 13F | Pnc Financial Services Group, Inc. | 40.289 | -29,18 | 3.226 | -38,62 | ||||
| 2026-02-17 | 13F | Zurich Insurance Group Ltd/FI | 20.500 | 0,00 | 1.641 | -13,31 | ||||
| 2025-11-14 | 13F | Point72 Hong Kong Ltd | 1.294 | -95,46 | 120 | -95,07 | ||||
| 2026-02-11 | 13F | Deutsche Bank Ag\ | 12.190 | 12,25 | 976 | -2,79 | ||||
| 2026-04-20 | 13F | MBM Wealth Consultants, LLC | 200 | 19 | ||||||
| 2026-02-05 | 13F | Amalgamated Bank | 40.032 | -5,20 | 3 | 0,00 | ||||
| 2026-02-17 | 13F | Russell Investments Group, Ltd. | 37.902 | -18,94 | 3.034 | -29,75 | ||||
| 2026-02-13 | 13F | Macquarie Group Ltd | 0 | -100,00 | 0 | |||||
| 2026-02-04 | 13F | Pacer Advisors, Inc. | 0 | -100,00 | 0 | -100,00 | ||||
| 2026-02-12 | 13F | Ensign Peak Advisors, Inc | 31.477 | -36,37 | 2.520 | -44,85 | ||||
| 2026-02-17 | 13F | Mercer Global Advisors Inc /adv | 35.502 | -30,79 | 2.842 | -40,02 | ||||
| 2026-01-16 | 13F | Marquette Asset Management, LLC | 0 | -100,00 | 0 | |||||
| 2026-02-11 | 13F | Fox Run Management, L.l.c. | 8.332 | 667 | ||||||
| 2026-01-28 | 13F | Migdal Insurance & Financial Holdings Ltd. | 238 | 0 | ||||||
| 2026-02-11 | 13F | O'shaughnessy Asset Management, Llc | 26.138 | -7,90 | 2.093 | -20,18 | ||||
| 2026-02-13 | 13F | JustInvest LLC | 16.378 | -6,60 | 1.311 | -19,02 | ||||
| 2026-02-10 | 13F | Envestnet Asset Management Inc | 245.909 | 7,80 | 19.687 | -6,57 | ||||
| 2026-02-17 | 13F | Glenmede Trust Co Na | 52.271 | -2,90 | 4.185 | -1,85 | ||||
| 2025-11-14 | 13F | Wolverine Trading, Llc | Call | 3.900 | -15,22 | 363 | -7,18 | |||
| 2026-02-17 | 13F | Lazard Asset Management Llc | 57.259 | 45,76 | 4.584 | 26,35 | ||||
| 2026-04-20 | 13F | Louisiana State Employees Retirement System | 27.600 | 10,40 | 2.593 | 29,59 | ||||
| 2026-04-23 | 13F | Farmers & Merchants Investments Inc | 492 | 0,61 | 46 | 17,95 | ||||
| 2026-02-18 | 13F | State of Tennessee, Treasury Department | 35.200 | -15,00 | 2.948 | -22,93 | ||||
| 2026-02-05 | 13F | Applied Finance Capital Management, LLC | 3.243 | 260 | ||||||
| 2026-02-05 | 13F | Chase Investment Counsel Corp | 72.777 | -0,09 | 6 | -16,67 | ||||
| 2026-02-13 | 13F | Ubs Asset Management Americas Inc | 169.500 | -21,76 | 13.570 | -32,18 | ||||
| 2026-02-06 | 13F | Bare Financial Services, Inc | 119 | 170,45 | 10 | 125,00 | ||||
| 2026-02-17 | 13F | Freestone Grove Partners LP | 5.079 | 407 | ||||||
| 2026-04-02 | 13F | Ares Financial Consulting, LLC | 1.030 | 0,00 | 96 | 15,85 | ||||
| 2026-04-10 | 13F | Armstrong Advisory Group, Inc | 100 | 0,00 | 9 | 12,50 | ||||
| 2026-02-17 | 13F | Maryland State Retirement & Pension System | 4.956 | 0,00 | 397 | -13,35 | ||||
| 2026-02-13 | 13F | Dynamic Technology Lab Private Ltd | 23.260 | 1.862 | ||||||
| 2026-02-17 | 13F | Mangrove Partners | 2.540 | 203 | ||||||
| 2026-04-23 | 13F | Private Wealth Management Group, LLC | 188 | -11,74 | 18 | 0,00 | ||||
| 2026-02-10 | 13F | Basepoint Wealth LLC | 157 | 13 | ||||||
| 2026-02-05 | 13F | Northwestern Mutual Investment Management Company, Llc | 20.218 | 0,38 | 1.619 | -13,01 | ||||
| 2026-01-30 | 13F | Laurel Wealth Advisors LLC | 50 | 4 | ||||||
| 2026-01-29 | 13F | Ashton Thomas Private Wealth, LLC | 0 | -100,00 | 0 | |||||
| 2026-04-23 | 13F | J.w. Cole Advisors, Inc. | 0 | -100,00 | 0 | |||||
| 2026-02-10 | 13F | Norges Bank | 1.154.321 | 92.415 | ||||||
| 2026-02-17 | 13F | Private Capital Management, LLC | 5.300 | 424 | ||||||
| 2026-02-12 | 13F | Equity Investment Corp | 1.027.278 | -1,51 | 82.244 | -14,63 | ||||
| 2026-02-13 | 13F | Quarry LP | 0 | -100,00 | 0 | |||||
| 2026-04-20 | 13F | Jfs Wealth Advisors, Llc | 3.450 | -0,20 | 326 | 17,75 | ||||
| 2026-02-12 | 13F | State Board Of Administration Of Florida Retirement System | 92.164 | 0,00 | 7.379 | -13,33 | ||||
| 2026-04-15 | 13F | Cranbrook Wealth Management, LLC | 506 | 0,00 | 48 | 17,50 | ||||
| 2026-02-10 | 13F | State of Wyoming | 1.556 | -44,67 | 125 | -52,12 | ||||
| 2026-02-10 | 13F | Goldman Sachs Group Inc | 88.048 | -15,99 | 7.049 | -27,18 | ||||
| 2026-02-13 | 13F | Great West Life Assurance Co /can/ | 52.070 | -0,58 | 4 | 0,00 | ||||
| 2026-04-07 | 13F | First Financial Corp /in/ | 100 | 0,00 | 9 | 12,50 | ||||
| 2026-01-23 | 13F | Optima Capital Llc | 6 | 0 | ||||||
| 2026-02-13 | 13F | Inspire Advisors, LLC | 8.249 | -42,60 | 660 | -50,26 | ||||
| 2026-02-11 | 13F | Allianz Asset Management GmbH | 134.575 | 32,71 | 10.774 | 15,03 | ||||
| 2026-02-12 | 13F | Xponance, Inc. | 8.211 | -17,60 | 657 | -28,59 | ||||
| 2026-01-22 | 13F | Northcape Wealth Management, Llc | 3.513 | 0,00 | 281 | -13,27 | ||||
| 2026-02-13 | 13F | MAI Capital Management | 5.095 | -17,85 | 408 | -28,85 | ||||
| 2026-02-17 | 13F | Cape Investment Advisory, Inc. | 25 | 2 | ||||||
| 2026-04-23 | 13F | Harbor Investment Advisory, Llc | 53 | -14,52 | 5 | 0,00 | ||||
| 2026-02-19 | 13F | Invesco Ltd. | 1.258.605 | 12,67 | 100.764 | -2,34 | ||||
| 2025-11-14 | 13F | EAM Investors, LLC | 0 | -100,00 | 0 | |||||
| 2026-04-08 | 13F | Wealth Enhancement Trust Services, Inc. | 5 | 0,00 | 0 | |||||
| 2026-04-27 | 13F | Oxbow Advisors, LLC | 59.954 | 5.633 | ||||||
| 2026-02-12 | 13F | Caerus Investment Advisors, LLC | 0 | -100,00 | 0 | |||||
| 2026-04-17 | 13F | Kentucky Trust Co | 420 | 0,00 | 39 | 18,18 | ||||
| 2025-11-06 | 13F | Financial Advocates Investment Management | 0 | -100,00 | 0 | -100,00 | ||||
| 2026-02-17 | 13F | Creative Planning | 43.275 | -15,72 | 3.465 | -26,97 | ||||
| 2026-02-09 | 13F | Atlantic Trust, LLC | 0 | -100,00 | 0 | |||||
| 2026-02-11 | 13F | Simplex Trading, Llc | Put | 900 | -47,06 | 72 | ||||
| 2026-02-11 | 13F | Simplex Trading, Llc | Call | 8.300 | 33,87 | 664 | ||||
| 2026-02-17 | 13F | Algert Global Llc | 30.676 | -84,36 | 2 | -88,89 | ||||
| 2026-02-09 | 13F | Genus Capital Management Inc. | 21.460 | -19,81 | 1.718 | -30,47 | ||||
| 2026-02-17 | 13F | Laird Norton Trust Company, Llc | 3.563 | 287 | ||||||
| 2026-04-07 | 13F | Central Pacific Bank - Trust Division | 16.200 | 0,00 | 1.522 | 17,44 | ||||
| 2026-04-13 | 13F | Mather Group, Llc. | 64 | 6 | ||||||
| 2026-02-03 | 13F | Mitsubishi UFJ Kokusai Asset Management Co., Ltd. | 124 | 0,00 | 10 | -9,09 | ||||
| 2026-04-16 | 13F | Allegheny Financial Group LTD | 5.147 | 0,61 | 484 | 18,09 | ||||
| 2026-02-10 | 13F/A | Northwestern Mutual Wealth Management Co | 1.381 | -11,36 | 111 | -23,08 | ||||
| 2026-03-04 | 13F | SHP Wealth Management | 550 | 44 | ||||||
| 2026-04-15 | 13F | Valley National Advisers Inc | 700 | 0,00 | 0 | |||||
| 2026-01-12 | 13F | Rialto Wealth Management, LLC | 3 | 0,00 | 0 | |||||
| 2026-02-09 | 13F | Bleakley Financial Group, LLC | 62.971 | 2,50 | 5.041 | -11,16 | ||||
| 2026-02-05 | 13F | Center for Financial Planning, Inc. | 255 | 27,50 | 20 | 11,11 | ||||
| 2026-04-27 | 13F | Counterpoint Mutual Funds LLC | 0 | -100,00 | 0 | |||||
| 2025-11-12 | 13F | Cobblestone Capital Advisors Llc /ny/ | 46.143 | 0,00 | 4.262 | 9,06 | ||||
| 2026-02-17 | 13F | Utah Retirement Systems | 4.788 | 0,00 | 383 | -13,35 | ||||
| 2026-04-15 | 13F | Journey Strategic Wealth Llc | 3.287 | -2,90 | 309 | 13,65 | ||||
| 2026-02-13 | 13F | Walleye Trading LLC | Call | 3.200 | 28,00 | 256 | 11,30 | |||
| 2026-02-13 | 13F | Walleye Trading LLC | Put | 1.800 | -82,69 | 144 | -85,00 | |||
| 2026-02-17 | 13F | Harvest Investment Services, LLC | 15.483 | 72,82 | 1.240 | 49,82 | ||||
| 2026-04-23 | 13F | Oppenheimer Asset Management Inc. | 91.951 | -1,02 | 8.640 | 16,16 | ||||
| 2026-02-12 | 13F | Jane Street Group, Llc | Call | 6.500 | -85,09 | 520 | -87,09 | |||
| 2026-04-06 | 13F | Old Port Advisors | 31.127 | 1,48 | 2.925 | 19,10 | ||||
| 2026-02-12 | 13F | Jane Street Group, Llc | 4.734 | -92,52 | 379 | -93,51 | ||||
| 2026-02-12 | 13F | Jane Street Group, Llc | Put | 2.500 | 200 | |||||
| 2026-02-11 | 13F | TCTC Holdings, LLC | 469 | 0,00 | 38 | -13,95 | ||||
| 2026-02-17 | 13F | Jump Financial, LLC | 6.212 | 46,86 | 497 | 27,44 | ||||
| 2025-11-14 | 13F | AXA Investment Managers S.A. | 19.175 | 1.771 | ||||||
| 2025-11-14 | 13F | Point72 (DIFC) Ltd | 1.761 | -75,79 | 163 | -73,70 | ||||
| 2026-04-23 | 13F | CWM Advisors, LLC | 3.465 | 5,29 | 326 | 23,57 | ||||
| 2026-02-13 | 13F | Kilter Group LLC | 19 | 0,00 | 2 | 0,00 | ||||
| 2026-02-10 | 13F | CFS Investment Advisory Services, LLC | 4.337 | -0,02 | 347 | -1,98 | ||||
| 2025-11-14 | 13F | Mount Yale Investment Advisors, LLC | 0 | -100,00 | 0 | |||||
| 2026-02-17 | 13F | Warren Averett Asset Management, LLC | 0 | -100,00 | 0 | |||||
| 2026-04-20 | 13F | Sowell Financial Services LLC | 2.136 | -19,43 | 201 | -5,66 | ||||
| 2026-02-13 | 13F | Colony Group, LLC | 18.824 | -11,24 | 1.576 | -19,51 | ||||
| 2026-01-27 | 13F | Brighton Jones Llc | 0 | -100,00 | 0 | |||||
| 2026-02-14 | 13F | Rockefeller Capital Management L.P. | 22.691 | 190,91 | 1.817 | 152,22 | ||||
| 2026-02-17 | 13F | Credit Agricole S A | 15.000 | 1.201 | ||||||
| 2026-01-26 | 13F | Cwm, Llc | 80.294 | -29,61 | 6 | -40,00 | ||||
| 2026-02-11 | 13F | Cerity Partners LLC | 55.744 | -23,69 | 4.463 | -33,87 | ||||
| 2026-02-17 | 13F | Aventail Capital Group, LP | 1.090.380 | 148,30 | 87.296 | 115,21 | ||||
| 2026-02-17 | 13F | Dark Forest Capital Management Lp | 52.570 | 91,56 | 4.209 | 66,06 | ||||
| 2026-04-09 | 13F | Kwmg, Llc | 97.232 | 1,45 | 9.136 | 19,05 | ||||
| 2026-02-09 | 13F | Huntington National Bank | 3.898 | -0,28 | 312 | -13,57 | ||||
| 2026-04-17 | 13F | Buffalo Business & Estate Services Ltd | 2.619 | 2,18 | 246 | 20,00 | ||||
| 2026-02-17 | 13F | Css Llc/il | 8.864 | 63,12 | 710 | 41,52 | ||||
| 2026-04-07 | 13F | Sage Capital Advisors,llc | 20.219 | 0,12 | 1.900 | 17,51 | ||||
| 2026-02-13 | 13F | Neuberger Berman Group LLC | 78.232 | 15,58 | 6.263 | 0,19 | ||||
| 2026-01-30 | 13F | State of New Jersey Common Pension Fund D | 26.520 | 8,94 | 2.123 | -5,56 | ||||
| 2026-01-29 | 13F | Vanguard Group Inc | 12.170.906 | -0,49 | 974.403 | -13,75 | ||||
| 2026-02-13 | 13F | Entropy Technologies, LP | 8.692 | 696 | ||||||
| 2026-04-17 | 13F | A. D. Beadell Investment Counsel, Inc. | 4.235 | 14,46 | 0 | |||||
| 2026-04-17 | 13F | HHM Wealth Advisors, LLC | 855 | 0,00 | 80 | 17,65 | ||||
| 2026-02-12 | 13F/A | Pinebridge Investments Llc | 14.045 | 1.124 | ||||||
| 2025-11-14 | 13F | PineBridge Investments, L.P. | 25.408 | -66,73 | 2.347 | -63,73 | ||||
| 2026-04-06 | 13F | Versant Capital Management, Inc | 460 | 83,27 | 43 | 115,00 | ||||
| 2026-02-13 | 13F | Rhumbline Advisers | 230.387 | -5,41 | 18.445 | -18,02 | ||||
| 2026-02-05 | 13F | AlphaCore Capital LLC | 6.417 | 25,80 | 514 | 8,23 | ||||
| 2025-11-14 | 13F | National Bank Of Canada /fi/ | 0 | -100,00 | 0 | |||||
| 2026-02-13 | 13F | Toroso Investments, LLC | 18.128 | -5,71 | 1.451 | -18,25 | ||||
| 2026-02-17 | 13F | Man Group plc | 150.964 | 227,14 | 12.086 | 183,58 | ||||
| 2026-02-05 | 13F | Navalign, LLC | 152 | 12 | ||||||
| 2026-02-06 | 13F | EverSource Wealth Advisors, LLC | 1.926 | -20,84 | 154 | -31,25 | ||||
| 2026-02-10 | 13F | Hillsdale Investment Management Inc. | 40.600 | 3.250 | ||||||
| 2026-02-11 | 13F | Buckingham Strategic Partners | 4.936 | -58,81 | 395 | -62,24 | ||||
| 2026-02-13 | 13F | Walleye Trading LLC | 0 | -100,00 | 0 | -100,00 | ||||
| 2026-02-10 | 13F | Moors & Cabot, Inc. | 6.981 | 10,69 | 559 | -4,12 | ||||
| 2026-04-24 | 13F | Profund Advisors Llc | 2.130 | 200 | ||||||
| 2026-02-05 | 13F | Avantax Planning Partners, Inc. | 4.297 | 0,00 | 344 | -13,13 | ||||
| 2026-02-13 | 13F | Schroder Investment Management Group | 100.838 | -20,39 | 8.136 | -30,54 | ||||
| 2026-02-13 | 13F | Missouri Trust & Investment Co | 400 | 0,00 | 32 | -11,11 | ||||
| 2026-01-20 | 13F | Sheets Smith Wealth Management | 0 | -100,00 | 0 | |||||
| 2026-02-03 | 13F | Morse Asset Management, Inc | 35 | -99,76 | 3 | -99,85 | ||||
| 2026-04-15 | 13F | Merit Financial Group, LLC | 10.468 | 12,77 | 984 | 32,30 | ||||
| 2026-02-12 | 13F | Cloud Capital Management, LLC | 0 | -100,00 | 0 | |||||
| 2026-02-03 | 13F | Strengthening Families & Communities, LLC | 0 | -100,00 | 0 | |||||
| 2026-02-13 | 13F | Bridgewater Associates, LP | 116.052 | 44,15 | 9.291 | 24,95 | ||||
| 2025-11-14 | 13F | Strategic Wealth Partners, Ltd. | 42 | 4 | ||||||
| 2026-02-02 | 13F | Nicholas Hoffman & Company, LLC. | 10.900 | -3,51 | 873 | -16,40 | ||||
| 2026-02-13 | 13F | Baird Financial Group, Inc. | 57.989 | -0,68 | 4.643 | -13,91 | ||||
| 2026-02-12 | 13F | Commonwealth Equity Services, Llc | 97.326 | -1,11 | 7.792 | 86.466,67 | ||||
| 2026-04-07 | 13F | Eastern Bank | 519 | 0,00 | 49 | 17,07 | ||||
| 2026-04-21 | 13F | Armbruster Capital Management, Inc. | 8.723 | 96,82 | 820 | 131,36 | ||||
| 2026-01-23 | 13F | Ocean Capital Management, LLC | 2.740 | -3,59 | 219 | -16,41 | ||||
| 2026-02-09 | 13F | Smithfield Trust Co | 2.300 | 0 | ||||||
| 2026-02-20 | 13F | Waterford Advisors, LLC | 0 | -100,00 | 0 | |||||
| 2026-02-17 | 13F | Tudor Investment Corp Et Al | 4.511 | 361 | ||||||
| 2026-02-17 | 13F | D. E. Shaw & Co., Inc. | 6.889 | 552 | ||||||
| 2026-04-13 | 13F | Massmutual Trust Co Fsb/adv | 121 | -47,16 | 11 | -38,89 | ||||
| 2026-02-17 | 13F | Price T Rowe Associates Inc /md/ | 1.582.782 | 653,56 | 127 | 563,16 | ||||
| 2026-02-13 | 13F | Clarity Asset Management, Inc. | 357 | 0,56 | 29 | -12,50 | ||||
| 2026-02-17 | 13F | Aqr Capital Management Llc | 1.666.119 | -22,08 | 133.389 | -32,46 | ||||
| 2026-02-13 | 13F | Pinnacle Wealth Planning Services, Inc. | 1.813 | -21,38 | 145 | -31,92 | ||||
| 2026-02-05 | 13F | Atria Investments Llc | 4.420 | -11,08 | 354 | -23,09 | ||||
| 2026-02-17 | 13F | NorthRock Partners, LLC | 0 | -100,00 | 0 | |||||
| 2026-02-12 | 13F | Triumph Capital Management | 100 | 0,00 | 8 | -11,11 | ||||
| 2026-02-02 | 13F | Sachetta, LLC | 25 | 0,00 | 2 | 0,00 | ||||
| 2026-02-13 | 13F | Financial Network Wealth Advisors LLC | 39 | 0,00 | 3 | 0,00 | ||||
| 2026-02-13 | 13F | University Of Texas/texas Am Investment Managment Co | 262 | 21 | ||||||
| 2026-01-20 | 13F | Aspiriant, Llc | 3.186 | 6,20 | 255 | -7,94 | ||||
| 2026-02-24 | 13F | Bell Investment Advisors, Inc | 0 | -100,00 | 0 | |||||
| 2026-04-15 | 13F | Fortitude Family Office, LLC | 135 | 29,81 | 13 | 50,00 | ||||
| 2026-02-13 | 13F | Horizon Investment Services, LLC | 6.786 | -39,40 | 543 | -47,49 | ||||
| 2026-02-04 | 13F | Securian Asset Management, Inc | 6.553 | -3,16 | 525 | -16,16 | ||||
| 2026-04-17 | 13F | Fifth Third Wealth Advisors LLC | 3.057 | 2,58 | 287 | 20,59 | ||||
| 2026-04-14 | 13F | Andrew Hill Investment Advisors, Inc. | 22.438 | 2.108 | ||||||
| 2025-11-14 | 13F | WNY Asset Management, LLC | 32.452 | 4,16 | 2.998 | 13,57 | ||||
| 2026-02-04 | 13F | Ameritas Advisory Services, LLC | 5.694 | 456 | ||||||
| 2026-02-05 | 13F | North Dakota State Investment Board | 3.178 | 254 | ||||||
| 2026-02-13 | 13F | Wells Fargo & Company/mn | 194.839 | -1,15 | 15.599 | -14,32 | ||||
| 2025-11-07 | 13F | Shell Asset Management Co | 1.635 | -61,86 | 0 | |||||
| 2026-04-27 | 13F | Independent Solutions Wealth Management, LLC | 14.846 | 0,01 | 1.395 | 17,34 | ||||
| 2026-02-11 | 13F | Inceptionr Llc | 0 | -100,00 | 0 | |||||
| 2026-02-06 | 13F | Global Retirement Partners, LLC | 10.749 | 389,93 | 861 | 325,74 | ||||
| 2026-02-12 | 13F | Swiss National Bank | 169.300 | 1,74 | 13.554 | -11,82 | ||||
| 2026-02-17 | 13F | Banco Bilbao Vizcaya Argentaria, S.a. | 0 | -100,00 | 0 | |||||
| 2026-02-17 | 13F | Snowden Capital Advisors LLC | 0 | -100,00 | 0 | |||||
| 2026-02-10 | 13F | Td Asset Management Inc | 17.200 | 23,74 | 1.377 | 7,33 | ||||
| 2026-02-10 | 13F | Daiwa Securities Group Inc. | 5.700 | 11,11 | 0 | |||||
| 2026-02-17 | 13F | Fairscale Capital, LLC | 364 | 29 | ||||||
| 2026-02-06 | 13F | Covestor Ltd | 254 | -11,81 | 0 | |||||
| 2026-02-02 | 13F | Fifth Third Bancorp | 5.232 | -1,58 | 419 | -14,87 | ||||
| 2026-02-12 | 13F | Great Lakes Advisors, Llc | 98.604 | -22,40 | 7.894 | -32,74 | ||||
| 2026-02-17 | 13F | Equitable Holdings, Inc. | 2.947 | 24,14 | 236 | 7,31 | ||||
| 2026-02-09 | 13F | Cary Street Partners Financial Llc | 8.676 | 19,24 | 695 | 3,27 | ||||
| 2026-02-09 | 13F | New Age Alpha Advisors, LLC | 3.184 | 0,00 | 255 | -13,61 | ||||
| 2026-02-13 | 13F | Police & Firemen's Retirement System of New Jersey | 38.707 | -1,58 | 3.099 | -14,70 | ||||
| 2026-02-12 | 13F | Castleark Management Llc | 4.130 | 94,81 | 331 | 69,23 | ||||
| 2026-04-07 | 13F | Blueline Advisors Llc | 254 | 7,63 | 24 | 27,78 | ||||
| 2025-11-14 | 13F | Polymer Capital Management (US) LLC | 0 | -100,00 | 0 | |||||
| 2026-04-15 | 13F | Wolff Financial Management Llc | 5.678 | 0,00 | 534 | 17,40 | ||||
| 2026-04-22 | 13F | Spire Wealth Management | 16 | 6,67 | 2 | 0,00 | ||||
| 2026-02-13 | 13F | Bridgefront Capital, LLC | 0 | -100,00 | 0 | |||||
| 2026-01-16 | 13F | Longboard Asset Management, LP | 0 | -100,00 | 0 | |||||
| 2026-02-10 | 13F | Lido Advisors, LLC | 14.768 | 14,90 | 1.346 | 12,73 | ||||
| 2026-01-15 | 13F | Allspring Global Investments Holdings, LLC | 315.753 | 8,59 | 25.911 | -3,62 | ||||
| 2026-02-12 | 13F | Elo Mutual Pension Insurance Co | 25.530 | 108,48 | 2.044 | 80,64 | ||||
| 2026-04-15 | 13F | Milestone Asset Management, Llc | 15.175 | 1.426 | ||||||
| 2026-04-24 | 13F | Private Advisor Group, LLC | 8.749 | -1,13 | 822 | 16,10 | ||||
| 2026-02-17 | 13F | Coastal Bridge Advisors, LLC | 4.825 | 0,52 | 386 | -12,87 | ||||
| 2026-02-11 | 13F | Francis Financial, Inc. | 0 | -100,00 | 0 | |||||
| 2026-02-12 | 13F | CoreCommodity Management, LLC | 2.535 | -18,72 | 203 | -29,86 | ||||
| 2026-02-13 | 13F | Martingale Asset Management L P | 0 | -100,00 | 0 | |||||
| 2026-01-22 | 13F | Massachusetts Financial Services Co /ma/ | 296.285 | -2,48 | 23.721 | -15,48 | ||||
| 2026-02-13 | 13F | Cohen & Steers, Inc. | 24.200 | 2 | ||||||
| 2026-04-27 | 13F | Ethic Inc. | 5.993 | 29,10 | 563 | 51,75 | ||||
| 2026-04-23 | 13F | Oppenheimer & Co Inc | 60.949 | -1,26 | 5.727 | 15,89 | ||||
| 2026-01-08 | 13F | NorthCrest Asset Manangement, LLC | 0 | -100,00 | 0 | |||||
| 2026-01-28 | 13F | DekaBank Deutsche Girozentrale | 18.220 | 0,00 | 1 | 0,00 | ||||
| 2026-02-17 | 13F | California State Teachers Retirement System | 81.863 | -5,27 | 6.554 | -17,89 | ||||
| 2026-01-26 | 13F | Pursuit Wealth Management LLC | 6.947 | 556 | ||||||
| 2025-10-30 | 13F | Twin Peaks Wealth Advisors, LLC | 0 | -100,00 | 0 | |||||
| 2025-11-14 | 13F | Texas Permanent School Fund | 0 | -100,00 | 0 | -100,00 | ||||
| 2026-04-08 | 13F | Canandaigua National Corp | 2.302 | 216 | ||||||
| 2026-01-28 | 13F | Confluence Wealth Services, Inc. | 4.480 | -3,55 | 359 | -16,55 | ||||
| 2026-02-11 | 13F | Prestige Wealth Management Group LLC | 1.700 | 0,00 | 137 | -12,74 | ||||
| 2026-04-13 | 13F | Salem Investment Counselors Inc | 1.100 | 104 | ||||||
| 2026-02-10 | 13F | Acadian Asset Management Llc | 0 | -100,00 | 0 | |||||
| 2026-02-10 | 13F | Commonwealth Of Pennsylvania Public School Empls Retrmt Sys | 22.613 | -2,50 | 1.810 | -15,50 | ||||
| 2026-02-12 | 13F | Alps Advisors Inc | 32.118 | -6,14 | 2.571 | -18,64 | ||||
| 2026-04-22 | 13F | Janney Montgomery Scott LLC | 31.036 | 21,89 | 3 | 0,00 | ||||
| 2026-02-10 | 13F | Thompson Siegel & Walmsley Llc | 125.998 | 7,59 | 10 | 0,00 | ||||
| 2026-02-13 | 13F | Transamerica Financial Advisors, Inc. | 719 | 58 | ||||||
| 2026-02-10 | 13F | Rothschild Investment Llc | 816 | -67,15 | 65 | -71,62 | ||||
| 2026-02-13 | 13F | Victory Capital Management Inc | 1.260.532 | 76,50 | 100.918 | 52,98 | ||||
| 2026-04-24 | 13F | Kendall Capital Management | 16.138 | 5,24 | 1.516 | 23,55 | ||||
| 2026-04-10 | 13F | Waldron Private Wealth LLC | 9.552 | 897 | ||||||
| 2026-02-17 | 13F | XTX Topco Ltd | 9.210 | 24,19 | 737 | 7,59 | ||||
| 2026-01-27 | 13F | Evergreen Capital Management Llc | 9.699 | -10,12 | 780 | -22,08 | ||||
| 2026-01-26 | 13F | KBC Group NV | 13.976 | 294,91 | 1 | |||||
| 2026-01-28 | 13F | Arizona State Retirement System | 23.867 | -6,03 | 1.911 | -18,58 | ||||
| 2026-02-17 | 13F | Clark Capital Management Group, Inc. | 673.563 | 4,54 | 53.925 | -9,40 | ||||
| 2026-02-04 | 13F | Versor Investments LP | 8.700 | -21,62 | 697 | -32,10 | ||||
| 2026-02-17 | 13F | Raymond James Financial Inc | 151.068 | -1,24 | 12.094 | -14,40 | ||||
| 2026-02-13 | 13F | Atlas Capital Advisors Llc | 1.155 | -79,99 | 92 | -81,19 | ||||
| 2025-11-14 | 13F | Two Sigma Securities, Llc | 0 | -100,00 | 0 | |||||
| 2026-01-30 | 13F | Us Bancorp \de\ | 16.158 | -42,10 | 1.294 | -49,83 | ||||
| 2026-02-11 | 13F | SOUTH STATE Corp | 0 | -100,00 | 0 | |||||
| 2026-02-12 | 13F | Hrt Financial Lp | 20.393 | -73,47 | 2 | -85,71 | ||||
| 2026-02-11 | 13F | IMA Wealth, Inc. | 56 | 1.766,67 | 5 | |||||
| 2026-02-09 | 13F | Legal & General Group Plc | 141.066 | -15,17 | 11.294 | -26,48 | ||||
| 2026-04-09 | 13F | Vista Investment Partners Llc | 4.325 | 0,00 | 406 | 17,34 | ||||
| 2026-04-15 | 13F | Bayforest Capital Ltd | 90 | -91,12 | 8 | -90,12 | ||||
| 2026-02-05 | 13F | GABELLI & Co INVESTMENT ADVISERS, INC. | 26.500 | 0,00 | 2.122 | -13,32 | ||||
| 2026-01-23 | 13F | Nbt Bank N A /ny | 1.420 | 0,00 | 114 | -13,74 | ||||
| 2025-11-14 | 13F | Cubist Systematic Strategies, LLC | 91.292 | -46,66 | 8.433 | -41,84 | ||||
| 2026-02-17 | 13F | Bank Of America Corp /de/ | 622.317 | -6,92 | 49.823 | -19,33 | ||||
| 2026-02-10 | 13F | Jupiter Asset Management Ltd | 536.734 | 15,36 | 42.971 | -0,01 | ||||
| 2026-02-05 | 13F | Blume Capital Management, Inc. | 70 | 0,00 | 6 | -16,67 | ||||
| 2026-02-10 | 13F | CIBC Asset Management Inc | 2.914 | 0,00 | 233 | -13,38 | ||||
| 2026-02-17 | 13F | Two Sigma Advisers, Lp | 29.400 | 1,73 | 2.354 | -11,84 | ||||
| 2025-11-21 | 13F | Nebula Research & Development LLC | 0 | -100,00 | 0 | |||||
| 2025-11-10 | 13F | Clear Creek Financial Management, LLC | 0 | -100,00 | 0 | |||||
| 2026-02-17 | 13F | Prelude Capital Management, Llc | 3.741 | 58,99 | 300 | 37,79 | ||||
| 2026-02-11 | 13F | CNB Bank | 525 | 0,00 | 42 | -12,50 | ||||
| 2026-02-17 | 13F | Balyasny Asset Management Llc | 8.332 | -15,12 | 667 | -26,38 | ||||
| 2026-02-17 | 13F | Blair William & Co/il | 2.687 | -1,10 | 215 | -14,00 | ||||
| 2026-02-13 | 13F | Cynosure Management, Llc | 5.394 | 432 | ||||||
| 2026-02-13 | 13F | Squarepoint Ops LLC | 324.600 | 5,23 | 25.987 | -8,80 | ||||
| 2026-02-12 | 13F | Callan Family Office, LLC | 3.742 | 28,46 | 300 | 11,15 | ||||
| 2026-02-17 | 13F | Herold Advisors, Inc. | 4.100 | 0,00 | 328 | -13,23 | ||||
| 2026-04-23 | 13F | Chelsea Counsel Co | 450 | 0,00 | 36 | 0,00 | ||||
| 2026-02-17 | 13F | Fmr Llc | 803.584 | 462,87 | 64.335 | 387,86 | ||||
| 2025-11-12 | 13F | NewSquare Capital LLC | 0 | -100,00 | 0 | |||||
| 2026-02-13 | 13F | Brookfield Asset Management Inc. | 127.327 | 10.194 | ||||||
| 2026-02-17 | 13F | Janus Henderson Group Plc | 38.134 | 0,00 | 3.052 | -13,37 | ||||
| 2025-10-28 | 13F | Pinnacle Financial Partners Inc | 2.230 | -9,09 | 206 | -0,97 | ||||
| 2026-02-17 | 13F | Regal Investment Advisors LLC | 7.474 | 136,00 | 598 | 169,37 | ||||
| 2026-04-10 | 13F | Novem Group | 4.755 | 0,00 | 447 | 17,37 | ||||
| 2026-02-13 | 13F | State Street Corp | 3.951.177 | 0,41 | 318.414 | -12,90 | ||||
| 2025-11-14 | 13F | Twinbeech Capital Lp | 0 | -100,00 | 0 | -100,00 | ||||
| 2026-02-10 | 13F | Intech Investment Management Llc | 4.457 | 357 | ||||||
| 2026-02-12 | 13F | Quadrant Capital Group Llc | 4.632 | 12,67 | 371 | -2,37 | ||||
| 2026-02-13 | 13F | Charles Schwab Investment Management Inc | 912.404 | -0,59 | 73.047 | -13,84 | ||||
| 2026-02-17 | 13F | Two Sigma Investments, Lp | 14.042 | -57,24 | 1.124 | -62,94 | ||||
| 2026-02-09 | 13F | Optimize Financial Inc | 2.960 | 1,37 | 237 | -12,27 | ||||
| 2026-02-11 | 13F | Group One Trading, L.p. | Call | 200 | 0,00 | 16 | -11,11 | |||
| 2026-02-11 | 13F | Group One Trading, L.p. | Put | 1.000 | 80 | |||||
| 2026-02-11 | 13F | Group One Trading, L.p. | 300 | -57,14 | 24 | -62,50 | ||||
| 2026-02-17 | 13F | Northern Trust Corp | 1.002.512 | -5,70 | 80.261 | -18,27 | ||||
| 2026-02-12 | 13F | Aviva Plc | 7.696 | 19,69 | 616 | 3,88 | ||||
| 2026-04-24 | 13F | Keybank National Association/oh | 28.513 | -23,68 | 2.679 | -10,40 | ||||
| 2026-04-09 | 13F | Cullen Investment Group, Ltd. | 26.248 | -0,07 | 2.466 | 19,83 | ||||
| 2026-01-15 | 13F | Nisa Investment Advisors, Llc | 31.757 | -3,05 | 2.559 | -15,91 | ||||
| 2026-02-13 | 13F | Pathstone Holdings, LLC | 20.352 | -6,58 | 1.629 | -19,04 | ||||
| 2026-02-02 | 13F | Cornerstone Planning Group LLC | 43 | -10,42 | 4 | 0,00 | ||||
| 2026-02-05 | 13F | Bessemer Group Inc | 38.942 | 1.019,34 | 3 | |||||
| 2026-04-24 | 13F | ProShare Advisors LLC | 312.345 | -22,24 | 29.348 | -8,75 | ||||
| 2026-04-24 | 13F | Strs Ohio | 2.249 | 4,70 | 211 | 23,39 | ||||
| 2026-01-21 | 13F | Palumbo Wealth Management LLC | 2.723 | 0,63 | 218 | -12,85 | ||||
| 2026-01-23 | 13F | Assetmark, Inc | 1.279 | 39,93 | 102 | 21,43 | ||||
| 2025-11-14 | 13F | Axa S.a. | 0 | -100,00 | 0 | |||||
| 2026-02-17 | 13F | State Of Wisconsin Investment Board | 51.685 | -6,18 | 4.138 | -18,69 | ||||
| 2026-02-12 | 13F | Mark Sheptoff Financial Planning, Llc | 150 | 0,00 | 12 | -7,69 | ||||
| 2025-11-14 | 13F | Point72 Asia (Singapore) Pte. Ltd. | 528 | 49 | ||||||
| 2026-01-29 | 13F | Dunhill Financial, LLC | 2 | 0 | ||||||
| 2026-02-13 | 13F | Rodgers Brothers Inc. | 85.464 | -1,08 | 6.842 | -14,26 | ||||
| 2026-04-14 | 13F | Nbc Securities, Inc. | 1.762 | 0,00 | 166 | 17,02 | ||||
| 2026-02-03 | 13F | Ballentine Partners, LLC | 5.620 | -2,68 | 450 | -15,76 | ||||
| 2026-02-04 | 13F | Hallmark Capital Management Inc | 242.994 | 3,33 | 19.454 | -10,44 | ||||
| 2026-04-16 | 13F | Evolve Private Wealth, Llc | 12.617 | -5,29 | 1.185 | 10,44 | ||||
| 2026-04-16 | 13F | IVC Wealth Advisors LLC | 4.796 | -0,21 | 451 | 17,19 | ||||
| 2026-02-10 | 13F | Natixis Advisors, L.p. | 61.194 | 1,56 | 5 | -20,00 | ||||
| 2026-01-14 | 13F | ORG Partners LLC | 273 | 26,39 | 22 | 10,53 | ||||
| 2026-02-05 | 13F | Park Square Financial Group, LLC | 0 | -100,00 | 0 | |||||
| 2026-04-16 | 13F | Fortem Financial Group, Llc | 28.736 | 14,18 | 2.700 | 34,06 | ||||
| 2026-04-22 | 13F | Sterling Capital Management LLC | 6.362 | -38,59 | 598 | -27,99 | ||||
| 2026-02-10 | 13F | Connor, Clark & Lunn Investment Management Ltd. | 139.606 | 340,62 | 11.177 | 281,95 | ||||
| 2026-02-13 | 13F | Cozad Asset Management Inc | 51.136 | -48,99 | 4.094 | -55,80 | ||||
| 2026-01-23 | 13F | Rsm Us Wealth Management Llc | 2.476 | -5,53 | 201 | -17,28 | ||||
| 2026-01-28 | 13F | CAPROCK Group, Inc. | 0 | -100,00 | 0 | -100,00 | ||||
| 2026-04-20 | 13F | Emprise Bank | 3.300 | 0,00 | 310 | 17,42 | ||||
| 2026-02-12 | 13F | MetLife Investment Management, LLC | 44.142 | -4,93 | 3.534 | -17,60 | ||||
| 2026-02-17 | 13F | Advisor Group Holdings, Inc. | 32.083 | -58,51 | 2.569 | -63,63 | ||||
| 2026-02-12 | 13F | IFC Advisors LLC | 2.844 | 0,00 | 228 | -13,36 | ||||
| 2026-02-10 | 13F | Savant Capital, LLC | 0 | -100,00 | 0 | -100,00 | ||||
| 2026-04-08 | 13F | Emergent Wealth Advisors, LLC | 5.580 | -3,49 | 524 | 13,42 | ||||
| 2026-02-13 | 13F | Mariner, LLC | 46.047 | 1,54 | 3.688 | -11,96 | ||||
| 2026-02-03 | 13F | Bernzott Capital Advisors | 50.695 | -1,94 | 4.059 | -15,02 | ||||
| 2026-01-28 | 13F | Geneos Wealth Management Inc. | 2.496 | 1,59 | 200 | -11,95 | ||||
| 2026-04-24 | 13F | Retirement Systems of Alabama | 238.093 | 3,50 | 22.371 | 21,47 | ||||
| 2026-02-13 | 13F | Glen Eagle Advisors, LLC | 175 | 0,00 | 14 | -12,50 | ||||
| 2026-02-12 | 13F | denkapparat Operations GmbH | 13.082 | 124,93 | 1.047 | 94,97 | ||||
| 2026-02-12 | 13F | Brown Brothers Harriman & Co | 148 | 0,00 | 12 | -15,38 | ||||
| 2026-02-13 | 13F | Edgestream Partners, L.P. | 44.530 | 3.565 | ||||||
| 2025-12-16 | 13F | Garde Capital, Inc. | 0 | -100,00 | 0 | |||||
| 2026-04-08 | 13F | DiNuzzo Private Wealth, Inc. | 13 | 0,00 | 1 | 0,00 | ||||
| 2026-02-10 | 13F | Mutual Of America Capital Management Llc | 37.607 | -9,89 | 3.011 | -21,90 | ||||
| 2026-02-10 | 13F | Gw Henssler & Associates Ltd | 0 | -100,00 | 0 | |||||
| 2026-02-17 | 13F | Zacks Investment Management | 103.301 | 0,84 | 8.270 | -12,60 | ||||
| 2026-02-13 | 13F | American Century Companies Inc | 54.763 | 1,31 | 4.385 | -12,20 | ||||
| 2026-01-22 | 13F | Vision Financial Markets Llc | 0 | -100,00 | 0 | |||||
| 2026-02-12 | 13F | CIBC Private Wealth Group, LLC | 3.360 | 159,86 | 269 | 126,05 | ||||
| 2026-02-13 | 13F | S&t Bank/pa | 1 | 0,00 | 0 | |||||
| 2026-01-28 | 13F | N.E.W. Advisory Services LLC | 104 | 0,00 | 8 | -11,11 | ||||
| 2026-02-12 | 13F | Steward Partners Investment Advisory, Llc | 11.281 | 26,14 | 903 | 9,32 | ||||
| 2026-01-14 | 13F | Net Worth Advisory Group | 2.705 | 217 | ||||||
| 2026-02-12 | 13F | Barnett & Company, Inc. | 44.892 | -0,77 | 3.594 | -14,00 | ||||
| 2026-02-13 | 13F | WealthTrust Axiom LLC | 3.430 | 275 | ||||||
| 2026-01-30 | 13F | Torren Management, LLC | 609 | 49 | ||||||
| 2026-02-13 | 13F | Sei Investments Co | 333.052 | 6,61 | 26.660 | -7,61 | ||||
| 2026-01-26 | 13F | AE Wealth Management LLC | 5.629 | 2,74 | 451 | -11,07 | ||||
| 2026-02-02 | 13F | Horizon Investments, LLC | 53.286 | 47,78 | 4.266 | 28,11 | ||||
| 2026-04-07 | 13F | Signaturefd, Llc | 2.738 | 19,35 | 257 | 40,44 | ||||
| 2025-11-14 | 13F | ISAM Funds (UK) Ltd | 0 | -100,00 | 0 | |||||
| 2026-02-19 | 13F | CI Private Wealth, LLC | 40.395 | 223,68 | 1.577 | 36,81 | ||||
| 2026-02-11 | 13F | Harvest Fund Management Co., Ltd | 4.262 | -62,95 | 0 | -100,00 | ||||
| 2026-03-12 | 13F | Winthrop Partners - Wny, Llc | 4.700 | 4.600,00 | 376 | 9.300,00 | ||||
| 2026-02-12 | 13F | BlackRock, Inc. | 8.831.364 | 0,53 | 707.039 | -12,87 | ||||
| 2026-02-17 | 13F | Quantinno Capital Management LP | 94.543 | 10,92 | 7.569 | -3,86 | ||||
| 2026-04-14 | 13F | Bay Harbor Wealth Management, LLC | 12 | 50,00 | 1 | |||||
| 2026-04-14 | 13F | R.H. Investment Group, LLC | 2.680 | 0,00 | 256 | 19,63 | ||||
| 2026-01-20 | 13F | Cromwell Holdings LLC | 15 | 0,00 | 1 | 0,00 | ||||
| 2026-01-16 | 13F | Empirical Financial Services, LLC d.b.a. Empirical Wealth Management | 2.677 | 214 | ||||||
| 2026-04-22 | 13F | Phoenix Wealth Advisors | 8.324 | -2,88 | 782 | 13,99 | ||||
| 2026-02-17 | 13F | ExodusPoint Capital Management, LP | 0 | -100,00 | 0 | -100,00 | ||||
| 2026-01-23 | 13F | Avion Wealth | 17 | 0,00 | 0 | |||||
| 2025-11-13 | 13F | EntryPoint Capital, LLC | 0 | -100,00 | 0 | |||||
| 2026-01-30 | 13F | Bogart Wealth, LLC | 191 | -2,05 | 15 | -16,67 | ||||
| 2026-02-17 | 13F | Signature Equity Partners, LLC | 548 | 44 | ||||||
| 2026-02-06 | 13F | Van Hulzen Asset Management, LLC | 2.745 | 220 | ||||||
| 2026-04-17 | 13F | Vermillion Wealth Management, Inc. | 5 | 0 | ||||||
| 2026-02-12 | 13F | Dimensional Fund Advisors Lp | 1.135.850 | 2,35 | 90.941 | -11,29 | ||||
| 2026-01-29 | 13F | Sanctuary Advisors, LLC | 10.807 | -8,22 | 865 | -20,42 | ||||
| 2026-01-26 | 13F | Asset Dedication, LLC | 33 | 3 | ||||||
| 2026-02-13 | 13F | First Trust Advisors Lp | 790.416 | 12,06 | 63.281 | -2,87 | ||||
| 2026-03-10 | 13F | Advisortrust Partners, Llc | 4.064 | 325 | ||||||
| 2025-11-07 | 13F | Heartland Advisors Inc | 0 | -100,00 | 0 | |||||
| 2026-04-07 | 13F | Cooper Financial Group | 0 | -100,00 | 0 | |||||
| 2026-02-17 | 13F | Alliancebernstein L.p. | 119.314 | 0,89 | 9.552 | -12,55 | ||||
| 2026-01-23 | 13F | Ogorek Anthony Joseph /ny/ /adv | 140 | 0,00 | 0 | |||||
| 2026-01-30 | 13F/A | M&t Bank Corp | 6.613 | 13,02 | 530 | -2,04 | ||||
| 2026-02-09 | 13F | HBK Sorce Advisory LLC | 21.324 | -0,27 | 1.829 | -0,81 | ||||
| 2025-11-14 | 13F | Wood Tarver Financial Group, LLC | 0 | -100,00 | 0 | |||||
| 2026-02-12 | 13F | Nuveen, LLC | 147.526 | 3,59 | 11.811 | -10,22 | ||||
| 2026-04-27 | 13F | Pensionmark Financial Group, Llc | 3.010 | -34,69 | 283 | -23,37 | ||||
| 2026-02-10 | 13F | Bnp Paribas Arbitrage, Sa | 27.018 | 11,09 | 2.163 | -3,70 | ||||
| 2026-02-17 | 13F | Ancora Advisors, LLC | 444 | 422,35 | 36 | 400,00 | ||||
| 2026-02-10 | 13F | Lummis Asset Management, LP | 40 | 3 | ||||||
| 2026-02-05 | 13F | Gabelli Funds Llc | 2.355.282 | -0,16 | 188.564 | -13,47 | ||||
| 2026-02-12 | 13F | Advisors Asset Management, Inc. | 61.317 | 7,27 | 4.909 | -7,03 | ||||
| 2026-02-13 | 13F | Mml Investors Services, Llc | 29.467 | 26,50 | 2.359 | 9,67 | ||||
| 2026-04-16 | 13F | Park National Corp /oh/ | 3.000 | 0,00 | 282 | 17,08 | ||||
| 2026-02-12 | 13F | Bank Of Montreal /can/ | 11.631 | -1,56 | 931 | -14,67 | ||||
| 2026-04-08 | 13F | Wealth Enhancement Advisory Services, Llc | 20.865 | -21,45 | 1.970 | -6,68 | ||||
| 2026-02-17 | 13F | Engineers Gate Manager LP | 100.889 | 72,31 | 8.077 | 49,35 | ||||
| 2026-02-04 | 13F | LRI Investments, LLC | 502 | 0,00 | 40 | -13,04 | ||||
| 2026-04-07 | 13F | Farther Finance Advisors, LLC | 19.061 | 3,99 | 1.770 | 20,65 | ||||
| 2026-02-13 | 13F | Citigroup Inc | 44.730 | -30,23 | 3.581 | -39,53 | ||||
| 2026-02-04 | 13F | Bailard, Inc. | 9.037 | 0,00 | 724 | -13,31 | ||||
| 2026-02-13 | 13F | Resources Investment Advisors, LLC. | 3.141 | -3,00 | 252 | -16,05 | ||||
| 2026-02-13 | 13F | Umb Bank N A/mo | 1.194 | 17,87 | 96 | 2,15 | ||||
| 2026-02-12 | 13F | Tocqueville Asset Management L.p. | 313.791 | 11,59 | 25.122 | -3,28 | ||||
| 2026-02-02 | 13F | Principal Financial Group Inc | 194.378 | -3,17 | 15.562 | -16,07 | ||||
| 2026-02-11 | 13F | CenterBook Partners LP | 0 | -100,00 | 0 | -100,00 | ||||
| 2026-02-09 | 13F | Annis Gardner Whiting Capital Advisors, LLC | 184 | 3,37 | 15 | -12,50 | ||||
| 2026-04-20 | 13F | Concurrent Investment Advisors, LLC | 0 | -100,00 | 0 | -100,00 | ||||
| 2026-02-09 | 13F | Leavell Investment Management, Inc. | 3.307 | 25,98 | 267 | 9,47 | ||||
| 2026-01-22 | 13F | Jackson Thornton Asset Management, Llc | 0 | -100,00 | 0 | |||||
| 2026-02-10 | 13F | SBI Okasan Asset Management Co.Ltd. | 21.270 | 1.720 | ||||||
| 2026-01-20 | 13F | Wall Street Access Asset Management, LLC | 1.555 | 0,00 | 124 | -13,29 | ||||
| 2026-04-21 | 13F | Hennessy Advisors Inc | 73.424 | 2,94 | 6.899 | 20,81 | ||||
| 2026-02-17 | 13F | Family Management Corp | 5.174 | 65,57 | 414 | 43,75 | ||||
| 2026-02-11 | 13F | LPL Financial LLC | 129.113 | 13,25 | 10.337 | -1,84 | ||||
| 2026-02-13 | 13F | Stifel Financial Corp | 27.328 | -5,46 | 2.188 | -18,05 | ||||
| 2026-02-17 | 13F | Royal Bank Of Canada | 451.244 | -2,37 | 36.126 | -15,38 | ||||
| 2026-02-17 | 13F | Hilltop Holdings Inc. | 0 | -100,00 | 0 | |||||
| 2026-02-17 | 13F | MIRAE ASSET GLOBAL ETFS HOLDINGS Ltd. | 9.127 | 731 | ||||||
| 2026-01-29 | 13F | UBS Group AG | 255.510 | 9,69 | 20.456 | -4,93 | ||||
| 2026-02-11 | 13F | Ameritas Investment Partners, Inc. | 42.076 | 3.369 | ||||||
| 2026-02-09 | 13F | Schwarz Dygos Wheeler Investment Advisors Llc | 2.940 | 0,00 | 235 | -13,28 | ||||
| 2026-02-17 | 13F | Trexquant Investment LP | 0 | -100,00 | 0 | |||||
| 2026-02-10 | 13F | Hazlett, Burt & Watson, Inc. | 1.722 | 4,36 | 0 | |||||
| 2026-04-17 | 13F | CENTRAL TRUST Co | 6.709 | 28,70 | 630 | 51,08 | ||||
| 2026-04-20 | 13F | Dagco, Inc. | 879 | 4,89 | 83 | 22,39 | ||||
| 2026-02-13 | 13F | Natixis | 32.324 | 45.426,76 | 2.588 | 43.016,67 | ||||
| 2026-01-26 | 13F | Whittier Trust Co | 1.143 | 0,00 | 91 | -10,89 | ||||
| 2026-02-17 | 13F | DZ BANK AG Deutsche Zentral Genossenschafts Bank, Frankfurt am Main | 0 | -100,00 | 0 | |||||
| 2026-04-06 | 13F | GAMMA Investing LLC | 1.951 | 5,52 | 183 | 23,65 | ||||
| 2026-02-13 | 13F | Aptus Capital Advisors, LLC | 132.800 | 0,38 | 10.632 | -13,00 | ||||
| 2026-04-07 | 13F | Park Avenue Securities Llc | 4.504 | -62,62 | 0 | |||||
| 2026-04-22 | 13F | Pictet Asset Management Holding SA | 14.870 | 7,61 | 1.397 | 26,31 | ||||
| 2026-02-05 | 13F | 1620 Investment Advisors, Inc. | 166 | 0,00 | 13 | -13,33 | ||||
| 2026-04-20 | 13F | Ronald Blue Trust, Inc. | 291 | -30,05 | 27 | -18,18 | ||||
| 2026-02-12 | 13F | Federation des caisses Desjardins du Quebec | 7.055 | 20,35 | 565 | 4,25 | ||||
| 2026-04-22 | 13F | Silver Coast Investments LLC | 3.676 | -2,75 | 345 | 14,24 | ||||
| 2026-04-07 | 13F | Fragasso Group Inc. | 2.871 | 2,21 | 271 | 20,98 | ||||
| 2026-02-12 | 13F | Wealthspire Advisors, LLC | 12.113 | 3,05 | 970 | -10,69 | ||||
| 2026-02-11 | 13F | Vestcor Inc | 19.344 | 34,86 | 2 | 0,00 | ||||
| 2026-02-10 | 13F | Measured Wealth Private Client Group, LLC | 12.954 | 20,39 | 1.037 | 4,43 | ||||
| 2025-11-13 | 13F | Glenmede Investment Management, LP | 46.634 | 0,21 | 4.308 | 9,29 | ||||
| 2026-01-29 | 13F | Dumont & Blake Investment Advisors Llc | 0 | -100,00 | 0 | |||||
| 2026-02-17 | 13F | Ameriprise Financial Inc | 706.294 | 102,29 | 56.551 | 75,32 | ||||
| 2025-11-12 | 13F | Cresset Asset Management, LLC | 2.638 | 0,19 | 245 | 9,38 | ||||
| 2026-02-17 | 13F | Hancock Whitney Corp | 37.811 | -9,00 | 3.027 | -21,11 | ||||
| 2025-11-14 | 13F | Graham Capital Management, L.P. | 0 | -100,00 | 0 | |||||
| 2026-02-13 | 13F | Treasurer of the State of North Carolina | 37.573 | -6,82 | 3 | 0,00 | ||||
| 2026-02-06 | 13F | Lsv Asset Management | 1.799.250 | -2,50 | 144 | -15,29 | ||||
| 2026-02-04 | 13F | Mascoma Wealth Management LLC | 263 | 0,00 | 21 | -12,50 | ||||
| 2026-01-21 | 13F | Edmp, Inc. | 33.758 | -1,95 | 2.703 | -15,03 | ||||
| 2026-02-05 | 13F | HFM Investment Advisors, LLC | 5 | 0,00 | 0 | |||||
| 2026-02-17 | 13F | Covalis Capital Llp | 97.545 | 7.809 | ||||||
| 2026-02-05 | 13F | Elyxium Wealth, LLC | 155 | 12 | ||||||
| 2026-02-11 | 13F | Capital Analysts, Inc. | 0 | -100,00 | 0 | |||||
| 2026-04-23 | 13F | SJS Investment Consulting Inc. | 279 | 458,00 | 26 | 550,00 | ||||
| 2026-02-10 | 13F | Florida Financial Advisors, Llc | 18.194 | 21,35 | 1.455 | 4,98 | ||||
| 2026-02-17 | 13F | Occudo Quantitative Strategies Lp | 22.881 | 1.832 | ||||||
| 2026-02-04 | 13F | Atlantic Union Bankshares Corp | 1.643 | 0,00 | 132 | -13,25 | ||||
| 2026-02-13 | 13F | Van Eck Associates Corp | 64.488 | 5,61 | 5 | 0,00 | ||||
| 2026-01-28 | 13F | Diversified Enterprises, LLC | 3.309 | 2,51 | 265 | -11,41 | ||||
| 2026-02-17 | 13F | Boothbay Fund Management, Llc | 0 | -100,00 | 0 | |||||
| 2026-02-17 | 13F | Summit Trail Advisors, Llc | 16.823 | 36,56 | 1.356 | 18,86 | ||||
| 2026-01-08 | 13F | Nordea Investment Management Ab | 97.921 | -5,28 | 7.815 | -18,09 | ||||
| 2026-04-21 | 13F | J.M. Arbour, LLC | 8.765 | 1,62 | 824 | 19,28 | ||||
| 2026-02-13 | 13F | Huber Capital Management LLC | 55.500 | 0,00 | 4.443 | -13,32 | ||||
| 2026-01-29 | 13F | Concord Wealth Partners | Call | 1.000 | 0 | |||||
| 2026-01-14 | 13F | USA Financial Portformulas Corp | 0 | -100,00 | 0 | |||||
| 2025-11-06 | 13F | Whipplewood Advisors, LLC | 0 | -100,00 | 0 | |||||
| 2026-04-09 | 13F | Tompkins Financial Corp | 995 | 93 | ||||||
| 2026-02-09 | 13F | AIA Group Ltd | 4.618 | 108,86 | 370 | 80,88 | ||||
| 2026-04-13 | 13F | Gateway Investment Advisers Llc | 0 | -100,00 | 0 | |||||
| 2026-02-06 | 13F | Meiji Yasuda Asset Management Co Ltd. | 133.477 | 11,85 | 10.686 | -3,05 | ||||
| 2026-02-12 | 13F | Voya Investment Management Llc | 167.964 | 3,82 | 13.447 | -10,02 | ||||
| 2026-03-12 | 13F/A | Peak6 Llc | Call | 100.000 | -39,76 | 8.006 | -47,79 | |||
| 2026-04-22 | 13F | Apollon Wealth Management, LLC | 3.097 | 6,98 | 291 | 25,54 | ||||
| 2026-02-17 | 13F | Yaupon Capital Management LP | 1.105.979 | 520,97 | 88.545 | 438,23 | ||||
| 2026-02-13 | 13F | Commerce Bank | 2.760 | -26,98 | 221 | -36,96 | ||||
| 2026-02-17 | 13F | SageView Advisory Group, LLC | 3.235 | -20,42 | 259 | -31,20 | ||||
| 2026-01-22 | 13F | Richardson Financial Services Inc. | 425 | 18,06 | 34 | 3,03 | ||||
| 2025-10-31 | 13F | Symphony Financial, Ltd. Co. | 0 | -100,00 | 0 | -100,00 | ||||
| 2026-02-10 | 13F | Bruce G. Allen Investments, LLC | 140 | 833,33 | 11 | 1.000,00 | ||||
| 2026-02-03 | 13F | Anfield Capital Management, LLC | 24.192 | -2,62 | 1.937 | -15,61 | ||||
| 2026-02-13 | 13F | Integrated Wealth Concepts LLC | 0 | -100,00 | 0 | |||||
| 2026-04-10 | 13F | Perigon Wealth Management, LLC | 2.296 | -35,90 | 216 | -24,83 | ||||
| 2026-02-11 | 13F | Prudential Plc | 0 | -100,00 | 0 | |||||
| 2025-11-13 | 13F | Quadrature Capital Ltd | 0 | -100,00 | 0 | |||||
| 2026-04-16 | 13F | Vaughan Nelson Investment Management, L.p. | 679.680 | 63.863 | ||||||
| 2026-02-18 | 13F | Vident Advisory, LLC | 7.311 | -8,54 | 585 | -20,73 | ||||
| 2025-11-12 | 13F | Ameriflex Group, Inc. | 0 | -100,00 | 0 | -100,00 | ||||
| 2026-02-11 | 13F | Hughes Financial Services, LLC | 10 | 25,00 | 1 | |||||
| 2026-04-21 | 13F | Welch Group, LLC | 10.108 | 0,00 | 950 | 17,31 | ||||
| 2026-02-13 | 13F | SRS Capital Advisors, Inc. | 2.417 | -93,97 | 194 | -94,79 | ||||
| 2026-02-06 | 13F | Cullen/frost Bankers, Inc. | 747 | 8,10 | 60 | -6,35 | ||||
| 2026-02-17 | 13F | Qube Research & Technologies Ltd | 624.630 | 8,78 | 50.008 | -5,71 | ||||
| 2026-02-17 | 13F | Cetera Investment Advisers | 35.244 | -0,60 | 2.822 | -13,86 | ||||
| 2026-04-15 | 13F | DAVENPORT & Co LLC | 3.172 | 1,37 | 298 | 19,20 | ||||
| 2026-02-09 | 13F | Jefferies Financial Group Inc. | Call | 34.400 | 2.754 | |||||
| 2026-02-09 | 13F | Jefferies Financial Group Inc. | 27.700 | 2.218 | ||||||
| 2026-02-12 | 13F | Brinker Capital Investments, LLC | 51.974 | 15,20 | 4.161 | -0,14 | ||||
| 2026-02-13 | 13F | Jacobs Levy Equity Management, Inc | 0 | -100,00 | 0 | -100,00 | ||||
| 2026-04-20 | 13F | Delphi Management Inc /ma/ | 15.866 | -7,44 | 1 | 0,00 | ||||
| 2026-02-12 | 13F | Skopos Labs, Inc. | 2.759 | 13,35 | 223 | -0,45 | ||||
| 2026-02-13 | 13F | Arrowstreet Capital, Limited Partnership | 169.652 | 496,59 | 13.582 | 417,21 | ||||
| 2026-02-02 | 13F | VELA Investment Management, LLC | 25.806 | 11,65 | 2.066 | -3,23 | ||||
| 2026-02-09 | 13F | Hartland & Co., LLC | 588 | -31,63 | 47 | -40,51 | ||||
| 2026-02-11 | 13F | Manchester Capital Management LLC | 111 | 9 | ||||||
| 2026-04-22 | 13F | HMS Capital Management, LLC | 4.715 | 0,02 | 443 | 17,51 | ||||
| 2026-02-10 | 13F | Essex Financial Services, Inc. | 0 | -100,00 | 0 | |||||
| 2026-02-09 | 13F | Hantz Financial Services, Inc. | 738 | 74,47 | 0 | |||||
| 2026-02-13 | 13F | Estabrook Capital Management | 0 | -100,00 | 0 | |||||
| 2026-04-07 | 13F | CoreCap Advisors, LLC | 1.925 | -17,91 | 181 | -3,74 | ||||
| 2026-02-10 | 13F | New Mexico Educational Retirement Board | 18.800 | 0,00 | 2 | 0,00 | ||||
| 2026-04-22 | 13F | Stone House Investment Management, LLC | 40 | 0,00 | 4 | 0,00 | ||||
| 2026-01-29 | 13F | DecisionPoint Financial, LLC | 14 | 0,00 | 1 | 0,00 | ||||
| 2026-03-06 | 13F | Hsbc Holdings Plc | 29.337 | -3,90 | 2.356 | -16,36 | ||||
| 2026-02-06 | 13F | Larson Financial Group LLC | 211 | 3,43 | 17 | -11,11 | ||||
| 2026-01-26 | 13F | Private Trust Co Na | 1.961 | 1,87 | 157 | -11,86 | ||||
| 2026-02-06 | 13F | HighTower Advisors, LLC | 45.947 | 4,37 | 3.678 | -9,54 | ||||
| 2026-02-13 | 13F | Caxton Associates Llp | 12.923 | 402,64 | 1.035 | 336,29 | ||||
| 2026-02-11 | 13F | Parallel Advisors, LLC | 4.585 | -21,14 | 367 | -31,66 |
Other Listings
| DE:NFG | 74,00 € |