Grundlæggende statistik
| Institutionelle ejere | 574 total, 562 long only, 0 short only, 12 long/short - change of -26,28% MRQ |
| Gennemsnitlig porteføljeallokering | 0.5105 % - change of -35,00% MRQ |
| Institutionelle aktier (lange) | 625.154.200 (ex 13D/G) - change of -110,25MM shares -14,99% MRQ |
| Institutionel værdi (lang) | $ 17.515.025 USD ($1000) |
Institutionelt ejerskab og aktionærer
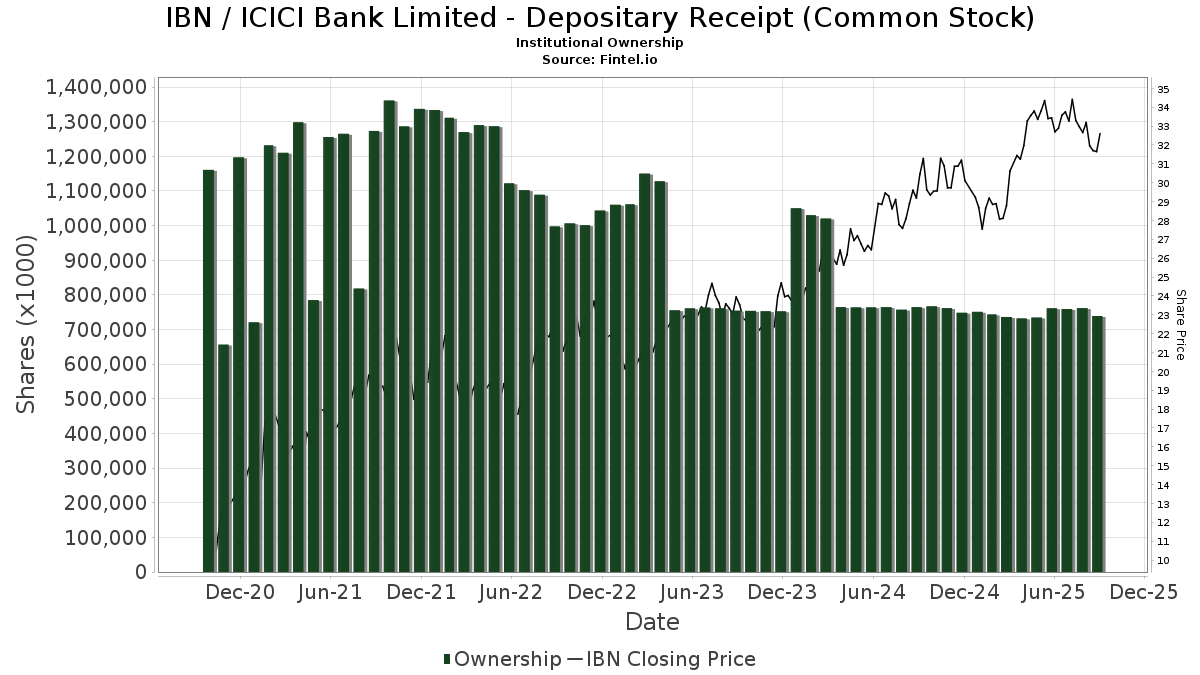
ICICI Bank Limited - Depositary Receipt (Common Stock) (US:IBN) har 574 institutionelle ejere og aktionærer, der har indsendt 13D/G- eller 13F-formularer til Securities Exchange Commission (SEC). Disse institutioner har i alt 625,154,200 aktier. Største aktionærer omfatter GQG Partners LLC, Morgan Stanley, Wcm Investment Management, Llc, Temasek Holdings (Private) Ltd, Invesco Ltd., Robeco Institutional Asset Management B.V., Jpmorgan Chase & Co, Capital International Investors, Dimensional Fund Advisors Lp, and Ninety One UK Ltd .
ICICI Bank Limited - Depositary Receipt (Common Stock) (NYSE:IBN) institutionel ejerskabsstruktur viser aktuelle positioner i virksomheden efter institutioner og fonde, samt seneste ændringer i positionsstørrelse. Større aktionærer kan omfatte individuelle investorer, investeringsforeninger, hedgefonde eller institutioner. Skema 13D angiver, at investoren besidder (eller besidder) mere end 5 % af virksomheden og har til hensigt (eller har til hensigt at) aktivt at forfølge en ændring i forretningsstrategi. Skema 13G indikerer en passiv investering på over 5%.
The share price as of April 24, 2026 is 27,60 / share. Previously, on April 28, 2025, the share price was 33,52 / share. This represents a decline of 17,66% over that period.
Fondens stemningsscore
Fund Sentiment Score (fka Ownership Accumulation Score) finder de aktier, der bliver mest købt af fonde. Det er resultatet af en sofistikeret, multi-faktor kvantitativ model, der identificerer virksomheder med de højeste niveauer af institutionel akkumulering. Scoringsmodellen bruger en kombination af den samlede stigning i oplyste ejere, ændringerne i porteføljeallokeringer i disse ejere og andre målinger. Tallet går fra 0 til 100, hvor højere tal indikerer et højere niveau af akkumulering for sine jævnaldrende, og 50 er gennemsnittet.
Opdateringsfrekvens: Dagligt
Se Ownership Explorer, som giver en liste over højest rangerende virksomheder.
AI+ Ask Fintel’s AI assistant about ICICI Bank Limited - Depositary Receipt (Common Stock).
Select a question to share a public post with an AI-crafted answer.
Thinking of good questions…
Institutionel Put/Call-forhold
Ud over at indberette standardaktie- og gældsudstedelser skal institutter med mere end 100 mill. aktiver under forvaltning også oplyse deres put- og call-optionsbeholdninger. Da salgsoptioner generelt indikerer negativ stemning, og købsoptioner indikerer positiv stemning, kan vi få en fornemmelse af den overordnede institutionelle stemning ved at plotte forholdet mellem put og kald. Diagrammet til højre viser det historiske put/call-forhold for dette instrument.
Brug af Put/Call Ratio som en indikator for investorernes stemning overvinder en af de vigtigste mangler ved at bruge totalt institutionelt ejerskab, som er, at en betydelig mængde af aktiver under forvaltning investeres passivt for at spore indekser. Passivt forvaltede fonde køber typisk ikke optioner, så indikatoren for put/call-forholdet følger mere nøje følelsen af aktivt forvaltede fonde.

13F og NPORT arkivering
Detaljer om 13F-arkivering er gratis. Detaljer om NP-ansøgninger kræver et premium-medlemskab. Grønne rækker angiver nye positioner. Røde rækker angiver lukkede positioner. Klik på linket ikon for at se den fulde transaktionshistorik.
Opgrader
for at låse premium-data op og eksportere til Excel ![]() .
.
| Fil dato | Kilde | Investor | Type | Gennemsnitlig pris (Øst) |
Aktier | Δ Aktier (%) |
Rapporteret Værdi ($1000) |
Δ Værdi (%) |
Port Alloc (%) |
|
|---|---|---|---|---|---|---|---|---|---|---|
| 2026-02-17 | 13F | Aperture Investors, LLC | 0 | -100,00 | 0 | |||||
| 2026-02-11 | 13F | Empowered Funds, LLC | 148.497 | 4.425 | ||||||
| 2026-02-13 | 13F | Walleye Trading LLC | 93.295 | -43,76 | 2.780 | -44,56 | ||||
| 2026-04-08 | 13F | Wealth Science Advisors LLC | 89 | 3 | ||||||
| 2026-02-13 | 13F | Parkside Financial Bank & Trust | 162 | 0,00 | 5 | 0,00 | ||||
| 2026-02-17 | 13F | Old Mission Capital Llc | 339.316 | 10.112 | ||||||
| 2026-02-13 | 13F | Aviso Financial Inc. | 0 | -100,00 | 0 | |||||
| 2026-02-17 | 13F | Gilder Gagnon Howe & Co Llc | 996.262 | -2,30 | 29.689 | -3,69 | ||||
| 2026-02-17 | 13F | Summit Global Investments | 58.336 | -1,98 | 2 | 0,00 | ||||
| 2026-02-13 | 13F | Walleye Trading LLC | Put | 16.700 | -57,51 | 498 | -58,16 | |||
| 2026-02-13 | 13F | Walleye Trading LLC | Call | 27.600 | 8,66 | 822 | 7,17 | |||
| 2026-04-02 | 13F | Byrne Asset Management LLC | 350 | -36,36 | 9 | -43,75 | ||||
| 2026-01-28 | 13F | SP Asset Management LLC | 35.361 | 0,00 | 1.054 | -1,40 | ||||
| 2026-02-13 | 13F | Colony Group, LLC | 32.352 | 30,38 | 964 | 28,53 | ||||
| 2026-03-31 | 13F | Hamrick Investment Counsel, llc | 60 | 2 | ||||||
| 2026-02-12 | 13F | BRYN MAWR TRUST Co | 445 | -4,09 | 13 | -7,14 | ||||
| 2026-02-17 | 13F | Lazard Asset Management Llc | 3.860.922 | -5,93 | 115.055 | -7,27 | ||||
| 2026-02-12 | 13F | Aviva Plc | 93.554 | -0,76 | 2.788 | -2,18 | ||||
| 2026-02-13 | 13F | Headlands Technologies LLC | 100.617 | 685,46 | 2.998 | 674,68 | ||||
| 2025-11-26 | 13F/A | Jpmorgan Chase & Co | Put | 0 | -100,00 | 0 | -100,00 | |||
| 2026-02-09 | 13F | Mondrian Investment Partners LTD | 4.177 | 21,21 | 124 | 19,23 | ||||
| 2026-02-11 | 13F | Cerity Partners LLC | 214.699 | -1,94 | 6.398 | -3,34 | ||||
| 2026-04-22 | 13F | Continuum Advisory, LLC | 89.282 | 30,39 | 2.312 | 13,33 | ||||
| 2026-04-23 | 13F | CWM Advisors, LLC | 2.799 | 7,41 | 73 | -6,49 | ||||
| 2026-02-09 | 13F | Hartland & Co., LLC | 25.654 | -3,63 | 764 | -4,98 | ||||
| 2025-11-14 | 13F | Binnacle Investments Inc | 1.666 | 0,00 | 50 | -10,71 | ||||
| 2026-02-13 | 13F | American Century Companies Inc | 5.344.540 | -2,46 | 159.267 | -3,84 | ||||
| 2026-02-17 | 13F | Engineers Gate Manager LP | 219.917 | 6.554 | ||||||
| 2025-11-14 | 13F | Eqis Capital Management, Inc. | 0 | -100,00 | 0 | |||||
| 2026-02-13 | 13F | NLB Skladi, upravljanje premozenja, d.o.o. | 354.861 | 10.575 | ||||||
| 2026-04-09 | 13F | Nelson, Van Denburg & Campbell Wealth Management Group, LLC | 12.730 | 5,42 | 330 | -8,36 | ||||
| 2026-01-29 | 13F | Veracity Capital LLC | 0 | -100,00 | 0 | |||||
| 2026-02-03 | 13F | Crossmark Global Holdings, Inc. | 117.862 | 0,18 | 3.512 | -1,24 | ||||
| 2026-02-11 | 13F | Winton Capital Group Ltd | 14.500 | 432 | ||||||
| 2026-02-13 | 13F | First Trust Advisors Lp | 126.154 | -0,42 | 3.759 | -1,83 | ||||
| 2026-04-15 | 13F | Merit Financial Group, LLC | 22.207 | -0,43 | 575 | -13,40 | ||||
| 2026-02-11 | 13F | J.Safra Asset Management Corp | 2.386 | 71 | ||||||
| 2026-01-26 | 13F | Private Trust Co Na | 189 | 0,00 | 6 | 0,00 | ||||
| 2026-02-17 | 13F | Nearwater Capital Markets, Ltd | 180.300 | 0,00 | 5.373 | -1,43 | ||||
| 2026-01-30 | 13F | Valued Wealth Advisors LLC | 528 | 0,00 | 16 | 0,00 | ||||
| 2026-02-13 | 13F | Causeway Capital Management Llc | 477.060 | 7,29 | 14.216 | 5,76 | ||||
| 2026-01-30 | 13F/A | M&t Bank Corp | 318.884 | 33,25 | 9.503 | 31,37 | ||||
| 2026-02-13 | 13F | Marshall Wace, Llp | 2.945.850 | 11,07 | 87.786 | 9,49 | ||||
| 2026-01-30 | 13F | Catalytic Wealth RIA, LLC | 21.959 | 16,92 | 654 | 15,34 | ||||
| 2026-02-13 | 13F | Sei Investments Co | 3.270.143 | 50,66 | 97.450 | 48,52 | ||||
| 2026-02-17 | 13F | DV Trading LLC | 1.000 | 30 | ||||||
| 2026-02-12 | 13F | Sustainable Insight Capital Management, LLC | 10.835 | 18,61 | 323 | 16,67 | ||||
| 2025-10-29 | 13F | Triasima Portfolio Management inc. | 0 | -100,00 | 0 | -100,00 | ||||
| 2026-02-17 | 13F | Qube Research & Technologies Ltd | 2.222.699 | 67,09 | 66.236 | 64,72 | ||||
| 2026-02-13 | 13F | Storgate, LLC | 15.174 | 452 | ||||||
| 2026-02-13 | 13F | Macquarie Group Ltd | 0 | -100,00 | 0 | |||||
| 2026-04-14 | 13F | Perpetual Ltd | 106.248 | -90,73 | 2.752 | -91,95 | ||||
| 2025-11-14 | 13F | Flow Traders U.s. Llc | 0 | -100,00 | 0 | |||||
| 2026-02-17 | 13F | Voleon Capital Management Lp | 93.072 | -12,84 | 2.774 | -14,10 | ||||
| 2026-04-27 | 13F | Greenleaf Trust | 22.048 | -45,29 | 571 | -52,42 | ||||
| 2026-02-04 | 13F | Hallmark Capital Management Inc | 109 | 3 | ||||||
| 2026-02-11 | 13F | Capital Group Private Client Services, Inc. | 27.904 | -2,61 | 832 | -4,04 | ||||
| 2026-02-17 | 13F | Agf Management Ltd | 13.624 | -99,58 | 406 | -99,59 | ||||
| 2026-01-12 | 13F | Castleview Partners, Llc | 7.778 | 8,87 | 232 | 7,44 | ||||
| 2026-04-10 | 13F | Naviter Wealth, LLC | 55.081 | 6,75 | 1.427 | -7,22 | ||||
| 2026-01-28 | 13F | Geneos Wealth Management Inc. | 0 | -100,00 | 0 | -100,00 | ||||
| 2026-02-17 | 13F | Millennium Management Llc | 2.241.935 | -13,89 | 66.810 | -15,11 | ||||
| 2026-02-11 | 13F | United Financial Planning Group LLC | 329 | 10 | ||||||
| 2026-02-12 | 13F | Callan Family Office, LLC | 64.515 | 1.923 | ||||||
| 2026-02-17 | 13F | GAM Holding AG | 100.950 | 7,49 | 3.008 | 5,95 | ||||
| 2026-04-09 | 13F | Overbrook Management Corp | 0 | -100,00 | 0 | |||||
| 2026-04-20 | 13F | Banque Cantonale Vaudoise | 22.048 | -7,69 | 571 | -19,80 | ||||
| 2026-04-21 | 13F | Financial Consulate, Inc | 60 | 11,11 | 2 | 0,00 | ||||
| 2025-11-12 | 13F | NewSquare Capital LLC | 0 | -100,00 | 0 | |||||
| 2025-11-14 | 13F | Scientech Research LLC | 0 | -100,00 | 0 | -100,00 | ||||
| 2026-04-20 | 13F | Jfs Wealth Advisors, Llc | 2.253 | -18,66 | 58 | -29,27 | ||||
| 2026-02-10 | 13F | CIBC World Markets Inc. | 17.121 | 31,56 | 510 | 29,77 | ||||
| 2026-04-09 | 13F | Tompkins Financial Corp | 0 | -100,00 | 0 | |||||
| 2026-02-12 | 13F | DJE Kapital AG | 26.425 | -41,24 | 788 | -47,57 | ||||
| 2025-11-10 | 13F | Dakota Wealth Management | 0 | -100,00 | 0 | |||||
| 2026-04-15 | 13F | Riversedge Advisors, Llc | 0 | -100,00 | 0 | |||||
| 2026-02-02 | 13F | Principal Financial Group Inc | 1.768.169 | -2,94 | 52.691 | -4,32 | ||||
| 2026-02-12 | 13F | Skopos Labs, Inc. | 49.342 | 72,45 | 1.472 | 51,81 | ||||
| 2026-02-19 | 13F | CI Private Wealth, LLC | 104.424 | 7,86 | 3.109 | 6,22 | ||||
| 2026-02-09 | 13F | Coldstream Capital Management Inc | 58.493 | -25,86 | 1.743 | -26,92 | ||||
| 2026-04-07 | 13F | Park Avenue Securities Llc | 49.176 | -11,29 | 1 | 0,00 | ||||
| 2026-02-17 | 13F | Dv Equities, Llc | 400 | 12 | ||||||
| 2026-02-18 | 13F | GWM Advisors LLC | 21.318 | -5,16 | 635 | -6,48 | ||||
| 2026-04-24 | 13F | Carmel Capital Management L.L.C. | 211.000 | 5.465 | ||||||
| 2026-02-13 | 13F | FORA Capital, LLC | 124.022 | 162,86 | 3.696 | 159,12 | ||||
| 2026-02-02 | 13F | Equitable Trust Co | 88.088 | -0,58 | 2.625 | -1,98 | ||||
| 2026-02-03 | 13F | Ballentine Partners, LLC | 12.552 | 5,58 | 374 | 4,18 | ||||
| 2026-04-24 | 13F | TT International Asset Management LTD | 209.833 | -24,90 | 5.435 | 67.825,00 | ||||
| 2026-04-20 | 13F | North of South Capital LLP | 8.439.972 | 14,23 | 218.595 | -0,72 | ||||
| 2026-02-17 | 13F | Ancora Advisors, LLC | 5.594 | 1,71 | 167 | 0,00 | ||||
| 2026-02-12 | 13F | Dimensional Fund Advisors Lp | 11.733.336 | 1,17 | 349.660 | -0,27 | ||||
| 2026-02-13 | 13F | Umb Bank N A/mo | 5.375 | 11,38 | 160 | 10,34 | ||||
| 2026-02-17 | 13F | Two Sigma Securities, Llc | 0 | -100,00 | 0 | -100,00 | ||||
| 2026-02-13 | 13F | Bank Of Nova Scotia | 16.831 | 0,00 | 502 | -1,38 | ||||
| 2026-04-20 | 13F | White Oak Capital Partners Pte. Ltd. | 4.782.824 | -10,40 | 121.598 | -23,64 | ||||
| 2026-02-05 | 13F | May Hill Capital, LLC | 7.828 | -24,31 | 233 | -25,32 | ||||
| 2026-02-13 | 13F | Resources Investment Advisors, LLC. | 29.137 | -4,78 | 868 | -6,16 | ||||
| 2026-02-17 | 13F | Bayesian Capital Management, LP | 0 | -100,00 | 0 | |||||
| 2026-04-16 | 13F | E. Ohman J:or Asset Management AB | 1.256.149 | 8,65 | 32.534 | -5,57 | ||||
| 2026-04-21 | 13F | Vise Technologies, Inc. | 198.241 | 0,00 | 5.908 | 0,00 | ||||
| 2026-04-23 | 13F | Ameliora Wealth Management Ltd. | 1.000 | -63,64 | 26 | -69,14 | ||||
| 2025-11-14 | 13F | Wetherby Asset Management Inc | 130.430 | 0,94 | 3.943 | -9,30 | ||||
| 2026-04-02 | 13F | Ares Financial Consulting, LLC | 86 | 0,00 | 2 | 0,00 | ||||
| 2026-04-24 | 13F | Merited Wealth, LLC | 0 | -100,00 | 0 | |||||
| 2026-02-13 | 13F | Manufacturers Life Insurance Company, The | 0 | -100,00 | 0 | |||||
| 2026-02-12 | 13F | Loomis Sayles & Co L P | 320.073 | -17,93 | 9.538 | -19,09 | ||||
| 2026-02-13 | 13F | MAI Capital Management | 713 | -30,84 | 21 | -32,26 | ||||
| 2026-04-24 | 13F | Keybank National Association/oh | 19.949 | 76,34 | 517 | 53,12 | ||||
| 2026-02-13 | 13F | Blueshift Asset Management, LLC | 26.414 | 31,22 | 787 | 29,44 | ||||
| 2025-11-13 | 13F | Quantitative Investment Management, LLC | 0 | -100,00 | 0 | |||||
| 2026-02-17 | 13F | FACT Capital, LP | 431.346 | -14,69 | 12.854 | -15,90 | ||||
| 2026-02-13 | 13F | Walleye Capital LLC | 9.557 | 285 | ||||||
| 2026-02-17 | 13F | Alliancebernstein L.p. | 166.724 | 375,57 | 4.968 | 369,12 | ||||
| 2025-11-13 | 13F | Capital Fund Management S.a. | 0 | -100,00 | 0 | -100,00 | ||||
| 2026-02-10 | 13F | NS Partners Ltd | 38.800 | -88,16 | 1.156 | -88,33 | ||||
| 2026-02-05 | 13F | Allworth Financial LP | 2.595 | 2,94 | 77 | 1,32 | ||||
| 2025-11-13 | 13F | Capital Fund Management S.a. | Call | 0 | -100,00 | 0 | -100,00 | |||
| 2026-02-11 | 13F | Capital International Investors | 13.070.452 | -35,65 | 389.516 | -36,56 | ||||
| 2026-02-13 | 13F | Walleye Capital LLC | Call | 15.400 | 459 | |||||
| 2026-02-13 | 13F | Walleye Capital LLC | Put | 30.300 | 903 | |||||
| 2026-02-12 | 13F | Qtron Investments LLC | 0 | -100,00 | 0 | |||||
| 2026-02-17 | 13F | Citadel Advisors Llc | 2.920.105 | 677,30 | 87.019 | 666,28 | ||||
| 2026-02-17 | 13F | Citadel Advisors Llc | Put | 140.100 | 47,47 | 4.175 | 45,38 | |||
| 2026-02-17 | 13F | Citadel Advisors Llc | Call | 98.100 | -50,75 | 2.923 | -51,45 | |||
| 2026-04-14 | 13F | Nbc Securities, Inc. | 872 | -0,23 | 23 | -15,38 | ||||
| 2026-04-10 | 13F | Henry James International Management Inc. | 138.811 | -2,14 | 3.595 | -14,95 | ||||
| 2026-02-05 | 13F | Td Private Client Wealth Llc | 992 | 35,89 | 30 | 31,82 | ||||
| 2026-02-12 | 13F | Federated Hermes, Inc. | 69.277 | -47,17 | 2.064 | -47,93 | ||||
| 2026-02-17 | 13F | Bamco Inc /ny/ | 0 | -100,00 | 0 | |||||
| 2026-02-10 | 13F | EagleClaw Capital Managment, LLC | 19.250 | 0,00 | 574 | -1,38 | ||||
| 2026-02-17 | 13F | MIRAE ASSET GLOBAL ETFS HOLDINGS Ltd. | 349.848 | 11,55 | 10.425 | 9,97 | ||||
| 2026-01-29 | 13F | Sanctuary Advisors, LLC | 45.106 | -3,49 | 1.344 | -4,82 | ||||
| 2026-01-30 | 13F | R Squared Ltd | 33.679 | 136,11 | 1.004 | 132,71 | ||||
| 2026-02-11 | 13F | Prudential Plc | 725.100 | 7,25 | 21.644 | 5,90 | ||||
| 2026-02-13 | 13F | Rhumbline Advisers | 394.992 | -4,24 | 11.771 | -5,61 | ||||
| 2026-02-11 | 13F | Capital Wealth Planning, LLC | 198.300 | -45,45 | 5.947 | -45,89 | ||||
| 2026-02-17 | 13F | Quantinno Capital Management LP | 311.544 | 52,56 | 9.284 | 50,40 | ||||
| 2026-01-27 | 13F | TD Waterhouse Canada Inc. | 3.086 | 2,25 | 92 | -1,09 | ||||
| 2026-02-17 | 13F | EFG International AG | 823.406 | 24.558 | ||||||
| 2026-02-11 | 13F | Deutsche Bank Ag\ | 5.917.302 | 105,98 | 176.336 | 103,05 | ||||
| 2026-01-29 | 13F | IMC-Chicago, LLC | 16.353 | -37,36 | 487 | -38,28 | ||||
| 2026-02-17 | 13F | Harding Loevner Lp | 299.318 | 295,77 | 8.920 | 290,16 | ||||
| 2026-01-27 | 13F | WealthCollab, LLC | 2.958 | -5,04 | 88 | -6,38 | ||||
| 2026-01-29 | 13F | IMC-Chicago, LLC | Put | 49.500 | 27,25 | 1.475 | 25,53 | |||
| 2026-02-13 | 13F | Smartleaf Asset Management LLC | 7.031 | 3,64 | 210 | 1,95 | ||||
| 2026-02-13 | 13F | Acumen Wealth Advisors, LLC | 310 | 9 | ||||||
| 2026-01-29 | 13F | IMC-Chicago, LLC | Call | 49.000 | -47,31 | 1.460 | -48,06 | |||
| 2026-04-13 | 13F | Augustine Asset Management Inc | 371.263 | 0,22 | 9.616 | -12,90 | ||||
| 2026-02-04 | 13F | LRI Investments, LLC | 125 | 0,00 | 4 | 0,00 | ||||
| 2026-02-12 | 13F | Quadrant Capital Group Llc | 25.072 | -2,38 | 747 | -3,74 | ||||
| 2026-02-17 | 13F | Two Sigma Advisers, Lp | 1.234.000 | 10.357,63 | 36.773 | 10.229,49 | ||||
| 2026-02-03 | 13F | Manning & Napier Advisors Llc | 0 | -100,00 | 0 | |||||
| 2026-02-11 | 13F | O'shaughnessy Asset Management, Llc | 248.199 | -3,83 | 7.396 | -5,20 | ||||
| 2026-01-29 | 13F | Coronation Fund Managers Ltd. | 8.075 | 8,94 | 241 | 7,14 | ||||
| 2026-02-10 | 13F | FDx Advisors, Inc. | 0 | -100,00 | 0 | |||||
| 2025-11-14 | 13F | Wolverine Trading, Llc | 10.206 | -49,46 | 309 | -54,76 | ||||
| 2026-01-23 | 13F | LOM Asset Management Ltd | 1.600 | 0,00 | 48 | -2,08 | ||||
| 2026-02-02 | 13F | Core Alternative Capital | 400 | 0,00 | 12 | -8,33 | ||||
| 2025-11-14 | 13F | Wolverine Trading, Llc | Call | 48.800 | -6,15 | 1.479 | -16,01 | |||
| 2026-02-09 | 13F | Knights of Columbus Asset Advisors LLC | 6.737 | 0,00 | 201 | -1,48 | ||||
| 2026-03-20 | 13F/A | Hsbc Holdings Plc | Call | 51.000 | 0,20 | 1.518 | -1,11 | |||
| 2026-02-17 | 13F/A | Northwest & Ethical Investments L.P. | 117.250 | -6,76 | 3.494 | -8,08 | ||||
| 2026-03-20 | 13F/A | Hsbc Holdings Plc | 3.607.553 | -45,78 | 111.214 | -45,61 | ||||
| 2026-02-02 | 13F | Benjamin Edwards Inc | 12.511 | 34,57 | 373 | 32,38 | ||||
| 2026-01-27 | 13F | Asset Management One Co., Ltd. | 142.443 | 0,00 | 4.249 | -1,32 | ||||
| 2026-03-20 | 13F/A | Hsbc Holdings Plc | Put | 47.800 | 214,47 | 1.423 | 210,48 | |||
| 2026-02-13 | 13F | Charles-Lim Capital Ltd | 1.625.000 | -27,78 | 48.425 | -28,80 | ||||
| 2026-02-12 | 13F | Integrated Quantitative Investments LLC | 0 | -100,00 | 0 | -100,00 | ||||
| 2026-02-12 | 13F | CIBC Private Wealth Group, LLC | 3.416 | -3,37 | 102 | -4,72 | ||||
| 2026-02-11 | 13F | Axiom International Investors Llc /de | 1.840.970 | -63,75 | 54.861 | -64,26 | ||||
| 2026-02-09 | 13F | Fisher Asset Management, LLC | 1.783.698 | 16,21 | 53.154 | 14,56 | ||||
| 2026-02-10 | 13F | Connor, Clark & Lunn Investment Management Ltd. | 3.150.236 | 8,05 | 93.877 | 6,52 | ||||
| 2026-01-26 | 13F | Moran Wealth Management, LLC | 153.800 | 11,56 | 4.583 | 9,98 | ||||
| 2026-02-17 | 13F | Delaware Management Holdings, Inc. | 179.191 | 5.339 | ||||||
| 2026-02-12 | 13F | Nuveen, LLC | 34.473 | -3,69 | 1.027 | -5,00 | ||||
| 2026-02-12 | 13F | Hrt Financial Lp | 399.154 | 83,40 | 12 | 83,33 | ||||
| 2026-04-07 | 13F | Signaturefd, Llc | 47.812 | -0,06 | 1.238 | -13,12 | ||||
| 2026-02-09 | 13F | Endowment Wealth Management, Inc. | 0 | -100,00 | 0 | |||||
| 2026-01-26 | 13F | Haven Global Partners, LLC | 640.656 | 13,90 | 19.092 | 12,27 | ||||
| 2026-01-27 | 13F | First Horizon Corp | 2.273 | 1,84 | 68 | 0,00 | ||||
| 2026-02-06 | 13F | Envestnet Portfolio Solutions, Inc. | 44.851 | -6,04 | 1.337 | -7,35 | ||||
| 2026-03-04 | 13F | Rehmann Capital Advisory Group | 8.692 | -4,80 | 259 | -6,16 | ||||
| 2026-02-17 | 13F | Ameriprise Financial Inc | 2.888.945 | -15,53 | 86.091 | -16,73 | ||||
| 2026-02-17 | 13F | D. E. Shaw & Co., Inc. | 5.920.209 | 21.119,39 | 176.422 | 20.827,88 | ||||
| 2026-02-12 | 13F | Earnest Partners Llc | 4.518.979 | 9,80 | 134.666 | 8,23 | ||||
| 2026-02-24 | 13F | DGS Capital Management, LLC | 9.016 | -17,23 | 269 | -18,54 | ||||
| 2026-04-23 | 13F | Lansforsakringar Fondforvaltning AB (publ) | 9.845 | -77,68 | 255 | -80,67 | ||||
| 2026-04-27 | 13F | Ethic Inc. | 270.401 | -3,87 | 7.003 | -16,45 | ||||
| 2026-04-27 | 13F | Mount Yale Investment Advisors, LLC | 69.359 | 321,23 | 1.796 | 266,53 | ||||
| 2026-04-08 | 13F | DiNuzzo Private Wealth, Inc. | 550 | 0,00 | 14 | -12,50 | ||||
| 2026-04-06 | 13F | Versant Capital Management, Inc | 168 | 15,86 | 4 | 0,00 | ||||
| 2026-02-13 | 13F | Capula Management Ltd | 0 | -100,00 | 0 | |||||
| 2026-04-27 | 13F | Albion Financial Group /ut | 176 | 0,00 | 5 | -20,00 | ||||
| 2026-01-22 | 13F | Personal Cfo Solutions, Llc | 30.772 | 2,09 | 917 | 0,55 | ||||
| 2026-02-13 | 13F | Barclays Plc | 386.815 | 2,39 | 11.527 | 0,94 | ||||
| 2026-02-12 | 13F | Dsm Capital Partners Llc | 179.445 | -17,14 | 5.347 | -18,33 | ||||
| 2026-02-17 | 13F | Susquehanna International Group, Llp | Call | 120.000 | -66,80 | 3.576 | -67,28 | |||
| 2026-02-06 | 13F | Milestone Resources Group Ltd | 7.890.422 | 0,00 | 235 | -1,26 | ||||
| 2026-02-17 | 13F | Susquehanna International Group, Llp | 127.615 | -42,89 | 3.803 | -43,71 | ||||
| 2026-02-04 | 13F | C WorldWide Group Holding A/S | 1.992.068 | -17,28 | 59 | -18,06 | ||||
| 2026-02-13 | 13F | Glen Eagle Advisors, LLC | 2.300 | 0,00 | 69 | -1,45 | ||||
| 2026-02-17 | 13F | Susquehanna International Group, Llp | Put | 72.900 | 57,11 | 2.172 | 54,92 | |||
| 2026-04-13 | 13F | Highland Capital Management, Llc | 28.850 | -0,17 | 747 | -13,24 | ||||
| 2026-01-16 | 13F | Empirical Financial Services, LLC d.b.a. Empirical Wealth Management | 18.102 | 44,54 | 539 | 42,59 | ||||
| 2026-04-20 | 13F | Ritholtz Wealth Management | 42.766 | -11,63 | 1.108 | -23,23 | ||||
| 2026-02-13 | 13F | Pinpoint Asset Management (Singapore) Pte. Ltd. | 0 | -100,00 | 0 | |||||
| 2026-02-12 | 13F | XY Capital Ltd | 36.193 | -54,36 | 1.079 | -55,03 | ||||
| 2026-01-29 | 13F | Calamos Advisors LLC | 0 | -100,00 | 0 | |||||
| 2026-02-06 | 13F | Americana Partners, LLC | 16.341 | -4,14 | 487 | -5,63 | ||||
| 2026-02-11 | 13F | Buckingham Strategic Partners | 26.772 | -11,72 | 798 | -13,09 | ||||
| 2026-02-13 | 13F | Mariner, LLC | 94.021 | -0,19 | 2.804 | -1,55 | ||||
| 2026-02-02 | 13F | Your Advocates Ltd., LLP | 30 | 0,00 | 1 | |||||
| 2026-02-13 | 13F | Cloverfields Capital Group, Lp | 45.368 | 1,41 | 1.352 | -0,07 | ||||
| 2026-02-13 | 13F | Toroso Investments, LLC | 256.574 | -1,16 | 7.646 | -2,57 | ||||
| 2026-04-22 | 13F | Border to Coast Pensions Partnership Ltd | 877.715 | 12,50 | 23 | -4,35 | ||||
| 2026-02-17 | 13F | LMR Partners LLP | 2.666.414 | 431,44 | 79.459 | 423,89 | ||||
| 2026-02-11 | 13F | OPTIMAS CAPITAL Ltd | 55.000 | 1.639 | ||||||
| 2026-04-20 | 13F | Assenagon Asset Management S.A. | 1.146.817 | -5,68 | 29.703 | -18,02 | ||||
| 2026-02-11 | 13F | Fox Run Management, L.l.c. | 12.790 | -27,89 | 381 | -28,92 | ||||
| 2026-02-13 | 13F | Neuberger Berman Group LLC | 498.364 | -6,13 | 14.854 | -7,48 | ||||
| 2025-11-14 | 13F | Moors & Cabot, Inc. | 0 | -100,00 | 0 | -100,00 | ||||
| 2026-04-24 | 13F | Ninety One North America, Inc. | 647.806 | 11,30 | 16.778 | -3,26 | ||||
| 2026-01-15 | 13F | Frank, Rimerman Advisors LLC | 86.915 | 0,00 | 2.590 | -1,41 | ||||
| 2026-02-17 | 13F | Royal Bank Of Canada | 1.325.420 | -83,42 | 39.499 | -83,65 | ||||
| 2026-02-17 | 13F | Graham Capital Management, L.P. | 35.129 | 1.047 | ||||||
| 2026-04-24 | 13F | Deprince Race & Zollo Inc | 462.784 | 25,77 | 11.986 | 9,32 | ||||
| 2026-02-12 | 13F | Ci Investments Inc. | 0 | -100,00 | 0 | -100,00 | ||||
| 2026-04-16 | 13F | Stanley-Laman Group, Ltd. | 0 | -100,00 | 0 | -100,00 | ||||
| 2026-02-11 | 13F | Letko, Brosseau & Associates Inc | 427.852 | -2,26 | 12.750 | -3,66 | ||||
| 2026-02-12 | 13F | Raiffeisen Bank International AG | 0 | -100,00 | 0 | |||||
| 2026-03-03 | 13F/A | Caitong International Asset Management Co., Ltd | 14.703 | 34.093,02 | 438 | 43.700,00 | ||||
| 2026-04-08 | 13F | Legacy Wealth Asset Management, LLC | 71.503 | -1,80 | 1.852 | -14,66 | ||||
| 2026-04-08 | 13F | Seed Wealth Management, Inc. | 21.030 | -0,02 | 545 | -13,10 | ||||
| 2026-02-11 | 13F | West Family Investments, Inc. | 52.750 | -3,34 | 1.572 | -4,73 | ||||
| 2026-02-11 | 13F | BI Asset Management Fondsmaeglerselskab A/S | 0 | -100,00 | 0 | |||||
| 2026-02-12 | 13F | Brown Brothers Harriman & Co | 2.432 | 32,32 | 72 | 30,91 | ||||
| 2026-02-14 | 13F | Militia Capital Partners, LP | 7.000 | 209 | ||||||
| 2026-02-17 | 13F | Summit Trail Advisors, Llc | 0 | -100,00 | 0 | |||||
| 2025-11-20 | 13F | First Affirmative Financial Network | 11.304 | 1,55 | 342 | -8,82 | ||||
| 2026-01-29 | 13F | Matthews International Capital Management Llc | 369.492 | -0,08 | 11.011 | -1,50 | ||||
| 2026-01-29 | 13F | Vanguard Group Inc | 960.233 | -1,85 | 28.615 | -3,25 | ||||
| 2026-02-12 | 13F | Polen Capital Management Llc | 0 | -100,00 | 0 | |||||
| 2026-02-04 | 13F | Ameritas Advisory Services, LLC | 0 | -100,00 | 0 | |||||
| 2026-03-03 | 13F/A | Ovata Capital Management Ltd | 144.100 | 4.306 | ||||||
| 2026-02-14 | 13F | Rockefeller Capital Management L.P. | 2.386.011 | -22,47 | 71.103 | -23,57 | ||||
| 2026-03-12 | 13F/A | Peak6 Llc | Put | 27.400 | -41,45 | 817 | -42,29 | |||
| 2026-03-12 | 13F/A | Peak6 Llc | Call | 55.000 | 547,06 | 1.639 | 540,23 | |||
| 2026-01-29 | 13F | Calamos Wealth Management LLC | 0 | -100,00 | 0 | |||||
| 2026-03-12 | 13F/A | Peak6 Llc | 11.544 | -11,32 | 344 | -12,47 | ||||
| 2025-11-07 | 13F | Pzena Investment Management Llc | 0 | -100,00 | 0 | -100,00 | ||||
| 2026-04-22 | 13F | Janney Montgomery Scott LLC | 33.856 | 21,59 | 1 | |||||
| 2026-01-28 | 13F | B. Metzler seel. Sohn & Co. AG | 54.869 | 5,05 | 1.635 | 3,61 | ||||
| 2026-02-13 | 13F | Cornerstone Financial Management LLC | 406 | 12 | ||||||
| 2026-02-17 | 13F | Man Group plc | 9.070.256 | 34,60 | 270.294 | 32,68 | ||||
| 2026-02-11 | 13F | Capital International Ltd /ca/ | 364.069 | -16,91 | 10.849 | -18,09 | ||||
| 2026-02-12 | 13F | Alps Advisors Inc | 835.000 | 0,00 | 24.883 | -1,42 | ||||
| 2026-02-18 | 13F | Guardian Capital Lp | 478.281 | 1,81 | 14.253 | 0,36 | ||||
| 2026-02-13 | 13F | SRS Capital Advisors, Inc. | 16.823 | 92,20 | 501 | 89,77 | ||||
| 2026-04-15 | 13F | Cranbrook Wealth Management, LLC | 53 | 0,00 | 1 | 0,00 | ||||
| 2026-02-18 | 13F | Mackenzie Financial Corp | 1.220.907 | -12,31 | 36.372 | -13,58 | ||||
| 2026-01-29 | 13F | D.a. Davidson & Co. | 7.847 | -0,95 | 234 | -2,51 | ||||
| 2026-02-17 | 13F | Guggenheim Capital Llc | 50.359 | 5,07 | 1.501 | 3,59 | ||||
| 2025-11-14 | 13F | Parallax Volatility Advisers, L.P. | Call | 0 | -100,00 | 0 | -100,00 | |||
| 2026-02-11 | 13F | Longfellow Investment Management Co Llc | 81.992 | -5,27 | 2.443 | -6,61 | ||||
| 2026-04-16 | 13F | CogentBlue Wealth Advisors, LLC | 18.049 | -12,16 | 467 | -23,69 | ||||
| 2026-04-21 | 13F | Robeco Institutional Asset Management B.V. | 19.838.697 | 6,20 | 513.822 | -7,70 | ||||
| 2026-02-14 | 13F | Frec Markets, Inc. | 8.669 | 258 | ||||||
| 2026-02-17 | 13F | Creative Planning | 42.372 | -17,93 | 1.263 | -19,10 | ||||
| 2026-02-17 | 13F | Edmond De Rothschild Holding S.a. | 890.335 | 6,86 | 26.532 | 5,34 | ||||
| 2025-11-07 | 13F | Beacon Capital Management, LLC | 0 | -100,00 | 0 | |||||
| 2026-02-10 | 13F | State of Wyoming | 25.342 | -2,58 | 755 | -3,94 | ||||
| 2026-04-14 | 13F | Clean Yield Group | 244 | 0,00 | 6 | -14,29 | ||||
| 2026-02-13 | 13F | Aigen Investment Management, Lp | 0 | -100,00 | 0 | |||||
| 2025-11-14 | 13F | Point72 Hong Kong Ltd | 0 | -100,00 | 0 | -100,00 | ||||
| 2026-02-06 | 13F | Carrhae Capital LLP | 1.992.766 | -50,21 | 59.384 | -50,92 | ||||
| 2026-04-24 | 13F | Yousif Capital Management, Llc | 18.744 | -31,69 | 485 | -40,05 | ||||
| 2026-02-09 | 13F | Geode Capital Management, Llc | 16.170 | -6,42 | 482 | -7,85 | ||||
| 2026-02-13 | 13F | Bridgefront Capital, LLC | 21.346 | 636 | ||||||
| 2026-02-17 | 13F | Advisor Group Holdings, Inc. | 40.551 | -38,25 | 1.209 | -39,24 | ||||
| 2026-01-08 | 13F | Tuttle Tactical Management LLC | 14.569 | 434 | ||||||
| 2026-02-10 | 13F | Operose Advisors LLC | 0 | -100,00 | 0 | -100,00 | ||||
| 2026-02-17 | 13F | Principal Street Partners, LLC | 7.600 | -3,92 | 226 | -5,44 | ||||
| 2026-02-17 | 13F | Price T Rowe Associates Inc /md/ | 6.774.963 | 0,33 | 202 | -1,47 | ||||
| 2026-02-03 | 13F | Garner Asset Management Corp | 3.942 | 117 | ||||||
| 2026-02-10 | 13F | Goldman Sachs Group Inc | 9.638.869 | 52,09 | 287.238 | 49,92 | ||||
| 2026-02-17 | 13F | Shelton Capital Management | 15.723 | -14,19 | 469 | -15,37 | ||||
| 2026-02-10 | 13F | Goldman Sachs Group Inc | Call | 120.000 | 0,00 | 3.576 | -1,41 | |||
| 2026-04-27 | 13F | BSN Capital Partners Ltd | 1.150.000 | 0,00 | 34.845 | 0,00 | ||||
| 2026-04-06 | 13F | Rosenberg Matthew Hamilton | 9.633 | 0,00 | 249 | -13,24 | ||||
| 2026-02-17 | 13F | Amundi | 1.073.325 | -1,73 | 31.985 | -4,74 | ||||
| 2026-02-12 | 13F | Barings Llc | 10.724 | 7,63 | 320 | 5,98 | ||||
| 2026-02-10 | 13F | Daiwa Securities Group Inc. | 4.862.631 | 4,66 | 145 | -21,74 | ||||
| 2026-02-09 | 13F | Employees Retirement System of Texas | 139.859 | -47,61 | 4 | -50,00 | ||||
| 2026-02-19 | 13F | Invesco Ltd. | 21.643.517 | -7,54 | 644.977 | -8,85 | ||||
| 2026-02-17 | 13F | Tower Research Capital LLC (TRC) | 300 | -93,94 | 9 | -94,63 | ||||
| 2025-11-06 | 13F | Mitchell Capital Management Co | 0 | -100,00 | 0 | |||||
| 2026-02-17 | 13F | Snowden Capital Advisors LLC | 43.606 | -3,30 | 1.299 | -4,70 | ||||
| 2026-02-17 | 13F | Fred Alger Management, Llc | 20.633 | -94,33 | 615 | -94,42 | ||||
| 2026-02-06 | 13F | Handelsbanken Fonder AB | 67.467 | 19,66 | 2 | 100,00 | ||||
| 2026-02-02 | 13F | Pittenger & Anderson Inc | 148.345 | -0,20 | 4.421 | -1,62 | ||||
| 2026-01-20 | 13F | Sovran Advisors, LLC | 13.598 | 93,07 | 419 | 93,98 | ||||
| 2026-02-23 | 13F | Beaird Harris Wealth Management, LLC | 0 | -100,00 | 0 | |||||
| 2026-04-14 | 13F | BSW Wealth Partners | 31.853 | 13,04 | 825 | -1,79 | ||||
| 2026-02-10 | 13F | Fideuram Asset Management (Ireland) dac | 2.630 | 79 | ||||||
| 2026-02-12 | 13F | Hollencrest Capital Management | 0 | -100,00 | 0 | |||||
| 2026-04-07 | 13F | Farther Finance Advisors, LLC | 16.663 | 91,42 | 429 | 65,25 | ||||
| 2026-01-30 | 13F | Laurel Wealth Advisors LLC | 102 | 3 | ||||||
| 2026-02-17 | 13F | HighVista Strategies LLC | 26.284 | -29,05 | 783 | -30,03 | ||||
| 2026-01-15 | 13F | J. Safra Sarasin Holding AG | 0 | -100,00 | 0 | |||||
| 2026-02-09 | 13F | Choate Investment Advisors | 7.717 | 0,00 | 230 | -1,72 | ||||
| 2026-02-11 | 13F | Group One Trading, L.p. | Put | 89.100 | -7,67 | 2.655 | -8,98 | |||
| 2025-11-14 | 13F | Axa S.a. | 0 | -100,00 | 0 | |||||
| 2026-02-11 | 13F | Group One Trading, L.p. | Call | 101.600 | -9,20 | 3.028 | -10,50 | |||
| 2026-02-23 | 13F | Virtu Financial LLC | 54.705 | 92,49 | 2 | |||||
| 2026-02-17 | 13F | Herold Advisors, Inc. | 28.950 | 0,00 | 863 | -1,49 | ||||
| 2026-02-17 | 13F | Raymond James Financial Inc | 735.389 | 4,63 | 21.915 | 3,14 | ||||
| 2026-02-09 | 13F | Main Street Research LLC | 1.022.131 | -2,83 | 30.460 | -4,21 | ||||
| 2026-02-10 | 13F | Bruce G. Allen Investments, LLC | 1.466 | -6,27 | 44 | -8,51 | ||||
| 2025-11-04 | 13F | Veritas Asset Management LLP | 0 | -100,00 | 0 | -100,00 | ||||
| 2025-11-05 | 13F | First National Bank of Hutchinson | 0 | -100,00 | 0 | |||||
| 2026-04-15 | 13F | Fortitude Family Office, LLC | 222 | 0,00 | 6 | -16,67 | ||||
| 2025-10-31 | 13F | Whittier Trust Co | 0 | -100,00 | 0 | -100,00 | ||||
| 2026-02-09 | 13F | William Blair Investment Management, Llc | 1.605.841 | -15,37 | 47.840 | -16,59 | ||||
| 2026-04-23 | 13F | North Star Investment Management Corp. | 164 | 4 | ||||||
| 2026-04-23 | 13F | McMillan Office, Inc. | 1.650 | 0,00 | 43 | -14,29 | ||||
| 2026-02-11 | 13F | Capital International Sarl | 403.334 | -17,87 | 12.019 | -19,04 | ||||
| 2026-02-17 | 13F | Glenmede Trust Co Na | 57.668 | -4,52 | 1.719 | -9,72 | ||||
| 2026-02-10 | 13F | Bank of New York Mellon Corp | 575.611 | -36,98 | 17.153 | -37,88 | ||||
| 2026-01-26 | 13F | Asset Dedication, LLC | 1.092 | 0,00 | 33 | -3,03 | ||||
| 2026-02-12 | 13F | M&G Plc | 186.848 | 50,82 | 5.605 | 50,83 | ||||
| 2026-02-13 | 13F | Atlas Capital Advisors Llc | 1.319 | -13,22 | 39 | -23,53 | ||||
| 2025-11-10 | 13F | Cary Street Partners Financial Llc | 0 | -100,00 | 0 | |||||
| 2026-04-21 | 13F | Venturi Wealth Management, LLC | 18.602 | -21,01 | 482 | -31,38 | ||||
| 2026-01-29 | 13F | Sava Infond d.o.o. | 61.700 | 0,00 | 1.839 | -1,45 | ||||
| 2026-02-03 | 13F | Crestwood Advisors Group LLC | 10.092 | 301 | ||||||
| 2026-02-10 | 13F | Triglav Skladi, D.o.o. | 81.379 | 28,41 | 2.425 | 26,63 | ||||
| 2026-02-12 | 13F | Brinker Capital Investments, LLC | 145.491 | 2,93 | 4.336 | 1,47 | ||||
| 2026-04-22 | 13F | ABN AMRO Bank N.V. | 26.000 | 0,00 | 676 | -12,32 | ||||
| 2026-02-13 | 13F | Gts Securities Llc | 102.623 | 43,17 | 3.058 | 41,18 | ||||
| 2026-02-09 | 13F | Cary Street Partner Investment Advisory Llc | 0 | -100,00 | 0 | |||||
| 2026-02-12 | 13F | Commonwealth Equity Services, Llc | 16.128 | 13,61 | 481 | |||||
| 2026-02-17 | 13F | SageView Advisory Group, LLC | 758 | 23 | ||||||
| 2026-04-20 | 13F | Ronald Blue Trust, Inc. | 48.630 | -8,41 | 1.260 | -20,42 | ||||
| 2026-02-11 | 13F | LPL Financial LLC | 494.043 | 10,79 | 14.722 | 9,21 | ||||
| 2026-04-14 | 13F | Banque Pictet & Cie Sa | 110.397 | 2,71 | 2.859 | -10,74 | ||||
| 2026-02-04 | 13F | Aubrey Capital Management Ltd | 8.600 | -98,04 | 256 | -98,07 | ||||
| 2026-02-13 | 13F | JustInvest LLC | 281.752 | 11,51 | 8.396 | 9,92 | ||||
| 2026-01-30 | 13F | Bogart Wealth, LLC | 11 | -90,35 | 0 | -100,00 | ||||
| 2026-02-11 | 13F | Syon Capital Llc | 9.433 | 281 | ||||||
| 2026-01-14 | 13F | ORG Wealth Partners, LLC | 717 | 0,00 | 21 | 0,00 | ||||
| 2026-02-03 | 13F | Mitsubishi UFJ Kokusai Asset Management Co., Ltd. | 0 | -100,00 | 0 | |||||
| 2026-02-10 | 13F | Jupiter Asset Management Ltd | 73.045 | -65,54 | 2.177 | -66,04 | ||||
| 2026-01-30 | 13F | Amansa Capital Pte. Ltd. | 5.000.000 | -16,67 | 149.000 | -17,85 | ||||
| 2026-02-09 | 13F | Hantz Financial Services, Inc. | 67.544 | 12,01 | 2 | 100,00 | ||||
| 2025-11-04 | 13F/A | Lingohr & Partner Asset Management GmbH | 48.000 | 1 | ||||||
| 2026-02-17 | 13F | Fmr Llc | 2.262.454 | -1,00 | 67.421 | -2,41 | ||||
| 2026-04-20 | 13F | Foster Victor Wealth Advisors, LLC | 18.380 | 32,47 | 520 | 21,26 | ||||
| 2025-11-07 | 13F | Sierra Ocean, Llc | 0 | -100,00 | 0 | |||||
| 2026-02-13 | 13F | Templeton & Phillips Capital Management, LLC | 0 | -100,00 | 0 | |||||
| 2026-02-13 | 13F | Dai-Ichi Life Insurance Company, Ltd | 16.400 | 0,00 | 489 | -1,41 | ||||
| 2026-04-21 | 13F | SmartHarvest Portfolios, LLC | 0 | -100,00 | 0 | |||||
| 2026-01-29 | 13F | Verdence Capital Advisors LLC | 20.498 | -1,69 | 611 | -6,01 | ||||
| 2026-04-27 | 13F | Nvwm, Llc | 31.519 | 122,88 | 816 | 93,82 | ||||
| 2026-02-12 | 13F | Xponance, Inc. | 11.271 | 5,55 | 336 | 4,04 | ||||
| 2026-02-17 | 13F | Opal Capital Llc | 29.760 | 887 | ||||||
| 2026-02-13 | 13F | Pinnacle Wealth Planning Services, Inc. | 20.074 | -0,18 | 598 | -1,48 | ||||
| 2026-02-13 | 13F | Corient IA LLC | 0 | -100,00 | 0 | |||||
| 2026-02-17 | 13F | Cetera Investment Advisers | 114.558 | 0,40 | 3.414 | -1,04 | ||||
| 2026-02-17 | 13F | Cresset Asset Management, LLC | 17.989 | 11,67 | 536 | 10,29 | ||||
| 2026-04-21 | 13F | GHP Investment Advisors, Inc. | 13.300 | 0,00 | 344 | -13,13 | ||||
| 2026-02-13 | 13F | State Street Corp | 8.345.467 | -1,29 | 248.695 | -2,70 | ||||
| 2026-02-06 | 13F | Cullen/frost Bankers, Inc. | 1.709 | 40,08 | 51 | 38,89 | ||||
| 2026-02-12 | 13F | Renaissance Technologies Llc | 0 | -100,00 | 0 | |||||
| 2026-02-06 | 13F | EverSource Wealth Advisors, LLC | 16.609 | 0,42 | 495 | -1,20 | ||||
| 2026-04-08 | 13F | High Point Wealth Management, LLC | 275 | 7 | ||||||
| 2026-02-12 | 13F | Custom Index Systems, Llc | 14.015 | 0,00 | 418 | -1,42 | ||||
| 2026-02-04 | 13F | Wsfs Capital Management, Llc | 10.085 | 6,71 | 301 | 5,26 | ||||
| 2025-10-30 | 13F | Twin Peaks Wealth Advisors, LLC | 0 | -100,00 | 0 | |||||
| 2026-02-13 | 13F | Motiv8 Investments LLC | 83 | 0 | ||||||
| 2026-02-18 | 13F | SkyView Investment Advisors, LLC | 21.746 | -0,79 | 1 | |||||
| 2026-04-24 | 13F | Ninety One UK Ltd | 9.651.781 | 3,36 | 249.981 | -10,17 | ||||
| 2026-02-13 | 13F | Black Creek Investment Management Inc. | 34.683 | -59,09 | 1.034 | -59,68 | ||||
| 2025-11-14 | 13F | PineBridge Investments, L.P. | 959.750 | -1,03 | 29.013 | -11,06 | ||||
| 2026-02-17 | 13F | FIL Ltd | 7.481.727 | -30,80 | 222.955 | -31,79 | ||||
| 2025-11-12 | 13F | Victory Capital Management Inc | 0 | -100,00 | 0 | |||||
| 2026-02-06 | 13F | Abn Amro Investment Solutions | 64.084 | -30,63 | 1.910 | -31,63 | ||||
| 2026-02-12 | 13F/A | Pinebridge Investments Llc | 12.850 | 383 | ||||||
| 2026-02-13 | 13F | Ieq Capital, Llc | 86.582 | -1,11 | 2.580 | -2,49 | ||||
| 2026-04-15 | 13F | Journey Strategic Wealth Llc | 8.132 | -5,45 | 211 | -17,97 | ||||
| 2025-11-04 | 13F | High Note Wealth, LLC | 0 | -100,00 | 0 | |||||
| 2026-02-03 | 13F | We Are One Seven, LLC | 7.493 | 223 | ||||||
| 2026-02-11 | 13F | Crestwood Capital Management, L.P. | 678.900 | 0,00 | 20.231 | -1,42 | ||||
| 2026-02-17 | 13F | Mercer Global Advisors Inc /adv | 26.139 | 3,30 | 779 | 1,83 | ||||
| 2025-11-13 | 13F | Riggs Asset Managment Co. Inc. | 0 | -100,00 | 0 | |||||
| 2026-04-24 | 13F | UMA Financial Services, Inc. | 20 | -87,34 | 1 | -100,00 | ||||
| 2026-02-06 | 13F | Alan B. Lancz & Associates, Inc. | 17.655 | 0,00 | 526 | -1,31 | ||||
| 2026-04-01 | 13F | Confluence Investment Management Llc | 10.957 | 3,36 | 284 | -10,16 | ||||
| 2025-10-30 | 13F | Jennison Associates Llc | 0 | -100,00 | 0 | |||||
| 2026-01-15 | 13F | BTC Capital Management, Inc. | 0 | -100,00 | 0 | |||||
| 2026-04-14 | 13F | Pictet & Cie (Europe) SA | 45.906 | -2,94 | 1.189 | -15,68 | ||||
| 2026-01-29 | 13F | Quest 10 Wealth Builders, Inc. | 0 | -100,00 | 0 | |||||
| 2026-01-28 | 13F | Oversea-Chinese Banking CORP Ltd | 345.647 | 128,61 | 10.295 | 125,27 | ||||
| 2026-02-13 | 13F | National Bank Of Canada /fi/ | 3.646.451 | -16,30 | 108.664 | -17,49 | ||||
| 2026-04-22 | 13F | Bravera Wealth | 0 | -100,00 | 0 | |||||
| 2025-10-28 | 13F | Richardson Financial Services Inc. | 0 | -100,00 | 0 | |||||
| 2026-02-12 | 13F | Cloud Capital Management, LLC | 0 | -100,00 | 0 | |||||
| 2026-02-05 | 13F | Center for Financial Planning, Inc. | 371 | 0,00 | 11 | 0,00 | ||||
| 2026-02-13 | 13F | Morgan Stanley | 53.772.858 | 7,98 | 1.602.431 | 6,45 | ||||
| 2026-04-16 | 13F | Diversified Trust Co | 0 | -100,00 | 0 | -100,00 | ||||
| 2026-04-17 | 13F | AdvisorNet Financial, Inc | 466 | -26,50 | 12 | -33,33 | ||||
| 2026-02-14 | 13F | Whipplewood Advisors, LLC | 125 | 4 | ||||||
| 2026-02-12 | 13F | Advisors Asset Management, Inc. | 0 | -100,00 | 0 | |||||
| 2026-02-13 | 13F | Strategic Global Advisors, LLC | 13.660 | 38,26 | 407 | 36,58 | ||||
| 2026-01-15 | 13F | Nisa Investment Advisors, Llc | 229 | 7 | ||||||
| 2026-02-06 | 13F | Larson Financial Group LLC | 831 | 855,17 | 25 | 1.100,00 | ||||
| 2025-11-14 | 13F | Oxbow Capital Management (HK) Ltd | 0 | -100,00 | 0 | |||||
| 2025-11-14 | 13F | EFG Asset Management (Americas) Corp. | 46.922 | 0,29 | 1.418 | -9,85 | ||||
| 2026-02-11 | 13F | Allianz Asset Management GmbH | 479.312 | -34,91 | 14.283 | -35,84 | ||||
| 2026-02-12 | 13F | Douglass Winthrop Advisors, LLC | 10.862 | -0,06 | 324 | -1,52 | ||||
| 2026-02-17 | 13F | Aquatic Capital Management LLC | 246.527 | 7.347 | ||||||
| 2026-02-02 | 13F | Fifth Third Bancorp | 1.366 | 4,51 | 41 | 2,56 | ||||
| 2026-02-17 | 13F | Cape Investment Advisory, Inc. | 216 | -0,46 | 6 | 0,00 | ||||
| 2026-02-17 | 13F | Credit Agricole S A | 646.829 | 118,77 | 19.276 | 115,65 | ||||
| 2026-04-17 | 13F | Murphy & Mullick Capital Management Corp | 2.530 | 0,00 | 66 | -13,33 | ||||
| 2026-01-16 | 13F | Crewe Advisors LLC | 118 | 32,58 | 4 | 50,00 | ||||
| 2026-02-10 | 13F | Quantbot Technologies LP | 64.354 | 1.918 | ||||||
| 2025-11-12 | 13F | Accuvest Global Advisors | 0 | -100,00 | 0 | |||||
| 2025-11-13 | 13F | Change Path, LLC | 0 | -100,00 | 0 | |||||
| 2026-02-12 | 13F | Wealthspire Advisors, LLC | 0 | -100,00 | 0 | |||||
| 2026-04-14 | 13F | Opal Wealth Advisors, LLC | 3.280 | 85 | ||||||
| 2026-02-13 | 13F | Cullen Capital Management, LLC | 1.747.387 | 1,02 | 52.072 | -0,42 | ||||
| 2026-02-17 | 13F | Quadrature Capital Ltd | 333.495 | 9.938 | ||||||
| 2026-02-13 | 13F | Squarepoint Ops LLC | 516.644 | 276,72 | 15.396 | 271,41 | ||||
| 2026-02-17 | 13F | Think Investments LP | 1.292.200 | 0,00 | 38.508 | -1,42 | ||||
| 2026-02-12 | 13F | Groupe la Francaise | 93.256 | 0,00 | 2.777 | -1,56 | ||||
| 2026-01-15 | 13F | Allspring Global Investments Holdings, LLC | 469.477 | 5,71 | 14.080 | 3,81 | ||||
| 2026-01-23 | 13F | Assetmark, Inc | 169.081 | 7,23 | 5.039 | 5,71 | ||||
| 2026-03-11 | 13F | Leonteq Securities AG | Put | 0 | -100,00 | 0 | -100,00 | |||
| 2026-04-08 | 13F | Grove Bank & Trust | 4.119 | -0,07 | 107 | -13,11 | ||||
| 2026-04-20 | 13F | TrueMark Investments, LLC | 80.381 | 170,10 | 2.082 | 134,88 | ||||
| 2026-02-12 | 13F | Scotia Capital Inc. | 375.208 | -24,54 | 11.181 | -25,61 | ||||
| 2026-02-10 | 13F | Bnp Paribas Arbitrage, Sa | 6.128.057 | -0,73 | 182.616 | -2,14 | ||||
| 2026-01-12 | 13F | VisionPoint Advisory Group, LLC | 62.252 | 6,26 | 1.855 | 4,80 | ||||
| 2026-02-18 | 13F | EP Wealth Advisors, Inc. | 20.476 | 106,14 | 610 | 82,63 | ||||
| 2026-02-10 | 13F | Acadian Asset Management Llc | 1.942.530 | -19,85 | 58 | -21,92 | ||||
| 2026-04-22 | 13F | Pictet Asset Management Holding SA | 3.294.052 | 17,71 | 85.316 | 2,30 | ||||
| 2026-02-11 | 13F | Parallel Advisors, LLC | 14.415 | -0,05 | 430 | -1,38 | ||||
| 2026-02-12 | 13F | DRW Securities, LLC | 139.436 | 1.998,99 | 4.155 | 1.967,16 | ||||
| 2026-02-13 | 13F | Verition Fund Management LLC | 74.877 | 49,27 | 2.231 | 47,16 | ||||
| 2026-04-22 | 13F | Samalin Investment Counsel, LLC | 9.798 | 2,89 | 254 | -10,60 | ||||
| 2026-02-05 | 13F | Mesirow Financial Investment Management, Inc. | 0 | -100,00 | 0 | |||||
| 2026-02-12 | 13F | Principal Securities, Inc. | 8.911 | -15,97 | 266 | -17,19 | ||||
| 2026-01-29 | 13F | Rakuten Securities, Inc. | 2.077 | 50,18 | 62 | 48,78 | ||||
| 2026-02-06 | 13F | Entrust Financial Llc | 1.657 | 49 | ||||||
| 2026-02-13 | 13F | Verition Fund Management LLC | Put | 28.800 | -58,02 | 858 | -58,61 | |||
| 2026-04-17 | 13F | CENTRAL TRUST Co | 33 | 0,00 | 1 | |||||
| 2026-01-30 | 13F | Us Bancorp \de\ | 354.965 | -0,78 | 10.578 | -2,19 | ||||
| 2026-02-17 | 13F | Aureus Asset Management, LLC | 15.940 | -0,31 | 475 | -1,66 | ||||
| 2026-01-27 | 13F | Brighton Jones Llc | 0 | -100,00 | 0 | |||||
| 2026-02-13 | 13F | Golden State Wealth Management, LLC | 22 | 0,00 | 1 | |||||
| 2026-04-08 | 13F | Dynamic Advisor Solutions LLC | 0 | -100,00 | 0 | |||||
| 2026-02-11 | 13F | Simplex Trading, Llc | 5.625 | -5,35 | 168 | |||||
| 2026-02-11 | 13F | Simplex Trading, Llc | Call | 89.600 | -46,41 | 2.670 | 53.300,00 | |||
| 2026-02-11 | 13F | Simplex Trading, Llc | Put | 9.500 | -15,93 | 283 | ||||
| 2026-02-11 | 13F | CenterBook Partners LP | 37.647 | 1.122 | ||||||
| 2026-02-11 | 13F | Capital International Inc /ca/ | 540.613 | -12,42 | 16.110 | -13,67 | ||||
| 2026-02-13 | 13F | Transamerica Financial Advisors, Inc. | 1.311 | 39 | ||||||
| 2026-02-03 | 13F | Connable Office Inc | 30.042 | 0,00 | 895 | -1,43 | ||||
| 2026-04-24 | 13F | Profund Advisors Llc | 85.742 | -5,03 | 2.221 | -17,47 | ||||
| 2026-02-17 | 13F | Northern Trust Corp | 3.638.386 | -1,71 | 108.424 | -3,11 | ||||
| 2026-02-13 | 13F | Bollard Group LLC | 6.978 | 0 | ||||||
| 2026-02-09 | 13F | Accent Capital Management, LLC | 886 | 0,00 | 26 | 0,00 | ||||
| 2026-02-17 | 13F | Tudor Investment Corp Et Al | 383.077 | 11.416 | ||||||
| 2026-02-17 | 13F | Holocene Advisors, LP | 846.579 | 25.228 | ||||||
| 2026-02-10 | 13F | Channing Global Advisors, Llc | 84.938 | 1,17 | 2.531 | -0,28 | ||||
| 2026-04-21 | 13F | Aaron Wealth Advisors LLC | 54.010 | 110,89 | 1.399 | 83,22 | ||||
| 2026-04-14 | 13F | Granite Group Advisors, LLC | 0 | -100,00 | 0 | |||||
| 2026-01-29 | 13F | UBS Group AG | Put | 282.200 | 0,00 | 8.410 | -1,42 | |||
| 2026-01-28 | 13F | HB Wealth Management, LLC | 12.716 | 11,11 | 379 | 9,57 | ||||
| 2026-01-29 | 13F | UBS Group AG | Call | 49.900 | 0,00 | 1.487 | -1,39 | |||
| 2025-11-14 | 13F | Millennium Management Llc | Call | 0 | -100,00 | 0 | -100,00 | |||
| 2026-01-29 | 13F | UBS Group AG | 3.953.404 | 25,75 | 117.811 | 23,97 | ||||
| 2026-04-23 | 13F | Klein Pavlis & Peasley Financial, Inc. | 132.985 | 7,40 | 3.444 | -6,67 | ||||
| 2026-02-13 | 13F | Vontobel Holding Ltd. | 2.692.556 | -39,54 | 80.238 | -40,40 | ||||
| 2026-04-15 | 13F | Compagnie Lombard Odier SCmA | 1.000 | 0,00 | 26 | -13,79 | ||||
| 2026-01-30 | 13F | Rachor Investment Advisory Services, LLC | 52 | 2 | ||||||
| 2026-02-09 | 13F | Keating Financial Advisory Services, Inc. | 108 | 3 | ||||||
| 2026-04-24 | 13F | Root Financial Partners, LLC | 299 | 225,00 | 8 | 250,00 | ||||
| 2026-02-12 | 13F | Systematic Alpha Investments, LLC | 11.300 | 0,00 | 337 | -1,47 | ||||
| 2026-02-13 | 13F | Segall Bryant & Hamill, Llc | 17.600 | 0,00 | 524 | -1,50 | ||||
| 2026-02-17 | 13F | GeoWealth Management, LLC | 17.205 | 24,13 | 513 | 22,49 | ||||
| 2026-02-06 | 13F | Vestmark Advisory Solutions, Inc. | 16.297 | 486 | ||||||
| 2026-02-13 | 13F | Baldwin Investment Management, LLC | 67.438 | 0,00 | 2.010 | -1,42 | ||||
| 2026-02-10 | 13F | Lido Advisors, LLC | 13.567 | 0,00 | 409 | -0,24 | ||||
| 2026-02-12 | 13F | Rossby Financial, LCC | 63 | 0,00 | 2 | 0,00 | ||||
| 2026-02-23 | 13F | Monetary Solutions, Ltd | 100 | 3 | ||||||
| 2026-02-09 | 13F | Wcm Investment Management, Llc | 53.308.528 | -1,59 | 1.591.260 | -3,08 | ||||
| 2026-02-17 | 13F | Limestone Investment Advisors LP | 57.300 | 1.708 | ||||||
| 2026-04-20 | 13F | Arta Finance Wealth Management LLC | 21.079 | -3,05 | 546 | -15,77 | ||||
| 2026-02-17 | 13F | Point72 Asset Management, L.P. | 1.467.733 | 1.806,15 | 43.738 | 1.779,59 | ||||
| 2026-02-13 | 13F | Kestra Advisory Services, LLC | 0 | -100,00 | 0 | |||||
| 2026-02-17 | 13F | Triveni Capital Investments LP | 405.413 | 12.081 | ||||||
| 2026-02-12 | 13F | Advisory Resource Group | 42.012 | 9,79 | 1.252 | 8,22 | ||||
| 2026-02-13 | 13F | Sompo Japan Nipponkoa Asset Management Co.,ltd. | 23.000 | -29,64 | 685 | -30,67 | ||||
| 2026-04-22 | 13F | Stone House Investment Management, LLC | 2 | -83,33 | 0 | |||||
| 2026-02-12 | 13F | JPL Wealth Management, LLC | 0 | -100,00 | 0 | |||||
| 2026-04-17 | 13F | Bell Investment Advisors, Inc | 1.811 | -13,47 | 47 | -25,81 | ||||
| 2026-01-30 | 13F | Sage Rhino Capital Llc | 0 | -100,00 | 0 | |||||
| 2026-01-30 | 13F | State of New Jersey Common Pension Fund D | 216.017 | 0,00 | 6.437 | -1,42 | ||||
| 2026-02-10 | 13F | Envestnet Asset Management Inc | 2.784.785 | -7,03 | 82.987 | -8,35 | ||||
| 2026-02-17 | 13F | Cdkv Holdings Llc | 1.100 | 33 | ||||||
| 2026-02-17 | 13F | Jump Financial, LLC | 683.794 | 20.377 | ||||||
| 2026-04-06 | 13F | Highline Wealth Partners Llc | 116 | -85,63 | 3 | -87,50 | ||||
| 2026-04-27 | 13F | Tsfg, Llc | 1.800 | 0,00 | 0 | |||||
| 2026-02-17 | 13F | Liontrust Investment Partners LLP | 283.445 | 7,90 | 8.447 | 6,36 | ||||
| 2026-02-19 | 13F | Mcguire Capital Advisors Inc | 68 | 2 | ||||||
| 2026-02-12 | 13F | New York State Common Retirement Fund | 1.334.585 | 28,28 | 39.771 | 26,45 | ||||
| 2026-02-13 | 13F | Dynamic Technology Lab Private Ltd | 72.050 | 34,18 | 2.147 | 32,29 | ||||
| 2026-01-28 | 13F | Migdal Insurance & Financial Holdings Ltd. | 28.799 | -9,43 | 1 | |||||
| 2026-01-30 | 13F | Mitsubishi UFJ Trust & Banking Corp | 46.966 | 6,03 | 1.400 | 4,48 | ||||
| 2026-02-12 | 13F | BlackRock, Inc. | 8.438.158 | 47,45 | 251.457 | 45,36 | ||||
| 2026-02-18 | 13F | Vident Advisory, LLC | 219.902 | -1,97 | 6.553 | -3,36 | ||||
| 2026-02-13 | 13F | Schroder Investment Management Group | 7.547.726 | -4,44 | 224.922 | -5,80 | ||||
| 2026-04-15 | 13F | Seacrest Wealth Management, Llc | 11.832 | 0,00 | 306 | -17,52 | ||||
| 2026-02-05 | 13F | Cambridge Investment Research Advisors, Inc. | 9.240 | 7,62 | 0 | |||||
| 2026-04-24 | 13F | Ninety One SA (PTY) Ltd | 13.630 | 9,96 | 345 | -6,50 | ||||
| 2025-10-31 | 13F/A | OneAscent Financial Services LLC | 0 | -100,00 | 0 | |||||
| 2026-02-17 | 13F | Fwl Investment Management, Llc | 343.892 | 10,93 | 10.248 | 9,35 | ||||
| 2026-02-10 | 13F | Private Wealth Asset Management, LLC | 0 | -100,00 | 0 | |||||
| 2026-04-06 | 13F | GAMMA Investing LLC | 16.741 | -8,07 | 434 | -20,11 | ||||
| 2026-02-10 | 13F | Savant Capital, LLC | 18.988 | 46,70 | 566 | 44,50 | ||||
| 2026-02-17 | 13F | Aqr Capital Management Llc | 318.357 | 60,89 | 9.487 | 58,62 | ||||
| 2026-02-17 | 13F | Hood River Capital Management LLC | 480 | 14 | ||||||
| 2026-02-10 | 13F | Greenspring Advisors, LLC | 12.809 | 382 | ||||||
| 2026-02-13 | 13F | BNP Paribas Asset Management Holding S.A. | 735.814 | 22 | ||||||
| 2026-04-13 | 13F | Mather Group, Llc. | 6.316 | 164 | ||||||
| 2026-02-04 | 13F | Atlantic Union Bankshares Corp | 150 | 20,00 | 4 | 33,33 | ||||
| 2026-02-17 | 13F | United Capital Financial Advisers, Llc | 15.847 | -4,93 | 472 | -6,16 | ||||
| 2025-11-13 | 13F | Glenmede Investment Management, LP | 73.709 | 20,85 | 2.228 | 8,63 | ||||
| 2026-04-16 | 13F | SG Americas Securities, LLC | 2.662.894 | 202,67 | 69 | 161,54 | ||||
| 2026-01-22 | 13F | City Holding Co | 0 | -100,00 | 0 | -100,00 | ||||
| 2026-01-29 | 13F | Golden State Equity Partners | 7.956 | 3,95 | 237 | 2,60 | ||||
| 2026-02-13 | 13F | Virtus ETF Advisers LLC | 93.717 | -54,21 | 2.793 | -54,87 | ||||
| 2026-04-10 | 13F | Abound Wealth Management | 34 | -50,00 | 1 | -100,00 | ||||
| 2026-04-23 | 13F | Mayflower Financial Advisors, LLC | 0 | -100,00 | 0 | |||||
| 2025-12-09 | 13F/A | Tudor Investment Corp Et Al | Call | 0 | -100,00 | 0 | ||||
| 2026-02-17 | 13F | Jones Financial Companies Lllp | 5.950 | 15,24 | 177 | 12,74 | ||||
| 2026-02-06 | 13F | Motco | 0 | -100,00 | 0 | -100,00 | ||||
| 2026-02-13 | 13F | Arrowstreet Capital, Limited Partnership | 4.020.415 | 4,36 | 119.808 | 2,88 | ||||
| 2025-11-07 | 13F | Credit Industriel Et Commercial | 0 | -100,00 | 0 | |||||
| 2026-02-10 | 13F | Measured Wealth Private Client Group, LLC | 238 | 0,00 | 7 | 0,00 | ||||
| 2026-02-02 | 13F | Horizon Investments, LLC | 0 | -100,00 | 0 | |||||
| 2025-11-07 | 13F | Credit Industriel Et Commercial | Put | 0 | -100,00 | 0 | ||||
| 2026-02-13 | 13F | Thornburg Investment Management Inc | 192.359 | -8,52 | 5.732 | -9,82 | ||||
| 2026-02-13 | 13F | Citigroup Inc | 436.013 | -46,52 | 12.993 | -47,28 | ||||
| 2026-04-06 | 13F | CX Institutional | 40 | 0,00 | 0 | |||||
| 2026-01-23 | 13F | Gibbs Wealth Management | 0 | -100,00 | 0 | |||||
| 2026-01-28 | 13F | CAPROCK Group, Inc. | 62.559 | -1,73 | 1.864 | -8,45 | ||||
| 2026-02-17 | 13F | Brevan Howard Capital Management LP | 0 | -100,00 | 0 | |||||
| 2026-01-26 | 13F | Mirae Asset Global Investments Co., Ltd. | 125.727 | 1,01 | 3.747 | -0,43 | ||||
| 2026-02-17 | 13F | Two Sigma Investments, Lp | 4.032.212 | 181,26 | 120.160 | 177,26 | ||||
| 2026-02-17 | 13F | Two Creeks Capital Management, LP | 115.114 | 0,00 | 3.430 | -1,41 | ||||
| 2026-02-10 | 13F | Sivia Capital Partners, LLC | 15.059 | -1,53 | 449 | -3,03 | ||||
| 2026-02-12 | 13F | Jane Street Group, Llc | 1.703.511 | 461,30 | 50.765 | 453,35 | ||||
| 2026-02-10 | 13F | Td Asset Management Inc | 48.546 | 1,68 | 1.447 | 0,21 | ||||
| 2026-02-13 | 13F/A | Alberta Investment Management Corp | 0 | -100,00 | 0 | |||||
| 2026-04-24 | 13F | Sumitomo Mitsui DS Asset Management Company, Ltd | 48.205 | -2,81 | 1.249 | -15,56 | ||||
| 2026-02-12 | 13F | Jane Street Group, Llc | Put | 8.500 | -1,16 | 253 | -2,32 | |||
| 2026-02-02 | 13F | Cornerstone Planning Group LLC | 1.332 | 0,00 | 39 | -2,50 | ||||
| 2026-02-12 | 13F | Jane Street Group, Llc | Call | 68.500 | -16,05 | 2.041 | -17,23 | |||
| 2025-11-14 | 13F | Atom Investors LP | 0 | -100,00 | 0 | |||||
| 2026-01-21 | 13F | Flagship Harbor Advisors, Llc | 211 | 6 | ||||||
| 2026-02-09 | 13F | Legal & General Group Plc | 2.137 | 0,00 | 64 | -1,56 | ||||
| 2025-11-14 | 13F | Wolverine Trading, Llc | Put | 0 | -100,00 | 0 | -100,00 | |||
| 2026-04-27 | 13F | Y-Intercept (Hong Kong) Ltd | 0 | -100,00 | 0 | |||||
| 2026-01-23 | 13F | Rsm Us Wealth Management Llc | 32.032 | -0,78 | 956 | -1,95 | ||||
| 2026-02-13 | 13F | Wealth Alliance | 8.235 | 2,82 | 245 | 1,24 | ||||
| 2026-04-21 | 13F | Paradigm Financial Partners, Llc | 51.173 | -78,88 | 1.325 | -81,65 | ||||
| 2026-02-12 | 13F | Canopy Partners, LLC | 0 | -100,00 | 0 | |||||
| 2025-11-03 | 13F | Annis Gardner Whiting Capital Advisors, LLC | 0 | -100,00 | 0 | |||||
| 2026-01-23 | 13F | Helios Capital Management Pte. Ltd | 285.000 | 0,00 | 8.493 | -1,42 | ||||
| 2026-02-10 | 13F/A | Northwestern Mutual Wealth Management Co | 1.853 | -17,94 | 55 | -19,12 | ||||
| 2026-02-12 | 13F | Sepio Capital, LP | 0 | -100,00 | 0 | |||||
| 2026-02-17 | 13F | XTX Topco Ltd | 284.203 | 217,91 | 8.469 | 213,43 | ||||
| 2026-02-02 | 13F | Qrg Capital Management, Inc. | 30.343 | -4,62 | 904 | -5,93 | ||||
| 2026-01-28 | 13F | Kingswood Wealth Advisors, Llc | 6.740 | 201 | ||||||
| 2026-02-11 | 13F | Capital Group Investment Management Pte. Ltd. | 20.505 | -41,46 | 611 | -42,25 | ||||
| 2026-02-17 | 13F | DZ BANK AG Deutsche Zentral Genossenschafts Bank, Frankfurt am Main | 0 | -100,00 | 0 | |||||
| 2026-04-13 | 13F | IFP Advisors, Inc | 15.913 | -2,66 | 412 | -15,40 | ||||
| 2026-02-13 | 13F | Eschler Asset Management LLP | 0 | -100,00 | 0 | |||||
| 2026-02-17 | 13F | Janus Henderson Group Plc | 54.167 | -3,61 | 1.613 | -5,06 | ||||
| 2026-04-14 | 13F | Drive Wealth Management, Llc | 10.298 | -11,73 | 267 | -23,34 | ||||
| 2026-02-13 | 13F | Arkadios Wealth Advisors | 6.815 | 2,40 | 203 | 1,00 | ||||
| 2026-02-17 | 13F | Nomura Holdings Inc | 10.000 | -66,67 | 298 | -67,11 | ||||
| 2026-02-13 | 13F | Pathstone Holdings, LLC | 329.168 | -0,22 | 9.809 | -1,64 | ||||
| 2026-02-11 | 13F | Capital World Investors | 148.618 | 1,68 | 4.436 | 0,14 | ||||
| 2026-01-20 | 13F | Ascent Group, LLC | 19.122 | -1,28 | 570 | -2,74 | ||||
| 2026-02-17 | 13F | Artisan Partners Limited Partnership | 123.932 | 5,99 | 3.693 | 4,50 | ||||
| 2026-02-09 | 13F | MQS Management LLC | 0 | -100,00 | 0 | |||||
| 2026-01-23 | 13F | Westside Investment Management, Inc. | 2.442 | 5,81 | 73 | 4,29 | ||||
| 2026-02-13 | 13F | Evelyn Partners Investment Management LLP | 4.801 | 0,00 | 143 | -1,38 | ||||
| 2026-04-23 | 13F | SJS Investment Consulting Inc. | 0 | -100,00 | 0 | |||||
| 2026-03-02 | 13F | Tobam | 34.355 | 0,48 | 1 | 0,00 | ||||
| 2026-01-28 | 13F | Eagle Global Advisors Llc | 67.100 | 0,00 | 2.000 | -1,43 | ||||
| 2026-02-10 | 13F | Natixis Advisors, L.p. | 1.103.036 | -8,01 | 33 | -11,11 | ||||
| 2026-02-17 | 13F | Balyasny Asset Management Llc | 83.364 | 2.484 | ||||||
| 2026-04-27 | 13F | Leonteq Securities AG | 136.324 | 4,56 | 3.531 | -9,14 | ||||
| 2026-01-27 | 13F | Jackson, Grant Investment Advisers, Inc. | 125 | 0,00 | 4 | 0,00 | ||||
| 2026-01-29 | 13F | Resonant Capital Advisors, LLC | 6.812 | -1,43 | 203 | -2,88 | ||||
| 2026-02-11 | 13F | Prestige Wealth Management Group LLC | 80 | -6,98 | 2 | 0,00 | ||||
| 2026-02-03 | 13F | NewEdge Wealth, LLC | 10.234 | 305 | ||||||
| 2026-02-10 | 13F | Bnp Paribas | 69.703 | 112,86 | 2.077 | 110,01 | ||||
| 2026-01-28 | 13F | Klp Kapitalforvaltning As | 190.000 | 76,42 | 5.662 | 73,95 | ||||
| 2026-02-10 | 13F | Nomura Asset Management Co Ltd | 1.467.150 | -3,91 | 43.721 | -5,27 | ||||
| 2026-02-17 | 13F | Clough Capital Partners L P | 0 | -100,00 | 0 | -100,00 | ||||
| 2026-02-03 | 13F | Sequoia Financial Advisors, LLC | 79.042 | -2,96 | 2.355 | -4,35 | ||||
| 2026-01-23 | 13F | Baillie Gifford & Co | 4.709.302 | -3,59 | 140.337 | -4,96 | ||||
| 2026-04-22 | 13F | RMR Wealth Builders | 15.362 | 0,00 | 398 | -13,13 | ||||
| 2026-02-17 | 13F | Public Employees Retirement System Of Ohio | 441.153 | -0,57 | 13.146 | -1,99 | ||||
| 2026-02-05 | 13F | Bank Julius Baer & Co. Ltd, Zurich | 152.650 | 11,75 | 4.549 | 10,15 | ||||
| 2026-02-03 | 13F | Indivisible Partners | 12.233 | 365 | ||||||
| 2026-02-09 | 13F | Harbour Investments, Inc. | 735 | 0,00 | 22 | -4,55 | ||||
| 2026-02-11 | 13F | Clearbridge Investments, LLC | 3.605.757 | -5,69 | 107.452 | -7,03 | ||||
| 2026-02-17 | 13F | Schonfeld Strategic Advisors LLC | 125.554 | 123,18 | 3.742 | 120,06 | ||||
| 2026-02-05 | 13F | Thrivent Financial For Lutherans | 268.849 | 1,08 | 8 | 0,00 | ||||
| 2026-02-12 | 13F | Adviser Investments LLC | 173.557 | 5,88 | 5.172 | 4,38 | ||||
| 2026-02-11 | 13F | Erste Asset Management GmbH | 0 | 0 | ||||||
| 2026-02-13 | 13F | Ubs Asset Management Americas Inc | 8.084 | -73,72 | 241 | -74,17 | ||||
| 2026-01-28 | 13F | DekaBank Deutsche Girozentrale | 343.641 | 0,00 | 10 | 0,00 | ||||
| 2025-11-06 | 13F | Wealthstream Advisors, Inc. | 12.656 | 14,15 | 383 | 2,69 | ||||
| 2026-02-17 | 13F | Wellington Management Group Llp | 6.016.402 | 53,95 | 179.289 | 51,76 | ||||
| 2026-02-17 | 13F | Blair William & Co/il | 158.327 | -0,97 | 4.718 | -2,38 | ||||
| 2026-04-09 | 13F | Park Place Capital Corp | 1.834 | 0,00 | 48 | -12,96 | ||||
| 2025-11-17 | 13F | Kestra Private Wealth Services, Llc | 0 | -100,00 | 0 | |||||
| 2026-01-28 | 13F | WPG Advisers, LLC | 5.594 | 0,43 | 167 | -1,19 | ||||
| 2026-02-05 | 13F | L & S Advisors Inc | 94.302 | -1,57 | 2.810 | -2,97 | ||||
| 2026-02-24 | 13F | MidFirst Bank | 201 | 6 | ||||||
| 2026-02-10 | 13F | Texas Yale Capital Corp. | 18.910 | 7,69 | 564 | 6,23 | ||||
| 2026-02-17 | 13F | Voloridge Investment Management, Llc | 3.304.107 | 20,60 | 98.462 | 18,88 | ||||
| 2025-11-12 | 13F | Kcm Investment Advisors Llc | 0 | -100,00 | 0 | |||||
| 2026-02-04 | 13F | Mirabaud Asset Management Ltd | 35.066 | 1.018 | ||||||
| 2026-04-21 | 13F | PDS Planning, Inc | 30.287 | -4,78 | 784 | -17,21 | ||||
| 2026-02-12 | 13F | Pitcairn Co | 0 | -100,00 | 0 | -100,00 | ||||
| 2026-04-24 | 13F | Abacus Wealth Partners, LLC | 11.908 | -10,43 | 308 | -22,22 | ||||
| 2026-02-09 | 13F | Bleakley Financial Group, LLC | 47.498 | 10,95 | 1.415 | 9,35 | ||||
| 2025-10-31 | 13F | Whittier Trust Co Of Nevada Inc | 0 | -100,00 | 0 | |||||
| 2025-11-14 | 13F | Cubist Systematic Strategies, LLC | 51.357 | -56,19 | 1.553 | -60,64 | ||||
| 2026-02-13 | 13F | GQG Partners LLC | 74.633.839 | -1,32 | 2.224.088 | -2,72 | ||||
| 2026-02-17 | 13F | Temasek Holdings (Private) Ltd | 29.195.789 | 11,30 | 870.035 | 9,72 | ||||
| 2026-02-13 | 13F | Centiva Capital, LP | 19.020 | 567 | ||||||
| 2026-02-17 | 13F | Bank Of America Corp /de/ | 9.042.692 | -3,35 | 269.472 | -4,73 | ||||
| 2026-04-13 | 13F | True Wealth Design, LLC | 160 | -68,87 | 4 | -73,33 | ||||
| 2026-02-11 | 13F | Ramirez Asset Management, Inc. | 637 | 19 | ||||||
| 2026-04-13 | 13F | Hm Payson & Co | 0 | -100,00 | 0 | |||||
| 2026-02-06 | 13F | HighTower Advisors, LLC | 189.985 | 0,26 | 5.662 | -1,17 | ||||
| 2026-04-24 | 13F | Deltec Asset Management Llc | 35.500 | 0,00 | 919 | -13,06 | ||||
| 2026-02-05 | 13F | Bessemer Group Inc | 85.629 | 0,24 | 3 | 0,00 | ||||
| 2025-11-07 | 13F | Skandinaviska Enskilda Banken AB (publ) | 0 | -100,00 | 0 | -100,00 | ||||
| 2026-02-17 | 13F | Russell Investments Group, Ltd. | 2.829.163 | 7,59 | 84.309 | 6,06 | ||||
| 2025-11-06 | 13F | Oppenheimer & Co Inc | 0 | -100,00 | 0 | |||||
| 2026-02-06 | 13F | Global Retirement Partners, LLC | 34.924 | 503,49 | 1.041 | 497,70 | ||||
| 2026-04-27 | 13F | La Banque Postale Asset Management SA | 71.500 | 0,00 | 1.852 | -13,10 | ||||
| 2026-02-13 | 13F | Stifel Financial Corp | 328.384 | -1,23 | 9.786 | -2,65 | ||||
| 2026-02-13 | 13F | Prudential Financial Inc | 78.249 | -7,23 | 2.336 | -8,40 | ||||
| 2026-01-29 | 13F | Aprio Wealth Management, LLC | 7.382 | -26,55 | 220 | -27,72 | ||||
| 2026-02-13 | 13F | Lord, Abbett & Co. Llc | 122.614 | -3,48 | 4 | 0,00 | ||||
| 2026-02-13 | 13F | Panagora Asset Management Inc | 1.829.696 | 15,17 | 54.525 | 13,53 | ||||
| 2025-11-14 | 13F | Navis Wealth Advisors, LLC | 0 | -100,00 | 0 | |||||
| 2026-01-07 | 13F | Aventura Private Wealth, LLC | 0 | -100,00 | 0 | |||||
| 2026-01-16 | 13F | Standard Life Aberdeen plc | 422.772 | 5,03 | 12.599 | 3,76 | ||||
| 2026-02-17 | 13F | New Vernon Capital Holdings II LLC | 675.644 | -18,04 | 20.134 | -19,20 | ||||
| 2026-01-07 | 13F | Harbour Capital Advisors, LLC | 12.045 | -8,65 | 361 | -11,52 | ||||
| 2026-02-11 | 13F | Westerkirk Capital Inc. | 13.682 | -53,72 | 408 | -54,42 | ||||
| 2026-02-13 | 13F | Mml Investors Services, Llc | 215.023 | 5,55 | 6.408 | 4,04 | ||||
| 2026-04-08 | 13F | Wealth Enhancement Advisory Services, Llc | 43.014 | -19,62 | 1.102 | -33,31 | ||||
| 2026-01-13 | 13F | Kathmere Capital Management, LLC | 10.103 | 2,44 | 301 | 1,01 | ||||
| 2026-01-23 | 13F | Bridgewater Advisors Inc. | 25.452 | -1,43 | 746 | -3,37 | ||||
| 2026-02-05 | 13F | LGT Group Foundation | 12.747 | -80,78 | 380 | -81,23 | ||||
| 2025-11-14 | 13F | AXA Investment Managers S.A. | 800.401 | 24.196 | ||||||
| 2026-02-12 | 13F | Federation des caisses Desjardins du Quebec | 66.587 | -6,94 | 1.984 | -8,23 | ||||
| 2026-02-17 | 13F | Advisory Services Network, LLC | 0 | -100,00 | 0 | -100,00 | ||||
| 2026-04-17 | 13F | Athena Wealth Management, LLC | 14.399 | -6,02 | 373 | -18,42 | ||||
| 2026-02-10 | 13F | Eurizon Asset Management Slovakia, sprav. spol., a.s. | 7.200 | 215 | ||||||
| 2026-04-24 | 13F | Key FInancial Inc | 274 | 0,00 | 7 | -12,50 | ||||
| 2026-02-12 | 13F | Bank Of Montreal /can/ | 2.586.177 | 53,00 | 77.068 | 50,82 | ||||
| 2025-11-06 | 13F | Dalton Investments LLC | 0 | -100,00 | 0 | -100,00 | ||||
| 2026-02-06 | 13F | Pnc Financial Services Group, Inc. | 251.430 | -2,76 | 7.493 | -4,15 | ||||
| 2026-01-30 | 13F | Turning Point Benefit Group, Inc. | 31 | 0,00 | 1 | |||||
| 2026-01-26 | 13F | Covenant Partners, LLC | 7.244 | 0,00 | 216 | -1,38 | ||||
| 2026-02-11 | 13F | Jpmorgan Chase & Co | Call | 107.500 | 0,00 | 3.204 | -1,42 | |||
| 2026-02-13 | 13F | Integrated Wealth Concepts LLC | 0 | -100,00 | 0 | |||||
| 2026-02-09 | 13F | AIA Group Ltd | 333.901 | 5,99 | 9.950 | 4,48 | ||||
| 2026-01-30 | 13F | Arlington Trust Co LLC | 0 | -100,00 | 0 | |||||
| 2026-02-19 | 13F | Atomi Financial Group, Inc. | 51.747 | -7,94 | 1.542 | -9,24 | ||||
| 2025-11-12 | 13F | Itau Unibanco Holding S.A. | 0 | -100,00 | 0 | |||||
| 2026-02-11 | 13F | Jpmorgan Chase & Co | 15.422.841 | -16,40 | 459.601 | -17,59 | ||||
| 2026-01-26 | 13F | Cwm, Llc | 8.858 | 11,30 | 0 | |||||
| 2026-02-17 | 13F | Laird Norton Trust Company, Llc | 200.866 | 5.986 | ||||||
| 2026-02-12 | 13F | Steward Partners Investment Advisory, Llc | 14.387 | -86,97 | 429 | -87,17 | ||||
| 2026-02-17 | 13F | Capital Fund Management S.a. | Put | 0 | -100,00 | 0 | -100,00 | |||
| 2026-02-02 | 13F | Truist Financial Corp | 57.360 | -1,81 | 1.709 | -3,17 | ||||
| 2026-01-08 | 13F | Nordea Investment Management Ab | 535.498 | -5,10 | 15.950 | -6,41 | ||||
| 2026-02-13 | 13F | PCM Encore, LLC | 58.251 | 1.736 | ||||||
| 2026-02-12 | 13F | Triumph Capital Management | 24 | 1 | ||||||
| 2026-02-17 | 13F | Driehaus Capital Management Llc | 4.063.452 | -24,18 | 121.091 | -25,26 | ||||
| 2026-04-21 | 13F | PharVision Advisers, LLC | 0 | -100,00 | 0 | |||||
| 2026-02-17 | 13F | Grantham, Mayo, Van Otterloo & Co. LLC | 11.293 | -24,08 | 337 | -25,17 | ||||
| 2025-11-14 | 13F | Fullerton Fund Management Co Ltd | 0 | -100,00 | 0 | |||||
| 2026-04-22 | 13F | Union Bancaire Privee, UBP SA | 10.295 | -72,31 | 259 | -76,65 | ||||
| 2026-02-17 | 13F | Captrust Financial Advisors | 41.434 | 5,74 | 1.235 | 4,22 | ||||
| 2026-02-11 | 13F | Renaissance Group Llc | 214.961 | -8,15 | 6.406 | -9,47 | ||||
| 2026-01-07 | 13F | Sagespring Wealth Partners, Llc | 11.887 | -3,13 | 354 | -4,32 | ||||
| 2026-01-30 | 13F | Flossbach Von Storch Ag | 200.000 | 25,00 | 5.960 | 23,24 | ||||
| 2026-02-12 | 13F | Campbell & CO Investment Adviser LLC | 198.633 | 5.919 | ||||||
| 2026-01-23 | 13F | Hardman Johnston Global Advisors LLC | 5.526.617 | -3,65 | 164.693 | -5,02 | ||||
| 2026-02-13 | 13F | Wells Fargo & Company/mn | 263.154 | 1,42 | 7.842 | -0,03 | ||||
| 2025-11-07 | 13F | Avestar Capital, LLC | 0 | -100,00 | 0 | |||||
| 2026-02-17 | 13F | Caisse De Depot Et Placement Du Quebec | 217.800 | 0,00 | 6.490 | -1,43 | ||||
| 2026-04-22 | 13F | Sterling Capital Management LLC | 19.129 | 495 | ||||||
| 2026-04-23 | 13F | J.w. Cole Advisors, Inc. | 63.841 | 22,59 | 1.653 | 407,06 | ||||
| 2026-02-11 | 13F | Franklin Resources Inc | 6.389.624 | -1,05 | 190.411 | -2,45 | ||||
| 2026-02-13 | 13F | Healthcare Of Ontario Pension Plan Trust Fund | 2.413.800 | 19,86 | 71.931 | 18,16 | ||||
| 2026-02-17 | 13F | Wiley Bros.-aintree Capital, Llc | 33.595 | 5,44 | 1.003 | 4,05 | ||||
| 2026-02-05 | 13F | Lockheed Martin Investment Management Co | 33.100 | -92,16 | 986 | -92,27 | ||||
| 2026-04-08 | 13F | Thompson Investment Management, Inc. | 5.940 | 0,00 | 154 | -13,56 | ||||
| 2026-04-15 | 13F | Generali Investments CEE, investicni spolecnost, a.s. | 81.292 | 0,00 | 2.105 | -13,09 | ||||
| 2026-04-16 | 13F | Park National Corp /oh/ | 0 | -100,00 | 0 | |||||
| 2026-02-05 | 13F | Atria Investments Llc | 42.393 | 11,10 | 1.263 | 9,54 | ||||
| 2026-02-17 | 13F | Alua Capital Management LP | 4.105.717 | 0,00 | 122.350 | -1,42 |