Grundlæggende statistik
| Institutionelle aktier (lange) | 1.001.537.428 - 59,78% (ex 13D/G) - change of -227,66MM shares -18,52% MRQ |
| Institutionel værdi (lang) | $ 40.984.921 USD ($1000) |
Institutionelt ejerskab og aktionærer
Barrick Mining Corporation (US:B) har 1007 institutionelle ejere og aktionærer, der har indsendt 13D/G- eller 13F-formularer til Securities Exchange Commission (SEC). Disse institutioner har i alt 1,001,537,428 aktier. Største aktionærer omfatter Capital International Investors, Vanguard Group Inc, BlackRock, Inc., Van Eck Associates Corp, Arrowstreet Capital, Limited Partnership, Royal Bank Of Canada, First Eagle Investment Management, LLC, FIL Ltd, Bank Of Montreal /can/, and Mackenzie Financial Corp .
Barrick Mining Corporation (NYSE:B) institutionel ejerskabsstruktur viser aktuelle positioner i virksomheden efter institutioner og fonde, samt seneste ændringer i positionsstørrelse. Større aktionærer kan omfatte individuelle investorer, investeringsforeninger, hedgefonde eller institutioner. Skema 13D angiver, at investoren besidder (eller besidder) mere end 5 % af virksomheden og har til hensigt (eller har til hensigt at) aktivt at forfølge en ændring i forretningsstrategi. Skema 13G indikerer en passiv investering på over 5%.
The share price as of April 21, 2026 is 40,45 / share. Previously, on May 9, 2025, the share price was 19,46 / share. This represents an increase of 107,86% over that period.

Fondens stemningsscore
Fund Sentiment Score (fka Ownership Accumulation Score) finder de aktier, der bliver mest købt af fonde. Det er resultatet af en sofistikeret, multi-faktor kvantitativ model, der identificerer virksomheder med de højeste niveauer af institutionel akkumulering. Scoringsmodellen bruger en kombination af den samlede stigning i oplyste ejere, ændringerne i porteføljeallokeringer i disse ejere og andre målinger. Tallet går fra 0 til 100, hvor højere tal indikerer et højere niveau af akkumulering for sine jævnaldrende, og 50 er gennemsnittet.
Opdateringsfrekvens: Dagligt
Se Ownership Explorer, som giver en liste over højest rangerende virksomheder.
AI+ Ask Fintel’s AI assistant about Barrick Mining Corporation.
Select a question to share a public post with an AI-crafted answer.
Thinking of good questions…
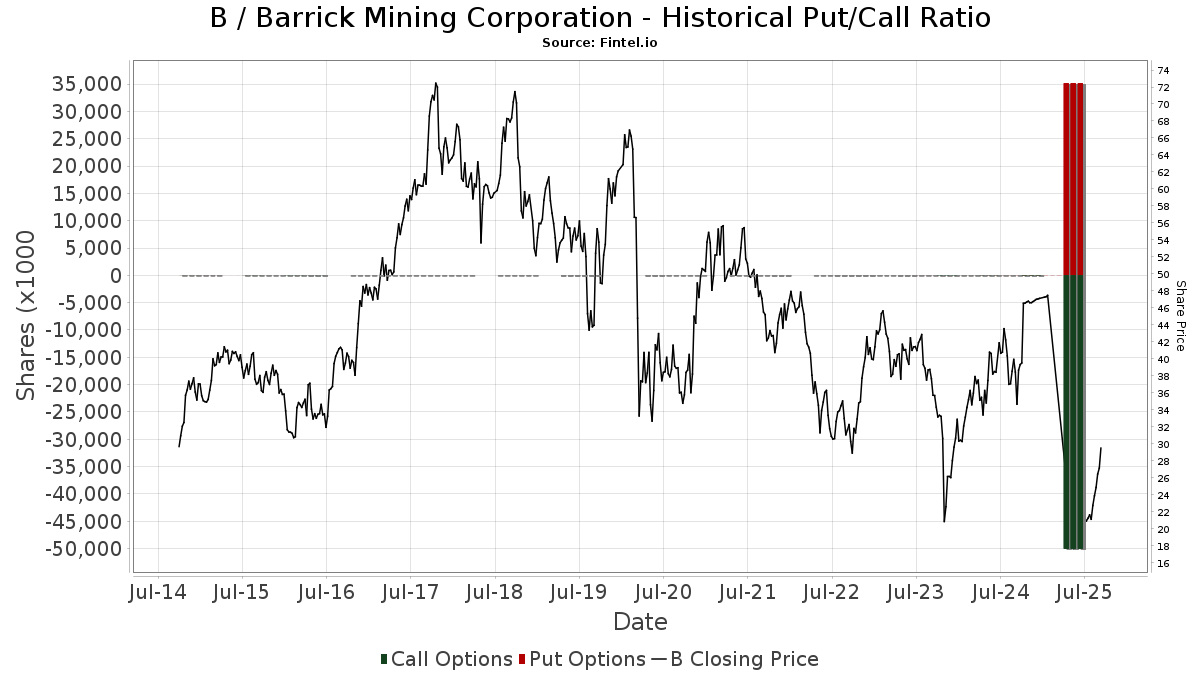
Institutionel Put/Call-forhold
Ud over at indberette standardaktie- og gældsudstedelser skal institutter med mere end 100 mill. aktiver under forvaltning også oplyse deres put- og call-optionsbeholdninger. Da salgsoptioner generelt indikerer negativ stemning, og købsoptioner indikerer positiv stemning, kan vi få en fornemmelse af den overordnede institutionelle stemning ved at plotte forholdet mellem put og kald. Diagrammet til højre viser det historiske put/call-forhold for dette instrument.
Brug af Put/Call Ratio som en indikator for investorernes stemning overvinder en af de vigtigste mangler ved at bruge totalt institutionelt ejerskab, som er, at en betydelig mængde af aktiver under forvaltning investeres passivt for at spore indekser. Passivt forvaltede fonde køber typisk ikke optioner, så indikatoren for put/call-forholdet følger mere nøje følelsen af aktivt forvaltede fonde.
13D/G-arkivering
Vi præsenterer 13D/G ansøgninger separat fra 13F ansøgninger på grund af den forskellige behandling af SEC. 13D/G-ansøgninger kan indgives af grupper af investorer (med én ledende), hvorimod 13F-ansøgninger ikke kan. Dette resulterer i situationer, hvor en investor kan indsende en 13D/G, der rapporterer én værdi for de samlede aktier (der repræsenterer alle de aktier, der ejes af investorgruppen), men derefter indsender en 13F, der rapporterer en anden værdi for de samlede aktier (der udelukkende repræsenterer deres egne) ejendomsret). Det betyder, at aktieejerskab af 13D/G-arkiver og 13F-arkiveringer ofte ikke er direkte sammenlignelige, så vi præsenterer dem separat.
Bemærk: Fra den 16. maj 2021 viser vi ikke længere ejere, der ikke har indsendt en 13D/G inden for det seneste år. Tidligere viste vi den fulde historie af 13D/G-arkiver. Generelt skal enheder, der er forpligtet til at indgive 13D/G-ansøgninger, indgive mindst årligt, før de indsender en afsluttende ansøgning. Dog forlader fonde nogle gange positioner uden at indsende en afsluttende ansøgning (dvs. de afvikler), så visning af den fulde historie resulterede nogle gange i forvirring om det nuværende ejerskab. For at undgå forvirring viser vi nu kun 'aktuelle' ejere - det vil sige - ejere, der har anmeldt inden for det seneste år.
Upgrade to unlock premium data.
| Fil dato | Form | Investor | Forrige Aktier |
Seneste Aktier |
Δ Aktier (Procent) |
Ejendomsret (Procent) |
Δ Ejerskab (Procent) |
|
|---|---|---|---|---|---|---|---|---|
| 2026-02-13 | Capital International Investors | 107,795,321 | 88,126,176 | -18.25 | 5.20 | -17.46 | ||
| 2025-07-17 | BlackRock, Inc. | 7,033,831 | 86,373,962 | 1,127.98 | 5.00 | -64.03 |
13F og NPORT arkivering
Detaljer om 13F-arkivering er gratis. Detaljer om NP-ansøgninger kræver et premium-medlemskab. Grønne rækker angiver nye positioner. Røde rækker angiver lukkede positioner. Klik på linket ikon for at se den fulde transaktionshistorik.
Opgrader
for at låse premium-data op og eksportere til Excel ![]() .
.
Important Note
In an effort to reduce load times for our mobile users, we are testing some ways to deliver lighter pages.
In this first test, we will deliver only the most recent 750 transactions (out of 1234 for this stock). If you are interested in loading *all* the transactions for this company, click the "load all" button below. This is just a test and if you don't like it, please let us know by submitting some gentle feedback via the link at the bottom of this page.
Load All| Fil dato | Kilde | Investor | Type | Gennemsnitlig pris (Øst) |
Aktier | Δ Aktier (%) |
Rapporteret Værdi ($1000) |
Δ Værdi (%) |
Port Alloc (%) |
|
|---|---|---|---|---|---|---|---|---|---|---|
| 2026-02-13 | 13F | Stifel Financial Corp | 634.838 | 42,86 | 27.647 | 89,86 | ||||
| 2026-02-06 | 13F | Vestmark Advisory Solutions, Inc. | 53.455 | 10,48 | 2.328 | 46,81 | ||||
| 2026-02-12 | 13F | UniSuper Management Pty Ltd | 467.354 | 0,84 | 27.943 | 31,91 | ||||
| 2026-02-11 | 13F | Fiera Capital Corp | 7.687 | -5,95 | 335 | 24,63 | ||||
| 2026-02-11 | 13F | Hughes Financial Services, LLC | 31 | 0,00 | 1 | 0,00 | ||||
| 2026-02-17 | 13F | Clayton Partners LLC | 135.761 | -1,09 | 5.912 | 31,47 | ||||
| 2026-04-21 | 13F | Fruth Investment Management | 20.150 | 1,77 | 1 | |||||
| 2026-02-11 | 13F | Zions Bancorporation, National Association /ut/ | 6.420 | 1,73 | 280 | 35,44 | ||||
| 2026-02-13 | 13F | Charles Schwab Investment Management Inc | 5.178.831 | -1,79 | 225.893 | 30,39 | ||||
| 2026-02-18 | 13F | Caitlin John, LLC | 4.940 | -10,83 | 215 | 18,78 | ||||
| 2026-01-26 | 13F | Mountain Hill Investment Partners Corp. | 73 | 0,00 | 3 | 50,00 | ||||
| 2026-02-10 | 13F | Peapack Gladstone Financial Corp | 38.124 | -1,14 | 2 | 0,00 | ||||
| 2026-01-07 | 13F | Harbor Investment Advisory, Llc | 67 | -6,94 | 3 | 0,00 | ||||
| 2026-01-20 | 13F | Westwood Wealth Management | 6.388 | 278 | ||||||
| 2026-02-04 | 13F | Ameritas Advisory Services, LLC | 0 | -100,00 | 0 | |||||
| 2026-04-20 | 13F | Sowell Financial Services LLC | 5.884 | -3,67 | 240 | -10,15 | ||||
| 2026-02-13 | 13F | Healthcare Of Ontario Pension Plan Trust Fund | 685.867 | 427,28 | 29.870 | 600,84 | ||||
| 2026-02-12 | 13F | Xponance, Inc. | 15.637 | 682 | ||||||
| 2026-02-11 | 13F | Fox Run Management, L.l.c. | 30.220 | -24,67 | 1.316 | 0,15 | ||||
| 2026-01-16 | 13F | Louisbourg Investments Inc. | 9.185 | -10,00 | 401 | 19,40 | ||||
| 2026-02-13 | 13F | Pathstone Holdings, LLC | 110.771 | -51,59 | 4.824 | -35,65 | ||||
| 2026-04-10 | 13F | Finivi Inc. | 51.594 | 9,02 | 2.105 | 2,09 | ||||
| 2026-01-30 | 13F | Laurel Wealth Advisors LLC | 700 | 30 | ||||||
| 2026-02-13 | 13F | FORA Capital, LLC | 0 | -100,00 | 0 | |||||
| 2026-01-26 | 13F | AE Wealth Management LLC | 6.627 | -10,81 | 289 | 18,52 | ||||
| 2026-01-29 | 13F | UBS Group AG | Put | 1.828.500 | 2,81 | 79.631 | 36,63 | |||
| 2026-01-29 | 13F | UBS Group AG | Call | 3.858.384 | 41,16 | 168.033 | 87,60 | |||
| 2025-11-12 | 13F | Transce3nd, LLC | 0 | -100,00 | 0 | -100,00 | ||||
| 2026-01-29 | 13F | UBS Group AG | 6.170.096 | 68,34 | 268.708 | 123,72 | ||||
| 2026-02-11 | 13F | Buckingham Strategic Partners | 15.733 | 67,66 | 685 | 115,41 | ||||
| 2026-02-17 | 13F | Cresset Asset Management, LLC | 40.648 | -1,50 | 1.770 | 30,92 | ||||
| 2026-01-21 | 13F | Flagship Harbor Advisors, Llc | 1.525 | 66 | ||||||
| 2025-11-04 | 13F | UMA Financial Services, Inc. | 0 | -100,00 | 0 | -100,00 | ||||
| 2026-04-03 | 13F | Adirondack Trust Co | 135 | 0,00 | 6 | 0,00 | ||||
| 2026-02-13 | 13F | Sumitomo Life Insurance Co | 73.700 | 3.211 | ||||||
| 2026-02-13 | 13F | Virtus ETF Advisers LLC | 2.856 | 2,00 | 171 | 33,86 | ||||
| 2025-11-14 | 13F | Jain Global LLC | 0 | -100,00 | 0 | -100,00 | ||||
| 2026-04-07 | 13F | CoreCap Advisors, LLC | 2.592 | -53,63 | 106 | -56,79 | ||||
| 2026-02-03 | 13F | Bronte Capital Management Pty Ltd. | 164.856 | -22,63 | 7.179 | -7,99 | ||||
| 2026-02-17 | 13F | Ninepoint Partners LP | 220.835 | -18,41 | 9.617 | 8,43 | ||||
| 2026-02-17 | 13F | Janus Henderson Group Plc | 439.182 | 47,65 | 19.136 | 96,22 | ||||
| 2026-02-10 | 13F | Godfrey Financial Associates, Inc. | 87 | 0 | ||||||
| 2026-04-14 | 13F | Banque Pictet & Cie Sa | 87.500 | -14,63 | 3.569 | -20,03 | ||||
| 2025-10-30 | 13F | Ridgewood Investments LLC | 0 | -100,00 | 0 | -100,00 | ||||
| 2026-02-10 | 13F | Mitsubishi UFJ Morgan Stanley Securities Co., Ltd. | 21.870 | 952 | ||||||
| 2025-10-30 | 13F | Ridgewood Investments LLC | Call | 0 | -100,00 | 0 | -100,00 | |||
| 2026-02-13 | 13F | Mudita Advisors LLP | 154.100 | 6.711 | ||||||
| 2026-02-13 | 13F | Causeway Capital Management Llc | 6.093.395 | -61,17 | 264.487 | -48,60 | ||||
| 2026-02-10 | 13F | Daiwa Securities Group Inc. | 70.500 | 3 | ||||||
| 2026-03-09 | 13F | Flax Pond Capital, Llc | 80.343 | 3.499 | ||||||
| 2026-02-13 | 13F | Schroder Investment Management Group | 3.943.390 | 17,28 | 174.456 | 56,57 | ||||
| 2026-04-13 | 13F | JCIC Asset Management Inc. | 214.582 | 1,83 | 8.752 | -4,67 | ||||
| 2026-02-17 | 13F | State Of Wisconsin Investment Board | 609.135 | 26.570 | ||||||
| 2026-02-17 | 13F | Private Advisor Group, LLC | 70.036 | 7,66 | 3.050 | 43,13 | ||||
| 2026-02-26 | 13F | Ssa Swiss Advisors Ag | 154.200 | 6.964 | ||||||
| 2026-02-17 | 13F | Alliancebernstein L.p. | 183.570 | -1,10 | 7.994 | 31,44 | ||||
| 2026-04-15 | 13F | Pullen Investment Management, LLC | 84.995 | 0,10 | 3.467 | -6,25 | ||||
| 2026-04-17 | 13F | Nautilus Advisors LLC | 9.910 | 20,69 | 404 | 13,17 | ||||
| 2025-11-13 | 13F | Riggs Asset Managment Co. Inc. | 0 | -100,00 | 0 | -100,00 | ||||
| 2025-11-13 | 13F | Eisler Capital Management Ltd. | 272.290 | 3.794,86 | 8.974 | 6.088,97 | ||||
| 2026-02-10 | 13F | Envestnet Asset Management Inc | 856.470 | -21,56 | 37.299 | 4,24 | ||||
| 2025-11-13 | 13F | Eisler Capital Management Ltd. | Put | 100.000 | -50,00 | 3.296 | -20,85 | |||
| 2026-02-05 | 13F | Atria Investments Llc | 38.035 | -6,05 | 1.656 | 24,89 | ||||
| 2026-04-10 | 13F | Country Trust Bank | 302 | 0,00 | 12 | -7,69 | ||||
| 2026-02-17 | 13F | Wealth Watch Advisors, INC | 0 | -100,00 | 0 | |||||
| 2026-03-04 | 13F | SHP Wealth Management | 250 | 11 | ||||||
| 2026-02-12 | 13F | Hollencrest Capital Management | 91.329 | 0,00 | 3.977 | 32,92 | ||||
| 2026-02-10 | 13F | Argent Trust Co | 17.485 | 0,00 | 761 | 33,04 | ||||
| 2026-01-26 | 13F | Means Investment Co., Inc. | 15.094 | 0,24 | 657 | 33,27 | ||||
| 2026-02-13 | 13F | Cornerstone Financial Management LLC | 56 | 2 | ||||||
| 2025-11-14 | 13F | Point72 (DIFC) Ltd | 48.199 | 88,94 | 1.579 | 197,36 | ||||
| 2026-04-21 | 13F | Venturi Wealth Management, LLC | 19.031 | 52,28 | 776 | 42,65 | ||||
| 2025-11-04 | 13F | Hazlett, Burt & Watson, Inc. | 0 | -100,00 | 0 | |||||
| 2025-12-05 | 13F | Saranac Partners Ltd | 0 | -100,00 | 0 | -100,00 | ||||
| 2026-01-23 | 13F | Steigerwald, Gordon & Koch Inc. | 33 | 0,00 | 1 | 0,00 | ||||
| 2026-02-17 | 13F | Clear Street Markets Llc | 33.400 | 4.075,00 | 1.455 | 5.492,31 | ||||
| 2026-02-13 | 13F | Integrated Wealth Concepts LLC | 118.698 | -10,02 | 5.169 | 19,57 | ||||
| 2026-02-04 | 13F | Nwam Llc | 13.291 | -34,16 | 682 | -2,85 | ||||
| 2026-02-06 | 13F | Marathon Asset Mgmt Ltd | 145.214 | -4,38 | 6.324 | 27,07 | ||||
| 2026-02-13 | 13F | Dai-Ichi Life Insurance Company, Ltd | 12.000 | 523 | ||||||
| 2026-02-04 | 13F | Asahi Life Asset Management Co., Ltd. | 7.189 | 314 | ||||||
| 2026-02-09 | 13F | Arista Wealth Management, LLC | 7.000 | 305 | ||||||
| 2026-02-13 | 13F | Bridgewater Associates, LP | 2.486.509 | 306,29 | 108.291 | 439,86 | ||||
| 2026-04-16 | 13F | Toth Financial Advisory Corp | 160 | 100,00 | 7 | 100,00 | ||||
| 2026-02-03 | 13F | McIlrath & Eck, LLC | 300 | 0,00 | 13 | 44,44 | ||||
| 2026-02-17 | 13F | Oaktree Fund Advisors, LLC | 181.494 | -5,17 | 7.904 | 26,04 | ||||
| 2026-04-20 | 13F | Assenagon Asset Management S.A. | 37.277 | -72,17 | 1.519 | -73,99 | ||||
| 2026-02-10 | 13F | Lido Advisors, LLC | 55.760 | -0,54 | 1.827 | -0,54 | ||||
| 2026-02-17 | 13F | Royal Bank Of Canada | Put | 0 | -100,00 | 0 | ||||
| 2026-02-09 | 13F | HBK Sorce Advisory LLC | 0 | -100,00 | 0 | |||||
| 2026-02-10 | 13F | Bruce G. Allen Investments, LLC | 1.553 | -46,78 | 68 | -29,47 | ||||
| 2026-02-12 | 13F | Intesa Sanpaolo Wealth Management | 600 | 26 | ||||||
| 2026-02-13 | 13F | AlTi Global, Inc. | 29.919 | 1.282 | ||||||
| 2026-02-13 | 13F | Ubs Oconnor Llc | Call | 0 | -100,00 | 0 | ||||
| 2026-02-13 | 13F | NLB Skladi, upravljanje premozenja, d.o.o. | 12.000 | 523 | ||||||
| 2026-04-21 | 13F | Everpar Advisors Llc | 0 | -100,00 | 0 | |||||
| 2026-02-17 | 13F | Dv Equities, Llc | 300 | 13 | ||||||
| 2026-04-15 | 13F | Hartford Financial Management Inc. | 8 | 0,00 | 0 | |||||
| 2026-04-13 | 13F | St Germain D J Co Inc | 60 | 0,00 | 2 | 0,00 | ||||
| 2026-02-10 | 13F | Clear Harbor Asset Management, LLC | 63.497 | -4,73 | 2.765 | 26,60 | ||||
| 2026-02-17 | 13F | GAM Holding AG | 6.600 | 288 | ||||||
| 2026-01-27 | 13F | Belpointe Asset Management LLC | 14.792 | 644 | ||||||
| 2026-02-17 | 13F | Orbis Allan Gray Ltd | 6.682.200 | 1,86 | 291.010 | 35,37 | ||||
| 2026-02-05 | 13F | AlphaCore Capital LLC | 17.604 | -6,47 | 767 | 24,35 | ||||
| 2026-01-22 | 13F | Richardson Financial Services Inc. | 9 | 44 | ||||||
| 2026-01-30 | 13F | W.G. Shaheen & Associates DBA Whitney & Co | 5.802 | 253 | ||||||
| 2026-02-05 | 13F | Bessemer Group Inc | 53.540 | -6,21 | 2 | 100,00 | ||||
| 2026-01-15 | 13F | Allspring Global Investments Holdings, LLC | 1.679.059 | 6,06 | 74.013 | 38,69 | ||||
| 2026-02-11 | 13F | Metis Global Partners, LLC | 169.991 | -14,69 | 7.405 | 13,16 | ||||
| 2026-02-17 | 13F | Holocene Advisors, LP | 0 | -100,00 | 0 | |||||
| 2026-02-17 | 13F | Quantinno Capital Management LP | 156.452 | 34,43 | 6.814 | 78,68 | ||||
| 2026-04-10 | 13F | Armstrong Advisory Group, Inc | 306 | 0,00 | 12 | -7,69 | ||||
| 2026-02-17 | 13F | Boothbay Fund Management, Llc | 61.820 | 511,59 | 2.692 | 713,29 | ||||
| 2026-01-27 | 13F | Ninety One UK Ltd | 13.351.515 | -3,30 | 581.458 | 28,51 | ||||
| 2026-01-20 | 13F | Red Door Wealth Management, LLC | 122.220 | 11,33 | 5.323 | 47,96 | ||||
| 2026-02-13 | 13F | Capital Financial Group Inc\co\ /adv | 16.130 | 702 | ||||||
| 2026-04-09 | 13F | Pacifica Partners Inc. | 120.188 | -2,37 | 4.900 | -9,50 | ||||
| 2026-02-10 | 13F | Rothschild Investment Llc | 13.550 | 0,00 | 590 | 32,88 | ||||
| 2026-02-12 | 13F | Dimensional Fund Advisors Lp | 15.285.500 | -13,26 | 665.723 | 15,27 | ||||
| 2026-02-10 | 13F | Savant Capital, LLC | 27.619 | 11,72 | 1.203 | 48,40 | ||||
| 2026-01-20 | 13F | Cromwell Holdings LLC | 3.062 | 0,00 | 133 | 33,00 | ||||
| 2026-02-04 | 13F | Legacy Financial Advisors, Inc. | 8.569 | 3,87 | 373 | 38,15 | ||||
| 2026-02-17 | 13F | SummitTX Capital, L.P. | 479.945 | 127,61 | 20.902 | 202,52 | ||||
| 2026-02-17 | 13F | one8zero8, LLC | 8.350 | -15,23 | 364 | 12,73 | ||||
| 2026-02-13 | 13F | Aviso Financial Inc. | 0 | -100,00 | 0 | |||||
| 2026-02-12 | 13F | JPL Wealth Management, LLC | 0 | -100,00 | 0 | |||||
| 2026-02-13 | 13F | Transamerica Financial Advisors, Inc. | 2.281 | 99 | ||||||
| 2026-04-13 | 13F | Augustine Asset Management Inc | 7.400 | 7,25 | 302 | 0,33 | ||||
| 2026-02-09 | 13F | Key FInancial Inc | 317 | -7,31 | 14 | 18,18 | ||||
| 2026-04-09 | 13F | Moody National Bank Trust Division | 10.305 | -3,93 | 420 | -10,06 | ||||
| 2026-04-10 | 13F | Henry James International Management Inc. | 40.921 | 0,00 | 1.669 | -6,34 | ||||
| 2026-02-12 | 13F | Swiss National Bank | 4.513.129 | 196.999 | ||||||
| 2025-11-06 | 13F | Madison Asset Management, LLC | 0 | -100,00 | 0 | -100,00 | ||||
| 2026-02-13 | 13F | Morgan Dempsey Capital Management Llc | 0 | -100,00 | 0 | |||||
| 2026-01-21 | 13F | Sound Income Strategies, LLC | 3.981 | 4,87 | 194 | 55,20 | ||||
| 2026-04-20 | 13F | City State Bank | 800 | 0,00 | 33 | -5,88 | ||||
| 2026-02-13 | 13F | Level Four Advisory Services, Llc | 40.334 | 14,22 | 1.757 | 51,77 | ||||
| 2026-02-11 | 13F | Allianz Asset Management GmbH | 1.835.781 | 101,31 | 80.073 | 167,28 | ||||
| 2026-02-17 | 13F | Qube Research & Technologies Ltd | Put | 168.100 | 240,28 | 7.321 | 352,41 | |||
| 2026-02-17 | 13F | Qube Research & Technologies Ltd | Call | 341.700 | -63,14 | 14.881 | -51,01 | |||
| 2026-02-17 | 13F | Tower Research Capital LLC (TRC) | 3.592 | -83,63 | 156 | -78,27 | ||||
| 2026-02-17 | 13F | Capital Fund Management S.a. | 599.674 | -53,71 | 26.116 | -38,48 | ||||
| 2026-04-16 | 13F | Capital Investment Advisors, LLC | 6.236 | 15,87 | 254 | 8,55 | ||||
| 2026-01-26 | 13F | JNBA Financial Advisors | 3.211 | -4,32 | 140 | 27,52 | ||||
| 2026-02-09 | 13F | GeoSphere Capital Management | 45.000 | 1.960 | ||||||
| 2026-02-12 | 13F | Greenfield Seitz Capital Management, LLC | 272.669 | -17,13 | 11.875 | 10,12 | ||||
| 2026-02-23 | 13F | Wealth Preservation Advisors, LLC | 1.670 | 0,00 | 73 | 33,33 | ||||
| 2026-02-17 | 13F | Qube Research & Technologies Ltd | 116.448 | -89,90 | 5.073 | -86,59 | ||||
| 2026-02-17 | 13F | Magnetar Financial LLC | 99.741 | -30,81 | 4.344 | -8,05 | ||||
| 2026-02-23 | 13F | Virtu Financial LLC | 0 | -100,00 | 0 | -100,00 | ||||
| 2026-04-15 | 13F | Compagnie Lombard Odier SCmA | 14.509 | -12,38 | 591 | -18,14 | ||||
| 2026-04-22 | 13F | Sterling Capital Management LLC | 0 | -100,00 | 0 | |||||
| 2026-01-28 | 13F | U S Global Investors Inc | Call | 0 | -100,00 | 0 | -100,00 | |||
| 2026-02-02 | 13F | Principal Financial Group Inc | 180.355 | 5,43 | 7.867 | 39,99 | ||||
| 2026-02-05 | 13F | Roberts Glore & Co Inc /il/ | 5.610 | -29,88 | 244 | -6,87 | ||||
| 2026-02-17 | 13F | SageView Advisory Group, LLC | 2.727 | 119 | ||||||
| 2025-11-12 | 13F | Park Square Financial Group, LLC | 0 | -100,00 | 0 | -100,00 | ||||
| 2026-02-13 | 13F | NewGen Asset Management Ltd | 0 | -100,00 | 0 | |||||
| 2026-02-17 | 13F | LaSalle St. Investment Advisors, LLC | 47.856 | 9,16 | 2 | 100,00 | ||||
| 2026-02-12 | 13F | Advocate Investing Services LLC | 204 | 9 | ||||||
| 2026-02-09 | 13F | Rhl Group, Llc | 20 | 1 | ||||||
| 2026-02-10 | 13F | Natixis Advisors, L.p. | 217.945 | -24,27 | 9 | 0,00 | ||||
| 2026-02-17 | 13F | Laird Norton Trust Company, Llc | 37.684 | 1.641 | ||||||
| 2026-02-02 | 13F | Cornerstone Planning Group LLC | 225 | 50,00 | 12 | 175,00 | ||||
| 2026-02-11 | 13F | Tiaa Trust, National Association | 6.127 | -0,44 | 267 | 32,34 | ||||
| 2026-02-13 | 13F | Pine Valley Investments Ltd Liability Co | 7.804 | 3,65 | 340 | 37,80 | ||||
| 2026-01-27 | 13F | Forum Financial Management, LP | 11.394 | 0,00 | 496 | 32,98 | ||||
| 2026-04-10 | 13F | Pure Financial Advisors, Inc. | 7.368 | 25,33 | 301 | 17,19 | ||||
| 2026-02-13 | 13F | Centiva Capital, LP | 10.717 | -88,56 | 467 | -84,81 | ||||
| 2026-01-23 | 13F | Rsm Us Wealth Management Llc | 16.801 | -14,15 | 743 | 15,91 | ||||
| 2026-04-03 | 13F | Investors Research Corp | 500 | 0,00 | 20 | -4,76 | ||||
| 2026-02-03 | 13F | Farmers & Merchants Investments Inc | 333 | 0,00 | 15 | 40,00 | ||||
| 2026-02-17 | 13F | Zurich Insurance Group Ltd/FI | 2.316.165 | 2.813,42 | 100.991 | 3.770,83 | ||||
| 2026-02-17 | 13F | Westwood Holdings Group Inc | 899.294 | -13,95 | 39.164 | 14,36 | ||||
| 2026-02-11 | 13F | Erste Asset Management GmbH | 43.700 | 1.911 | ||||||
| 2026-02-12 | 13F | Mount Yale Investment Advisors, LLC | 14.889 | -20,85 | 648 | 5,19 | ||||
| 2026-02-13 | 13F | Verition Fund Management LLC | Put | 440.700 | 25,48 | 19.192 | 66,77 | |||
| 2026-01-22 | 13F | Harwood Advisory Group, LLC | 250 | 0,00 | 11 | 25,00 | ||||
| 2026-02-13 | 13F | Verition Fund Management LLC | Call | 204.700 | -7,50 | 8.915 | 22,92 | |||
| 2026-04-07 | 13F | U.S. Capital Wealth Advisors, LLC | 50.389 | 5,54 | 2.055 | -1,15 | ||||
| 2026-02-10 | 13F | Quantbot Technologies LP | 104.236 | -69,59 | 4.539 | -59,59 | ||||
| 2026-02-12 | 13F | Equity Investment Corp | 2.596.877 | -24,91 | 113.094 | -0,20 | ||||
| 2026-04-13 | 13F | Fractal Investments LLC | 16.400 | 0,00 | 669 | -6,44 | ||||
| 2026-01-26 | 13F | Private Trust Co Na | 1.722 | -18,00 | 75 | 8,82 | ||||
| 2026-02-11 | 13F | CenterBook Partners LP | 33.742 | 1.469 | ||||||
| 2026-02-06 | 13F | Global Retirement Partners, LLC | 17.329 | 288,89 | 755 | 416,44 | ||||
| 2026-02-13 | 13F | Alberta Investment Management Corp | 621.000 | 27.052 | ||||||
| 2026-04-15 | 13F | Retireful, LLC | 6.478 | 5,54 | 264 | -2,58 | ||||
| 2026-04-13 | 13F | Wolff Wiese Magana Llc | 1.000 | 0,00 | 41 | -6,98 | ||||
| 2026-02-12 | 13F | Federation des caisses Desjardins du Quebec | 1.465.309 | 21,28 | 63.819 | 61,40 | ||||
| 2026-03-12 | 13F/A | Peak6 Llc | Call | 976.200 | -34,37 | 42.514 | -12,78 | |||
| 2026-03-12 | 13F/A | Peak6 Llc | 401.833 | 17.500 | ||||||
| 2026-03-12 | 13F/A | Peak6 Llc | Put | 539.000 | -20,86 | 23.473 | 5,17 | |||
| 2026-01-23 | 13F | Halbert Hargrove Global Advisors, Llc | 0 | -100,00 | 0 | |||||
| 2026-02-13 | 13F | Icon Advisers Inc/co | 80.000 | -18,37 | 3.484 | 8,50 | ||||
| 2026-02-20 | 13F | Sunbelt Securities, Inc. | 10.474 | 0,00 | 456 | 32,94 | ||||
| 2026-01-29 | 13F | Vanguard Group Inc | 71.000.889 | 0,17 | 3.092.869 | 32,86 | ||||
| 2026-01-20 | 13F | Savvy Advisors, Inc. | 25.786 | -9,34 | 1.123 | 20,39 | ||||
| 2026-02-03 | 13F | K.J. Harrison & Partners Inc | 5.800 | 253 | ||||||
| 2026-02-17 | 13F | Mirabella Financial Services Llp | 12.000 | 523 | ||||||
| 2026-02-13 | 13F | Hudson Bay Capital Management LP | 0 | -100,00 | 0 | |||||
| 2026-02-17 | 13F | Mirabella Financial Services Llp | Call | 9.500 | 414 | |||||
| 2026-02-17 | 13F | Royal Bank Of Canada | Call | 50.000 | 150,00 | 2.178 | 232,52 | |||
| 2026-02-12 | 13F | Continental Advisors Llc | Put | 33.000 | 1.437 | |||||
| 2026-02-12 | 13F | Continental Advisors Llc | 73.751 | -25,82 | 3.212 | -1,41 | ||||
| 2026-02-17 | 13F | Royal Bank Of Canada | 35.666.679 | -1,44 | 1.553.285 | 30,98 | ||||
| 2026-04-08 | 13F | BOS Asset Management, LLC | 108.785 | -2,17 | 4.437 | -8,36 | ||||
| 2026-01-16 | 13F | Bay Capital Advisors, LLC | 36.112 | 0,00 | 1.573 | 32,88 | ||||
| 2026-02-17 | 13F | Utah Retirement Systems | 192.537 | 0,00 | 8.398 | 32,77 | ||||
| 2026-02-09 | 13F | Williamson Legacy Group, LLC | 30.199 | 1.315 | ||||||
| 2026-02-12 | 13F | StoneX Group Inc. | 9.096 | -39,51 | 397 | -19,31 | ||||
| 2026-02-13 | 13F | Verition Fund Management LLC | 633.875 | -39,24 | 27.605 | -19,26 | ||||
| 2026-02-17 | 13F | Blair William & Co/il | 91.371 | -33,70 | 3.979 | -11,89 | ||||
| 2026-04-13 | 13F | Salem Investment Counselors Inc | 150 | 6 | ||||||
| 2026-02-13 | 13F | Motiv8 Investments LLC | 703 | 0 | ||||||
| 2026-01-22 | 13F | Networth Advisors, LLC | 280 | 12 | ||||||
| 2026-02-19 | 13F | Mcguire Capital Advisors Inc | 353 | 15 | ||||||
| 2026-01-12 | 13F | CVA Family Office, LLC | 200 | 0,00 | 9 | 33,33 | ||||
| 2026-01-23 | 13F | Transcend Wealth Collective, Llc | 15.526 | 7,64 | 676 | 43,22 | ||||
| 2026-01-27 | 13F | Hedges Asset Management LLC | 52.800 | -13,44 | 2.299 | 15,07 | ||||
| 2026-02-13 | 13F | Umb Bank N A/mo | 15.618 | -13,80 | 680 | 14,67 | ||||
| 2025-11-14 | 13F | Wood Tarver Financial Group, LLC | 0 | -100,00 | 0 | |||||
| 2026-04-21 | 13F | Xcel Wealth Management, LLC | 13.073 | 0,56 | 533 | -5,83 | ||||
| 2026-02-10 | 13F | Hillsdale Investment Management Inc. | 1.165.501 | 7,25 | 50.861 | 42,53 | ||||
| 2026-02-13 | 13F | Essex Investment Management Co Llc | 26.898 | 0,00 | 1.171 | 32,92 | ||||
| 2026-04-16 | 13F | Whitener Capital Management, Inc. | 64.371 | -0,01 | 2.626 | -6,35 | ||||
| 2026-02-17 | 13F | ExodusPoint Capital Management, LP | 0 | -100,00 | 0 | -100,00 | ||||
| 2025-11-12 | 13F | Group One Trading, L.p. | 0 | -100,00 | 0 | -100,00 | ||||
| 2026-02-17 | 13F | FIL Ltd | 30.099.422 | 85,27 | 1.311.169 | 145,73 | ||||
| 2026-02-17 | 13F | Old Mission Capital Llc | 40.221 | 1.752 | ||||||
| 2026-02-11 | 13F | LPL Financial LLC | 746.805 | -5,50 | 32.523 | 25,59 | ||||
| 2026-02-11 | 13F | Jpmorgan Chase & Co | 9.021.997 | -7,58 | 392.908 | 22,83 | ||||
| 2026-01-21 | 13F | Portside Wealth Group, LLC | 27.507 | 7,68 | 1.198 | 43,01 | ||||
| 2025-11-13 | 13F | NewGen Equity Long/Short Fund | 425.000 | 13.940 | ||||||
| 2026-01-29 | 13F | Financial Life Planners | 0 | -100,00 | 0 | |||||
| 2026-04-13 | 13F | Nvest Wealth Strategies, Inc. | 21 | 1 | ||||||
| 2026-04-17 | 13F | HHM Wealth Advisors, LLC | 400 | 0,00 | 16 | -5,88 | ||||
| 2026-01-16 | 13F | Crewe Advisors LLC | 172 | 48,28 | 7 | 133,33 | ||||
| 2026-02-13 | 13F | Lansdowne Partners (uk) Llp | 265.824 | 0,00 | 11.577 | 32,89 | ||||
| 2026-01-30 | 13F | Wealth High Governance Capital Ltda | 121.968 | 5.312 | ||||||
| 2026-02-05 | 13F | Avantax Planning Partners, Inc. | 7.789 | -17,45 | 339 | 9,71 | ||||
| 2026-02-13 | 13F | First Trust Advisors Lp | 147.583 | 263,62 | 6.428 | 383,31 | ||||
| 2026-02-11 | 13F | Holowesko Partners Ltd. | 0 | -100,00 | 0 | |||||
| 2026-04-15 | 13F | Silverlake Wealth Management Llc | 33.056 | 0,05 | 1.348 | -6,26 | ||||
| 2026-04-08 | 13F | Sapient Capital Llc | 101.728 | -7,85 | 4.144 | -14,99 | ||||
| 2026-01-30 | 13F | AMG National Trust Bank | 14.330 | 0,00 | 624 | 33,05 | ||||
| 2026-02-17 | 13F | Cape Investment Advisory, Inc. | 1.074 | 45 | ||||||
| 2026-01-16 | 13F | Vanguard Capital Wealth Advisors This fund is a listed as child fund of Vanguard Group Inc and if that institution has disclosed ownership in this security, then these positions will not be double counted when calculating total shares and total value | 0 | -100,00 | 0 | |||||
| 2026-02-12 | 13F | Ci Investments Inc. | 0 | -100,00 | 0 | |||||
| 2026-02-12 | 13F | Colonial Trust Co / SC | 667 | 0,00 | 29 | 38,10 | ||||
| 2026-02-09 | 13F | Hartland & Co., LLC | 823 | 0,00 | 36 | 34,62 | ||||
| 2026-02-13 | 13F | Banco Santander, S.A. | 76.045 | -6,83 | 3.312 | 23,82 | ||||
| 2026-02-17 | 13F | Ancora Advisors, LLC | 86 | 4 | ||||||
| 2025-11-14 | 13F | Point72 Hong Kong Ltd | 86.418 | 137,84 | 2.832 | 274,47 | ||||
| 2026-02-05 | 13F | Cambridge Investment Research Advisors, Inc. | 158.949 | 10,64 | 7 | 50,00 | ||||
| 2026-02-02 | 13F | Strs Ohio | 1.245.050 | -1,51 | 54.232 | 30,91 | ||||
| 2026-02-06 | 13F | Great Diamond Partners, LLC | 54.953 | 2.393 | ||||||
| 2026-02-12 | 13F | Cibc World Markets Corp | 93.132 | 4.056 | ||||||
| 2026-02-17 | 13F | Susquehanna Fundamental Investments, Llc | 259.100 | 95,69 | 11.284 | 160,10 | ||||
| 2026-02-10 | 13F | David R. Rahn & Associates Inc. | 17.600 | 0,00 | 766 | 32,99 | ||||
| 2026-02-12 | 13F | Hrt Financial Lp | 0 | -100,00 | 0 | |||||
| 2026-02-13 | 13F | Barclays Plc | Put | 0 | -100,00 | 0 | -100,00 | |||
| 2026-02-12 | 13F | Insigneo Advisory Services, Llc | 6.472 | 282 | ||||||
| 2026-02-18 | 13F | Guardian Capital Lp | 897.066 | 50,16 | 39.096 | 99,20 | ||||
| 2026-02-06 | 13F | Maj Invest Holding A/S | 0 | -100,00 | 0 | -100,00 | ||||
| 2026-02-17 | 13F | Quadrature Capital Ltd | 2.375.751 | -40,38 | 103.619 | -20,76 | ||||
| 2026-03-17 | 13F | Stance Capital Llc | 0 | -100,00 | 0 | -100,00 | ||||
| 2026-02-13 | 13F | Jacobi Capital Management LLC | 8.670 | -22,09 | 378 | 3,57 | ||||
| 2026-02-05 | 13F | Elyxium Wealth, LLC | 7 | 0 | ||||||
| 2026-02-13 | 13F | American Century Companies Inc | 3.259.313 | 2,28 | 141.954 | 35,85 | ||||
| 2026-02-06 | 13F | Fortis Group Advisors, LLC | 8.153 | -3,73 | 373 | 34,66 | ||||
| 2026-01-23 | 13F | Freestone Capital Holdings, LLC | Put | 1.000 | 44 | |||||
| 2026-01-23 | 13F | Freestone Capital Holdings, LLC | 4.307 | 188 | ||||||
| 2026-02-10 | 13F | Sound Shore Management Inc /ct/ | 1.155.678 | -0,72 | 50.330 | 31,94 | ||||
| 2026-02-12 | 13F | Ankerstar Wealth, LLC | 10 | 0 | ||||||
| 2026-02-11 | 13F | Saturna Capital CORP | 212.261 | 9.244 | ||||||
| 2026-02-17 | 13F | Banco Bilbao Vizcaya Argentaria, S.a. | 30.671 | -37,12 | 1.344 | -16,21 | ||||
| 2026-02-11 | 13F | Vestcor Inc | 80.100 | -8,46 | 3 | 50,00 | ||||
| 2026-03-20 | 13F | Purpose Unlimited Inc. | 45.649 | 1.992 | ||||||
| 2026-02-04 | 13F | Tsfg, Llc | 150 | 0,00 | 0 | |||||
| 2026-02-17 | 13F | Equitable Holdings, Inc. | 37.426 | -23,67 | 1.630 | 1,43 | ||||
| 2026-02-17 | 13F | Jones Financial Companies Lllp | 89.532 | 8,41 | 3.899 | 36,95 | ||||
| 2026-04-13 | 13F | Successful Portfolios LLC | 7.378 | -22,68 | 289 | -36,84 | ||||
| 2025-11-14 | 13F | AXA Investment Managers S.A. | 950.455 | 31.146 | ||||||
| 2026-01-29 | 13F | IMC-Chicago, LLC | 158.850 | 6.918 | ||||||
| 2026-01-21 | 13F | New Wave Wealth Advisors Llc | 7.466 | -1,18 | 325 | 31,58 | ||||
| 2026-04-06 | 13F | GAMMA Investing LLC | 318 | 0,00 | 13 | -7,69 | ||||
| 2026-02-19 | 13F | CI Private Wealth, LLC | 81.770 | 64,16 | 3.562 | 118,20 | ||||
| 2026-02-05 | 13F | Hills Bank & Trust Co | 2.417 | 105 | ||||||
| 2026-02-17 | 13F | Capital Fund Management S.a. | Call | 606.200 | -23,21 | 26.400 | 2,06 | |||
| 2026-01-26 | 13F | Quadrant Private Wealth Management, LLC | 5.972 | 260 | ||||||
| 2026-02-17 | 13F | Point72 Asset Management, L.P. | 1.194.182 | -33,08 | 52.006 | -11,06 | ||||
| 2026-02-12 | 13F | Triumph Capital Management | 626 | 19,01 | 27 | 58,82 | ||||
| 2026-02-17 | 13F | Capital Fund Management S.a. | Put | 955.200 | 16,94 | 41.599 | 55,41 | |||
| 2026-02-12 | 13F | Altiora Financial Group, LLC | 0 | -100,00 | 0 | |||||
| 2026-02-13 | 13F | Baird Financial Group, Inc. | 120.143 | 0,86 | 5.232 | 34,05 | ||||
| 2026-02-17 | 13F | Schonfeld Strategic Advisors LLC | 169.751 | -55,89 | 7.393 | -41,38 | ||||
| 2026-02-04 | 13F | Pensionmark Financial Group, Llc | 11.614 | 7,22 | 415 | 17,23 | ||||
| 2026-02-17 | 13F | Two Sigma Securities, Llc | 0 | -100,00 | 0 | |||||
| 2026-02-23 | 13F | Mv Capital Management, Inc. | 19 | 1 | ||||||
| 2026-02-10 | 13F | Easterly Investment Partners Llc | 0 | -100,00 | 0 | |||||
| 2026-02-17 | 13F | Farringdon Capital, Ltd. | 0 | -100,00 | 0 | |||||
| 2026-03-03 | 13F/A | Caitong International Asset Management Co., Ltd | 34.292 | 24,70 | 1.493 | 65,70 | ||||
| 2025-11-10 | 13F | Berkeley Capital Partners, LLC | 0 | -100,00 | 0 | -100,00 | ||||
| 2026-02-12 | 13F | Philadelphia Trust Co | 74.680 | 10,07 | 3 | 50,00 | ||||
| 2026-02-11 | 13F | West Family Investments, Inc. | 15.797 | -13,00 | 688 | 15,46 | ||||
| 2026-02-17 | 13F | Two Sigma Advisers, Lp | 1.332.700 | 110,54 | 58.039 | 179,80 | ||||
| 2026-02-04 | 13F | Aubrey Capital Management Ltd | 23.259 | -55,58 | 1.027 | -40,70 | ||||
| 2026-02-17 | 13F | Credit Agricole S A | 91.660 | -53,20 | 3.992 | -37,82 | ||||
| 2026-02-17 | 13F | Point72 Asset Management, L.P. | Put | 230.500 | 10.038 | |||||
| 2026-02-17 | 13F | Point72 Asset Management, L.P. | Call | 1.515.200 | 577,03 | 65.987 | 799,85 | |||
| 2026-02-05 | 13F | AustralianSuper Pty Ltd | 288.912 | 12.586 | ||||||
| 2026-04-13 | 13F | Artemis Investment Management LLP | 542.422 | 1,19 | 22.125 | -5,22 | ||||
| 2026-01-23 | 13F | Westside Investment Management, Inc. | 570 | 25 | ||||||
| 2026-01-14 | 13F | ORG Partners LLC | 2.102 | 28,01 | 92 | 71,70 | ||||
| 2026-02-13 | 13F | 1832 Asset Management L.P. | 778.062 | 34,65 | 33.885 | 78,94 | ||||
| 2026-02-11 | 13F | Investors Towarzystwo Funduszy Inwestycyjnych Spolka Akcyjna | 4.089 | 178 | ||||||
| 2026-02-10 | 13F | O'Neil Global Advisors, Inc. | 19.827 | 863 | ||||||
| 2026-02-13 | 13F | Change Path, LLC | 7.214 | 10,76 | 314 | 47,42 | ||||
| 2026-02-17 | 13F | Amundi | 8.912.421 | 3,30 | 388.902 | 32,46 | ||||
| 2026-01-22 | 13F | Massachusetts Financial Services Co /ma/ | 1.212.758 | 436,64 | 52.816 | 613,23 | ||||
| 2026-04-20 | 13F | LVW Advisors, LLC | 9.263 | 83,28 | 378 | 71,36 | ||||
| 2026-04-21 | 13F | PDS Planning, Inc | 7.394 | -0,63 | 302 | -7,10 | ||||
| 2026-01-20 | 13F | Cigna Investments Inc /new | 23.624 | 0,00 | 1 | |||||
| 2026-02-11 | 13F | Strategic Advocates LLC | 2.000 | 0,00 | 88 | 35,38 | ||||
| 2026-04-15 | 13F | Bayforest Capital Ltd | 5.553 | -23,13 | 227 | -28,03 | ||||
| 2026-02-13 | 13F | Pin Oak Investment Advisors Inc | 1.362 | 42,02 | 0 | -100,00 | ||||
| 2026-02-05 | 13F | HighMark Wealth Management LLC | 1.244 | 5,96 | 54 | 42,11 | ||||
| 2026-04-14 | 13F | Jeppson Wealth Management, Llc | 11.923 | -2,45 | 486 | -8,65 | ||||
| 2026-03-06 | 13F | Hsbc Holdings Plc | Call | 0 | -100,00 | 0 | ||||
| 2026-03-06 | 13F | Hsbc Holdings Plc | Put | 0 | -100,00 | 0 | ||||
| 2026-02-13 | 13F | Financial Freedom, LLC | 210 | 0,48 | 9 | 50,00 | ||||
| 2026-02-11 | 13F | Tacita Capital Inc | 5.962 | 260 | ||||||
| 2026-02-03 | 13F | Indie Asset Partners, LLC | 7.542 | 0,59 | 328 | 33,88 | ||||
| 2026-02-17 | 13F | Raymond James Financial Inc | 2.231.518 | -13,82 | 97.183 | 14,53 | ||||
| 2026-04-16 | 13F | Brookstone Capital Management | 6.077 | -62,49 | 248 | -64,96 | ||||
| 2026-01-30 | 13F/A | M&t Bank Corp | 45.882 | -0,69 | 1.998 | 32,06 | ||||
| 2026-02-09 | 13F | Huntington National Bank | 12.222 | 0,00 | 532 | 33,00 | ||||
| 2026-02-17 | 13F | Canada Pension Plan Investment Board | 12.999.559 | 63,22 | 566.289 | 116,53 | ||||
| 2026-02-13 | 13F | MAI Capital Management | 7.736 | 9,50 | 337 | 45,45 | ||||
| 2026-02-17 | 13F | Hilltop Holdings Inc. | 12.037 | -2,05 | 524 | 30,35 | ||||
| 2026-04-20 | 13F | Provenance Wealth Advisors, LLC | 925 | -4,93 | 38 | -11,90 | ||||
| 2026-02-06 | 13F | Keystone Financial Group | 37.167 | -25,25 | 1.619 | -0,68 | ||||
| 2026-02-13 | 13F | Inspire Advisors, LLC | 17.898 | 779 | ||||||
| 2026-04-07 | 13F | Eastern Bank | 254 | 0,00 | 10 | -9,09 | ||||
| 2025-11-10 | 13F | Monaco Asset Management SAM | 0 | -100,00 | 0 | -100,00 | ||||
| 2026-02-06 | 13F | Gsa Capital Partners Llp | 29.976 | 59,13 | 1 | |||||
| 2026-02-17 | 13F | Bramshill Investments, LLC | 30.139 | -35,13 | 1.313 | -13,80 | ||||
| 2026-02-10 | 13F | CIBC Asset Management Inc | 19.902.944 | 8,83 | 869.964 | 44,73 | ||||
| 2026-04-17 | 13F | Cidel Asset Management Inc | 18.500 | 0,00 | 754 | -6,58 | ||||
| 2026-01-15 | 13F | apricus wealth, LLC | 79.580 | -12,95 | 3.466 | 15,69 | ||||
| 2026-02-06 | 13F | GPS Wealth Strategies Group, LLC | 0 | -100,00 | 0 | |||||
| 2026-02-11 | 13F | HFR Wealth Management, LLC | 20.429 | 0,00 | 890 | 32,88 | ||||
| 2026-02-13 | 13F | Estabrook Capital Management | 0 | -100,00 | 0 | |||||
| 2026-01-23 | 13F | HBW Advisory Services LLC | 0 | -100,00 | 0 | |||||
| 2026-02-13 | 13F | Rhumbline Advisers | 3.162 | -1,92 | 138 | 30,48 | ||||
| 2026-04-22 | 13F | Mindset Wealth Management, Llc | 30.809 | -4,79 | 1.257 | -10,86 | ||||
| 2026-02-12 | 13F | Peterson Wealth Services | 1.183 | 52 | ||||||
| 2026-01-16 | 13F | Trust Co Of Vermont | 3.200 | -5,88 | 139 | 25,23 | ||||
| 2026-02-13 | 13F | PCM Encore, LLC | 9.876 | 430 | ||||||
| 2026-02-12 | 13F | Cloud Capital Management, LLC | 0 | -100,00 | 0 | |||||
| 2025-11-04 | 13F | Guerra Advisors Inc | 1 | 0 | ||||||
| 2026-04-13 | 13F | Loring Wolcott & Coolidge Fiduciary Advisors Llp/ma | 345 | 15 | ||||||
| 2026-02-09 | 13F | Harbour Investments, Inc. | 13.744 | -9,79 | 599 | 19,84 | ||||
| 2026-02-17 | 13F | Balyasny Asset Management Llc | Call | 0 | -100,00 | 0 | ||||
| 2026-02-13 | 13F | Quarry LP | 380 | -83,77 | 17 | -78,95 | ||||
| 2026-02-17 | 13F | Boreal Capital Management LLC | 218 | 0,00 | 9 | 28,57 | ||||
| 2026-02-12 | 13F | DRW Securities, LLC | Put | 0 | -100,00 | 0 | -100,00 | |||
| 2026-02-13 | 13F | Royal London Asset Management Ltd | 77.945 | 1,07 | 3.395 | 34,31 | ||||
| 2026-02-09 | 13F | Kingsview Wealth Management, LLC | 5.445 | 237 | ||||||
| 2026-02-12 | 13F | Brinker Capital Investments, LLC | 98.658 | 7,13 | 4.297 | 42,39 | ||||
| 2026-02-18 | 13F | VGI Partners Ltd | 833.279 | 15,25 | 36.289 | 53,17 | ||||
| 2026-04-09 | 13F | Towarzystwo Funduszy Inwestycyjnych Allianz Polska S.A. | 126.100 | 30,94 | 5.142 | 20,59 | ||||
| 2025-11-12 | 13F | Headlands Technologies LLC | 0 | -100,00 | 0 | -100,00 | ||||
| 2026-02-13 | 13F | Arete Wealth Advisors, LLC | 9.987 | 31,10 | 0 | |||||
| 2026-02-17 | 13F | Moore Capital Management, Lp | 745.761 | -44,50 | 32.478 | -26,25 | ||||
| 2026-04-17 | 13F | Krilogy Financial LLC | 0 | -100,00 | 0 | |||||
| 2026-01-30 | 13F | Kohmann Bosshard Financial Services, LLC | 255 | 11 | ||||||
| 2026-02-13 | 13F | Walleye Capital LLC | Call | 190.000 | 48,90 | 8.274 | 97,90 | |||
| 2026-02-17 | 13F | Liontrust Investment Partners LLP | 476.177 | 0,00 | 20.738 | 32,90 | ||||
| 2026-03-06 | 13F | Hsbc Holdings Plc | 1.202.437 | -57,25 | 52.679 | -42,96 | ||||
| 2026-02-04 | 13F | Lafayette Investments, Inc. | 328.535 | -0,53 | 14.308 | 32,19 | ||||
| 2026-02-13 | 13F | Walleye Capital LLC | Put | 210.100 | 569,11 | 9.150 | 789,98 | |||
| 2026-02-13 | 13F | Brown Advisory Inc | 18.105 | -8,97 | 788 | 21,04 | ||||
| 2026-02-03 | 13F | Cheviot Value Management, LLC | 330.761 | -22,46 | 17.524 | 29,02 | ||||
| 2026-02-13 | 13F | Walleye Capital LLC | 130.621 | -79,11 | 5.689 | -72,24 | ||||
| 2026-02-13 | 13F | Financial Sense Advisors, Inc. | 136.332 | -43,89 | 5.937 | -25,43 | ||||
| 2026-02-10 | 13F/A | Northwestern Mutual Wealth Management Co | 48.926 | 1,02 | 2.131 | 34,22 | ||||
| 2026-02-12 | 13F | Integrated Quantitative Investments LLC | 29.495 | -0,30 | 1.285 | 32,51 | ||||
| 2026-01-12 | 13F | VisionPoint Advisory Group, LLC | 14.604 | -24,20 | 636 | 0,79 | ||||
| 2026-02-02 | 13F | Hussman Strategic Advisors, Inc. | 61.000 | -60,13 | 2.657 | -47,02 | ||||
| 2026-02-17 | 13F | Blackstone Group Inc | 44.623 | 9,88 | 1.943 | 46,09 | ||||
| 2026-02-13 | 13F | Resources Investment Advisors, LLC. | 12.433 | -28,06 | 541 | -4,42 | ||||
| 2026-01-23 | 13F | Gibbs Wealth Management | 17.779 | -9,91 | 850 | 31,58 | ||||
| 2026-01-23 | 13F | Capital Investment Counsel, Inc | 0 | -100,00 | 0 | |||||
| 2026-02-13 | 13F | Bridgefront Capital, LLC | 0 | -100,00 | 0 | |||||
| 2026-01-30 | 13F | Trifecta Capital Advisors, LLC | 0 | -100,00 | 0 | -100,00 | ||||
| 2026-02-05 | 13F | Mount Lucas Management LP | 24.401 | -1,40 | 1.063 | 31,11 | ||||
| 2026-02-17 | 13F | Hillhouse Capital Advisors, Ltd. | 25.400 | 0,00 | 1.106 | 32,93 | ||||
| 2026-04-08 | 13F | Wealth Enhancement Trust Services, Inc. | 6.112 | 9,65 | 249 | 2,89 | ||||
| 2026-02-18 | 13F/A | Empowered Funds, LLC | 204.883 | 5,34 | 8.923 | 40,00 | ||||
| 2026-02-12 | 13F | Marex Group plc | 262.772 | 1.727,34 | 11.444 | 2.329,51 | ||||
| 2026-02-17 | 13F | Fmr Llc | 20.304.347 | 38,84 | 884.427 | 84,14 | ||||
| 2026-01-21 | 13F | Quilter Plc | 10.670 | 3,64 | 465 | 37,28 | ||||
| 2026-02-09 | 13F | Cary Street Partners Financial Llc | 122.729 | -4,89 | 5.345 | 26,40 | ||||
| 2026-02-13 | 13F | Dixon Mitchell Investment Counsel Inc. | 105 | 5 | ||||||
| 2026-02-17 | 13F | Engineers Gate Manager LP | 172.764 | -51,55 | 7.524 | -35,62 | ||||
| 2026-02-17 | 13F | XTX Topco Ltd | 0 | -100,00 | 0 | |||||
| 2026-02-17 | 13F | Susquehanna International Group, Llp | 2.704.188 | 117,42 | 117.767 | 188,95 | ||||
| 2026-02-17 | 13F | Susquehanna International Group, Llp | Put | 12.260.300 | 12,31 | 533.936 | 49,25 | |||
| 2026-02-05 | 13F | Navalign, LLC | 184 | 8 | ||||||
| 2026-02-13 | 13F | Kcm Investment Advisors Llc | 23.221 | -4,42 | 1.011 | 27,01 | ||||
| 2026-02-17 | 13F | Susquehanna International Group, Llp | Call | 11.034.900 | -19,04 | 480.570 | 7,59 | |||
| 2026-02-11 | 13F | TCTC Holdings, LLC | 1.134 | 0,00 | 49 | 32,43 | ||||
| 2026-01-26 | 13F | Haven Global Partners, LLC | 0 | -100,00 | 0 | -100,00 | ||||
| 2025-11-03 | 13F | Continental Advisors Llc | Call | 0 | -100,00 | 0 | -100,00 | |||
| 2026-01-22 | 13F | Bartlett & Co. Wealth Management Llc | 1.175 | 0,00 | 51 | 34,21 | ||||
| 2026-01-20 | 13F | SOA Wealth Advisors, LLC. | 581 | 0,00 | 25 | 31,58 | ||||
| 2026-02-12 | 13F | Renaissance Technologies Llc | 1.256.778 | 54.733 | ||||||
| 2026-02-17 | 13F | Public Employees Retirement System Of Ohio | 343.855 | -5,13 | 14.998 | 25,93 | ||||
| 2026-02-10 | 13F | Close Asset Management Ltd | 1.724 | -7,16 | 0 | |||||
| 2026-02-17 | 13F | Davidson Kempner Capital Management Lp | 1.659.141 | 374,04 | 72.256 | 530,00 | ||||
| 2026-01-22 | 13F | Comprehensive Money Management Services LLC | 41.820 | -2,51 | 1.821 | 29,61 | ||||
| 2026-01-29 | 13F | Marathon Capital Management | 129.825 | -4,32 | 5.654 | 27,15 | ||||
| 2026-04-20 | 13F | Cardinal Point Capital Management, ULC | 13.915 | -29,33 | 568 | -33,92 | ||||
| 2026-02-06 | 13F | Larson Financial Group LLC | 8.966 | 47,71 | 390 | 96,97 | ||||
| 2026-02-12 | 13F | Andina Capital Management, LLC | 0 | -100,00 | 0 | |||||
| 2026-02-12 | 13F | Miller Financial Services LLC | 8.838 | -7,20 | 385 | 23,08 | ||||
| 2025-11-14 | 13F | Axa S.a. | 0 | -100,00 | 0 | -100,00 | ||||
| 2026-02-11 | 13F | Capital International Inc /ca/ | 3.999.403 | -28,42 | 174.210 | -5,03 | ||||
| 2026-01-20 | 13F | American National Bank | 299 | 13 | ||||||
| 2026-02-13 | 13F | Corient IA LLC | 15.860 | -20,30 | 691 | 5,83 | ||||
| 2026-01-21 | 13F | Signature Resources Capital Management, LLC | 20 | 0,00 | 1 | |||||
| 2026-02-05 | 13F | Center for Financial Planning, Inc. | 133 | 6 | ||||||
| 2026-02-13 | 13F | Kayne Anderson Rudnick Investment Management Llc | 16.935 | 6,26 | 738 | 41,19 | ||||
| 2026-02-11 | 13F | Capital Analysts, Inc. | 500 | 0,00 | 0 | |||||
| 2026-02-06 | 13F | Fairtree Asset Management (Pty) Ltd | 3.031 | -46,22 | 132 | -28,26 | ||||
| 2026-04-09 | 13F | DHJJ Financial Advisors, Ltd. | 6 | 0,00 | 0 | |||||
| 2026-04-07 | 13F | Farther Finance Advisors, LLC | 37.622 | -5,14 | 1.588 | -8,11 | ||||
| 2026-02-17 | 13F | Cantor Fitzgerald, L. P. | 0 | -100,00 | 0 | |||||
| 2026-04-10 | 13F | Baker Tilly Financial, Llc | 6.457 | -2,90 | 263 | -9,00 | ||||
| 2026-04-17 | 13F | Webster Bank, N. A. | 1.490 | 0,00 | 61 | -6,25 | ||||
| 2026-04-06 | 13F | Highline Wealth Partners Llc | 160 | -6,43 | 7 | -14,29 | ||||
| 2026-02-06 | 13F | Pnc Financial Services Group, Inc. | 36.186 | 19,74 | 1.576 | 59,09 | ||||
| 2025-11-14 | 13F | Concentric Capital Strategies, LP | 0 | -100,00 | 0 | -100,00 | ||||
| 2026-01-26 | 13F | Main Street Group, LTD | 0 | -100,00 | 0 | -100,00 | ||||
| 2026-02-05 | 13F | WHI TRUST Co LLC | 2.498 | 109 | ||||||
| 2026-02-17 | 13F | Russell Investments Group, Ltd. | 3.686.921 | -8,21 | 160.776 | 22,01 | ||||
| 2026-02-10 | 13F | Td Asset Management Inc | 20.395.667 | 5,63 | 889.627 | 40,24 | ||||
| 2026-01-28 | 13F | Arizona State Retirement System | 0 | -100,00 | 0 | |||||
| 2026-02-06 | 13F | Gables Capital Management Inc. | 1.259 | 55 | ||||||
| 2026-04-08 | 13F | Hardin Capital Partners, LLC | 6.300 | 0,00 | 257 | -6,57 | ||||
| 2026-02-04 | 13F | Oxbow Advisors, LLC | 24.705 | -33,86 | 1.076 | -12,17 | ||||
| 2026-02-10 | 13F | Connor, Clark & Lunn Investment Management Ltd. | 10.059.966 | 11,61 | 438.234 | 48,06 | ||||
| 2026-01-14 | 13F | Klein Pavlis & Peasley Financial, Inc. | 56.053 | 2.441 | ||||||
| 2026-02-05 | 13F | PCG Wealth Advisors, LLC | 7.500 | -7,52 | 327 | 23,02 | ||||
| 2026-02-11 | 13F | Winton Capital Group Ltd | 331.353 | -14,76 | 14.430 | 13,28 | ||||
| 2026-02-17 | 13F | Sig Brokerage, Lp | 40.293 | 1.755 | ||||||
| 2026-04-20 | 13F | Nexus Investment Management ULC | 2.300 | 0,00 | 94 | 116,28 | ||||
| 2026-02-17 | 13F | Weiss Asset Management LP | 0 | -100,00 | 0 | -100,00 | ||||
| 2026-02-17 | 13F | Sig Brokerage, Lp | Put | 100.000 | 0,00 | 4.355 | 32,90 | |||
| 2026-04-21 | 13F | Wallace Advisory Group, LLC | 5.596 | -1,10 | 228 | -7,32 | ||||
| 2026-02-17 | 13F | Sig Brokerage, Lp | Call | 300.000 | -10,98 | 13.065 | 18,31 | |||
| 2026-02-13 | 13F | Smartleaf Asset Management LLC | 9.781 | 246,60 | 433 | 364,52 | ||||
| 2026-02-17 | 13F | Greenline Partners, LLC | 24.160 | -0,83 | 1.052 | 31,83 | ||||
| 2026-04-13 | 13F | E Fund Management Co., Ltd. | 58.436 | 2.388 | ||||||
| 2026-02-06 | 13F | Bare Financial Services, Inc | 155 | 0,00 | 7 | 20,00 | ||||
| 2026-02-10 | 13F | Sittner & Nelson, Llc | 834 | 0,00 | 38 | 37,04 | ||||
| 2026-02-17 | 13F | Merewether Investment Management, LP | 1.331.000 | -49,72 | 57.965 | -33,18 | ||||
| 2026-04-17 | 13F | Bell Investment Advisors, Inc | 81 | -41,30 | 3 | -50,00 | ||||
| 2026-02-05 | 13F | Gabelli Funds Llc | 1.208.565 | -3,87 | 52.633 | 27,76 | ||||
| 2026-02-13 | 13F | University Of Texas/texas Am Investment Managment Co | 33.672 | 1.466 | ||||||
| 2026-04-21 | 13F | TigerOak Management, L.L.C. | 5.000 | 0,00 | 200 | -7,83 | ||||
| 2026-04-15 | 13F | FNY Investment Advisers, LLC | Call | 0 | -100,00 | 0 | ||||
| 2026-01-23 | 13F | Factory Mutual Insurance Co | 51.742 | 0,00 | 2.253 | 32,92 | ||||
| 2026-01-22 | 13F | Westbourne Investments, Inc. | 11.250 | 490 | ||||||
| 2026-02-17 | 13F | LMR Partners LLP | Call | 21.000 | 0,00 | 915 | 32,85 | |||
| 2026-02-17 | 13F | LMR Partners LLP | Put | 75.300 | 0,00 | 3.279 | 32,91 | |||
| 2026-02-12 | 13F | Kovack Advisors, Inc. | 12.350 | 1,00 | 399 | -0,25 | ||||
| 2026-04-22 | 13F | Pictet Asset Management Holding SA | 686.680 | -23,87 | 27.969 | -28,89 | ||||
| 2026-01-26 | 13F | Asset Dedication, LLC | 2.214 | 0,00 | 96 | 33,33 | ||||
| 2026-04-06 | 13F | Rosenberg Matthew Hamilton | 978 | 0,00 | 40 | -7,14 | ||||
| 2026-02-13 | 13F | Clear Street Group Inc. | 5.417 | 236 | ||||||
| 2026-02-12 | 13F | Moneta Group Investment Advisors Llc | 6.261 | 273 | ||||||
| 2026-01-30 | 13F | Arlington Trust Co LLC | 0 | -100,00 | 0 | |||||
| 2026-02-06 | 13F | Profund Advisors Llc | 173.337 | -17,64 | 7.549 | 9,45 | ||||
| 2026-02-17 | 13F | Game Creek Capital, LP | Put | 0 | -100,00 | 0 | ||||
| 2026-04-10 | 13F | Northside Capital Management, LLC | 5.475 | 0,00 | 223 | -6,30 | ||||
| 2026-01-29 | 13F | Ashton Thomas Private Wealth, LLC | 18.454 | -89,08 | 804 | -85,51 | ||||
| 2026-04-21 | 13F | Pacific Sage Partners, LLC | 9.014 | -10,88 | 368 | -16,59 | ||||
| 2026-02-17 | 13F | Captrust Financial Advisors | 211.179 | 5,25 | 9.197 | 39,86 | ||||
| 2026-02-17 | 13F | Pinnacle Financial Partners, Inc. | 8.284 | 361 | ||||||
| 2026-02-13 | 13F | Ubs Asset Management Americas Inc | 284.429 | 233,86 | 12.387 | 343,78 | ||||
| 2026-04-21 | 13F | Pinnacle Wealth Management Advisory Group, LLC | 11.612 | 9,25 | 474 | 2,38 | ||||
| 2026-04-22 | 13F | Quintet Private Bank (Europe) S.A. | 12.382 | -2,58 | 504 | -9,03 | ||||
| 2026-02-09 | 13F | Bleakley Financial Group, LLC | 57.949 | 53,52 | 2.524 | 103,96 | ||||
| 2026-02-12 | 13F | Aviva Plc | 1.366.544 | 6,13 | 59.575 | 41,00 | ||||
| 2026-01-27 | 13F | Pekao Towarzystwo Funduszy Inwestycyjnych S.A. | 94.289 | 4.115 | ||||||
| 2026-02-09 | 13F | Pacific Wealth Strategies Group, Inc. | 16.896 | 144,48 | 736 | 225,22 | ||||
| 2026-02-09 | 13F | Genus Capital Management Inc. | 234.059 | 16,03 | 10.209 | 54,05 | ||||
| 2026-02-12 | 13F | CoreCommodity Management, LLC | 4.816 | 210 | ||||||
| 2026-01-27 | 13F | Zurcher Kantonalbank (Zurich Cantonalbank) | 597.044 | 2,59 | 26.042 | 36,21 | ||||
| 2026-04-17 | 13F | RFG Advisory, LLC | 56.619 | -17,56 | 2.309 | -22,80 | ||||
| 2026-02-10 | 13F | JTC Employer Solutions Trusteee Ltd | 19.975 | 0,00 | 1 | |||||
| 2026-02-13 | 13F | USS Investment Management Ltd | 311.770 | -3,45 | 13.592 | 28,42 | ||||
| 2026-04-16 | 13F | Sweeney & Michel, Llc | 5.051 | 0,12 | 217 | -9,58 | ||||
| 2026-02-10 | 13F | Smith Group Asset Management, LLC | 65.400 | -18,25 | 2.848 | 8,66 | ||||
| 2026-02-17 | 13F | Game Creek Capital, LP | 148.125 | 0,94 | 6.451 | 34,15 | ||||
| 2026-02-12 | 13F | Commonwealth Equity Services, Llc | 446.806 | -0,12 | 19.458 | 138.885,71 | ||||
| 2026-02-09 | 13F | Keating Financial Advisory Services, Inc. | 800 | 35 | ||||||
| 2026-02-10 | 13F | Bnp Paribas Arbitrage, Sa | Put | 4.170 | 3.433,90 | 24.741 | 6.309,33 | |||
| 2026-02-10 | 13F | Bnp Paribas Arbitrage, Sa | Call | 1.465 | 36,28 | 6.640 | 88,50 | |||
| 2026-02-13 | 13F | Arrowstreet Capital, Limited Partnership | 47.835.714 | -2,71 | 2.083.651 | 29,13 | ||||
| 2026-01-29 | 13F | Concurrent Investment Advisors, LLC | 69.704 | 322,83 | 3.036 | 462,04 | ||||
| 2026-01-20 | 13F | Princeton Global Asset Management LLC | 65 | 0,00 | 3 | 0,00 | ||||
| 2026-04-14 | 13F | Thurston, Springer, Miller, Herd & Titak, Inc. | 9.202 | -20,80 | 375 | -25,74 | ||||
| 2026-01-21 | 13F | Drummond Knight Asset Management Pty Ltd | 1.384.920 | 14,93 | 60.313 | 52,74 | ||||
| 2026-02-10 | 13F | Bnp Paribas Arbitrage, Sa | 3.019.445 | 49,68 | 131.497 | 98,92 | ||||
| 2025-11-14 | 13F | Graham Capital Management, L.P. | Call | 0 | -100,00 | 0 | -100,00 | |||
| 2026-01-28 | 13F | Ruffer LLP | 650.660 | -63,86 | 28.380 | -51,90 | ||||
| 2026-02-12 | 13F | Rossby Financial, LCC | 11.500 | 0,00 | 501 | 29,20 | ||||
| 2026-02-17 | 13F | Twinbeech Capital Lp | 9.800 | -25,58 | 427 | -1,16 | ||||
| 2026-04-02 | 13F | Aspect Partners, LLC | 0 | 0 | ||||||
| 2026-04-22 | 13F | Old Point Trust & Financial Services N A | 18.100 | 0,00 | 738 | -6,35 | ||||
| 2026-02-13 | 13F | Cohen & Steers, Inc. | 314.202 | 14 | ||||||
| 2026-02-17 | 13F | Polar Asset Management Partners Inc. | 166.000 | -34,51 | 7.233 | -13,10 | ||||
| 2026-02-24 | 13F | DGS Capital Management, LLC | 5.069 | 221 | ||||||
| 2026-04-22 | 13F | RMR Wealth Builders | 10.214 | 0,51 | 417 | -5,88 | ||||
| 2026-01-28 | 13F | Confluence Wealth Services, Inc. | 26.285 | 0,00 | 1.145 | 32,87 | ||||
| 2026-02-17 | 13F | Polar Asset Management Partners Inc. | Put | 100.000 | 4.355 | |||||
| 2026-02-11 | 13F | Deutsche Bank Ag\ | Put | 57.000 | 2.482 | |||||
| 2026-02-13 | 13F | Walleye Trading LLC | Call | 890.800 | 17,27 | 38.794 | 55,85 | |||
| 2026-02-11 | 13F | Deutsche Bank Ag\ | 1.900.054 | 20,91 | 82.747 | 60,68 | ||||
| 2026-02-13 | 13F | Walleye Trading LLC | 339.524 | 7,20 | 14.786 | 42,47 | ||||
| 2026-02-17 | 13F | Spears Abacus Advisors LLC | 1.396.930 | -24,74 | 60.836 | 0,02 | ||||
| 2026-02-13 | 13F | Walleye Trading LLC | Put | 1.285.900 | 22,04 | 56.001 | 62,18 | |||
| 2026-02-11 | 13F | Franklin Resources Inc | 6.281.522 | 18,52 | 273.569 | 57,47 | ||||
| 2026-01-26 | 13F | Patriot Financial Group Insurance Agency, LLC | 54.409 | -3,22 | 2.370 | 28,61 | ||||
| 2026-02-02 | 13F | Oppenheimer & Co Inc | 31.331 | 1,66 | 1.364 | 35,18 | ||||
| 2026-02-24 | 13F | Chelsea Counsel Co | 31.215 | -0,65 | 1.359 | 32,07 | ||||
| 2026-02-11 | 13F | J.w. Cole Advisors, Inc. | 42.240 | 41,69 | 1.076 | 10,25 | ||||
| 2026-02-17 | 13F | Quantessence Capital LLC | 0 | -100,00 | 0 | |||||
| 2026-02-12 | 13F | Bradley Foster & Sargent Inc/ct | 41.497 | 1,24 | 1.807 | 34,55 | ||||
| 2026-01-30 | 13F | Bogart Wealth, LLC | 6.442 | 3,50 | 281 | 37,93 | ||||
| 2026-02-02 | 13F | Addison Capital Co | 5.695 | -27,50 | 248 | -3,50 | ||||
| 2026-02-11 | 13F | SOUTH STATE Corp | 378.499 | 297,91 | 16.484 | 428,81 | ||||
| 2026-02-17 | 13F | Anson Funds Management LP | Call | 25.000 | 1.089 | |||||
| 2026-02-13 | 13F | Evelyn Partners Investment Management LLP | 10.096 | -1,62 | 440 | 30,65 | ||||
| 2026-02-18 | 13F | EP Wealth Advisors, Inc. | 9.206 | 401 | ||||||
| 2026-04-17 | 13F | Vermillion Wealth Management, Inc. | 685 | 0,00 | 28 | -6,90 | ||||
| 2026-01-21 | 13F | McElhenny Sheffield Capital Management, LLC | 0 | -100,00 | 0 | -100,00 | ||||
| 2026-04-09 | 13F | Chemistry Wealth Management LLC | 11.373 | -3,89 | 464 | -10,10 | ||||
| 2026-02-12 | 13F | Callan Family Office, LLC | 15.520 | 676 | ||||||
| 2026-02-13 | 13F | Mufg Securities (canada), Ltd. | 2.569.327 | -8,99 | 111.948 | 20,75 | ||||
| 2026-01-22 | 13F | Apollon Wealth Management, LLC | 4.955 | -65,59 | 216 | -54,35 | ||||
| 2025-11-14 | 13F | Point72 Asia (Singapore) Pte. Ltd. | 117.519 | 34,14 | 3.851 | 111,07 | ||||
| 2026-04-20 | 13F | Heritage Wealth Management, Inc. | 8.956 | -1,10 | 365 | -7,36 | ||||
| 2026-02-10 | 13F | Excalibur Management Corp | 14.631 | -0,68 | 637 | 32,16 | ||||
| 2026-02-12 | 13F | Penserra Capital Management LLC | 2.520 | 50,27 | 0 | |||||
| 2026-01-21 | 13F | Newbridge Financial Services Group, Inc. | 2.906 | 48,57 | 127 | 96,88 | ||||
| 2026-04-21 | 13F | Sunpointe, LLC | 8.545 | -48,47 | 348 | -51,80 | ||||
| 2026-02-11 | 13F | Prudential Plc | 0 | -100,00 | 0 | |||||
| 2026-01-26 | 13F | Reyes Financial Architecture, Inc. | 1.382 | 3,44 | 60 | 39,53 | ||||
| 2026-02-11 | 13F | Simplex Trading, Llc | 256.167 | 11.156 | ||||||
| 2026-04-16 | 13F | Aurora Private Wealth, Inc. | 17.486 | 0,00 | 1 | |||||
| 2026-02-13 | 13F | Extract Advisors LLC | 275.000 | 11.976 | ||||||
| 2026-02-12 | 13F | Great Lakes Retirement, Inc. | 34.904 | 1.520 | ||||||
| 2026-02-13 | 13F | Citigroup Inc | 2.043.928 | -1,17 | 89.153 | 31,22 | ||||
| 2026-02-13 | 13F | Citigroup Inc | Call | 2.187.300 | 1.219,24 | 95.407 | 1.651,85 | |||
| 2026-01-22 | 13F | Bfsg, Llc | 40 | 2 | ||||||
| 2026-01-27 | 13F | Evergreen Capital Management Llc | 8.186 | 32,74 | 357 | 76,24 | ||||
| 2026-02-10 | 13F | CIBC World Markets Inc. | 15.281.743 | 16,41 | 665.826 | 54,46 | ||||
| 2026-04-14 | 13F | Pinnacle Wealth Management Group, Inc. | 7.700 | 0,00 | 314 | -6,27 | ||||
| 2026-02-10 | 13F | CIBC World Markets Inc. | Put | 200.000 | 8.714 | |||||
| 2026-02-13 | 13F | Citigroup Inc | Put | 400.000 | 0,00 | 17.447 | 32,78 | |||
| 2026-02-10 | 13F | CIBC World Markets Inc. | Call | 54.400 | -89,19 | 2.370 | -85,66 | |||
| 2026-02-17 | 13F | Coastal Bridge Advisors, LLC | 15.824 | 0,61 | 689 | 33,79 | ||||
| 2026-02-05 | 13F | ANTIPODES PARTNERS Ltd | 4.475.725 | -20,46 | 194.937 | 5,70 | ||||
| 2026-02-09 | 13F | Jefferies Financial Group Inc. | Call | 0 | -100,00 | 0 | -100,00 | |||
| 2026-02-06 | 13F/A | Rathbone Brothers plc | 107.173 | -21,48 | 4.672 | 4,36 | ||||
| 2026-03-03 | 13F | Employees Provident Fund Board | 5.081.880 | 221.664 | ||||||
| 2025-10-31 | 13F | Whittier Trust Co Of Nevada Inc | 0 | -100,00 | 0 | -100,00 | ||||
| 2026-02-05 | 13F | LGT Group Foundation | 5.000 | 221 | ||||||
| 2026-02-13 | 13F | Bornite Capital Management LP | 0 | -100,00 | 0 | |||||
| 2026-02-17 | 13F | Maple Rock Capital Partners Inc. | 1.991.400 | 86.725 | ||||||
| 2026-04-17 | 13F | A. D. Beadell Investment Counsel, Inc. | 83.430 | -5,19 | 3 | 0,00 | ||||
| 2026-02-17 | 13F | Caption Management, LLC | 28.200 | 940,97 | 1.228 | 1.295,45 | ||||
| 2026-02-17 | 13F | Caption Management, LLC | Call | 440.000 | 1.000,00 | 19.162 | 1.362,75 | |||
| 2026-02-13 | 13F | Gemsstock Ltd. | 1.157.850 | 8,51 | 50.424 | 44,21 | ||||
| 2025-11-07 | 13F | Beacon Capital Management, LLC | 0 | -100,00 | 0 | -100,00 | ||||
| 2026-04-17 | 13F | Buffalo Business & Estate Services Ltd | 55.131 | -11,15 | 2.249 | -16,80 | ||||
| 2026-02-13 | 13F | Solstein Capital, LLC | 3.750 | 0,00 | 163 | 33,61 | ||||
| 2026-02-12 | 13F | BlackRock, Inc. | 56.877.933 | 1,72 | 2.477.034 | 35,18 | ||||
| 2026-02-13 | 13F | Bank Of Nova Scotia | 4.626.337 | -17,40 | 201.518 | 9,45 | ||||
| 2026-02-09 | 13F | Jefferies Financial Group Inc. | 108.838 | -17,64 | 4.740 | 9,45 | ||||
| 2026-01-13 | 13F | Stonehage Fleming Financial Services Holdings Ltd | 8.646 | 0,00 | 377 | 32,75 | ||||
| 2026-01-29 | 13F | S.A. Mason LLC | 23.114 | 1,31 | 1.007 | 34,67 | ||||
| 2026-02-12 | 13F | Quadrant Capital Group Llc | 31.009 | -0,74 | 1.350 | 31,96 | ||||
| 2026-04-15 | 13F | Avanza Fonder AB | 10.351 | 0,00 | 588 | -4,85 | ||||
| 2026-01-14 | 13F | Aegis Wealth Management LLC | 12.000 | 0,00 | 523 | 32,82 | ||||
| 2026-02-17 | 13F/A | Uniplan Investment Counsel, Inc. | 68.336 | -3,65 | 2.976 | 28,06 | ||||
| 2026-02-13 | 13F | Wilkerson Advisory Group LLC | 68 | 3 | ||||||
| 2026-02-17 | 13F | Ameriflex Group, Inc. | 2.253 | -66,44 | 98 | -55,45 | ||||
| 2026-02-10 | 13F | Brickwood Asset Management LLP | 0 | -100,00 | 0 | |||||
| 2026-02-03 | 13F | Winch Advisory Services, LLC | 233 | 0,43 | 10 | 42,86 | ||||
| 2026-02-17 | 13F | WFA of San Diego, LLC | 0 | -100,00 | 0 | |||||
| 2026-01-30 | 13F | North Star Investment Management Corp. | 135 | 110,94 | 6 | 150,00 | ||||
| 2026-01-23 | 13F | Penn Mutual Asset Management, LLC | 0 | -100,00 | 0 | -100,00 | ||||
| 2026-02-13 | 13F | Kopernik Global Investors, LLC | 590.051 | -80,70 | 25.697 | -74,35 | ||||
| 2026-02-03 | 13F | Manning & Napier Advisors Llc | 127.759 | -2,59 | 5.652 | 30,05 | ||||
| 2026-02-17 | 13F | Worldquant Millennium Advisors Llc | 130.927 | 217,60 | 5.705 | 321,66 | ||||
| 2025-11-13 | 13F | Entropy Technologies, LP | 0 | -100,00 | 0 | -100,00 | ||||
| 2026-02-19 | 13F | Invesco Ltd. | 9.233.245 | -11,89 | 402.108 | 17,09 | ||||
| 2025-11-12 | 13F | CIBC Bancorp USA Inc. | 8.260 | 286 | ||||||
| 2026-01-15 | 13F | Lodestone Wealth Management LLC | 800 | 35 | ||||||
| 2026-02-17 | 13F | Millennium Management Llc | Put | 803.900 | 63,23 | 35.010 | 116,92 | |||
| 2026-04-17 | 13F | Kennebec Savings Bank | 272 | 0,00 | 11 | 0,00 | ||||
| 2026-02-11 | 13F | FLC Capital Advisors | 26.032 | -5,49 | 1.134 | 25,61 | ||||
| 2026-02-17 | 13F | Millennium Management Llc | 6.287.372 | -31,58 | 273.840 | -9,07 | ||||
| 2026-01-20 | 13F | Stratos Wealth Advisors, LLC | 10.915 | -19,24 | 475 | 7,47 | ||||
| 2026-02-17 | 13F | Millennium Management Llc | Call | 576.200 | -73,04 | 25.094 | -64,18 | |||
| 2026-02-13 | 13F | Alliance Private Wealth, LLC | 70.831 | 3.367 | ||||||
| 2026-01-23 | 13F | Diversify Advisory Services, LLC | 16.203 | 98,71 | 790 | 193,31 | ||||
| 2026-04-21 | 13F | Cfm Wealth Partners Llc | 6.000 | -20,00 | 245 | -25,15 | ||||
| 2026-01-15 | 13F | Jaffetilchin Investment Partners, LLC | 5.548 | -76,68 | 242 | -69,06 | ||||
| 2026-02-04 | 13F | Glass Wealth Management Co LLC | 215.530 | 2,68 | 9.386 | 36,46 | ||||
| 2026-02-11 | 13F | Harvest Fund Management Co., Ltd | 841 | 0 | ||||||
| 2026-02-17 | 13F | Hbk Investments L P | 0 | -100,00 | 0 | |||||
| 2026-01-22 | 13F | BOCHK Asset Management Ltd | 1.200 | 52 | ||||||
| 2026-02-17 | 13F | Cetera Investment Advisers | 251.756 | 4,89 | 10.964 | 39,39 | ||||
| 2026-01-16 | 13F | Empirical Financial Services, LLC d.b.a. Empirical Wealth Management | 5.869 | -9,61 | 256 | 20,28 | ||||
| 2026-02-03 | 13F | Costello Asset Management, INC | 800 | -20,00 | 35 | 6,25 | ||||
| 2026-02-13 | 13F | Ieq Capital, Llc | 48.837 | 9,07 | 2.127 | 44,92 | ||||
| 2026-02-17 | 13F | Edmond De Rothschild Holding S.a. | 10.110 | -20,44 | 441 | 5,76 | ||||
| 2026-02-17 | 13F | Matters Capital Llc | 103.461 | 4.506 | ||||||
| 2026-02-06 | 13F | Aviance Capital Partners, LLC | 6.549 | 285 | ||||||
| 2026-01-15 | 13F | Nisa Investment Advisors, Llc | 800 | 35 | ||||||
| 2026-01-28 | 13F | Turtle Creek Wealth Advisors, LLC | 5.000 | 218 | ||||||
| 2026-02-06 | 13F | Cedar Wealth Management, LLC | 13.240 | 0,00 | 577 | 33,03 | ||||
| 2026-02-17 | 13F | Bank Of America Corp /de/ | Put | 0 | -100,00 | 0 | ||||
| 2026-04-13 | 13F | Highland Capital Management, Llc | 64.039 | -0,39 | 2.612 | -6,68 | ||||
| 2026-04-14 | 13F | Nbc Securities, Inc. | 6.023 | -24,03 | 246 | -28,99 | ||||
| 2026-02-17 | 13F | VestGen Advisors, LLC | 4.784 | 208 | ||||||
| 2026-01-30 | 13F | Skylands Capital, LLC | 271.325 | -12,24 | 11.816 | 16,63 | ||||
| 2026-02-10 | 13F | State of Wyoming | 17.472 | 0,97 | 761 | 34,04 | ||||
| 2026-02-02 | 13F | Oppenheimer Asset Management Inc. | 228.351 | -12,70 | 9.945 | 16,02 | ||||
| 2026-04-20 | 13F | Ronald Blue Trust, Inc. | 43.570 | -9,82 | 1.777 | -15,54 | ||||
| 2026-04-10 | 13F | Auto-Owners Insurance Co | 10.200 | 0,00 | 416 | -6,31 | ||||
| 2026-04-16 | 13F | Smith, Salley & Associates | 0 | -100,00 | 0 | |||||
| 2026-03-03 | 13F | NWF Advisory Services Inc. | 9.441 | -0,80 | 411 | 32,15 | ||||
| 2026-02-13 | 13F | Vontobel Holding Ltd. | 981.295 | -42,78 | 42.735 | -23,96 | ||||
| 2026-02-17 | 13F | Bank OZK | 15.881 | 692 | ||||||
| 2026-02-13 | 13F | Prudential Financial Inc | 360.932 | -35,04 | 15.744 | -13,75 | ||||
| 2026-02-13 | 13F | Vontobel Holding Ltd. | Put | 85.600 | 42,67 | 3.728 | 89,57 | |||
| 2026-02-13 | 13F | Vontobel Holding Ltd. | Call | 80.000 | 3.484 | |||||
| 2026-02-09 | 13F | Smithfield Trust Co | 857 | 0 | ||||||
| 2026-04-17 | 13F | CENTRAL TRUST Co | 2.064 | -27,93 | 84 | -32,26 | ||||
| 2026-02-13 | 13F | Thomist Capital Management, LP | 330.600 | 62,86 | 14.626 | 117,41 | ||||
| 2026-02-17 | 13F | Aquatic Capital Management LLC | 87.495 | -84,18 | 3.810 | -78,97 | ||||
| 2026-04-10 | 13F | Perigon Wealth Management, LLC | 40.987 | 11,38 | 1.672 | 4,31 | ||||
| 2026-02-17 | 13F | United Capital Financial Advisers, Llc | 175.240 | -9,34 | 7.632 | 20,50 | ||||
| 2026-02-17 | 13F | Two Sigma Investments, Lp | 194.500 | -20,99 | 8.470 | 5,00 | ||||
| 2026-02-17 | 13F | Empyrean Capital Partners, LP | 821.000 | 35.755 | ||||||
| 2026-02-17 | 13F | Hartree Partners, LP | 0 | -100,00 | 0 | |||||
| 2026-01-09 | 13F | 180 Wealth Advisors, Llc | 15.611 | -0,70 | 680 | 31,84 | ||||
| 2026-02-12 | 13F | Canopy Partners, LLC | 4.415 | 192 | ||||||
| 2026-02-13 | 13F | OMERS ADMINISTRATION Corp | 49.036 | -72,71 | 2.139 | -63,75 | ||||
| 2026-04-21 | 13F | Pinnacle Associates Ltd | 23.491 | 5,27 | 958 | -1,34 | ||||
| 2026-04-21 | 13F | Nemes Rush Group LLC | 9 | 0,00 | 0 | |||||
| 2026-02-13 | 13F | Fiduciary Trust Co | 62.484 | -5,05 | 2.721 | 26,21 | ||||
| 2026-02-09 | 13F | Mondrian Investment Partners LTD | 848.733 | -71,60 | 36.962 | -62,26 | ||||
| 2026-01-27 | 13F | Revisor Wealth Management LLC | 7.843 | 368 | ||||||
| 2026-02-17 | 13F | Widmann Financial Services, Inc. | 30.277 | 0,00 | 1.319 | 32,86 | ||||
| 2026-04-06 | 13F | Stableford Capital Ii Llc | 0 | -100,00 | 0 | |||||
| 2026-04-16 | 13F | Guardian Investment Management | 10.125 | -0,74 | 413 | -7,21 | ||||
| 2026-02-02 | 13F | Peregrine Asset Advisers, Inc. | 36.361 | 0,00 | 1.584 | 32,91 | ||||
| 2026-02-11 | 13F | O'shaughnessy Asset Management, Llc | 349.790 | 9,02 | 15.236 | 44,71 | ||||
| 2026-04-09 | 13F | Butensky & Cohen Financial Security, Inc | 136.858 | -14,36 | 5.576 | -19,89 | ||||
| 2026-01-28 | 13F | CAPROCK Group, Inc. | 117.352 | -1,45 | 5.111 | 60,24 | ||||
| 2025-11-12 | 13F | Bellwether Advisors, LLC | 0 | -100,00 | 0 | |||||
| 2026-04-22 | 13F | Coastal Investment Advisors, Inc. | 31.950 | -22,17 | 1.302 | -27,20 | ||||
| 2026-01-29 | 13F | RMG Wealth Management LLC | 0 | -100,00 | 0 | -100,00 | ||||
| 2026-01-14 | 13F | Clarius Group, LLC | 13.309 | 0,00 | 580 | 32,80 | ||||
| 2026-02-13 | 13F | Palisade Asset Management, LLC | 0 | -100,00 | 0 | -100,00 | ||||
| 2026-02-12 | 13F | Sumitomo Mitsui Financial Group, Inc. | 0 | -100,00 | 0 | |||||
| 2026-02-13 | 13F | Arkadios Wealth Advisors | 7.486 | -4,30 | 326 | 27,34 | ||||
| 2026-01-28 | 13F | HB Wealth Management, LLC | 7.579 | 330 | ||||||
| 2026-01-15 | 13F | Gunderson Capital Management Inc. | 206.353 | 8.987 | ||||||
| 2026-01-27 | 13F | Checchi Capital Advisers, LLC | 7.158 | -31,80 | 312 | -9,33 | ||||
| 2026-01-29 | 13F | Beirne Wealth Consulting Services, LLC | 10.366 | 0,00 | 451 | 33,04 | ||||
| 2026-02-11 | 13F | Cedar Mountain Advisors, LLC | 250 | 0,00 | 11 | 25,00 | ||||
| 2026-01-20 | 13F | Meridian Investment Counsel Inc. | 67.509 | -1,97 | 2.940 | 30,32 | ||||
| 2026-02-09 | 13F | Employees Retirement System of Texas | 118.586 | 0,00 | 5 | 66,67 | ||||
| 2025-11-17 | 13F | Front Row Advisors LLC | 0 | -100,00 | 0 | |||||
| 2026-01-12 | 13F | AllSquare Wealth Management LLC | 350 | 0,00 | 11 | 57,14 | ||||
| 2026-02-04 | 13F | First Eagle Investment Management, LLC | 32.114.660 | -16,93 | 1.398.593 | 10,39 | ||||
| 2026-04-20 | 13F | Ritholtz Wealth Management | 61.092 | 62,06 | 2.492 | 51,80 | ||||
| 2026-01-15 | 13F | PFG Private Wealth Management, LLC | 9.386 | 409 | ||||||
| 2026-04-15 | 13F | DAVENPORT & Co LLC | 96.144 | -5,00 | 3.917 | -11,12 | ||||
| 2026-02-13 | 13F | Manufacturers Life Insurance Company, The | 0 | -100,00 | 0 | |||||
| 2026-02-17 | 13F | Graham Capital Management, L.P. | 20.934 | 912 | ||||||
| 2026-04-15 | 13F | Capital Advisory Group Advisory Services, LLC | 0 | -100,00 | 0 | |||||
| 2026-02-12 | 13F | Sprott Inc. | 2.389.369 | 282,91 | 104.116 | 408,27 | ||||
| 2026-02-17 | 13F | Advisory Services Network, LLC | 56.954 | 145,87 | 2.480 | 226,75 | ||||
| 2026-04-15 | 13F | City Holding Co | 15 | 0,00 | 1 | |||||
| 2026-02-11 | 13F | Symphony Financial, Ltd. Co. | 9.632 | -21,41 | 426 | 5,71 | ||||
| 2026-04-15 | 13F | Addenda Capital Inc. | 23.590 | 1.341 | ||||||
| 2026-02-13 | 13F | Golden State Wealth Management, LLC | 1.442 | 226,24 | 63 | 342,86 | ||||
| 2026-04-10 | 13F | Abound Wealth Management | 603 | 70,82 | 25 | 60,00 | ||||
| 2026-01-30 | 13F | Wealthfront Advisers Llc | 11.990 | 57,12 | 522 | 108,80 | ||||
| 2026-02-10 | 13F | Acadian Asset Management Llc | 814.554 | -42,66 | 36 | -23,91 | ||||
| 2026-02-17 | 13F | Adage Capital Partners Gp, L.l.c. | 680.000 | -45,60 | 29.614 | -27,70 | ||||
| 2026-01-23 | 13F | Eagle Bay Advisors LLC | 4.700 | 205 | ||||||
| 2026-02-11 | 13F | Townsquare Capital Llc | 7.044 | 307 | ||||||
| 2026-02-17 | 13F | Regal Investment Advisors LLC | 108.932 | -16,35 | 4.744 | 11,16 | ||||
| 2026-02-13 | 13F | Mariner, LLC | 251.688 | 10,41 | 10.964 | 46,77 | ||||
| 2026-02-17 | 13F | Wellington Management Group Llp | 0 | -100,00 | 0 | |||||
| 2025-11-14 | 13F/A | Westpac Banking Corp | 0 | -100,00 | 0 | -100,00 | ||||
| 2026-04-16 | 13F | Balboa Wealth Partners | 29.501 | 15,48 | 1.203 | 8,18 | ||||
| 2025-10-22 | 13F | Gries Financial Llc | 7.000 | 229 | ||||||
| 2026-02-05 | 13F | Baader Bank INC | 36.264 | 180,90 | 1.561 | 730,32 | ||||
| 2026-02-05 | 13F | Qsemble Capital Management, LP | 80.115 | -36,56 | 3.489 | -15,68 | ||||
| 2026-02-13 | 13F | Recurrent Investment Advisors LLC | 229.715 | -0,02 | 11.733 | 31,73 | ||||
| 2026-01-30 | 13F | Catalytic Wealth RIA, LLC | 18.101 | 19,20 | 788 | 58,55 | ||||
| 2026-02-17 | 13F | Murchinson Ltd. | Put | 43.200 | 1.881 | |||||
| 2025-11-14 | 13F | Point72 (DIFC) Ltd | Call | 0 | -100,00 | 0 | -100,00 | |||
| 2026-04-02 | 13F | Hilltop National Bank | 17.498 | 1,36 | 714 | -5,06 | ||||
| 2026-02-05 | 13F | Thrivent Financial For Lutherans | 28.695 | 1 | ||||||
| 2026-02-03 | 13F | Insight 2811, Inc. | 33.677 | 0,26 | 1.467 | 33,27 | ||||
| 2026-02-17 | 13F | Murchinson Ltd. | Call | 43.200 | 1.881 | |||||
| 2026-01-21 | 13F | Prime Capital Investment Advisors, LLC | 6.228 | -1,28 | 271 | 31,55 | ||||
| 2026-02-17 | 13F | SIG North Trading, ULC | Put | 487.300 | 100,95 | 21.222 | 167,07 | |||
| 2026-02-17 | 13F | SIG North Trading, ULC | Call | 930.500 | 0,82 | 40.523 | 33,99 | |||
| 2025-10-31 | 13F | Whittier Trust Co | 0 | -100,00 | 0 | -100,00 | ||||
| 2025-11-14 | 13F | Bnp Paribas | 0 | -100,00 | 0 | -100,00 | ||||
| 2026-04-14 | 13F | Perpetual Ltd | 1.883.444 | -20,79 | 76.826 | -25,81 | ||||
| 2026-02-02 | 13F | Ativo Capital Management LLC | 55.979 | -21,07 | 2.438 | 4,86 | ||||
| 2026-02-17 | 13F | Wiley Bros.-aintree Capital, Llc | 57.821 | 33,29 | 2.519 | 77,32 | ||||
| 2026-01-27 | 13F | First Horizon Corp | 5.871 | 83,76 | 256 | 145,19 | ||||
| 2026-01-30 | 13F | Sage Rhino Capital Llc | 26.024 | -27,05 | 1.133 | -3,08 | ||||
| 2026-02-17 | 13F | SIG North Trading, ULC | 308.795 | 41,84 | 13.448 | 88,51 | ||||
| 2026-02-11 | 13F | United Financial Planning Group LLC | 18.324 | -29,21 | 798 | -5,90 | ||||
| 2026-04-15 | 13F | Valley National Advisers Inc | 6.086 | 0,00 | 0 | |||||
| 2026-04-21 | 13F | Wedbush Securities Inc | 14.177 | -3,50 | 1 | |||||
| 2026-02-13 | 13F | Parkside Financial Bank & Trust | 112 | 0,00 | 5 | 33,33 | ||||
| 2026-02-02 | 13F | Horizon Investments, LLC | 3.665 | 160 | ||||||
| 2026-02-06 | 13F | Harvest Portfolios Group Inc. | 43.977 | -4,25 | 1.916 | 26,99 | ||||
| 2026-02-12 | 13F | Qtron Investments LLC | 0 | -100,00 | 0 | |||||
| 2026-02-10 | 13F | Jupiter Asset Management Ltd | 438.698 | -16,39 | 19.105 | 11,11 | ||||
| 2026-02-12 | 13F | Fortress Private Ledger, Llc | 25.773 | 20,93 | 1.122 | 60,74 |