Grundlæggende statistik
| Institutionelle aktier (lange) | 532.194.706 - 80,44% (ex 13D/G) - change of -73,74MM shares -12,17% MRQ |
| Institutionel værdi (lang) | $ 42.383.035 USD ($1000) |
Institutionelt ejerskab og aktionærer
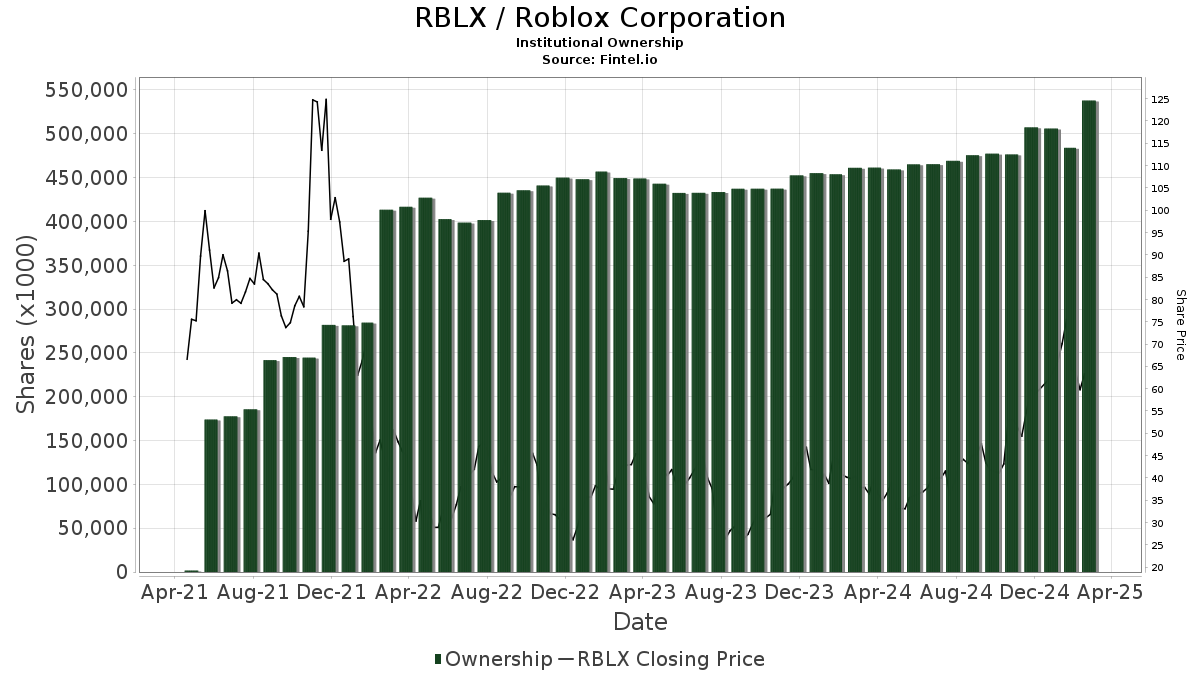
Roblox Corporation (US:RBLX) har 956 institutionelle ejere og aktionærer, der har indsendt 13D/G- eller 13F-formularer til Securities Exchange Commission (SEC). Disse institutioner har i alt 532,194,706 aktier. Største aktionærer omfatter Vanguard Group Inc, Fmr Llc, BlackRock, Inc., Capital International Investors, Baillie Gifford & Co, Morgan Stanley, Jpmorgan Chase & Co, Ieq Capital, Llc, State Street Corp, and Geode Capital Management, Llc .
Roblox Corporation (NYSE:RBLX) institutionel ejerskabsstruktur viser aktuelle positioner i virksomheden efter institutioner og fonde, samt seneste ændringer i positionsstørrelse. Større aktionærer kan omfatte individuelle investorer, investeringsforeninger, hedgefonde eller institutioner. Skema 13D angiver, at investoren besidder (eller besidder) mere end 5 % af virksomheden og har til hensigt (eller har til hensigt at) aktivt at forfølge en ændring i forretningsstrategi. Skema 13G indikerer en passiv investering på over 5%.
The share price as of March 27, 2026 is 52,31 / share. Previously, on March 31, 2025, the share price was 58,29 / share. This represents a decline of 10,26% over that period.
Fondens stemningsscore
Fund Sentiment Score (fka Ownership Accumulation Score) finder de aktier, der bliver mest købt af fonde. Det er resultatet af en sofistikeret, multi-faktor kvantitativ model, der identificerer virksomheder med de højeste niveauer af institutionel akkumulering. Scoringsmodellen bruger en kombination af den samlede stigning i oplyste ejere, ændringerne i porteføljeallokeringer i disse ejere og andre målinger. Tallet går fra 0 til 100, hvor højere tal indikerer et højere niveau af akkumulering for sine jævnaldrende, og 50 er gennemsnittet.
Opdateringsfrekvens: Dagligt
Se Ownership Explorer, som giver en liste over højest rangerende virksomheder.
AI+ Ask Fintel’s AI assistant about Roblox Corporation.
Select a question to share a public post with an AI-crafted answer.
Thinking of good questions…
Institutionel Put/Call-forhold
Ud over at indberette standardaktie- og gældsudstedelser skal institutter med mere end 100 mill. aktiver under forvaltning også oplyse deres put- og call-optionsbeholdninger. Da salgsoptioner generelt indikerer negativ stemning, og købsoptioner indikerer positiv stemning, kan vi få en fornemmelse af den overordnede institutionelle stemning ved at plotte forholdet mellem put og kald. Diagrammet til højre viser det historiske put/call-forhold for dette instrument.
Brug af Put/Call Ratio som en indikator for investorernes stemning overvinder en af de vigtigste mangler ved at bruge totalt institutionelt ejerskab, som er, at en betydelig mængde af aktiver under forvaltning investeres passivt for at spore indekser. Passivt forvaltede fonde køber typisk ikke optioner, så indikatoren for put/call-forholdet følger mere nøje følelsen af aktivt forvaltede fonde.

13D/G-arkivering
Vi præsenterer 13D/G ansøgninger separat fra 13F ansøgninger på grund af den forskellige behandling af SEC. 13D/G-ansøgninger kan indgives af grupper af investorer (med én ledende), hvorimod 13F-ansøgninger ikke kan. Dette resulterer i situationer, hvor en investor kan indsende en 13D/G, der rapporterer én værdi for de samlede aktier (der repræsenterer alle de aktier, der ejes af investorgruppen), men derefter indsender en 13F, der rapporterer en anden værdi for de samlede aktier (der udelukkende repræsenterer deres egne) ejendomsret). Det betyder, at aktieejerskab af 13D/G-arkiver og 13F-arkiveringer ofte ikke er direkte sammenlignelige, så vi præsenterer dem separat.
Bemærk: Fra den 16. maj 2021 viser vi ikke længere ejere, der ikke har indsendt en 13D/G inden for det seneste år. Tidligere viste vi den fulde historie af 13D/G-arkiver. Generelt skal enheder, der er forpligtet til at indgive 13D/G-ansøgninger, indgive mindst årligt, før de indsender en afsluttende ansøgning. Dog forlader fonde nogle gange positioner uden at indsende en afsluttende ansøgning (dvs. de afvikler), så visning af den fulde historie resulterede nogle gange i forvirring om det nuværende ejerskab. For at undgå forvirring viser vi nu kun 'aktuelle' ejere - det vil sige - ejere, der har anmeldt inden for det seneste år.
Upgrade to unlock premium data.
| Fil dato | Form | Investor | Forrige Aktier |
Seneste Aktier |
Δ Aktier (Procent) |
Ejendomsret (Procent) |
Δ Ejerskab (Procent) |
|
|---|---|---|---|---|---|---|---|---|
| 2025-10-17 | BlackRock, Inc. | 35,494,495 | 5.50 | |||||
| 2025-08-12 | Baszucki David | 58,004,180 | 48,349,998 | -16.64 | 7.00 | -20.45 | ||
| 2025-08-06 | FMR LLC | 39,628,126 | 49,459,521 | 24.81 | 7.90 | 21.54 | ||
| 2025-04-30 | VANGUARD GROUP INC | 46,264,278 | 57,640,317 | 24.59 | 9.31 | 15.51 |
13F og NPORT arkivering
Detaljer om 13F-arkivering er gratis. Detaljer om NP-ansøgninger kræver et premium-medlemskab. Grønne rækker angiver nye positioner. Røde rækker angiver lukkede positioner. Klik på linket ikon for at se den fulde transaktionshistorik.
Opgrader
for at låse premium-data op og eksportere til Excel ![]() .
.
Important Note
In an effort to reduce load times for our mobile users, we are testing some ways to deliver lighter pages.
In this first test, we will deliver only the most recent 750 transactions (out of 1380 for this stock). If you are interested in loading *all* the transactions for this company, click the "load all" button below. This is just a test and if you don't like it, please let us know by submitting some gentle feedback via the link at the bottom of this page.
Load All| Fil dato | Kilde | Investor | Type | Gennemsnitlig pris (Øst) |
Aktier | Δ Aktier (%) |
Rapporteret Værdi ($1000) |
Δ Værdi (%) |
Port Alloc (%) |
|
|---|---|---|---|---|---|---|---|---|---|---|
| 2026-02-13 | 13F | Acumen Wealth Advisors, LLC | 5 | 0 | ||||||
| 2026-02-10 | 13F | Impact Partnership Wealth, LLC | 4.438 | 58,61 | 360 | -7,24 | ||||
| 2026-02-03 | 13F | We Are One Seven, LLC | 4.778 | 1,81 | 387 | -40,46 | ||||
| 2026-02-10 | 13F | Bnp Paribas Arbitrage, Sa | 3.377.673 | 99,48 | 273.693 | 16,69 | ||||
| 2026-02-06 | 13F | HighTower Advisors, LLC | 18.682 | -7,08 | 1.514 | -45,67 | ||||
| 2026-02-13 | 13F | Ontario Teachers Pension Plan Board | 0 | -100,00 | 0 | |||||
| 2026-02-13 | 13F | Panagora Asset Management Inc | 455.967 | -8,42 | 36.947 | -46,42 | ||||
| 2026-02-03 | 13F | RFG Advisory, LLC | 0 | -100,00 | 0 | |||||
| 2026-02-11 | 13F | Capital International Investors | 31.953.301 | 7,34 | 2.589.282 | -37,22 | ||||
| 2025-10-28 | 13F | CarsonAllaria Wealth Management, Ltd. | 0 | -100,00 | 0 | |||||
| 2026-02-13 | 13F | Resources Management Corp /ct/ /adv | 100 | 0,00 | 0 | |||||
| 2026-02-17 | 13F | Alphadyne Asset Management, LLC | 14.179 | 1.149 | ||||||
| 2026-02-03 | 13F | Encompass More Asset Management | 0 | -100,00 | 0 | -100,00 | ||||
| 2026-02-17 | 13F | Alphadyne Asset Management, LLC | Call | 29.900 | 99,33 | 2.423 | 16,61 | |||
| 2026-02-17 | 13F | Alphadyne Asset Management, LLC | Put | 22.700 | -21,72 | 1.839 | -54,22 | |||
| 2026-02-26 | 13F | Anchor Investment Management, LLC | 44 | 0,00 | 4 | -50,00 | ||||
| 2026-01-07 | 13F | Hilltop National Bank | 459 | -22,34 | 37 | -54,32 | ||||
| 2026-02-13 | 13F | SRS Capital Advisors, Inc. | 825 | -99,73 | 67 | -99,84 | ||||
| 2026-02-13 | 13F | Charles Schwab Investment Management Inc | 2.268.270 | 3,48 | 183.798 | -39,47 | ||||
| 2026-02-12 | 13F | Gould Capital, LLC | 0 | -100,00 | 0 | -100,00 | ||||
| 2026-02-17 | 13F | Public Employees Retirement System Of Ohio | 186.690 | -13,26 | 15.127 | -49,26 | ||||
| 2026-03-16 | 13F | Osbon Capital Management Llc | 173 | 14 | ||||||
| 2026-02-10 | 13F | Westpac Banking Corp | 26.689 | 33,16 | 2.163 | -22,12 | ||||
| 2025-11-07 | 13F | HighTower Advisors, LLC | Put | 0 | -100,00 | 0 | -100,00 | |||
| 2026-02-11 | 13F | Meeder Asset Management Inc | 462 | 26,23 | 37 | -26,00 | ||||
| 2026-02-17 | 13F | Meritech Capital Associates V L.L.C. | 1.077.627 | 0,00 | 87.320 | -41,50 | ||||
| 2026-02-04 | 13F | Family Legacy, Inc. | 6.339 | 0,64 | 514 | -41,17 | ||||
| 2026-01-22 | 13F | V-Square Quantitative Management LLC | 1.056 | 86 | ||||||
| 2026-01-26 | 13F | Cwm, Llc | 234.152 | -15,84 | 19 | -52,63 | ||||
| 2026-01-21 | 13F | Yousif Capital Management, Llc | 8.069 | 3,20 | 636 | -41,27 | ||||
| 2026-02-09 | 13F | Arista Wealth Management, LLC | 4.000 | 324 | ||||||
| 2026-02-17 | 13F | Voloridge Investment Management, Llc | 1.434.470 | 53,30 | 116.235 | -10,32 | ||||
| 2026-01-14 | 13F | LVW Advisors, LLC | 3.269 | -11,93 | 265 | -48,64 | ||||
| 2026-01-20 | 13F | Ascent Group, LLC | 3.865 | -2,55 | 313 | -42,99 | ||||
| 2025-10-21 | 13F | Generali Asset Management SPA SGR | 0 | -100,00 | 0 | -100,00 | ||||
| 2026-02-11 | 13F | ARK Investment Management LLC | 4.834.337 | -9,01 | 391.726 | -46,77 | ||||
| 2026-02-13 | 13F | Fieldview Capital Management, LLC | 0 | -100,00 | 0 | |||||
| 2026-02-12 | 13F | Steward Partners Investment Advisory, Llc | 34.692 | 30,74 | 2.811 | -23,51 | ||||
| 2026-02-17 | 13F | SageView Advisory Group, LLC | 270 | 22 | ||||||
| 2026-02-12 | 13F | Great Valley Advisor Group, Inc. | 10.765 | 0,47 | 872 | -41,24 | ||||
| 2026-02-11 | 13F | Resolute Advisors LLC | 150.615 | 0,00 | 12.204 | -41,50 | ||||
| 2026-01-30 | 13F | American Capital Advisory, LLC | 10 | 11,11 | 1 | -100,00 | ||||
| 2026-02-13 | 13F | SYM FINANCIAL Corp | 7.627 | 1,23 | 618 | -40,75 | ||||
| 2026-01-23 | 13F | Howard Capital Management Inc. | 3.627 | 0,44 | 294 | -41,40 | ||||
| 2026-02-13 | 13F | Peak6 Llc | Put | 222.000 | -28,48 | 17.989 | -58,16 | |||
| 2026-02-04 | 13F | Schubert & Co | 0 | -100,00 | 0 | -100,00 | ||||
| 2026-02-11 | 13F | Waddell & Associates, Llc | 5.952 | -29,22 | 482 | -58,59 | ||||
| 2026-02-02 | 13F | GenTrust, LLC | 3.015 | 40,04 | 244 | -18,12 | ||||
| 2026-02-13 | 13F | Peak6 Llc | Call | 57.200 | -66,99 | 4.635 | -80,70 | |||
| 2026-02-17 | 13F | Raymond James Financial Inc | 1.625.293 | -11,63 | 132.698 | -47,91 | ||||
| 2026-02-17 | 13F | Farringdon Capital, Ltd. | 3.286 | 266 | ||||||
| 2026-02-19 | 13F | Atomi Financial Group, Inc. | 53.350 | -1,36 | 4.323 | -42,30 | ||||
| 2026-02-12 | 13F | Campbell & CO Investment Adviser LLC | 46.851 | 1.991,56 | 3.796 | 1.124,52 | ||||
| 2026-02-17 | 13F | Gladstone Institutional Advisory LLC | 0 | -100,00 | 0 | -100,00 | ||||
| 2026-02-06 | 13F | Fi3 FINANCIAL ADVISORS, LLC | 5.582 | 7,41 | 452 | -37,13 | ||||
| 2026-02-10 | 13F | Sivia Capital Partners, LLC | 16.493 | 6,40 | 1.336 | -37,77 | ||||
| 2026-02-06 | 13F | IFP Advisors, Inc | 21.225 | 492,38 | 1.720 | 246,57 | ||||
| 2026-02-13 | 13F | Blueshift Asset Management, LLC | 36.700 | 115,88 | 2.974 | 26,30 | ||||
| 2026-01-14 | 13F | Waldron Private Wealth LLC | 0 | -100,00 | 0 | -100,00 | ||||
| 2026-02-12 | 13F | CIBC Private Wealth Group, LLC | 90.089 | -34,41 | 7.300 | -61,63 | ||||
| 2026-02-12 | 13F | Federation des caisses Desjardins du Quebec | 48.513 | 79,24 | 3.929 | 4,77 | ||||
| 2025-10-30 | 13F | Ridgewood Investments LLC | 0 | -100,00 | 0 | |||||
| 2026-02-13 | 13F | Maven Securities LTD | Put | 0 | -100,00 | 0 | -100,00 | |||
| 2026-02-13 | 13F | Aptus Capital Advisors, LLC | 3.562 | 6,39 | 289 | -37,80 | ||||
| 2026-01-30 | 13F | North Star Investment Management Corp. | 6 | 0 | ||||||
| 2026-02-11 | 13F | Krane Funds Advisors LLC | 15.516 | 42,39 | 1.257 | -13,13 | ||||
| 2025-10-30 | 13F | Ridgewood Investments LLC | Call | 0 | -100,00 | 0 | ||||
| 2026-01-23 | 13F | Optima Capital Llc | 23 | 2 | ||||||
| 2025-11-04 | 13F | ASB Consultores, LLC | 0 | -100,00 | 0 | |||||
| 2026-02-17 | 13F | Hancock Whitney Corp | 0 | -100,00 | 0 | -100,00 | ||||
| 2026-02-13 | 13F | Wells Fargo & Company/mn | Call | 75.000 | -11,87 | 6.077 | -48,45 | |||
| 2026-02-17 | 13F | RMB Capital Management, LLC | 10.408 | 843 | ||||||
| 2026-02-13 | 13F | Wells Fargo & Company/mn | 647.431 | 4,98 | 52.461 | -38,59 | ||||
| 2026-02-17 | 13F | Grantham, Mayo, Van Otterloo & Co. LLC | 0 | -100,00 | 0 | |||||
| 2026-02-13 | 13F | Wells Fargo & Company/mn | Put | 160.000 | -20,00 | 12.965 | -53,21 | |||
| 2026-02-05 | 13F | Stephens Inc /ar/ | 2.491 | -53,85 | 202 | -73,09 | ||||
| 2026-01-26 | 13F | Independent Wealth Network Inc. | 0 | -100,00 | 0 | |||||
| 2026-01-22 | 13F | Richardson Financial Services Inc. | 3 | 12 | ||||||
| 2026-02-06 | 13F | Larson Financial Group LLC | 1.783 | -4,14 | 144 | -43,97 | ||||
| 2026-02-13 | 13F | Alchemi Wealth, LLC | 2.500 | 203 | ||||||
| 2026-02-24 | 13F | MidFirst Bank | 3.080 | 250 | ||||||
| 2026-02-12 | 13F | Long Corridor Asset Management Ltd | 167.600 | 73,14 | 13.581 | 1,28 | ||||
| 2025-11-06 | 13F | Compagnie Lombard Odier SCmA | 0 | -100,00 | 0 | -100,00 | ||||
| 2026-01-14 | 13F | BFI Infinity Ltd. | Put | 0 | -100,00 | 0 | -100,00 | |||
| 2026-02-13 | 13F | Korea Investment CORP | 394.464 | -25,84 | 31.963 | -56,62 | ||||
| 2026-01-08 | 13F | Sanders Morris Harris Llc | 0 | -100,00 | 0 | |||||
| 2026-02-17 | 13F | CHICAGO TRUST Co NA | 0 | -100,00 | 0 | |||||
| 2026-02-04 | 13F | Atlantic Union Bankshares Corp | 83 | 43,10 | 7 | -25,00 | ||||
| 2026-02-13 | 13F | American Century Companies Inc | 1.324.403 | 0,19 | 107.316 | -41,39 | ||||
| 2026-02-12 | 13F | Bank Of Montreal /can/ | 132.303 | 48,67 | 10.721 | -13,04 | ||||
| 2026-02-12 | 13F | JPL Wealth Management, LLC | 0 | -100,00 | 0 | |||||
| 2026-02-13 | 13F | Marathon Trading Investment Management LLC | 6.000 | 486 | ||||||
| 2026-02-13 | 13F | Marathon Trading Investment Management LLC | Call | 200 | 16 | |||||
| 2026-01-23 | 13F | Vested Financial Planning, LLC | 4.458 | 28,25 | 361 | -24,95 | ||||
| 2026-01-29 | 13F | Concurrent Investment Advisors, LLC | Put | 100 | 0,00 | 8 | -38,46 | |||
| 2026-02-09 | 13F | Hantz Financial Services, Inc. | 23 | 475,00 | 0 | |||||
| 2026-02-13 | 13F | Gts Securities Llc | 0 | -100,00 | 0 | |||||
| 2026-01-29 | 13F | Concurrent Investment Advisors, LLC | 10.643 | -65,11 | 862 | -79,60 | ||||
| 2026-02-17 | 13F | Polar Capital Holdings Plc | 100.706 | -90,39 | 8.160 | -94,38 | ||||
| 2026-02-11 | 13F | Vestcor Inc | 23.481 | 35,29 | 2 | -50,00 | ||||
| 2026-02-18 | 13F | SkyView Investment Advisors, LLC | 0 | -100,00 | 0 | |||||
| 2026-02-03 | 13F | Redwood Wealth Management Group, LLC | 0 | -100,00 | 0 | |||||
| 2026-02-12 | 13F | Nuveen, LLC | 4.965.816 | 20,36 | 402.380 | -29,59 | ||||
| 2026-02-13 | 13F | Intrepid Financial Planning Group LLC | 4.315 | -16,31 | 350 | -51,12 | ||||
| 2025-11-12 | 13F | HAP Trading, LLC | Put | 14.300 | 58 | |||||
| 2025-11-12 | 13F | HAP Trading, LLC | Call | 24.500 | 773 | |||||
| 2026-02-02 | 13F | Montag A & Associates Inc | 1.263 | -91,01 | 102 | -94,76 | ||||
| 2026-02-11 | 13F | Capital Wealth Planning, LLC | 0 | -100,00 | 0 | |||||
| 2026-02-09 | 13F | Hartland & Co., LLC | 7.146 | -22,87 | 579 | -54,87 | ||||
| 2026-02-17 | 13F | Totem Point Management, LLC | 0 | -100,00 | 0 | |||||
| 2026-01-07 | 13F | Lake Street Financial Llc | 0 | -100,00 | 0 | |||||
| 2026-02-17 | 13F | Fmr Llc | 46.432.530 | -0,20 | 3.762.428 | -41,62 | ||||
| 2026-03-06 | 13F | Hsbc Holdings Plc | 625.234 | 127,73 | 50.786 | 33,94 | ||||
| 2026-02-17 | 13F | SRS Investment Management, LLC | 2.937.990 | 238.065 | ||||||
| 2026-01-23 | 13F | Transcend Wealth Collective, Llc | 5.540 | -30,29 | 449 | -59,27 | ||||
| 2026-01-23 | 13F | Burney Co/ | 20.408 | 0,04 | 1.654 | -41,49 | ||||
| 2026-02-06 | 13F | Pinkerton Retirement Specialists, LLC | 0 | -100,00 | 0 | -100,00 | ||||
| 2026-02-17 | 13F | Summit Trail Advisors, Llc | 12.463 | -6,97 | 1.010 | -45,61 | ||||
| 2026-02-13 | 13F | Vontobel Holding Ltd. | 58.803 | 325,89 | 4.765 | 149,16 | ||||
| 2026-01-29 | 13F | Pictet Asset Management Holding SA | 228.665 | 4,43 | 18.529 | -38,91 | ||||
| 2026-02-11 | 13F | Clearbridge Investments, LLC | 1.107.307 | 144,70 | 89.725 | 43,14 | ||||
| 2026-02-09 | 13F | Connors Investor Services Inc | 68.000 | -9,33 | 5.510 | -46,96 | ||||
| 2026-02-13 | 13F | Vontobel Holding Ltd. | Call | 53.500 | 4.335 | |||||
| 2026-02-12 | 13F | Principal Securities, Inc. | 10.657 | 229,33 | 864 | 92,63 | ||||
| 2026-02-17 | 13F | Citadel Advisors Llc | 1.760.351 | 111,33 | 142.641 | 23,62 | ||||
| 2026-02-12 | 13F | Dimensional Fund Advisors Lp | 705.577 | -0,51 | 57.177 | -41,80 | ||||
| 2026-02-17 | 13F | Citadel Advisors Llc | Call | 4.452.000 | 29,52 | 360.746 | -24,23 | |||
| 2026-02-17 | 13F | Citadel Advisors Llc | Put | 1.989.800 | -30,73 | 161.233 | -59,48 | |||
| 2026-01-26 | 13F | Whittier Trust Co | 62.593 | 0,00 | 4.746 | -38,20 | ||||
| 2026-02-04 | 13F | Ameritas Advisory Services, LLC | 0 | -100,00 | 0 | |||||
| 2026-02-13 | 13F | Treasurer of the State of North Carolina | 259.883 | -5,39 | 21 | -44,74 | ||||
| 2026-02-17 | 13F | Foxhaven Asset Management, LP | 2.542.163 | 3,21 | 205.991 | -39,62 | ||||
| 2026-02-02 | 13F | Strs Ohio | 256.657 | 7,65 | 20.797 | -37,03 | ||||
| 2026-02-13 | 13F | OpenArc Corporate Advisory, LLC | 3.137 | 254 | ||||||
| 2026-02-17 | 13F | Artisan Partners Limited Partnership | 2.292.340 | 18,95 | 185.748 | -30,42 | ||||
| 2026-02-17 | 13F | Aquatic Capital Management LLC | 261.581 | 36,21 | 21.196 | -20,33 | ||||
| 2026-02-11 | 13F | OneAscent Financial Services LLC | 3.626 | 294 | ||||||
| 2026-02-12 | 13F | Brinker Capital Investments, LLC | 40.443 | 5,59 | 3.277 | -38,23 | ||||
| 2026-02-13 | 13F | Lord, Abbett & Co. Llc | 84.911 | -89,59 | 7 | -94,69 | ||||
| 2026-02-13 | 13F | State Street Corp | 13.812.362 | 3,31 | 1.119.216 | -39,57 | ||||
| 2026-02-17 | 13F | United Capital Financial Advisers, Llc | 5.454 | 7,09 | 442 | -37,45 | ||||
| 2026-03-02 | 13F | Reflection Asset Management | 740 | 60 | ||||||
| 2026-02-11 | 13F | Simplex Trading, Llc | Put | 325.900 | -50,46 | 26.408 | 28.918,68 | |||
| 2026-02-17 | 13F | Nishkama Capital, LLC | 0 | -100,00 | 0 | |||||
| 2026-02-17 | 13F | GeoWealth Management, LLC | 0 | -100,00 | 0 | |||||
| 2026-01-15 | 13F | Xena Financial Planning, LLC | 2.927 | 237 | ||||||
| 2026-02-13 | 13F | Barrier Capital Management, LLC | 43.900 | 22,57 | 3.557 | -28,30 | ||||
| 2026-02-11 | 13F | Simplex Trading, Llc | 19.633 | -39,37 | 1.591 | 39.650,00 | ||||
| 2026-02-13 | 13F | Manufacturers Life Insurance Company, The | 0 | -100,00 | 0 | -100,00 | ||||
| 2026-02-17 | 13F | Nishkama Capital, LLC | Put | 0 | -100,00 | 0 | ||||
| 2026-02-17 | 13F | Alta Park Capital, LP | 0 | -100,00 | 0 | |||||
| 2026-02-17 | 13F | Susquehanna Advisors Group, Inc. | Call | 0 | -100,00 | 0 | ||||
| 2026-02-11 | 13F | Simplex Trading, Llc | Call | 553.500 | -19,17 | 44.850 | 47.612,77 | |||
| 2026-01-27 | 13F | Friedenthal Financial | 0 | -100,00 | 0 | |||||
| 2026-02-17 | 13F | Alliancebernstein L.p. | 329.058 | -0,75 | 26.664 | -41,94 | ||||
| 2026-01-12 | 13F | Salem Investment Counselors Inc | 0 | -100,00 | 0 | |||||
| 2026-02-17 | 13F | Quantinno Capital Management LP | 700.145 | -2,42 | 56.733 | -42,92 | ||||
| 2026-01-08 | 13F | Nordea Investment Management Ab | 58.461 | 7,35 | 4.730 | -36,75 | ||||
| 2026-01-15 | 13F | Fortitude Family Office, LLC | 127 | -3,05 | 10 | -44,44 | ||||
| 2026-01-27 | 13F | Ninety One SA (PTY) Ltd | 0 | -100,00 | 0 | -100,00 | ||||
| 2026-02-13 | 13F | Van Eck Associates Corp | 557.660 | 11,03 | 45 | -34,78 | ||||
| 2026-01-27 | 13F | Ninety One UK Ltd | 0 | -100,00 | 0 | -100,00 | ||||
| 2026-02-05 | 13F | HFM Investment Advisors, LLC | 39 | 875,00 | 3 | |||||
| 2026-02-12 | 13F | DRW Securities, LLC | 6.168 | 500 | ||||||
| 2026-02-12 | 13F | Sand Hill Global Advisors, LLC | 0 | -100,00 | 0 | -100,00 | ||||
| 2026-02-12 | 13F | Parsonex Advisory Services, Inc. | 0 | -100,00 | 0 | -100,00 | ||||
| 2026-02-12 | 13F | ROSS\JOHNSON & Associates LLC | 7 | 133,33 | 1 | |||||
| 2026-02-27 | 13F | Compass Financial Services Inc | 55 | 0,00 | 4 | -42,86 | ||||
| 2026-01-16 | 13F | Empirical Financial Services, LLC d.b.a. Empirical Wealth Management | 0 | -100,00 | 0 | |||||
| 2026-01-28 | 13F | HB Wealth Management, LLC | 12.140 | -5,04 | 984 | -44,49 | ||||
| 2026-01-29 | 13F | Quent Capital, LLC | 673 | -13,61 | 55 | -49,53 | ||||
| 2026-02-17 | 13F | Soros Capital Management Llc | 3.758 | 305 | ||||||
| 2026-02-13 | 13F | Commerce Bank | 36.569 | -11,36 | 2.963 | -48,14 | ||||
| 2026-01-26 | 13F | Private Trust Co Na | 56 | 133,33 | 5 | 33,33 | ||||
| 2026-02-18 | 13F | Vident Advisory, LLC | 34.924 | 31,97 | 2.830 | -22,81 | ||||
| 2026-02-14 | 13F | Rockefeller Capital Management L.P. | 26.629 | -26,89 | 2.158 | -57,24 | ||||
| 2026-02-17 | 13F | Claro Advisors LLC | 0 | -100,00 | 0 | |||||
| 2026-02-17 | 13F | Cantor Fitzgerald, L. P. | Put | 200.000 | 33,33 | 16.206 | -22,00 | |||
| 2026-02-17 | 13F | Cantor Fitzgerald, L. P. | 216.249 | -11,62 | 17.523 | -48,30 | ||||
| 2026-02-11 | 13F | Commonwealth Retirement Investments LLC | 634 | 51 | ||||||
| 2026-02-17 | 13F | Cambria Investment Management, L.P. | 3.744 | 24,06 | 303 | -27,51 | ||||
| 2026-01-26 | 13F | KBC Group NV | 458.154 | -39,01 | 37 | -64,42 | ||||
| 2026-01-30 | 13F | Wealth High Governance Capital Ltda | 0 | -100,00 | 0 | -100,00 | ||||
| 2026-02-17 | 13F | Two Sigma Investments, Lp | Call | 0 | -100,00 | 0 | -100,00 | |||
| 2026-02-13 | 13F | Greenline Wealth Management LLC | 255 | 21 | ||||||
| 2026-02-05 | 13F | AustralianSuper Pty Ltd | 19.398 | 0,00 | 1.572 | -41,53 | ||||
| 2026-01-14 | 13F | Eastern Bank | 4 | 0 | ||||||
| 2026-02-17 | 13F | SummitTX Capital, L.P. | 19.138 | 163,07 | 1.551 | 53,92 | ||||
| 2026-02-17 | 13F | Wellington Management Group Llp | 1.764.421 | 12,53 | 142.971 | -34,17 | ||||
| 2026-02-17 | 13F | Altshuler Shaham Ltd | 27 | 8,00 | 2 | -33,33 | ||||
| 2026-02-17 | 13F | Bank Of America Corp /de/ | Call | 0 | -100,00 | 0 | -100,00 | |||
| 2026-02-11 | 13F | J.w. Cole Advisors, Inc. | 3.155 | 7,35 | 251 | -38,57 | ||||
| 2026-02-13 | 13F | Bridgefront Capital, LLC | 7.877 | 638 | ||||||
| 2026-02-14 | 13F | Militia Capital Partners, LP | 18.500 | 1.499 | ||||||
| 2026-02-17 | 13F | Fred Alger Management, Llc | 299.114 | -87,55 | 24.237 | -92,72 | ||||
| 2026-02-03 | 13F | International Assets Investment Management, Llc | 2.024 | 164 | ||||||
| 2026-01-21 | 13F | Capital Advisors, Ltd. LLC | 16 | 0,00 | 0 | |||||
| 2026-02-10 | 13F | ShoreHaven Wealth Partners, LLC | 6.695 | 0,00 | 542 | -41,53 | ||||
| 2026-01-27 | 13F | Symmetry Partners, LLC | 3.091 | -1,78 | 250 | -42,53 | ||||
| 2026-02-11 | 13F | West Family Investments, Inc. | 2.558 | -10,90 | 207 | -47,86 | ||||
| 2026-02-10 | 13F | Nomura Asset Management Co Ltd | 183.430 | 7,62 | 14.863 | -37,05 | ||||
| 2026-02-23 | 13F | Wealth Preservation Advisors, LLC | 25 | 0,00 | 2 | -33,33 | ||||
| 2026-02-13 | 13F | Arkadios Wealth Advisors | 7.115 | 306,57 | 577 | 138,02 | ||||
| 2026-02-02 | 13F | Benjamin Edwards Inc | 19.699 | -10,25 | 1.596 | -47,50 | ||||
| 2026-02-12 | 13F | Jane Street Group, Llc | Call | 2.887.300 | -3,53 | 233.958 | -43,57 | |||
| 2026-02-12 | 13F | Jane Street Group, Llc | Put | 1.085.100 | -36,74 | 87.926 | -62,99 | |||
| 2025-10-20 | 13F | Moody Lynn & Lieberson, Llc | 0 | -100,00 | 0 | -100,00 | ||||
| 2026-01-29 | 13F | Concurrent Investment Advisors, LLC | Call | 0 | -100,00 | 0 | -100,00 | |||
| 2026-02-12 | 13F | Jane Street Group, Llc | 31.933 | 4,58 | 2.588 | -38,83 | ||||
| 2025-10-22 | 13F | Longboard Asset Management, LP | 0 | -100,00 | 0 | |||||
| 2025-11-04 | 13F | Carrera Capital Advisors | 0 | -100,00 | 0 | -100,00 | ||||
| 2026-02-11 | 13F | Capital International Ltd /ca/ | 193.949 | -7,76 | 15.716 | -46,04 | ||||
| 2026-02-12 | 13F | Colonial Trust Co / SC | 0 | -100,00 | 0 | |||||
| 2026-02-17 | 13F | DV Trading LLC | 100 | 8 | ||||||
| 2026-01-29 | 13F | Simon Quick Advisors, Llc | 3.590 | 2,57 | 291 | -40,08 | ||||
| 2026-01-29 | 13F | Rakuten Securities, Inc. | 1.947 | 119,50 | 158 | 28,69 | ||||
| 2026-01-20 | 13F | Toth Financial Advisory Corp | 4 | 0 | ||||||
| 2026-01-16 | 13F | StoneCrest Wealth Management, Inc. | 0 | -100,00 | 0 | -100,00 | ||||
| 2025-11-13 | 13F | Gordian Capital Singapore Pte Ltd | 0 | -100,00 | 0 | |||||
| 2025-11-13 | 13F | Hel Ved Capital Management Ltd | Call | 0 | -100,00 | 0 | -100,00 | |||
| 2026-02-10 | 13F | Rothschild Investment Llc | 837 | -84,38 | 68 | -90,97 | ||||
| 2026-01-30 | 13F | Pekin Hardy Strauss, Inc. | 3.460 | 0,87 | 280 | -41,05 | ||||
| 2026-02-11 | 13F | Loup Funds, LLC | 82.841 | 6.713 | ||||||
| 2026-02-02 | 13F | Caisse Des Depots Et Consignations | 0 | -100,00 | 0 | |||||
| 2026-02-17 | 13F | Bank Of America Corp /de/ | 3.306.243 | 18,87 | 267.905 | -30,46 | ||||
| 2025-11-05 | 13F | a16z Perennial Management, L.P. | Put | 0 | -100,00 | 0 | -100,00 | |||
| 2026-02-17 | 13F | Tcw Group Inc | 9.872 | 800 | ||||||
| 2026-01-15 | 13F | Royal Fund Management, LLC | 42.624 | 2,16 | 3.454 | -40,25 | ||||
| 2026-02-02 | 13F | Bay Harbor Wealth Management, LLC | 14 | -30,00 | 1 | -50,00 | ||||
| 2026-01-29 | 13F | Equita Financial Network, Inc. | 0 | -100,00 | 0 | -100,00 | ||||
| 2026-02-06 | 13F | Heritage Investors Management Corp | 0 | -100,00 | 0 | |||||
| 2026-02-13 | 13F | Dai-Ichi Life Insurance Company, Ltd | 19.029 | 0,00 | 1.542 | -41,52 | ||||
| 2026-02-17 | 13F | Warren Averett Asset Management, LLC | 8.172 | 25,80 | 662 | -26,36 | ||||
| 2026-02-17 | 13F | Whale Rock Capital Management LLC | 4.105.113 | 10,36 | 332.637 | -35,44 | ||||
| 2026-02-12 | 13F | Jasper Ridge Partners, L.P. | 592.261 | -19,90 | 47.991 | -53,14 | ||||
| 2026-02-02 | 13F | Oppenheimer & Co Inc | 6.599 | -33,28 | 535 | -61,02 | ||||
| 2026-02-12 | 13F | BlackRock, Inc. | 41.526.121 | 5,44 | 3.364.862 | -38,32 | ||||
| 2026-02-11 | 13F | Fjarde Ap-fonden /fourth Swedish National Pension Fund | 121.800 | 9.869 | ||||||
| 2026-02-17 | 13F | Numerai GP LLC | 21.145 | -28,31 | 1.713 | -58,07 | ||||
| 2025-11-14 | 13F | Lakewood Capital Management, Lp | Put | 0 | -100,00 | 0 | ||||
| 2026-02-09 | 13F | Prospera Financial Services Inc | 0 | -100,00 | 0 | |||||
| 2026-02-13 | 13F | Candriam Luxembourg S.C.A. | 39.859 | -7,67 | 3.230 | -45,99 | ||||
| 2026-02-17 | 13F | Susquehanna International Group, Llp | Put | 3.599.600 | 22,41 | 291.676 | -28,40 | |||
| 2026-02-13 | 13F | Caitong International Asset Management Co., Ltd | 776 | 77.500,00 | 63 | |||||
| 2026-02-17 | 13F | Susquehanna International Group, Llp | Call | 4.084.700 | -21,89 | 330.983 | -54,31 | |||
| 2026-02-11 | 13F | Prudential Plc | 34.158 | -16,41 | 2.768 | -51,11 | ||||
| 2026-02-17 | 13F | Susquehanna International Group, Llp | 896.751 | 108,32 | 72.664 | 21,86 | ||||
| 2026-01-22 | 13F | Premier Path Wealth Partners, LLC | 3.588 | -8,09 | 291 | -46,30 | ||||
| 2026-02-09 | 13F | Blue Bell Private Wealth Management, Llc | 35 | 0,00 | 3 | -50,00 | ||||
| 2026-02-11 | 13F | Westfield Capital Management Co Lp | 461.670 | -61,19 | 37.409 | -77,30 | ||||
| 2026-01-05 | 13F | Grant Private Wealth Management Inc | 5.820 | -3,32 | 472 | -43,46 | ||||
| 2026-02-04 | 13F | HighPoint Advisor Group LLC | 11.535 | 8,44 | 935 | -36,59 | ||||
| 2026-02-17 | 13F | Cetera Investment Advisers | 53.348 | 5,47 | 4.323 | -38,31 | ||||
| 2026-02-06 | 13F | Global Retirement Partners, LLC | 3.902 | 0,75 | 316 | -41,04 | ||||
| 2026-02-13 | 13F | Ariadne Wealth Management, LP | 4.682 | -24,64 | 296 | -53,10 | ||||
| 2026-02-17 | 13F | Vinva Investment Management Ltd | 50.810 | -43,28 | 4.157 | -67,22 | ||||
| 2026-02-17 | 13F | Triavera Capital LLC | 39.849 | -42,41 | 3.229 | -66,32 | ||||
| 2026-02-04 | 13F | Fortem Financial Group, Llc | 0 | -100,00 | 0 | -100,00 | ||||
| 2026-02-13 | 13F | Maia Wealth LLC | 12.149 | 1,03 | 767 | -39,42 | ||||
| 2026-02-17 | 13F | Voleon Capital Management Lp | 290.498 | 27,65 | 23.539 | -25,33 | ||||
| 2026-02-17 | 13F | Mane Global Capital Management Lp | 5.190 | -99,08 | 421 | -99,46 | ||||
| 2026-02-13 | 13F | Sands Capital Management, Llc | 3.183.399 | -8,43 | 257.951 | -46,43 | ||||
| 2025-11-14 | 13F | ICONIQ Capital, LLC | 0 | -100,00 | 0 | |||||
| 2026-02-17 | 13F | Advisory Services Network, LLC | 0 | -100,00 | 0 | -100,00 | ||||
| 2026-02-10 | 13F | BW Gestao de Investimentos Ltda. | 0 | -100,00 | 0 | |||||
| 2026-02-13 | 13F | Islander Capital Partners, L.P. | 247.858 | 20.084 | ||||||
| 2026-01-09 | 13F | IFS Advisors, LLC | 16 | 0,00 | 1 | -50,00 | ||||
| 2026-01-23 | 13F | Valley National Advisers Inc | 29 | 190,00 | 0 | |||||
| 2026-02-13 | 13F | Itau Unibanco Holding S.A. | 1.587 | -45,28 | 129 | -68,08 | ||||
| 2026-02-12 | 13F | Skandinaviska Enskilda Banken AB (publ) | 133.831 | 7,74 | 10.842 | -37,02 | ||||
| 2025-11-14 | 13F | Principal Street Partners, LLC | 0 | -100,00 | 0 | |||||
| 2026-02-17 | 13F | Ninepoint Partners LP | 0 | -100,00 | 0 | -100,00 | ||||
| 2026-02-13 | 13F | Ieq Capital, Llc | 17.245.356 | -1,29 | 1.397.391 | -42,26 | ||||
| 2026-02-13 | 13F | Citigroup Inc | 651.532 | -26,01 | 52.794 | -56,72 | ||||
| 2026-02-05 | 13F | Beese Fulmer Investment Management, Inc. | 5.939 | 481 | ||||||
| 2026-02-11 | 13F | Ing Groep Nv | 158.400 | -31,78 | 12.835 | -60,10 | ||||
| 2026-01-28 | 13F | WPG Advisers, LLC | 134 | -75,86 | 11 | -86,84 | ||||
| 2026-02-10 | 13F | Ellevest, Inc. | 5.442 | -34,75 | 441 | -61,90 | ||||
| 2026-02-13 | 13F | Brown Advisory Inc | 217.139 | -12,51 | 17.595 | -48,82 | ||||
| 2026-02-12 | 13F | California Public Employees Retirement System | 1.046.441 | 2,17 | 84.793 | -40,23 | ||||
| 2026-02-17 | 13F | EFG International AG | 6.702 | 543 | ||||||
| 2026-02-13 | 13F | Polymer Capital Management (HK) LTD | 8.047 | -85,31 | 652 | -91,41 | ||||
| 2026-02-06 | 13F | Tortoise Investment Management, LLC | 0 | -100,00 | 0 | -100,00 | ||||
| 2026-02-17 | 13F | HighVista Strategies LLC | 8.431 | -3,09 | 683 | -43,32 | ||||
| 2026-01-29 | 13F | Nbc Securities, Inc. | 187 | 6.133,33 | 15 | |||||
| 2026-01-14 | 13F | AA Financial Advisors, LLC | 0 | -100,00 | 0 | -100,00 | ||||
| 2026-02-03 | 13F | SFG Wealth Management, LLC. | 10.471 | 0,00 | 848 | -41,52 | ||||
| 2026-01-07 | 13F | Sagespring Wealth Partners, Llc | 6.039 | -3,96 | 489 | -43,86 | ||||
| 2026-02-09 | 13F | Keating Financial Advisory Services, Inc. | 138 | 11 | ||||||
| 2026-02-12 | 13F | Hollencrest Capital Management | Put | 0 | -100,00 | 0 | -100,00 | |||
| 2026-02-09 | 13F | Quest Partners LLC | 5.593 | 114,05 | 453 | 25,48 | ||||
| 2026-02-13 | 13F | Atika Capital Management LLC | 0 | -100,00 | 0 | |||||
| 2026-02-10 | 13F | Eurizon Capital SGR S.p.A. | 141.282 | 11.450 | ||||||
| 2026-02-10 | 13F | State of Wyoming | 0 | -100,00 | 0 | -100,00 | ||||
| 2026-02-11 | 13F | Havemeyer Place LP | 25.643 | 2.078 | ||||||
| 2026-02-12 | 13F | Penserra Capital Management LLC | 109.214 | 63,33 | 9 | -11,11 | ||||
| 2026-02-03 | 13F | NewEdge Wealth, LLC | 12.566 | -4,85 | 1.018 | -24,59 | ||||
| 2026-02-17 | 13F | Qube Research & Technologies Ltd | Put | 237.400 | 74,17 | 19.237 | 1,89 | |||
| 2026-02-13 | 13F | Pitcairn Wealth Advisors LLC | 8.256 | 669 | ||||||
| 2026-02-17 | 13F | Qube Research & Technologies Ltd | Call | 309.500 | 167,50 | 25.079 | 56,48 | |||
| 2026-02-17 | 13F | Qube Research & Technologies Ltd | 4.431.982 | 148,98 | 359.124 | 45,65 | ||||
| 2026-02-12 | 13F | Summit Financial, LLC | 12.639 | -66,63 | 1.024 | -80,48 | ||||
| 2026-01-29 | 13F | Aspen Capital Management, LLC | 5.973 | -14,96 | 484 | -50,31 | ||||
| 2026-01-23 | 13F | Sunpointe, LLC | 0 | -100,00 | 0 | -100,00 | ||||
| 2026-02-10 | 13F | Winthrop Capital Management, LLC | 75 | 341,18 | 0 | |||||
| 2026-02-10 | 13F | Hazlett, Burt & Watson, Inc. | 0 | -100,00 | 0 | |||||
| 2026-02-12 | 13F | Elevated Private Wealth, LLC | 7.873 | 638 | ||||||
| 2026-01-20 | 13F | Perpetual Ltd | 24.956 | 31,05 | 2.022 | -23,32 | ||||
| 2026-02-13 | 13F | AlTi Global, Inc. | 6.342 | 3,63 | 514 | -39,43 | ||||
| 2026-01-09 | 13F | SG Americas Securities, LLC | Call | 279.400 | -22,00 | 1 | -90,00 | |||
| 2026-02-17 | 13F | Science & Technology Partners, L.P. | 0 | -100,00 | 0 | -100,00 | ||||
| 2025-10-27 | 13F | N.E.W. Advisory Services LLC | 0 | -100,00 | 0 | -100,00 | ||||
| 2026-02-13 | 13F | Resources Investment Advisors, LLC. | 13.909 | 1,28 | 1.127 | -40,75 | ||||
| 2026-02-11 | 13F | Twin Tree Management, LP | Put | 14.000 | -25,53 | 1.134 | -56,45 | |||
| 2026-03-09 | 13F/A | CI Private Wealth, LLC | 18.206 | -7,35 | 1.474 | -45,89 | ||||
| 2026-03-24 | 13F | Armis Advisers, LLC | 0 | -100,00 | 0 | |||||
| 2026-02-03 | 13F | Coston, McIsaac & Partners | 25 | 0,00 | 0 | |||||
| 2026-02-11 | 13F | Twin Tree Management, LP | Call | 18.700 | -76,42 | 1.515 | -86,21 | |||
| 2025-11-20 | 13F | Wbi Investments, Inc. | 0 | -100,00 | 0 | -100,00 | ||||
| 2026-02-04 | 13F | Dogwood Wealth Management LLC | 93 | 116,28 | 8 | 40,00 | ||||
| 2026-02-11 | 13F | Capital World Investors | 12.136.732 | -6,58 | 983.461 | -45,35 | ||||
| 2026-02-03 | 13F | Harel Insurance Investments & Financial Services Ltd. | 0 | 0 | ||||||
| 2026-02-02 | 13F | Qrg Capital Management, Inc. | 61.058 | -0,12 | 4.948 | -41,57 | ||||
| 2026-02-10 | 13F | WCG Wealth Advisors LLC | 23.286 | 1.887 | ||||||
| 2026-02-17 | 13F | Lighthouse Investment Partners, LLC | 14.737 | 1.194 | ||||||
| 2026-02-17 | 13F | California State Teachers Retirement System | 913.738 | 1,43 | 74.040 | -40,66 | ||||
| 2026-02-13 | 13F | Golden State Wealth Management, LLC | 181 | 123,46 | 15 | 27,27 | ||||
| 2025-11-14 | 13F | Petrus Trust Company, LTA | 0 | -100,00 | 0 | |||||
| 2026-02-12 | 13F | Quadrant Capital Group Llc | 260 | -12,46 | 21 | -48,78 | ||||
| 2026-02-09 | 13F | Coldstream Capital Management Inc | 0 | -100,00 | 0 | |||||
| 2026-02-13 | 13F | Soros Fund Management Llc | 10.335 | 837 | ||||||
| 2026-02-13 | 13F | Invictus Private Wealth, Llc | 0 | -100,00 | 0 | |||||
| 2026-02-13 | 13F | Rafferty Asset Management, LLC | 20.895 | -17,69 | 1.693 | -51,85 | ||||
| 2026-02-06 | 13F | Addison Advisors LLC | 48 | 0,00 | 4 | -50,00 | ||||
| 2026-02-13 | 13F | Neo Ivy Capital Management | 31.884 | 2.101,93 | 2.584 | 1.191,50 | ||||
| 2026-02-12 | 13F | Adviser Investments LLC | 4.970 | 0,30 | 403 | -41,40 | ||||
| 2026-02-04 | 13F | West Tower Group, LLC | 0 | -100,00 | 0 | |||||
| 2026-02-11 | 13F | LPL Financial LLC | 211.319 | -12,79 | 17.123 | -48,98 | ||||
| 2026-01-15 | 13F | Royal Fund Management, LLC | Call | 0 | -100,00 | 0 | -100,00 | |||
| 2026-02-11 | 13F | LPL Financial LLC | Put | 10.500 | 162,50 | 851 | 53,43 | |||
| 2026-02-13 | 13F | FORA Capital, LLC | 165.894 | 238,79 | 13.442 | 98,20 | ||||
| 2025-11-14 | 13F | Wetherby Asset Management Inc | 3.376 | 49,31 | 468 | 97,05 | ||||
| 2026-02-05 | 13F | New York Life Investment Management Llc | 0 | -100,00 | 0 | -100,00 | ||||
| 2026-02-10 | 13F | Acadian Asset Management Llc | 547.287 | -59,18 | 44 | -76,22 | ||||
| 2025-11-10 | 13F | Nkcfo Llc | 0 | -100,00 | 0 | |||||
| 2026-01-14 | 13F | Nova Wealth Management, Inc. | 12 | 0,00 | 1 | -100,00 | ||||
| 2026-02-06 | 13F | Bare Financial Services, Inc | 21 | -65,00 | 2 | -87,50 | ||||
| 2026-02-17 | 13F | T. Rowe Price Investment Management, Inc. | 90 | 0,00 | 0 | |||||
| 2026-02-12 | 13F | Groupe la Francaise | 0 | -100,00 | 0 | |||||
| 2026-01-05 | 13F | Park Avenue Securities Llc | 9.622 | -8,58 | 1 | -100,00 | ||||
| 2026-01-29 | 13F | Quest 10 Wealth Builders, Inc. | 3 | 0,00 | 0 | |||||
| 2026-01-21 | 13F | Oak Thistle LLC | 40.590 | 184,10 | 3.289 | 66,20 | ||||
| 2026-02-12 | 13F | IFC & Insurance Marketing, Inc. | 1.346 | 0 | ||||||
| 2026-02-13 | 13F | ADAPT Investment Managers SA | Put | 800.000 | 0,00 | 64.824 | -41,50 | |||
| 2026-01-20 | 13F | Independence Bank of Kentucky | 8 | 1 | ||||||
| 2026-01-21 | 13F | Sowell Financial Services LLC | 0 | -100,00 | 0 | -100,00 | ||||
| 2026-01-29 | 13F | Deltec Asset Management Llc | 0 | -100,00 | 0 | |||||
| 2026-02-17 | 13F | Limestone Investment Advisors LP | Call | 10.800 | 1.700,00 | 875 | 954,22 | |||
| 2026-02-23 | 13F | Virtu Financial LLC | 58.101 | 5 | ||||||
| 2026-02-17 | 13F | Limestone Investment Advisors LP | Put | 7.000 | 288,89 | 567 | 127,71 | |||
| 2026-02-11 | 13F | Group One Trading, L.p. | Call | 432.900 | -33,57 | 35.078 | -61,14 | |||
| 2026-02-12 | 13F | Marsico Capital Management Llc | 188.150 | -24,23 | 15.246 | -55,68 | ||||
| 2026-02-09 | 13F | Geode Capital Management, Llc | 12.220.045 | 4,69 | 988.002 | -38,75 | ||||
| 2026-02-11 | 13F | Group One Trading, L.p. | Put | 190.100 | -18,52 | 15.404 | -52,34 | |||
| 2026-02-03 | 13F | Allegiance Financial Group Advisory Services LLC | 15.723 | 1,60 | 1.274 | -40,55 | ||||
| 2026-01-28 | 13F | Davis Capital Management | 6 | 50,00 | 0 | |||||
| 2026-01-20 | 13F | Stratos Wealth Partners, LTD. | 0 | -100,00 | 0 | |||||
| 2026-02-17 | 13F | Tower Research Capital LLC (TRC) | 5.265 | -81,42 | 427 | -89,14 | ||||
| 2026-01-14 | 13F | Family Wealth Partners, Llc | 0 | -100,00 | 0 | -100,00 | ||||
| 2026-01-14 | 13F | Pallas Capital Advisors LLC | 71.646 | -0,74 | 5.805 | -41,94 | ||||
| 2025-11-14 | 13F | Eqis Capital Management, Inc. | 0 | -100,00 | 0 | |||||
| 2026-02-17 | 13F | Maryland State Retirement & Pension System | 30.958 | 1,64 | 2.509 | -40,55 | ||||
| 2026-01-23 | 13F | Robeco Institutional Asset Management B.V. | 1.028.571 | 16,46 | 83.345 | -31,87 | ||||
| 2026-02-17 | 13F | Quantitative Investment Management, LLC | 41.793 | 3 | ||||||
| 2026-01-23 | 13F | TFC Financial Management | 0 | -100,00 | 0 | |||||
| 2026-01-15 | 13F | Private Advisory Group LLC | 0 | -100,00 | 0 | |||||
| 2026-01-16 | 13F | PFS Partners, LLC | 148 | 0,00 | 12 | -45,00 | ||||
| 2025-11-12 | 13F | Davidson Capital Management Inc. | 0 | -100,00 | 0 | |||||
| 2026-02-10 | 13F | AXS Investments LLC | 8.930 | 3,72 | 724 | -39,35 | ||||
| 2026-02-06 | 13F | JW Asset Management, LLC | 0 | -100,00 | 0 | |||||
| 2026-02-17 | 13F | Captrust Financial Advisors | 58.204 | -9,87 | 4.716 | -47,28 | ||||
| 2026-01-28 | 13F | Teacher Retirement System Of Texas | 104.622 | 19,59 | 8.478 | -30,05 | ||||
| 2026-02-06 | 13F | Handelsbanken Fonder AB | 317.111 | 58,39 | 26 | -7,41 | ||||
| 2026-02-03 | 13F | Pilgrim Partners Asia Pte Ltd | 1.000 | 426,32 | 81 | 211,54 | ||||
| 2025-11-14 | 13F | WealthTrak Capital Management LLC | 0 | -100,00 | 0 | |||||
| 2026-02-17 | 13F | Hampton Road Capital Management LP | 29.430 | -27,51 | 2.385 | -57,60 | ||||
| 2026-02-11 | 13F | Capital International Inc /ca/ | 314.617 | 54,80 | 25.493 | -9,45 | ||||
| 2026-01-26 | 13F | Paradigm Financial Partners, Llc | 15.568 | -0,30 | 1.261 | -41,67 | ||||
| 2026-02-05 | 13F | Amalgamated Bank | 52.658 | 6,22 | 4 | -33,33 | ||||
| 2026-02-17 | 13F | Parkwood LLC | 8.391 | 1 | ||||||
| 2026-01-15 | 13F | Highline Wealth Partners Llc | 33 | -50,75 | 3 | -77,78 | ||||
| 2026-02-17 | 13F | Arthur M. Cohen & Associates, Llc | 20.049 | 0,24 | 1.625 | -41,37 | ||||
| 2026-02-17 | 13F | Limestone Investment Advisors LP | 1.170 | 95 | ||||||
| 2026-01-14 | 13F | Exchange Traded Concepts, Llc | 275.294 | 2,93 | 22.307 | -39,79 | ||||
| 2026-02-17 | 13F | PharVision Advisers, LLC | 2.714 | 72,32 | 220 | 0,46 | ||||
| 2026-02-17 | 13F | Davidson Kempner Capital Management Lp | 269.445 | 21.833 | ||||||
| 2026-02-05 | 13F | Thrivent Financial For Lutherans | 642.763 | 824,45 | 52 | 477,78 | ||||
| 2026-02-17 | 13F | TCG Advisory Services, LLC | 0 | -100,00 | 0 | |||||
| 2026-03-11 | 13F | Leonteq Securities AG | Call | 0 | -100,00 | 0 | ||||
| 2026-01-14 | 13F | Northwest Wealth Management, Llc | 6.397 | 26,00 | 518 | -26,32 | ||||
| 2026-01-21 | 13F | Azzad Asset Management Inc /adv | 19.836 | 8,99 | 1.607 | -36,26 | ||||
| 2026-01-29 | 13F | Vanguard Group Inc | 63.458.784 | 1,63 | 5.142.065 | -40,55 | ||||
| 2026-02-02 | 13F | Varma Mutual Pension Insurance Co | 109.000 | 8.832 | ||||||
| 2026-03-02 | 13F | Bank Of Hawaii | 0 | -100,00 | 0 | |||||
| 2025-11-13 | 13F | Bnp Paribas Arbitrage, Sa | Put | 0 | -100,00 | 0 | -100,00 | |||
| 2026-02-12 | 13F | Federated Hermes, Inc. | 2.558.670 | -20,80 | 207.329 | -53,67 | ||||
| 2026-02-13 | 13F | Verition Fund Management LLC | 58.875 | -58,48 | 4.771 | -75,71 | ||||
| 2026-02-03 | 13F | Sequoia Financial Advisors, LLC | 10.393 | -3,22 | 842 | -43,38 | ||||
| 2026-02-13 | 13F | Hudson Bay Capital Management LP | 0 | -100,00 | 0 | -100,00 | ||||
| 2026-02-12 | 13F | BRYN MAWR TRUST Co | 8.564 | 2.252,75 | 694 | 1.286,00 | ||||
| 2026-01-30 | 13F | Archer Investment Corp | 20 | 0,00 | 2 | -50,00 | ||||
| 2026-02-10 | 13F | Three Bridge Wealth Advisors, LLC | 98.184 | -22,26 | 7.956 | -54,52 | ||||
| 2026-02-13 | 13F | Headlands Technologies LLC | 4.005 | -66,16 | 325 | -80,23 | ||||
| 2026-02-11 | 13F | SOUTH STATE Corp | 364 | -12,08 | 29 | -49,12 | ||||
| 2026-02-10 | 13F | Bank of New York Mellon Corp | 1.787.634 | 3,40 | 144.852 | -39,51 | ||||
| 2026-01-27 | 13F | TD Waterhouse Canada Inc. | 926 | -83,86 | 75 | -90,25 | ||||
| 2026-02-10 | 13F | a16z Perennial Management, L.P. | 113.547 | 0,01 | 9.201 | -41,50 | ||||
| 2026-02-05 | 13F | Requisite Capital Management, LLC | 0 | -100,00 | 0 | |||||
| 2026-02-02 | 13F | CX Institutional | 66 | 0,00 | 0 | |||||
| 2026-02-18 | 13F | Beacon Pointe Advisors, LLC | 0 | -100,00 | 0 | |||||
| 2026-02-10 | 13F | Root Financial Partners, LLC | 281 | 2,55 | 23 | -40,54 | ||||
| 2026-02-05 | 13F | Mount Lucas Management LP | 6.129 | -1,78 | 497 | -42,59 | ||||
| 2026-02-17 | 13F | Keebeck Alpha, LP | 2.598 | -43,32 | 211 | -66,88 | ||||
| 2026-02-13 | 13F | PARK CIRCLE Co | 800 | 0,00 | 65 | -41,82 | ||||
| 2026-01-09 | 13F | Assenagon Asset Management S.A. | 1.551.456 | 342,57 | 125.714 | 158,89 | ||||
| 2026-02-06 | 13F | Profund Advisors Llc | 23.840 | -4,57 | 1.932 | -44,19 | ||||
| 2025-11-14 | 13F | Point72 (DIFC) Ltd | Put | 0 | -100,00 | 0 | ||||
| 2026-01-15 | 13F | Mn Services Vermogensbeheer B.V. | 205.289 | 1,38 | 17 | -42,86 | ||||
| 2026-02-17 | 13F | Woodline Partners LP | 10.717 | -94,21 | 868 | -96,61 | ||||
| 2025-11-14 | 13F | Point72 (DIFC) Ltd | 0 | -100,00 | 0 | |||||
| 2026-02-12 | 13F | Marex Group plc | 5.535 | 75,83 | 449 | 2,75 | ||||
| 2025-11-14 | 13F | Point72 (DIFC) Ltd | Call | 0 | -100,00 | 0 | ||||
| 2026-01-30 | 13F | Jennison Associates Llc | 454.309 | 3,18 | 36.813 | -39,65 | ||||
| 2025-11-07 | 13F | Credit Industriel Et Commercial | Put | 0 | -100,00 | 0 | -100,00 | |||
| 2025-11-13 | 13F | Eisler Capital Management Ltd. | Put | 3.400 | -77,33 | 482 | -69,50 | |||
| 2025-11-13 | 13F | Eisler Capital Management Ltd. | Call | 2.300 | -77,67 | 326 | -69,99 | |||
| 2025-11-13 | 13F | Eisler Capital Management Ltd. | 28 | 4 | ||||||
| 2026-02-12 | 13F | Renaissance Technologies Llc | 6.628.509 | -3,71 | 537.108 | -43,67 | ||||
| 2026-02-13 | 13F | National Bank Of Canada /fi/ | 13.375 | 9,96 | 1.082 | -35,75 | ||||
| 2026-02-11 | 13F | OneAscent Wealth Management LLC | 3.386 | 274 | ||||||
| 2026-02-13 | 13F | Corient IA LLC | 3.100 | 0,00 | 251 | -41,49 | ||||
| 2026-02-05 | 13F | High Note Wealth, LLC | 37 | 825,00 | 3 | |||||
| 2026-02-12 | 13F | Keel Point, LLC | 0 | -100,00 | 0 | |||||
| 2026-02-13 | 13F | Arrowstreet Capital, Limited Partnership | 0 | -100,00 | 0 | |||||
| 2026-02-06 | 13F | Tanglewood Legacy Advisors, LLC | 530 | 0,00 | 43 | -42,47 | ||||
| 2026-01-08 | 13F | NorthCrest Asset Manangement, LLC | 17.026 | 14,85 | 1.380 | -25,58 | ||||
| 2026-02-11 | 13F | Illinois Municipal Retirement Fund | 42.863 | 19,17 | 3.473 | -30,29 | ||||
| 2026-02-17 | 13F | Two Sigma Investments, Lp | 3.007.272 | 77,59 | 243.679 | 3,89 | ||||
| 2026-02-11 | 13F | Picton Mahoney Asset Management | 14.088 | -87,74 | 1.142 | 7.506,67 | ||||
| 2026-02-11 | 13F | Gilpin Wealth Management, Llc | 6 | 0 | ||||||
| 2026-02-05 | 13F | iA Global Asset Management Inc. | 0 | -100,00 | 0 | -100,00 | ||||
| 2026-01-21 | 13F | Albion Financial Group /ut | 3 | 0,00 | 0 | |||||
| 2026-01-28 | 13F | Klp Kapitalforvaltning As | 212.000 | 4,18 | 17.178 | -39,06 | ||||
| 2026-01-07 | 13F | Aventura Private Wealth, LLC | 5 | 0,00 | 0 | |||||
| 2026-01-12 | 13F | DAVENPORT & Co LLC | 0 | -100,00 | 0 | |||||
| 2026-01-09 | 13F | SG Americas Securities, LLC | Put | 162.300 | 0,00 | 0 | ||||
| 2026-02-11 | 13F | Nationale-Nederlanden Powszechne Towarzystwo Emerytalne S.A. | 0 | -100,00 | 0 | |||||
| 2026-01-09 | 13F | SG Americas Securities, LLC | 345.881 | 5,03 | 28 | -37,78 | ||||
| 2026-01-21 | 13F | Capricorn Fund Managers Ltd | 0 | -100,00 | 0 | |||||
| 2026-02-06 | 13F | Leonteq Securities AG | 18.204 | 256,10 | 1.475 | 108,33 | ||||
| 2026-02-24 | 13F | Bell Investment Advisors, Inc | 445 | 31,27 | 36 | -21,74 | ||||
| 2026-02-05 | 13F | Western Wealth Management, LLC | 0 | -100,00 | 0 | |||||
| 2026-02-09 | 13F | Frazier Financial Advisors, LLC | 89 | 0,00 | 7 | -41,67 | ||||
| 2026-01-23 | 13F | Freestone Capital Holdings, LLC | 10.279 | 1,75 | 833 | -40,53 | ||||
| 2026-01-30 | 13F | Interchange Capital Partners, LLC | 4.374 | -5,90 | 354 | -44,95 | ||||
| 2026-02-10 | 13F | Axq Capital, Lp | 29.110 | 662,64 | 2.359 | 346,59 | ||||
| 2026-02-17 | 13F | Magnetar Financial LLC | 8.324 | -60,25 | 674 | -76,77 | ||||
| 2025-11-14 | 13F | Troluce Capital Advisors LLC | Put | 0 | -100,00 | 0 | -100,00 | |||
| 2026-01-28 | 13F | EPG Wealth Management LLC | 4.649 | 377 | ||||||
| 2026-02-11 | 13F | Rise Advisors, LLC | 0 | -100,00 | 0 | |||||
| 2025-10-30 | 13F | Twin Peaks Wealth Advisors, LLC | 0 | -100,00 | 0 | |||||
| 2026-01-12 | 13F | Avanza Fonder AB | 46.238 | 19,92 | 3.747 | -29,86 | ||||
| 2026-02-13 | 13F | Centaurus Financial, Inc. | 0 | -100,00 | 0 | |||||
| 2026-01-16 | 13F | IVC Wealth Advisors LLC | 0 | -100,00 | 0 | -100,00 | ||||
| 2026-02-02 | 13F | Your Advocates Ltd., LLP | 0 | -100,00 | 0 | |||||
| 2026-02-05 | 13F | Donoghue Forlines LLC | 0 | -100,00 | 0 | -100,00 | ||||
| 2025-11-14 | 13F | Axa S.a. | 0 | -100,00 | 0 | -100,00 | ||||
| 2025-11-14 | 13F | Knightsbridge Asset Management, Llc | 3.521 | 20,50 | 488 | 58,63 | ||||
| 2026-02-17 | 13F | Toronto Dominion Bank | 93.194 | -45,93 | 7.552 | -68,37 | ||||
| 2026-01-16 | 13F | Marquette Asset Management, LLC | 99 | 39,44 | 8 | -11,11 | ||||
| 2026-02-19 | 13F | Mcguire Capital Advisors Inc | 234 | 19 | ||||||
| 2026-02-03 | 13F | Crossmark Global Holdings, Inc. | 93.483 | 1.830,67 | 7.575 | 1.030,45 | ||||
| 2026-02-09 | 13F | V. M. Manning & Co., Inc. | 0 | -100,00 | 0 | -100,00 | ||||
| 2026-02-17 | 13F | Gotham Asset Management, LLC | 152.657 | -27,32 | 12.370 | -57,48 | ||||
| 2026-02-05 | 13F | Td Private Client Wealth Llc | 1.824 | 1,67 | 148 | -40,73 | ||||
| 2026-01-29 | 13F | TrimTabs Asset Management, LLC | 120.039 | -15,32 | 9.727 | -50,47 | ||||
| 2026-02-13 | 13F | Wilkerson Advisory Group LLC | 131 | 11 | ||||||
| 2025-11-07 | 13F | Sierra Ocean, Llc | 0 | -100,00 | 0 | |||||
| 2026-02-17 | 13F | Persistent Asset Partners Ltd | 20.000 | 1.621 | ||||||
| 2026-02-13 | 13F | Prudential Financial Inc | 17.330 | -68,92 | 1.418 | -81,65 | ||||
| 2026-01-23 | 13F | Halbert Hargrove Global Advisors, Llc | 0 | -100,00 | 0 | -100,00 | ||||
| 2026-02-12 | 13F | Voya Investment Management Llc | 1.405.048 | 10,23 | 113.594 | -35,54 | ||||
| 2026-02-17 | 13F | Parallax Volatility Advisers, L.P. | 112.896 | 78,64 | 9.148 | 4,50 | ||||
| 2026-02-17 | 13F | Parallax Volatility Advisers, L.P. | Call | 55.000 | -18,52 | 4.457 | -52,34 | |||
| 2026-02-11 | 13F | Metis Global Partners, LLC | 5.952 | -38,19 | 482 | -63,84 | ||||
| 2026-02-17 | 13F | Parallax Volatility Advisers, L.P. | Put | 75.000 | 23,36 | 6.077 | -27,84 | |||
| 2026-02-04 | 13F | Swiss Life Asset Management Ltd | 56.383 | -4,53 | 4.569 | -44,16 | ||||
| 2025-11-20 | 13F | Maven Securities LTD | Call | 0 | -100,00 | 0 | -100,00 | |||
| 2026-02-17 | 13F | Wiley Bros.-aintree Capital, Llc | 17.249 | 23,74 | 1.398 | -28,25 | ||||
| 2026-01-30 | 13F | Keybank National Association/oh | 10.277 | 6,13 | 833 | -37,96 | ||||
| 2026-02-10 | 13F | Kentucky Retirement Systems | 38.357 | 0,00 | 3.108 | -41,50 | ||||
| 2026-02-10 | 13F | Principia Wealth Advisory, LLC | 26 | -18,75 | 2 | -50,00 | ||||
| 2026-02-17 | 13F | Optiver Holding B.V. | Call | 150.600 | 14,96 | 12.203 | -32,75 | |||
| 2026-02-06 | 13F | Envestnet Portfolio Solutions, Inc. | 3.670 | -2,24 | 297 | -42,88 | ||||
| 2026-02-12 | 13F | New York State Common Retirement Fund | 307.648 | -0,39 | 24.929 | -41,73 | ||||
| 2026-02-17 | 13F | Optiver Holding B.V. | Put | 60.900 | 30,41 | 4.935 | -23,72 | |||
| 2026-02-11 | 13F | Parallel Advisors, LLC | 28.469 | 4,82 | 2.307 | -38,70 | ||||
| 2026-02-17 | 13F | Aster Capital Management (DIFC) Ltd | 0 | -100,00 | 0 | |||||
| 2026-01-26 | 13F | JNBA Financial Advisors | 11 | 1 | ||||||
| 2026-02-04 | 13F | Peterson Wealth Management | 14.380 | -0,27 | 1.165 | -41,66 | ||||
| 2026-02-13 | 13F | Kestra Advisory Services, LLC | 0 | -100,00 | 0 | |||||
| 2026-02-12 | 13F | Hm Payson & Co | 206 | 17 | ||||||
| 2026-02-03 | 13F | Drucker Wealth 3.0, LLC | 0 | -100,00 | 0 | -100,00 | ||||
| 2026-01-27 | 13F | Zurcher Kantonalbank (Zurich Cantonalbank) | 203.106 | 7,49 | 16.458 | -37,12 | ||||
| 2026-02-18 | 13F | GWM Advisors LLC | 16.454 | 11,37 | 1.333 | -34,85 | ||||
| 2026-02-17 | 13F | Ameriprise Financial Inc | 1.102.490 | 13,91 | 89.335 | -33,37 | ||||
| 2026-01-08 | 13F | Wealth Enhancement Advisory Services, Llc | 165.686 | -2,35 | 12.475 | -41,18 | ||||
| 2026-02-12 | 13F | Lansforsakringar Fondforvaltning AB (publ) | 186.445 | 12,93 | 15.108 | -33,94 | ||||
| 2026-02-17 | 13F | Maytus Capital Management, LLC | 0 | -100,00 | 0 | |||||
| 2026-01-26 | 13F | PayPay Securities Corp | 14 | 100,00 | 1 | |||||
| 2026-01-28 | 13F | Cornerstone Enterprises, Llc | 2.572 | 24,61 | 208 | -27,02 | ||||
| 2026-01-23 | 13F | Private Wealth Management Group, LLC | 100 | 0,00 | 8 | -38,46 | ||||
| 2026-02-11 | 13F | Meeder Advisory Services, Inc. | 9.115 | 739 | ||||||
| 2025-11-14 | 13F | Strategic Wealth Partners, Ltd. | 30 | 0,00 | 4 | 33,33 | ||||
| 2026-02-13 | 13F | Sterling Capital Management LLC | 17.641 | -53,97 | 1.429 | -73,08 | ||||
| 2026-02-06 | 13F | Motco | 69 | 0,00 | 6 | -44,44 | ||||
| 2026-01-14 | 13F | Kaufman Rossin Wealth, LLC | 13.123 | 0,24 | 1.063 | -41,37 | ||||
| 2026-02-09 | 13F | Monetta Financial Services Inc | 0 | -100,00 | 0 | -100,00 | ||||
| 2026-02-17 | 13F | Nomura Holdings Inc | 162.149 | 35,85 | 13.139 | -20,53 | ||||
| 2026-02-06 | 13F | Cullen/frost Bankers, Inc. | 1.134 | 53,66 | 92 | -10,78 | ||||
| 2026-02-17 | 13F | Nomura Holdings Inc | Call | 1.148.900 | 3.073,76 | 93.095 | 1.756,70 | |||
| 2026-02-17 | 13F | Bank Of America Corp /de/ | Put | 0 | -100,00 | 0 | -100,00 | |||
| 2026-02-17 | 13F | Nomura Holdings Inc | Put | 536.200 | 1.381,22 | 43.448 | 766,53 | |||
| 2026-02-10 | 13F | Bridges Investment Management Inc | 0 | -100,00 | 0 | -100,00 | ||||
| 2026-02-13 | 13F | Okabena Investment Services Inc | 0 | -100,00 | 0 | |||||
| 2026-02-13 | 13F | Mariner, LLC | 274.786 | 21,78 | 22.277 | -28,73 | ||||
| 2026-02-17 | 13F | Evolve Private Wealth, Llc | 19.154 | 1.552 | ||||||
| 2026-02-03 | 13F | Strengthening Families & Communities, LLC | 0 | -100,00 | 0 | |||||
| 2025-10-24 | 13F | Hemington Wealth Management | 205 | 9,04 | 0 | |||||
| 2026-01-28 | 13F | Universal- Beteiligungs- und Servicegesellschaft mbH | 218.747 | -7,34 | 17.644 | -46,04 | ||||
| 2026-02-09 | 13F | Atlantic Trust, LLC | 112 | 0,00 | 9 | -40,00 | ||||
| 2026-02-09 | 13F | Key FInancial Inc | 3 | 0,00 | 0 | |||||
| 2026-02-13 | 13F | Peak6 Llc | 0 | -100,00 | 0 | -100,00 | ||||
| 2026-02-17 | 13F | Jones Financial Companies Lllp | 20.577 | 30,33 | 1.667 | -21,81 | ||||
| 2026-02-11 | 13F | OneAscent Investment Solutions LLC | 3.821 | 310 | ||||||
| 2026-02-13 | 13F | Ubs Asset Management Americas Inc | 2.451.507 | 4,58 | 198.646 | -38,82 | ||||
| 2026-02-11 | 13F | Zions Bancorporation, National Association /ut/ | 392 | 32 | ||||||
| 2026-01-12 | 13F | AllSquare Wealth Management LLC | 10 | 0,00 | 1 | 0,00 | ||||
| 2026-02-11 | 13F | TCTC Holdings, LLC | 100 | 0,00 | 8 | -38,46 | ||||
| 2026-01-30 | 13F | Citizens Financial Group Inc/ri | 86.328 | 0,17 | 6.995 | -41,40 | ||||
| 2026-02-13 | 13F | Public Employees Retirement Association Of Colorado | 72.718 | 0,45 | 6 | -50,00 | ||||
| 2026-02-17 | 13F | NorthRock Partners, LLC | 22.416 | 2,10 | 1.816 | -40,28 | ||||
| 2026-02-17 | 13F | Trexquant Investment LP | 511.033 | 156,18 | 41.409 | 49,86 | ||||
| 2026-02-18 | 13F | Financial Advisory Service, Inc. | 2.482 | 201 | ||||||
| 2026-03-20 | 13F/A | Hsbc Holdings Plc | Put | 140.000 | 11.390 | |||||
| 2026-01-28 | 13F | Oversea-Chinese Banking CORP Ltd | 0 | -100,00 | 0 | -100,00 | ||||
| 2026-02-17 | 13F | Temasek Holdings (Private) Ltd | 7.777.760 | 0,00 | 630.232 | -41,50 | ||||
| 2026-02-06 | 13F | Vestmark Advisory Solutions, Inc. | 103.928 | -0,95 | 8.421 | -42,06 | ||||
| 2026-02-11 | 13F | 111 Capital | 4.742 | 384 | ||||||
| 2026-01-22 | 13F | Quotient Wealth Partners, LLC | 0 | -100,00 | 0 | |||||
| 2026-02-05 | 13F | Center for Financial Planning, Inc. | 150 | 0,00 | 12 | -40,00 | ||||
| 2026-02-06 | 13F | Creative Financial Designs Inc /adv | 5 | -97,83 | 0 | -100,00 | ||||
| 2026-02-11 | 13F | Real Talk Capital, LLC | 0 | -100,00 | 0 | |||||
| 2025-10-22 | 13F | Gries Financial Llc | 5.247 | -4,57 | 727 | 25,61 | ||||
| 2026-02-11 | 13F | Capital Group Investment Management Pte. Ltd. | 41.408 | -6,38 | 3.355 | -45,23 | ||||
| 2026-02-11 | 13F | First Command Advisory Services, Inc. | 31 | 3 | ||||||
| 2026-01-16 | 13F | Crewe Advisors LLC | 2.096 | 0,67 | 170 | -41,32 | ||||
| 2026-02-03 | 13F | Insight 2811, Inc. | 0 | -100,00 | 0 | -100,00 | ||||
| 2026-02-09 | 13F | Berkshire Capital Holdings Inc | 10 | -99,99 | 1 | -100,00 | ||||
| 2026-01-20 | 13F | Cigna Investments Inc /new | 5.870 | 0,00 | 0 | |||||
| 2026-02-13 | 13F | Bridgewater Associates, LP | 20.691 | -76,94 | 1.677 | -86,52 | ||||
| 2026-01-29 | 13F | UBS Group AG | Put | 1.075.800 | 3,02 | 87.172 | -39,74 | |||
| 2026-01-21 | 13F | Signature Resources Capital Management, LLC | 38 | 171,43 | 3 | 200,00 | ||||
| 2026-01-29 | 13F | UBS Group AG | Call | 544.500 | -4,10 | 44.121 | -43,90 | |||
| 2026-01-29 | 13F | UBS Group AG | 2.537.094 | 59,53 | 205.581 | -6,68 | ||||
| 2026-02-13 | 13F | Eschler Asset Management LLP | 6.850 | 0,00 | 555 | -41,46 | ||||
| 2026-02-12 | 13F | Ankerstar Wealth, LLC | 47 | 4 | ||||||
| 2026-02-09 | 13F | Weinberger Asset Management, Inc | 10.486 | -4,52 | 850 | -44,18 | ||||
| 2026-02-13 | 13F | Schroder Investment Management Group | 131.849 | -58,78 | 10.684 | -76,41 | ||||
| 2026-02-17 | 13F | Canada Pension Plan Investment Board | 1.064.737 | -32,57 | 86.276 | -60,56 | ||||
| 2026-02-26 | 13F | TD Capital Management LLC | 9 | 0,00 | 1 | -100,00 | ||||
| 2026-01-21 | 13F | Sound Income Strategies, LLC | 871 | 102,56 | 76 | 40,74 | ||||
| 2025-11-14 | 13F | Full Sail Capital, LLC | 8.544 | 44,52 | 1.184 | 90,50 | ||||
| 2026-02-05 | 13F | Cardinal Point Capital Management, ULC | 0 | -100,00 | 0 | -100,00 | ||||
| 2026-02-17 | 13F | Atreides Management, LP | 389.571 | -47,14 | 31.567 | -69,08 | ||||
| 2026-02-09 | 13F | CBIZ Investment Advisory Services, LLC | 108 | 0,00 | 9 | -42,86 | ||||
| 2026-02-10 | 13F | Murphy & Mullick Capital Management Corp | 231 | 216,44 | 19 | 100,00 | ||||
| 2026-01-06 | 13F | Chemistry Wealth Management LLC | 13.586 | -0,65 | 1.101 | -41,92 | ||||
| 2026-02-04 | 13F | Valeo Financial Advisors, LLC | 0 | -100,00 | 0 | -100,00 | ||||
| 2026-01-14 | 13F | Cypress Wealth Services, LLC | 29.280 | 2.373 | ||||||
| 2026-02-02 | 13F | Danske Bank A/s | 285.024 | 12,82 | 23.095 | -34,00 | ||||
| 2026-01-23 | 13F | Schwab Charitable Fund | 40.303 | 0,00 | 3.266 | -41,51 | ||||
| 2026-01-26 | 13F | Parcion Private Wealth LLC | 10.550 | 25,25 | 855 | -26,76 | ||||
| 2026-01-29 | 13F | D.a. Davidson & Co. | 27.262 | 8,37 | 2.209 | -36,60 | ||||
| 2026-02-13 | 13F | Seneschal Advisors, LLC | 2 | -33,33 | 0 | |||||
| 2026-02-03 | 13F | Orion Capital Management LLC | 1 | 0,00 | 0 | |||||
| 2026-02-17 | 13F | Mercer Global Advisors Inc /adv | 81.679 | -5,30 | 6.618 | -44,61 | ||||
| 2026-02-17 | 13F | Guggenheim Capital Llc | 13.834 | -12,82 | 1.121 | -49,04 | ||||
| 2026-02-17 | 13F | Advisor Group Holdings, Inc. | Call | 1 | 0,00 | 1 | -75,00 | |||
| 2026-01-20 | 13F | Thurston, Springer, Miller, Herd & Titak, Inc. | 670 | 54 | ||||||
| 2026-02-18 | 13F | EP Wealth Advisors, Inc. | 4.288 | 105,56 | 347 | 58,45 | ||||
| 2026-02-11 | 13F | O'shaughnessy Asset Management, Llc | 50.317 | -18,51 | 4.077 | -52,33 | ||||
| 2026-02-17 | 13F | NewSquare Capital LLC | 0 | -100,00 | 0 | -100,00 | ||||
| 2026-02-02 | 13F | Wells Financial Advisors INC | 150 | 0,00 | 12 | -40,00 | ||||
| 2026-02-13 | 13F | Natixis | 0 | -100,00 | 0 | -100,00 | ||||
| 2026-02-06 | 13F | Resona Asset Management Co.,Ltd. | 166.816 | -2,58 | 13.529 | -43,13 | ||||
| 2026-02-10 | 13F | Glynn Capital Management Llc | 70.419 | 5.706 | ||||||
| 2026-02-11 | 13F | Cedar Mountain Advisors, LLC | 6 | 0 | ||||||
| 2026-02-12 | 13F | Ensign Peak Advisors, Inc | 276.017 | -11,80 | 22.366 | -48,41 | ||||
| 2026-02-18 | 13F/A | Alberta Investment Management Corp | 51.700 | 24,58 | 4.189 | -27,12 | ||||
| 2025-11-14 | 13F | Point72 Hong Kong Ltd | 56.141 | 39,14 | 7.777 | 83,22 | ||||
| 2026-01-13 | 13F | CoreCap Advisors, LLC | 597 | -81,44 | 48 | -89,21 | ||||
| 2026-01-23 | 13F | Aspect Partners, LLC | 13 | 0,00 | 1 | 0,00 | ||||
| 2026-02-20 | 13F | Kovitz Investment Group Partners, LLC | 0 | -100,00 | 0 | |||||
| 2026-02-13 | 13F | JustInvest LLC | 49.319 | -3,22 | 3.996 | -43,39 | ||||
| 2026-01-15 | 13F | Lodestone Wealth Management LLC | 179 | 15 | ||||||
| 2026-01-27 | 13F | Fortis Capital Advisors, LLC | 0 | -100,00 | 0 | -100,00 | ||||
| 2026-01-20 | 13F | Steel Peak Wealth Management LLC | 12.757 | 50,38 | 1.034 | -12,09 | ||||
| 2026-02-05 | 13F | Cambridge Investment Research Advisors, Inc. | 21.908 | -40,91 | 2 | -80,00 | ||||
| 2025-11-13 | 13F | Total Investment Management Inc | 0 | -100,00 | 0 | |||||
| 2026-01-20 | 13F | Steel Peak Wealth Management LLC | Call | 113 | -48,87 | |||||
| 2026-01-27 | 13F | Bayforest Capital Ltd | 40 | 3 | ||||||
| 2026-02-17 | 13F | Align Financial, LLC | 1.134 | 1 | ||||||
| 2025-10-22 | 13F | Sentry LLC | 0 | -100,00 | 0 | |||||
| 2025-11-17 | 13F/A | Proficio Capital Partners LLC | 0 | -100,00 | 0 | -100,00 | ||||
| 2026-02-11 | 13F | Franklin Resources Inc | 6.062.725 | -12,94 | 491.263 | -49,07 | ||||
| 2026-02-12 | 13F | APG Asset Management N.V. | 33.913 | -12,70 | 2.340 | -48,92 | ||||
| 2026-02-13 | 13F | Ostrum Asset Management | 3.290 | -24,92 | 267 | -56,11 | ||||
| 2025-10-27 | 13F | Kiker Wealth Management, LLC | 0 | -100,00 | 0 | -100,00 | ||||
| 2026-02-12 | 13F | Insigneo Advisory Services, Llc | 2.525 | -19,04 | 205 | -52,78 | ||||
| 2026-01-29 | 13F | Ariose Capital Management Ltd | 0 | -100,00 | 0 | -100,00 | ||||
| 2025-11-13 | 13F | Css Llc/il | Call | 0 | -100,00 | 0 | -100,00 | |||
| 2026-02-05 | 13F | Left Brain Wealth Management, LLC | 2.526 | -79,95 | 205 | -88,30 | ||||
| 2026-02-11 | 13F | Buckingham Strategic Partners | 47.667 | -25,47 | 3.862 | -47,62 | ||||
| 2025-11-13 | 13F | Bnp Paribas Arbitrage, Sa | Call | 0 | -100,00 | 0 | -100,00 | |||
| 2026-02-17 | 13F/A | North Capital, Inc. | 0 | -100,00 | 0 | -100,00 | ||||
| 2026-01-29 | 13F | Dunhill Financial, LLC | 0 | -100,00 | 0 | |||||
| 2026-02-09 | 13F | Emerald Advisers, Llc | 7.603 | 30,37 | 616 | -23,67 | ||||
| 2026-02-17 | 13F | Lazard Asset Management Llc | 43.074 | -8,98 | 3.490 | -46,76 | ||||
| 2026-02-18 | 13F | Mackenzie Financial Corp | 57.539 | -78,29 | 4.698 | -87,20 | ||||
| 2026-02-11 | 13F | Vestor Capital, Llc | 0 | -100,00 | 0 | |||||
| 2026-02-17 | 13F | Sherman Porfolios, Llc | 0 | -100,00 | 0 | |||||
| 2026-01-13 | 13F | Norden Group Llc | 3.370 | 0,03 | 273 | -41,42 | ||||
| 2026-02-17 | 13F | Point72 Asset Management, L.P. | Call | 276.600 | 22.413 | |||||
| 2026-02-09 | 13F | Genus Capital Management Inc. | 0 | -100,00 | 0 | |||||
| 2026-02-17 | 13F | Point72 Asset Management, L.P. | 251.675 | -44,48 | 20.393 | -67,52 | ||||
| 2026-02-17 | 13F | Point72 Asset Management, L.P. | Put | 208.000 | 16.854 | |||||
| 2026-01-27 | 13F | First Horizon Corp | 578 | -46,13 | 47 | -68,92 | ||||
| 2026-02-17 | 13F | Westwood Holdings Group Inc | 6.654 | -7,12 | 539 | -45,67 | ||||
| 2026-01-23 | 13F | Steigerwald, Gordon & Koch Inc. | 23 | 2 | ||||||
| 2026-02-09 | 13F | Koesten, Hirschmann & Crabtree, INC. | 0 | -100,00 | 0 | -100,00 | ||||
| 2026-01-30 | 13F | Rachor Investment Advisory Services, LLC | 88 | 7 | ||||||
| 2026-02-11 | 13F | CSM Advisors, LLC | 8.354 | 1 | ||||||
| 2026-02-17 | 13F | Broad Bay Capital Management, LP | 0 | -100,00 | 0 | |||||
| 2025-11-14 | 13F | ExodusPoint Capital Management, LP | 47.302 | 66,23 | 6.552 | 327.500,00 | ||||
| 2026-02-05 | 13F | Navalign, LLC | 30 | 2 | ||||||
| 2026-02-12 | 13F | State Board Of Administration Of Florida Retirement System | 541.805 | 1,86 | 43.902 | -40,41 | ||||
| 2026-02-13 | 13F | Great West Life Assurance Co /can/ | 277.450 | -12,85 | 22 | -51,11 | ||||
| 2026-02-13 | 13F | Missouri Trust & Investment Co | 35 | 0,00 | 3 | -50,00 | ||||
| 2026-02-10 | 13F | Dynasty Wealth Management, Llc | 11.320 | -2,20 | 917 | -42,79 | ||||
| 2026-02-13 | 13F | Gmt Capital Corp | 0 | -100,00 | 0 | |||||
| 2026-02-11 | 13F | Fox Run Management, L.l.c. | 32.935 | 1.015,31 | 2.669 | 552,32 | ||||
| 2026-02-12 | 13F | Skopos Labs, Inc. | 4.503 | 55,92 | 367 | 20,72 | ||||
| 2026-01-20 | 13F | AdvisorNet Financial, Inc | 198 | -0,50 | 16 | -40,74 | ||||
| 2026-02-17 | 13F | MGB Wealth Management, LLC | 0 | -100,00 | 0 | |||||
| 2026-02-12 | 13F | Advocate Investing Services LLC | 7 | 1 | ||||||
| 2026-01-23 | 13F | Atala Financial Inc | 51.634 | 0,60 | 4.184 | -41,16 | ||||
| 2026-02-04 | 13F | Tsfg, Llc | 125 | 0,00 | 0 | |||||
| 2026-02-17 | 13F | Nissay Asset Management Corp /japan/ /adv | 162.495 | 5,97 | 13.167 | -38,01 | ||||
| 2026-02-06 | 13F | Copia Wealth Management | 11 | 120,00 | 1 | |||||
| 2026-02-17 | 13F | Polymer Capital Management (US) LLC | 8.685 | 113,44 | 704 | 24,87 | ||||
| 2026-01-23 | 13F | Sumitomo Mitsui Trust Holdings, Inc. | 4.035.675 | -9,50 | 327.011 | -47,06 | ||||
| 2026-02-05 | 13F | Allworth Financial LP | 5.637 | 7,78 | 457 | -37,02 | ||||
| 2026-02-17 | 13F | Contour Asset Management LLC | 510.271 | 85,45 | 41.347 | 8,48 | ||||
| 2026-02-02 | 13F | CENTRAL TRUST Co | 7 | 40,00 | 1 | |||||
| 2026-02-17 | 13F | Fullerton Fund Management Co Ltd | 3.418 | -99,73 | 277 | -99,84 | ||||
| 2026-01-08 | 13F | Adirondack Trust Co | 69 | 0,00 | 6 | -44,44 | ||||
| 2026-02-06 | 13F | Gsa Capital Partners Llp | 28.186 | 143,59 | 2 | 100,00 | ||||
| 2026-02-10 | 13F | Norges Bank | 5.373.613 | 435.424 | ||||||
| 2026-02-12 | 13F | UniSuper Management Pty Ltd | 11.000 | 15,79 | 891 | -32,24 | ||||
| 2026-02-11 | 13F | Janney Montgomery Scott LLC | 37.341 | 4,31 | 3 | -25,00 | ||||
| 2026-02-17 | 13F | Greenvale Capital LLP | 0 | -100,00 | 0 | |||||
| 2026-02-11 | 13F | Allianz Asset Management GmbH | 106.076 | -62,89 | 8.595 | -78,29 | ||||
| 2026-01-07 | 13F | Yeomans Consulting Group, Inc. | 0 | -100,00 | 0 | -100,00 | ||||
| 2026-02-11 | 13F | Capital Group Private Client Services, Inc. | 71.185 | -3,14 | 5.768 | -43,34 | ||||
| 2026-01-14 | 13F | Clarius Group, LLC | 22.185 | 0,16 | 1.798 | -41,43 | ||||
| 2026-02-09 | 13F | Bleakley Financial Group, LLC | 17.230 | -21,78 | 1.396 | -54,24 | ||||
| 2026-01-30 | 13F | CBOE Vest Financial, LLC | 2.813 | 17,11 | 228 | -31,63 | ||||
| 2026-02-17 | 13F | Two Sigma Investments, Lp | Put | 0 | -100,00 | 0 | -100,00 | |||
| 2026-02-13 | 13F | USS Investment Management Ltd | 102.150 | 5,50 | 8.275 | -38,33 | ||||
| 2026-02-11 | 13F | Deutsche Bank Ag\ | 2.016.582 | 7,06 | 163.404 | -37,37 | ||||
| 2026-02-11 | 13F | Jpmorgan Chase & Co | Call | 136.300 | -64,72 | 11.044 | -79,36 | |||
| 2025-11-06 | 13F | Whipplewood Advisors, LLC | 0 | -100,00 | 0 | -100,00 | ||||
| 2026-02-11 | 13F | Jpmorgan Chase & Co | Put | 179.500 | -14,32 | 14.545 | -49,88 | |||
| 2026-01-21 | 13F | Hartford Financial Management Inc. | 166 | 0,00 | 13 | -40,91 | ||||
| 2026-02-10 | 13F | National Pension Service | 906.623 | -46,60 | 73.464 | -68,76 | ||||
| 2026-02-05 | 13F | LGT Fund Management Co Ltd. | 29.300 | 10,98 | 2.397 | -32,27 | ||||
| 2026-01-02 | 13F | Global Wealth Strategies & Associates | 40 | 0,00 | 3 | -40,00 | ||||
| 2026-02-03 | 13F | SBI Securities Co., Ltd. | 16.000 | -13,99 | 1.296 | -49,69 | ||||
| 2026-02-09 | 13F | Harbour Investments, Inc. | 2.361 | 199,24 | 191 | 75,23 | ||||
| 2026-02-11 | 13F | Jpmorgan Chase & Co | 19.522.195 | -2,01 | 1.581.884 | -42,68 | ||||
| 2026-02-12 | 13F | Xponance, Inc. | 131.305 | 4,56 | 10.640 | -38,84 | ||||
| 2025-11-14 | 13F | Delta Global Management LP | 0 | -100,00 | 0 | -100,00 | ||||
| 2026-02-12 | 13F | Front Row Advisors LLC | 5 | 0,00 | 0 | |||||
| 2026-02-13 | 13F | Colony Group, LLC | 95.851 | 5,46 | 7.824 | -37,86 | ||||
| 2026-01-21 | 13F | Daytona Street Capital LLC | 2.027 | 164 | ||||||
| 2026-01-22 | 13F | Massachusetts Financial Services Co /ma/ | 5.794.063 | 12,55 | 469.493 | -34,16 | ||||
| 2026-02-06 | 13F | Pnc Financial Services Group, Inc. | 14.166 | -0,22 | 1.148 | -41,66 | ||||
| 2026-02-11 | 13F | Symphony Financial, Ltd. Co. | 4.158 | 49,57 | 337 | -12,50 | ||||
| 2026-02-12 | 13F | Evolutionary Tree Capital Management, LLC | 33.399 | -2,41 | 2.706 | -42,91 | ||||
| 2026-02-13 | 13F | BNP Paribas Asset Management Holding S.A. | 443.240 | 36 | ||||||
| 2026-02-17 | 13F | Russell Investments Group, Ltd. | 651.930 | 15,98 | 52.835 | -32,39 | ||||
| 2026-02-13 | 13F | Silvant Capital Management LLC | 76.019 | 1,63 | 6.160 | -40,56 | ||||
| 2026-02-11 | 13F | United Financial Planning Group LLC | 28 | 2 | ||||||
| 2026-01-26 | 13F | Reyes Financial Architecture, Inc. | 312 | 164,41 | 25 | 56,25 | ||||
| 2026-01-23 | 13F | Ritholtz Wealth Management | 0 | -100,00 | 0 | -100,00 | ||||
| 2026-02-10 | 13F | FDx Advisors, Inc. | 0 | -100,00 | 0 | |||||
| 2025-11-12 | 13F | R Squared Ltd | 0 | -100,00 | 0 | -100,00 | ||||
| 2026-01-28 | 13F | SP Asset Management LLC | 8.895 | 0,00 | 721 | -41,56 | ||||
| 2026-02-17 | 13F | Advisor Group Holdings, Inc. | Put | 2 | 4 | |||||
| 2026-02-11 | 13F | GW&K Investment Management, LLC | 372 | 76,30 | 0 | |||||
| 2026-02-13 | 13F | Towarzystwo Funduszy Inwestycyjnych Pzu Sa | 660 | 22,22 | 53 | -28,38 | ||||
| 2026-01-23 | 13F | Farther Finance Advisors, LLC | 12.392 | 674,02 | 1.004 | 354,30 | ||||
| 2026-02-10 | 13F | Zweig-DiMenna Associates LLC | 33.862 | 17,17 | 2.744 | -31,48 | ||||
| 2026-02-11 | 13F | Jessup Wealth Management, Inc | 494 | 40 | ||||||
| 2026-02-10 | 13F | Consolidated Capital Management, Llc | 0 | -100,00 | 0 | -100,00 | ||||
| 2026-01-21 | 13F | FRG Family Wealth Advisors LLC | 3.220 | 2,22 | 261 | -40,37 | ||||
| 2026-01-07 | 13F | Retirement Wealth Solutions LLC | 56 | 522,22 | 5 | 300,00 | ||||
| 2025-11-12 | 13F | Total Clarity Wealth Management, Inc. | 0 | -100,00 | 0 | -100,00 | ||||
| 2026-02-13 | 13F | Victory Capital Management Inc | 524.156 | -6,08 | 42.472 | -45,06 | ||||
| 2026-01-14 | 13F | Wolff Wiese Magana Llc | 600 | 57,07 | 49 | -7,69 | ||||
| 2026-01-28 | 13F | Atwood & Palmer Inc | 70 | 0,00 | 6 | -44,44 | ||||
| 2026-02-13 | 13F | Morgan Stanley | 20.728.914 | 8,11 | 1.679.664 | -36,76 | ||||
| 2026-02-09 | 13F | Jefferies Financial Group Inc. | 0 | -100,00 | 0 | |||||
| 2026-01-29 | 13F | Comerica Bank | 17.013 | -86,46 | 1.379 | -92,09 | ||||
| 2026-02-06 | 13F/A | Rathbone Brothers plc | 3.485 | -30,72 | 282 | -59,48 | ||||
| 2026-02-09 | 13F | Poinciana Advisors Group, Llc | 4.418 | -1,36 | 358 | -42,42 | ||||
| 2026-02-10 | 13F | Envestnet Asset Management Inc | 198.039 | -3,63 | 16.047 | -43,63 | ||||
| 2026-02-13 | 13F | TRUE Private Wealth Advisors | 3.035 | 0,03 | 246 | -41,67 | ||||
| 2026-01-27 | 13F | PFG Advisors | 3.725 | 302 | ||||||
| 2026-02-11 | 13F | Inceptionr Llc | 0 | -100,00 | 0 | |||||
| 2026-02-06 | 13F | Mizuho Markets Cayman LP | 0 | -100,00 | 0 | -100,00 | ||||
| 2026-01-29 | 13F | WT Asset Management Ltd | 0 | -100,00 | 0 | |||||
| 2026-02-13 | 13F | Y-Intercept (Hong Kong) Ltd | 325.322 | 26.361 | ||||||
| 2026-01-29 | 13F | UMA Financial Services, Inc. | 54 | -66,25 | 4 | -81,82 | ||||
| 2026-02-17 | 13F | Jump Financial, LLC | 525.264 | 197,77 | 42.562 | 74,19 | ||||
| 2026-01-13 | 13F | Mather Group, Llc. | 0 | -100,00 | 0 | |||||
| 2026-02-09 | 13F | Allstate Corp | 44.408 | 118,96 | 3.598 | 28,09 | ||||
| 2026-02-12 | 13F | Investment Research Partners LLC | 0 | -100,00 | 0 | -100,00 | ||||
| 2026-02-13 | 13F | Barclays Plc | 677.066 | -54,54 | 54.863 | -16,77 |