Grundlæggende statistik
| Institutionelle aktier (lange) | 266.625.138 - 86,42% (ex 13D/G) - change of -44,52MM shares -14,31% MRQ |
| Institutionel værdi (lang) | $ 9.125.106 USD ($1000) |
Institutionelt ejerskab og aktionærer
Antero Resources Corporation (US:AR) har 619 institutionelle ejere og aktionærer, der har indsendt 13D/G- eller 13F-formularer til Securities Exchange Commission (SEC). Disse institutioner har i alt 266,625,138 aktier. Største aktionærer omfatter Vanguard Group Inc, BlackRock, Inc., Fmr Llc, Wellington Management Group Llp, State Street Corp, Sourcerock Group LLC, Dimensional Fund Advisors Lp, Geode Capital Management, Llc, Invesco Ltd., and Aqr Capital Management Llc .
Antero Resources Corporation (NYSE:AR) institutionel ejerskabsstruktur viser aktuelle positioner i virksomheden efter institutioner og fonde, samt seneste ændringer i positionsstørrelse. Større aktionærer kan omfatte individuelle investorer, investeringsforeninger, hedgefonde eller institutioner. Skema 13D angiver, at investoren besidder (eller besidder) mere end 5 % af virksomheden og har til hensigt (eller har til hensigt at) aktivt at forfølge en ændring i forretningsstrategi. Skema 13G indikerer en passiv investering på over 5%.
The share price as of April 30, 2026 is 39,26 / share. Previously, on May 2, 2025, the share price was 35,76 / share. This represents an increase of 9,79% over that period.

Fondens stemningsscore
Fund Sentiment Score (fka Ownership Accumulation Score) finder de aktier, der bliver mest købt af fonde. Det er resultatet af en sofistikeret, multi-faktor kvantitativ model, der identificerer virksomheder med de højeste niveauer af institutionel akkumulering. Scoringsmodellen bruger en kombination af den samlede stigning i oplyste ejere, ændringerne i porteføljeallokeringer i disse ejere og andre målinger. Tallet går fra 0 til 100, hvor højere tal indikerer et højere niveau af akkumulering for sine jævnaldrende, og 50 er gennemsnittet.
Opdateringsfrekvens: Dagligt
Se Ownership Explorer, som giver en liste over højest rangerende virksomheder.
AI+ Ask Fintel’s AI assistant about Antero Resources Corporation.
Select a question to share a public post with an AI-crafted answer.
Thinking of good questions…
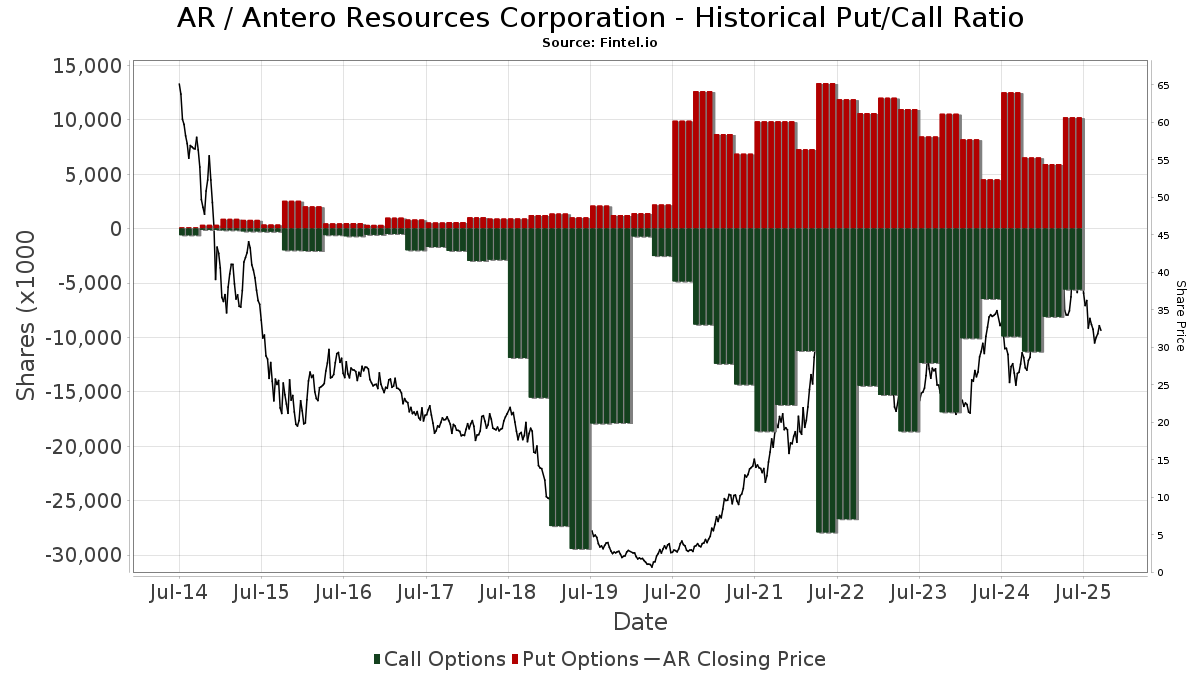
Institutionel Put/Call-forhold
Ud over at indberette standardaktie- og gældsudstedelser skal institutter med mere end 100 mill. aktiver under forvaltning også oplyse deres put- og call-optionsbeholdninger. Da salgsoptioner generelt indikerer negativ stemning, og købsoptioner indikerer positiv stemning, kan vi få en fornemmelse af den overordnede institutionelle stemning ved at plotte forholdet mellem put og kald. Diagrammet til højre viser det historiske put/call-forhold for dette instrument.
Brug af Put/Call Ratio som en indikator for investorernes stemning overvinder en af de vigtigste mangler ved at bruge totalt institutionelt ejerskab, som er, at en betydelig mængde af aktiver under forvaltning investeres passivt for at spore indekser. Passivt forvaltede fonde køber typisk ikke optioner, så indikatoren for put/call-forholdet følger mere nøje følelsen af aktivt forvaltede fonde.
13D/G-arkivering
Vi præsenterer 13D/G ansøgninger separat fra 13F ansøgninger på grund af den forskellige behandling af SEC. 13D/G-ansøgninger kan indgives af grupper af investorer (med én ledende), hvorimod 13F-ansøgninger ikke kan. Dette resulterer i situationer, hvor en investor kan indsende en 13D/G, der rapporterer én værdi for de samlede aktier (der repræsenterer alle de aktier, der ejes af investorgruppen), men derefter indsender en 13F, der rapporterer en anden værdi for de samlede aktier (der udelukkende repræsenterer deres egne) ejendomsret). Det betyder, at aktieejerskab af 13D/G-arkiver og 13F-arkiveringer ofte ikke er direkte sammenlignelige, så vi præsenterer dem separat.
Bemærk: Fra den 16. maj 2021 viser vi ikke længere ejere, der ikke har indsendt en 13D/G inden for det seneste år. Tidligere viste vi den fulde historie af 13D/G-arkiver. Generelt skal enheder, der er forpligtet til at indgive 13D/G-ansøgninger, indgive mindst årligt, før de indsender en afsluttende ansøgning. Dog forlader fonde nogle gange positioner uden at indsende en afsluttende ansøgning (dvs. de afvikler), så visning af den fulde historie resulterede nogle gange i forvirring om det nuværende ejerskab. For at undgå forvirring viser vi nu kun 'aktuelle' ejere - det vil sige - ejere, der har anmeldt inden for det seneste år.
Upgrade to unlock premium data.
| Fil dato | Form | Investor | Forrige Aktier |
Seneste Aktier |
Δ Aktier (Procent) |
Ejendomsret (Procent) |
Δ Ejerskab (Procent) |
|
|---|---|---|---|---|---|---|---|---|
| 2026-03-26 | VANGUARD GROUP INC | 27,694,160 | 0 | -100.00 | 0.00 | -100.00 | ||
| 2026-02-10 | WELLINGTON MANAGEMENT GROUP LLP | 17,459,283 | 11,309,130 | -35.23 | 3.70 | -34.05 | ||
| 2025-05-12 | FMR LLC | 30,474,198 | 25,661,882 | -15.79 | 8.20 | -16.33 |
13F og NPORT arkivering
Detaljer om 13F-arkivering er gratis. Detaljer om NP-ansøgninger kræver et premium-medlemskab. Grønne rækker angiver nye positioner. Røde rækker angiver lukkede positioner. Klik på linket ikon for at se den fulde transaktionshistorik.
Opgrader
for at låse premium-data op og eksportere til Excel ![]() .
.
| Fil dato | Kilde | Investor | Type | Gennemsnitlig pris (Øst) |
Aktier | Δ Aktier (%) |
Rapporteret Værdi ($1000) |
Δ Værdi (%) |
Port Alloc (%) |
|
|---|---|---|---|---|---|---|---|---|---|---|
| 2026-02-17 | 13F | Scientech Research LLC | 0 | -100,00 | 0 | |||||
| 2026-02-12 | 13F | IES Holdings, Inc. | 705.768 | 24.321 | ||||||
| 2026-02-12 | 13F | Brown Brothers Harriman & Co | 10 | 0,00 | 0 | |||||
| 2026-04-30 | 13F | Sumitomo Mitsui Trust Holdings, Inc. | 12.400 | 526 | ||||||
| 2026-02-13 | 13F | Verition Fund Management LLC | Put | 40.000 | -60,86 | 1.378 | -59,81 | |||
| 2026-02-13 | 13F | First Trust Advisors Lp | 785.266 | 4,34 | 27.060 | 7,14 | ||||
| 2026-02-13 | 13F | Verition Fund Management LLC | Call | 31.800 | -79,67 | 1.096 | -79,13 | |||
| 2026-02-13 | 13F | Verition Fund Management LLC | 82.702 | -67,22 | 2.850 | -66,35 | ||||
| 2026-02-11 | 13F | Simplex Trading, Llc | 0 | -100,00 | 0 | -100,00 | ||||
| 2026-02-12 | 13F | Ci Investments Inc. | 0 | -100,00 | 0 | |||||
| 2026-02-19 | 13F | CI Private Wealth, LLC | 6.491 | 224 | ||||||
| 2026-02-17 | 13F | Shay Capital LLC | 14.400 | -17,71 | 496 | -15,50 | ||||
| 2026-02-13 | 13F | De Lisle Partners LLP | 40.000 | 0,00 | 1.378 | 2,68 | ||||
| 2026-02-09 | 13F | Hartland & Co., LLC | 1.213 | -51,23 | 42 | -50,60 | ||||
| 2026-01-29 | 13F | Teachers Retirement System Of The State Of Kentucky | 84.281 | 0,00 | 3 | 0,00 | ||||
| 2026-02-17 | 13F | Ninepoint Partners LP | 2.500.000 | 11,11 | 86.150 | 14,09 | ||||
| 2026-02-17 | 13F | Capital Fund Management S.a. | Call | 19.700 | -77,28 | 679 | -76,69 | |||
| 2026-02-17 | 13F | Capital Fund Management S.a. | Put | 71.100 | -62,62 | 2.450 | -61,62 | |||
| 2026-02-17 | 13F | Ancora Advisors, LLC | 622 | 21 | ||||||
| 2026-04-24 | 13F | Profund Advisors Llc | 5.332 | -10,39 | 226 | 10,24 | ||||
| 2026-02-05 | 13F | Qsemble Capital Management, LP | 0 | -100,00 | 0 | |||||
| 2026-02-11 | 13F | LPL Financial LLC | 217.804 | -23,24 | 7.506 | -21,18 | ||||
| 2026-01-23 | 13F | Freestone Capital Holdings, LLC | 30.172 | 0,00 | 1.040 | 2,67 | ||||
| 2026-02-13 | 13F | Charles Schwab Investment Management Inc | 2.145.419 | 2,19 | 73.931 | 4,94 | ||||
| 2026-02-11 | 13F | Buckingham Strategic Partners | 25.711 | 10,44 | 886 | 12,87 | ||||
| 2026-02-14 | 13F | Rockefeller Capital Management L.P. | 8.858 | 311,23 | 305 | 323,61 | ||||
| 2026-02-11 | 13F | Fox Run Management, L.l.c. | 15.012 | 517 | ||||||
| 2026-02-17 | 13F | Sherbrooke Park Advisers Llc | 0 | -100,00 | 0 | -100,00 | ||||
| 2026-04-15 | 13F | Gf Fund Management Co. Ltd. | 98.502 | 13,83 | 4.180 | 40,22 | ||||
| 2026-02-17 | 13F | Altshuler Shaham Ltd | 10.589 | 7,85 | 365 | 10,64 | ||||
| 2026-04-13 | 13F | Chickasaw Capital Management Llc | 9.500 | 0,00 | 0 | |||||
| 2026-02-17 | 13F | Fearnley Asset Management As | 196.548 | 24.511 | ||||||
| 2026-02-11 | 13F | Ameritas Investment Partners, Inc. | 53.710 | 1.851 | ||||||
| 2026-02-17 | 13F | State Of Wisconsin Investment Board | 357.660 | -0,85 | 12.325 | 1,80 | ||||
| 2026-02-13 | 13F | Pathstone Holdings, LLC | 50.851 | -12,86 | 1.752 | -10,52 | ||||
| 2026-02-05 | 13F | Elyxium Wealth, LLC | 82 | 3 | ||||||
| 2026-02-17 | 13F | Sciencast Management LP | 0 | -100,00 | 0 | |||||
| 2026-02-17 | 13F | Delta Global Management LP | 66.450 | -13,98 | 2.290 | -11,69 | ||||
| 2026-04-16 | 13F | Beese Fulmer Investment Management, Inc. | 5.659 | 240 | ||||||
| 2026-04-30 | 13F | Private Trust Co Na | 11 | 0,00 | 0 | |||||
| 2026-02-13 | 13F | American Century Companies Inc | 176.042 | 14,99 | 6.066 | 18,08 | ||||
| 2026-02-17 | 13F | Two Sigma Advisers, Lp | 50.800 | -62,15 | 1.751 | -61,14 | ||||
| 2026-02-06 | 13F | Vestmark Advisory Solutions, Inc. | 22.308 | 769 | ||||||
| 2026-02-11 | 13F | Zions Bancorporation, National Association /ut/ | 44 | 2 | ||||||
| 2026-04-30 | 13F | Kestra Advisory Services, LLC | 24.707 | -0,67 | 1.049 | 22,29 | ||||
| 2026-01-29 | 13F | Sanctuary Advisors, LLC | 7.024 | -21,58 | 242 | -19,33 | ||||
| 2026-02-13 | 13F | Healthcare Of Ontario Pension Plan Trust Fund | 199.774 | 6.884 | ||||||
| 2026-02-17 | 13F | Schonfeld Strategic Advisors LLC | Call | 100.000 | 3.446 | |||||
| 2026-02-12 | 13F | Cibc World Markets Corp | Put | 70.000 | 2.412 | |||||
| 2026-02-17 | 13F | Schonfeld Strategic Advisors LLC | Put | 100.000 | 3.446 | |||||
| 2026-02-17 | 13F | Jones Financial Companies Lllp | 1.490 | 245,71 | 51 | 264,29 | ||||
| 2026-02-13 | 13F | Bridgefront Capital, LLC | 44.030 | 36,02 | 1.517 | 39,69 | ||||
| 2026-02-17 | 13F | Schonfeld Strategic Advisors LLC | 35.543 | -41,81 | 1.225 | -40,26 | ||||
| 2025-11-14 | 13F | Discovery Capital Management, Llc / Ct | 0 | -100,00 | 0 | |||||
| 2026-02-12 | 13F | Mcintyre Freedman & Flynn Investment Advisers Inc | 38.300 | 0,00 | 1.320 | 2,65 | ||||
| 2026-02-10 | 13F | Clear Harbor Asset Management, LLC | 59.110 | 2,71 | 2.037 | 5,44 | ||||
| 2026-02-12 | 13F | Cibc World Markets Corp | Call | 375.000 | 12.922 | |||||
| 2025-11-14 | 13F | Manchester Capital Management LLC | 0 | -100,00 | 0 | |||||
| 2026-02-17 | 13F | Freestone Grove Partners LP | 1.892.006 | 210,13 | 65.199 | 218,46 | ||||
| 2026-02-13 | 13F | Aigen Investment Management, Lp | 0 | -100,00 | 0 | |||||
| 2026-04-07 | 13F | CoreCap Advisors, LLC | 4.701 | 6,82 | 200 | 31,79 | ||||
| 2026-03-20 | 13F | Purpose Unlimited Inc. | 18.718 | 645 | ||||||
| 2026-02-10 | 13F | Bruce G. Allen Investments, LLC | 8 | 0,00 | 0 | |||||
| 2026-02-05 | 13F | Atria Investments Llc | 7.996 | -4,79 | 276 | -2,14 | ||||
| 2026-04-23 | 13F | Oppenheimer Asset Management Inc. | 24.111 | 16,47 | 1.023 | 43,48 | ||||
| 2026-02-17 | 13F | California State Teachers Retirement System | 277.901 | -0,11 | 9.576 | 2,57 | ||||
| 2026-02-11 | 13F | Fore Capital, LLC | 65.000 | 2.240 | ||||||
| 2026-02-17 | 13F | Janus Henderson Group Plc | 129.867 | 0,06 | 4.475 | 2,71 | ||||
| 2026-02-11 | 13F | Jpmorgan Chase & Co | 901.233 | 26,60 | 31.057 | 30,00 | ||||
| 2026-03-04 | 13F | SHP Wealth Management | 6 | 0 | ||||||
| 2026-02-11 | 13F | Jpmorgan Chase & Co | Call | 900 | -91,51 | 31 | -91,27 | |||
| 2026-04-20 | 13F | Friedenthal Financial | 22.310 | 947 | ||||||
| 2026-04-27 | 13F | Sound Income Strategies, LLC | 1.824 | 0,00 | 75 | 25,42 | ||||
| 2026-02-12 | 13F | Principal Securities, Inc. | 0 | -100,00 | 0 | |||||
| 2026-02-12 | 13F | Jane Street Group, Llc | 0 | -100,00 | 0 | -100,00 | ||||
| 2026-02-13 | 13F | Wexford Capital Lp | 8.568 | -94,90 | 295 | -94,77 | ||||
| 2026-02-12 | 13F | Xponance, Inc. | 26.606 | -17,44 | 917 | -15,26 | ||||
| 2026-02-10 | 13F | Commonwealth Of Pennsylvania Public School Empls Retrmt Sys | 73.338 | -2,63 | 2.527 | 0,00 | ||||
| 2026-02-17 | 13F | Point72 Asset Management, L.P. | Put | 193.900 | 23,42 | 6.682 | 26,73 | |||
| 2026-02-17 | 13F | Point72 Asset Management, L.P. | Call | 43.900 | -46,46 | 1.513 | -45,04 | |||
| 2026-02-17 | 13F | Orbis Allan Gray Ltd | 744.108 | 25.642 | ||||||
| 2026-02-10 | 13F | Axq Capital, Lp | 0 | -100,00 | 0 | |||||
| 2026-02-17 | 13F | Twinbeech Capital Lp | 0 | -100,00 | 0 | |||||
| 2026-02-09 | 13F | William Blair Investment Management, Llc | 626.420 | 24,96 | 21.586 | 28,31 | ||||
| 2026-02-06 | 13F | Payden & Rygel | 3.910 | 0,00 | 0 | |||||
| 2026-02-17 | 13F | Point72 Asset Management, L.P. | 405.239 | 726,56 | 13.965 | 748,88 | ||||
| 2026-02-13 | 13F | Maven Securities LTD | Call | 0 | -100,00 | 0 | -100,00 | |||
| 2026-02-17 | 13F | Shelton Capital Management | 10.261 | 0,00 | 354 | 2,62 | ||||
| 2026-02-17 | 13F | Susquehanna International Group, Llp | Call | 2.007.900 | 252,26 | 69.192 | 261,71 | |||
| 2026-01-30 | 13F | State of New Jersey Common Pension Fund D | 99.450 | 0,00 | 3.427 | 2,70 | ||||
| 2026-04-20 | 13F | Assenagon Asset Management S.A. | 3.611.248 | 177,39 | 153.261 | 241,63 | ||||
| 2026-04-24 | 13F | Deltec Asset Management Llc | 0 | -100,00 | 0 | |||||
| 2026-04-16 | 13F | SG Americas Securities, LLC | 429.514 | 196,98 | 18 | 350,00 | ||||
| 2026-04-21 | 13F | Nemes Rush Group LLC | 0 | -100,00 | 0 | |||||
| 2026-02-05 | 13F | Northwestern Mutual Investment Management Company, Llc | 65.571 | 0,24 | 2.260 | 2,92 | ||||
| 2025-11-10 | 13F | Cowa, Llc | 0 | -100,00 | 0 | -100,00 | ||||
| 2025-11-14 | 13F | Wolverine Trading, Llc | 46.737 | 1.568 | ||||||
| 2025-11-14 | 13F | Wolverine Trading, Llc | Call | 245.600 | 30,22 | 8.240 | 6,09 | |||
| 2025-11-14 | 13F | Wolverine Trading, Llc | Put | 174.300 | -65,70 | 5.848 | -72,05 | |||
| 2026-02-13 | 13F | Integrated Wealth Concepts LLC | 11.729 | -40,20 | 404 | -38,60 | ||||
| 2025-11-14 | 13F | Credit Agricole S A | 0 | -100,00 | 0 | |||||
| 2026-04-29 | 13F | Oregon Public Employees Retirement Fund | 60.153 | 3,35 | 2.553 | 27,28 | ||||
| 2026-02-10 | 13F | Envestnet Asset Management Inc | 160.944 | -10,66 | 5.546 | -8,27 | ||||
| 2026-02-13 | 13F | Bridgewater Associates, LP | 289.749 | -66,58 | 9.985 | -65,69 | ||||
| 2026-04-28 | 13F | PCG Wealth Advisors, LLC | 0 | -100,00 | 0 | |||||
| 2026-04-20 | 13F | Chronos Wealth Management, LLC | 116.900 | 22,18 | 4.961 | 50,52 | ||||
| 2026-04-29 | 13F | Klp Kapitalforvaltning As | 89.500 | -16,98 | 3.798 | 2,26 | ||||
| 2026-02-17 | 13F | Susquehanna International Group, Llp | 141.169 | -70,63 | 4.865 | -69,85 | ||||
| 2026-02-17 | 13F | Susquehanna International Group, Llp | Put | 1.150.400 | -21,92 | 39.643 | -19,82 | |||
| 2026-02-17 | 13F | Sagewood Asset Management LP | 74.559 | 2.569 | ||||||
| 2026-04-10 | 13F | Armstrong Advisory Group, Inc | 200 | 0,00 | 8 | 33,33 | ||||
| 2026-02-06 | 13F | Twin Capital Management Inc | 29.758 | -0,01 | 1.025 | 2,71 | ||||
| 2026-04-07 | 13F | Retirement Wealth Solutions LLC | 33 | 17,86 | 1 | |||||
| 2026-04-21 | 13F | Montgomery Investment Management Inc | 5.900 | 0,00 | 250 | 23,15 | ||||
| 2026-02-13 | 13F | Rafferty Asset Management, LLC | 126.778 | -8,09 | 4.369 | -5,62 | ||||
| 2025-11-14 | 13F | Trexquant Investment LP | 0 | -100,00 | 0 | |||||
| 2026-04-15 | 13F | Hatch Cove Capital, Llc | 0 | -100,00 | 0 | |||||
| 2026-02-17 | 13F | Hood River Capital Management LLC | 394.760 | -1,39 | 13.603 | 1,26 | ||||
| 2026-02-11 | 13F | CenterBook Partners LP | 119.487 | 4.118 | ||||||
| 2026-04-29 | 13F | CVA Family Office, LLC | 391 | 17 | ||||||
| 2026-04-29 | 13F | R Squared Ltd | 6.698 | 284 | ||||||
| 2025-11-12 | 13F | Elo Mutual Pension Insurance Co | 0 | -100,00 | 0 | |||||
| 2026-02-10 | 13F | Connor, Clark & Lunn Investment Management Ltd. | 497.489 | 852,75 | 17.143 | 878,48 | ||||
| 2026-01-30 | 13F | Wealth High Governance Capital Ltda | 0 | -100,00 | 0 | -100,00 | ||||
| 2026-02-13 | 13F | Brown Advisory Inc | 36.290 | 9,72 | 1.251 | 12,61 | ||||
| 2026-02-12 | 13F | Campbell & CO Investment Adviser LLC | 0 | -100,00 | 0 | |||||
| 2026-01-30 | 13F | Citizens Financial Group Inc/ri | 10.260 | 10,18 | 354 | 13,14 | ||||
| 2026-01-29 | 13F | Vanguard Group Inc | 28.630.790 | -2,94 | 986.617 | -0,34 | ||||
| 2026-02-03 | 13F/A | Bank Of America Corp /de/ | Call | 0 | -100,00 | 0 | -100,00 | |||
| 2026-02-06 | 13F | Global Retirement Partners, LLC | 5.140 | 10,02 | 177 | 13,46 | ||||
| 2026-04-27 | 13F | Y-Intercept (Hong Kong) Ltd | 101.633 | 4.313 | ||||||
| 2026-04-21 | 13F | Red Tortoise LLC | 233 | 0,00 | 10 | 12,50 | ||||
| 2026-04-15 | 13F | Journey Strategic Wealth Llc | 9.428 | 12,35 | 400 | 38,41 | ||||
| 2025-11-10 | 13F | Raiffeisen Bank International AG | 0 | -100,00 | 0 | -100,00 | ||||
| 2026-02-13 | 13F | Vontobel Holding Ltd. | 0 | -100,00 | 0 | |||||
| 2026-02-17 | 13F | Engineers Gate Manager LP | 54.920 | -64,37 | 1.893 | -63,43 | ||||
| 2026-04-06 | 13F | Highline Wealth Partners Llc | 9 | 0,00 | 0 | |||||
| 2026-02-02 | 13F | Cornerstone Planning Group LLC | 40 | -4,76 | 1 | 0,00 | ||||
| 2026-02-17 | 13F | Farringdon Capital, Ltd. | 0 | -100,00 | 0 | |||||
| 2026-02-06 | 13F | HighTower Advisors, LLC | Put | 0 | -100,00 | 0 | -100,00 | |||
| 2026-04-08 | 13F | JBR Co Financial Management Inc | 6.735 | 0,00 | 232 | 0,00 | ||||
| 2025-11-10 | 13F | Kovitz Investment Group Partners, LLC | 0 | -100,00 | 0 | |||||
| 2026-02-13 | 13F | Macquarie Group Ltd | 0 | -100,00 | 0 | |||||
| 2026-04-08 | 13F | Arlington Trust Co LLC | 303 | 13 | ||||||
| 2026-02-10 | 13F | Hillsdale Investment Management Inc. | 20.850 | -22,35 | 718 | -20,31 | ||||
| 2026-02-13 | 13F | Rhumbline Advisers | 750.291 | -2,69 | 25.855 | -0,08 | ||||
| 2026-02-13 | 13F | Centiva Capital, LP | Call | 400.000 | 13.784 | |||||
| 2025-11-13 | 13F | Twin Tree Management, LP | 0 | -100,00 | 0 | -100,00 | ||||
| 2026-02-17 | 13F | Pennant Investors, Lp | 530.000 | -19,85 | 18.264 | -17,70 | ||||
| 2026-04-22 | 13F | Skylands Capital, LLC | 8.300 | 352 | ||||||
| 2026-04-30 | 13F | Hsbc Holdings Plc | 6.521 | 278 | ||||||
| 2026-02-09 | 13F | Hantz Financial Services, Inc. | 170.073 | 29,69 | 6 | 25,00 | ||||
| 2026-02-10 | 13F | Natixis Advisors, L.p. | 403.803 | -0,98 | 14 | 0,00 | ||||
| 2026-02-11 | 13F | Inceptionr Llc | 11.037 | 380 | ||||||
| 2026-01-23 | 13F | Rsm Us Wealth Management Llc | 9.448 | 28,95 | 332 | 35,10 | ||||
| 2026-02-17 | 13F | Limestone Investment Advisors LP | Call | 5.200 | 92,59 | 179 | 98,89 | |||
| 2026-02-17 | 13F | Limestone Investment Advisors LP | Put | 1.300 | -89,60 | 45 | -89,50 | |||
| 2026-02-13 | 13F | Kayne Anderson Rudnick Investment Management Llc | 10 | 0,00 | 0 | |||||
| 2026-02-13 | 13F | Natixis | 0 | -100,00 | 0 | |||||
| 2026-04-24 | 13F | Raiffeisen Bank International AG | Call | 143.932 | 0,00 | 2 | 0,00 | |||
| 2026-02-13 | 13F | Ripple Effect Asset Management LP | Call | 250.000 | 11,11 | 8.615 | 14,09 | |||
| 2025-11-13 | 13F | Panagora Asset Management Inc | 0 | -100,00 | 0 | |||||
| 2026-04-24 | 13F | Vision Financial Markets Llc | 365 | -6,41 | 15 | 15,38 | ||||
| 2026-04-28 | 13F | Sage Rhino Capital Llc | 5.994 | 254 | ||||||
| 2025-11-14 | 13F | Slate Path Capital LP | 0 | -100,00 | 0 | |||||
| 2026-04-06 | 13F | GAMMA Investing LLC | 8.075 | 40,41 | 343 | 72,73 | ||||
| 2026-02-10 | 13F/A | Northwestern Mutual Wealth Management Co | 4.313 | -3,49 | 149 | -0,67 | ||||
| 2026-01-29 | 13F | Rakuten Securities, Inc. | 981 | 5,48 | 34 | 6,45 | ||||
| 2026-04-10 | 13F | Perigon Wealth Management, LLC | 0 | -100,00 | 0 | |||||
| 2026-04-17 | 13F | Paragon Capital Management Inc | 39.099 | 1.659 | ||||||
| 2026-02-17 | 13F | Utah Retirement Systems | 47.714 | 0,00 | 1.644 | 2,69 | ||||
| 2026-04-30 | 13F | Cromwell Holdings LLC | 50 | 47,06 | 2 | 100,00 | ||||
| 2026-04-15 | 13F | Spirit Of America Management Corp/ny | 3.000 | -80,65 | 127 | -76,22 | ||||
| 2026-02-11 | 13F | Erste Asset Management GmbH | 78 | 269 | ||||||
| 2026-04-30 | 13F | Teacher Retirement System Of Texas | 27.804 | -54,47 | 1.180 | -43,92 | ||||
| 2026-03-12 | 13F/A | Peak6 Llc | Call | 95.900 | 6,67 | 3.305 | 9,51 | |||
| 2026-02-17 | 13F | Old West Investment Management, LLC | 203.985 | 7.029 | ||||||
| 2026-03-12 | 13F/A | Peak6 Llc | 848 | -98,18 | 29 | -98,15 | ||||
| 2026-03-12 | 13F/A | Peak6 Llc | Put | 8.900 | 2.866,67 | 307 | 2.960,00 | |||
| 2025-11-14 | 13F | Point72 Hong Kong Ltd | 0 | -100,00 | 0 | |||||
| 2026-04-20 | 13F | Louisiana State Employees Retirement System | 85.000 | 4,81 | 3.607 | 29,10 | ||||
| 2026-02-09 | 13F | Atlantic Trust, LLC | 58 | 0,00 | 2 | 0,00 | ||||
| 2026-04-17 | 13F | Brown, Lisle/cummings, Inc. | 81 | 145,45 | 3 | 200,00 | ||||
| 2026-02-17 | 13F | SageView Advisory Group, LLC | 781 | 27 | ||||||
| 2026-02-13 | 13F | Walleye Capital LLC | 44.526 | -15,87 | 1.534 | -13,63 | ||||
| 2026-04-27 | 13F | Td Private Client Wealth Llc | 11 | 0,00 | 0 | |||||
| 2026-04-29 | 13F | Staley Capital Advisers Inc | 54.000 | -2,70 | 2.292 | 19,82 | ||||
| 2026-01-28 | 13F | Arizona State Retirement System | 82.401 | -5,61 | 2.840 | -3,07 | ||||
| 2026-02-17 | 13F | Mirabella Financial Services Llp | 26.373 | 909 | ||||||
| 2026-04-21 | 13F | Founders Capital Management | 2.800 | 0,00 | 119 | 22,92 | ||||
| 2026-04-24 | 13F | ProShare Advisors LLC | 11.758 | 0,04 | 499 | 23,21 | ||||
| 2026-02-13 | 13F | Walleye Capital LLC | Call | 155.400 | 177,01 | 5.355 | 184,54 | |||
| 2026-02-17 | 13F | Fmr Llc | 23.656.404 | -5,80 | 815.200 | -3,27 | ||||
| 2026-02-13 | 13F | Walleye Capital LLC | Put | 119.900 | 4.340,74 | 4.132 | 4.490,00 | |||
| 2026-04-27 | 13F | Evolution Wealth Management Inc. | 350 | 0,00 | 15 | 16,67 | ||||
| 2026-02-06 | 13F | Pnc Financial Services Group, Inc. | 31.801 | 19,65 | 1.096 | 22,90 | ||||
| 2026-04-30 | 13F | Valued Wealth Advisors LLC | 16 | -5,88 | 1 | |||||
| 2026-02-02 | 13F | Principal Financial Group Inc | 630.111 | -3,31 | 21.714 | -0,72 | ||||
| 2026-02-12 | 13F | Jasper Ridge Partners, L.P. | 8.932 | 0,00 | 308 | 2,68 | ||||
| 2026-04-28 | 13F | Winthrop Capital Management, LLC | 54 | 0,00 | 0 | |||||
| 2026-02-17 | 13F | Algert Global Llc | 415.025 | -23,03 | 14 | -22,22 | ||||
| 2026-01-28 | 13F | DekaBank Deutsche Girozentrale | 4.523 | 0,00 | 0 | |||||
| 2025-11-12 | 13F | 111 Capital | 0 | -100,00 | 0 | -100,00 | ||||
| 2026-02-02 | 13F | Summit Place Financial Advisors, LLC | 24.400 | 841 | ||||||
| 2026-01-29 | 13F | Simon Quick Advisors, Llc | 12.198 | 420 | ||||||
| 2026-02-13 | 13F | Alyeska Investment Group, L.P. | 1.484.286 | -49,41 | 51.148 | -48,05 | ||||
| 2026-02-06 | 13F | Diamond Hill Capital Management Inc | 659.986 | 10,81 | 22.743 | 13,78 | ||||
| 2026-02-17 | 13F | Russell Investments Group, Ltd. | 216.114 | -51,99 | 7.448 | -50,70 | ||||
| 2026-04-07 | 13F | Farther Finance Advisors, LLC | 38.109 | -10,18 | 1.557 | 6,50 | ||||
| 2025-11-14 | 13F | Jain Global LLC | 0 | -100,00 | 0 | |||||
| 2026-04-10 | 13F | Oak Thistle LLC | 51.183 | 51,88 | 2.172 | 87,08 | ||||
| 2026-04-21 | 13F | Pallas Capital Advisors LLC | 8.998 | -4,77 | 382 | 17,23 | ||||
| 2026-02-12 | 13F | New York State Common Retirement Fund | 142.806 | -7,53 | 4.921 | -5,05 | ||||
| 2026-01-28 | 13F | Salomon & Ludwin, LLC | 13 | 0,00 | 0 | |||||
| 2026-02-12 | 13F | Cibc World Markets Corp | 82.763 | 2.852 | ||||||
| 2026-02-17 | 13F | PenderFund Capital Management Ltd. | 800 | 0,00 | 28 | 3,85 | ||||
| 2026-02-17 | 13F | Css Llc/il | 17.966 | -70,76 | 619 | -69,97 | ||||
| 2026-02-17 | 13F | Royal Bank Of Canada | 145.937 | -83,91 | 5.030 | -83,48 | ||||
| 2025-11-12 | 13F | Sprott Inc. | 0 | -100,00 | 0 | -100,00 | ||||
| 2026-04-20 | 13F | Miller Howard Investments Inc /ny | 155.374 | 4,00 | 6.594 | 28,09 | ||||
| 2026-02-13 | 13F | Umb Bank N A/mo | 3.027 | 16,96 | 104 | 20,93 | ||||
| 2026-02-17 | 13F | Pickering Energy Partners Lp | 13.000 | -10,34 | 448 | -8,02 | ||||
| 2026-02-17 | 13F | Polymer Capital Management (US) LLC | 45.680 | -16,12 | 1.574 | -13,85 | ||||
| 2026-01-27 | 13F | Evergreen Capital Management Llc | 17.144 | 16,30 | 591 | 19,43 | ||||
| 2026-02-10 | 13F | CIBC World Markets Inc. | 33.500 | 1.154 | ||||||
| 2026-02-13 | 13F | Pin Oak Investment Advisors Inc | 11.675 | -56,68 | 0 | -100,00 | ||||
| 2026-02-17 | 13F | Prelude Capital Management, Llc | 37.375 | 1.288 | ||||||
| 2026-02-13 | 13F | Goehring & Rozencwajg Associates, LLC | 1.183.620 | 43,65 | 40.788 | 47,51 | ||||
| 2025-11-13 | 13F | Bnp Paribas Arbitrage, Sa | Put | 0 | -100,00 | 0 | -100,00 | |||
| 2026-02-13 | 13F | Ubs Asset Management Americas Inc | 585.404 | 5,48 | 20.173 | 8,31 | ||||
| 2026-02-13 | 13F | Solstein Capital, LLC | 183 | 0,00 | 6 | 0,00 | ||||
| 2026-02-12 | 13F | JPL Wealth Management, LLC | 0 | -100,00 | 0 | |||||
| 2026-02-11 | 13F | Gordian Capital Singapore Pte Ltd | 34.000 | 0,00 | 1.172 | 2,63 | ||||
| 2026-02-13 | 13F | Gts Securities Llc | 6.816 | -47,15 | 235 | -45,83 | ||||
| 2026-01-27 | 13F | Journey Advisory Group, LLC | 25.975 | 3,90 | 895 | 6,67 | ||||
| 2026-02-05 | 13F | North Dakota State Investment Board | 10.247 | 353 | ||||||
| 2026-04-27 | 13F | GenTrust, LLC | 5.314 | 226 | ||||||
| 2025-11-14 | 13F | Centiva Capital, LP | 0 | -100,00 | 0 | -100,00 | ||||
| 2026-04-30 | 13F | Cambridge Investment Research Advisors, Inc. | 8.758 | 15,02 | 0 | |||||
| 2026-02-11 | 13F | Winnow Wealth Llc | 7 | 0,00 | 0 | |||||
| 2026-02-17 | 13F | Symmetry Investments LP | 81.739 | 2.817 | ||||||
| 2026-02-09 | 13F | Jefferies Financial Group Inc. | 443.368 | -73,90 | 15.278 | -73,20 | ||||
| 2026-04-23 | 13F | North Star Investment Management Corp. | 1.100 | 0,00 | 47 | 24,32 | ||||
| 2026-02-03 | 13F | Ballentine Partners, LLC | 5.843 | -6,20 | 201 | -3,83 | ||||
| 2026-02-12 | 13F | RR Advisors, LLC | 424.454 | 20,24 | 14.627 | 132.863,64 | ||||
| 2026-01-29 | 13F | IMC-Chicago, LLC | 48.489 | -67,70 | 1.671 | -66,85 | ||||
| 2025-11-12 | 13F | Headlands Technologies LLC | 0 | -100,00 | 0 | |||||
| 2026-01-29 | 13F | IMC-Chicago, LLC | Put | 775.000 | -65,25 | 26.706 | -64,32 | |||
| 2026-01-29 | 13F | IMC-Chicago, LLC | Call | 602.400 | 71,48 | 20.759 | 76,08 | |||
| 2026-02-13 | 13F | Bank Of Nova Scotia | 279.072 | 9.617 | ||||||
| 2025-11-25 | 13F | Briaud Financial Planning, Inc | 0 | -100,00 | 0 | |||||
| 2026-04-28 | 13F | Kingswood Wealth Advisors, Llc | 28.817 | 1.223 | ||||||
| 2026-04-30 | 13F | Whipplewood Advisors, LLC | 117 | 5 | ||||||
| 2026-02-17 | 13F | TCG Advisory Services, LLC | 0 | -100,00 | 0 | |||||
| 2026-04-27 | 13F | Pensionmark Financial Group, Llc | 11.234 | 75,50 | 477 | 116,36 | ||||
| 2026-04-15 | 13F | Bayforest Capital Ltd | 213 | 9 | ||||||
| 2026-02-04 | 13F | Securian Asset Management, Inc | 21.358 | -2,83 | 736 | -0,27 | ||||
| 2026-02-10 | 13F | CIBC Asset Management Inc | 9.461 | 0,00 | 326 | 2,84 | ||||
| 2026-04-22 | 13F | Spire Wealth Management | 227 | 10 | ||||||
| 2026-02-11 | 13F | Deutsche Bank Ag\ | 294.687 | -61,73 | 10.155 | -60,71 | ||||
| 2026-02-25 | 13F | Mariner Investment Group Llc | 38.500 | 1.327 | ||||||
| 2026-02-13 | 13F | Formula Growth Ltd | 41.000 | 1.413 | ||||||
| 2026-02-10 | 13F | Bnp Paribas Arbitrage, Sa | 54.972 | -29,17 | 1.894 | -27,27 | ||||
| 2026-04-20 | 13F | Kfg Wealth Management, Llc | 7.062 | 0,48 | 300 | 23,55 | ||||
| 2026-02-10 | 13F | KERR FINANCIAL PLANNING Corp | 0 | -100,00 | 0 | |||||
| 2026-02-17 | 13F | Caption Management, LLC | Put | 475.000 | 16.368 | |||||
| 2026-02-17 | 13F | Caption Management, LLC | Call | 15.000 | 0,00 | 517 | 2,58 | |||
| 2026-01-22 | 13F | Massachusetts Financial Services Co /ma/ | 3.988.300 | 111,18 | 137.437 | 116,85 | ||||
| 2026-02-17 | 13F | Caption Management, LLC | 29.446 | 2.576,91 | 1.015 | 2.716,67 | ||||
| 2026-02-13 | 13F | Walleye Trading LLC | Call | 326.600 | 268,62 | 11.255 | 278,54 | |||
| 2026-02-09 | 13F | Arista Wealth Management, LLC | 0 | -100,00 | 0 | |||||
| 2026-02-13 | 13F | Walleye Trading LLC | 4.904 | -83,63 | 169 | -83,28 | ||||
| 2026-04-13 | 13F | Loring Wolcott & Coolidge Fiduciary Advisors Llp/ma | 10.000 | 0,00 | 379 | 10,20 | ||||
| 2026-02-17 | 13F | Plustick Management Llc | 320.000 | -31,91 | 11.027 | -30,09 | ||||
| 2025-11-13 | 13F | Wakefield Asset Management LLLP | 0 | -100,00 | 0 | -100,00 | ||||
| 2026-04-30 | 13F | Millstone Evans Group, LLC | 414 | 213,64 | 18 | 325,00 | ||||
| 2026-02-17 | 13F | Hancock Prospecting Pty Ltd | 427.643 | 0,00 | 14.737 | 2,68 | ||||
| 2026-04-28 | 13F | Golden State Equity Partners | 4.973 | 211 | ||||||
| 2026-02-13 | 13F | Walleye Trading LLC | Put | 263.800 | 254,09 | 9.091 | 263,60 | |||
| 2026-02-23 | 13F | Beaird Harris Wealth Management, LLC | 10 | 0,00 | 0 | |||||
| 2026-02-11 | 13F | Franklin Resources Inc | 1.220.274 | 36,51 | 42.051 | 40,18 | ||||
| 2025-11-12 | 13F | Sierra Summit Advisors Llc | 0 | -100,00 | 0 | |||||
| 2026-02-05 | 13F | HighMark Wealth Management LLC | 250 | 0,00 | 9 | 0,00 | ||||
| 2026-02-12 | 13F | Hrt Financial Lp | 23.100 | -88,30 | 1 | -100,00 | ||||
| 2026-02-04 | 13F | Fourth Dimension Wealth, LLC | 75 | 0,00 | 3 | 0,00 | ||||
| 2026-01-30 | 13F/A | M&t Bank Corp | 26.228 | 35,69 | 903 | 39,14 | ||||
| 2026-01-26 | 13F | KBC Group NV | 8.657 | 0,00 | 0 | |||||
| 2026-02-17 | 13F | Driehaus Capital Management Llc | 583.249 | 50,91 | 20.099 | 54,96 | ||||
| 2025-11-20 | 13F | Maven Securities LTD | 0 | -100,00 | 0 | -100,00 | ||||
| 2026-02-12 | 13F | Senvest Management, LLC | 446.871 | 793,74 | 15.399 | 817,70 | ||||
| 2026-02-17 | 13F | BTG Pactual Asset Management US LLC | 0 | -100,00 | 0 | |||||
| 2025-11-13 | 13F | Renaissance Technologies Llc | 0 | -100,00 | 0 | -100,00 | ||||
| 2026-02-24 | 13F/A | Pacer Advisors, Inc. | 35.051 | -10,13 | 1.208 | -7,72 | ||||
| 2026-02-02 | 13F | Sachetta, LLC | 84 | 0,00 | 3 | 0,00 | ||||
| 2026-02-17 | 13F | Canada Pension Plan Investment Board | 2.238.532 | 5,49 | 77.140 | 8,32 | ||||
| 2026-02-17 | 13F | Weiss Asset Management LP | 0 | -100,00 | 0 | -100,00 | ||||
| 2026-02-09 | 13F | Harbour Investments, Inc. | 2.101 | -22,07 | 72 | -20,00 | ||||
| 2026-02-11 | 13F | Deseret Mutual Benefit Administrators | 606 | 161,21 | 21 | 185,71 | ||||
| 2026-02-13 | 13F | DeepCurrents Investment Group LLC | Call | 4.762 | 16.410 | |||||
| 2026-02-11 | 13F | GW&K Investment Management, LLC | 1.013.645 | -2,01 | 35 | 0,00 | ||||
| 2026-04-23 | 13F | SJS Investment Consulting Inc. | 467 | 3,55 | 20 | 26,67 | ||||
| 2026-02-11 | 13F | Simplex Trading, Llc | Put | 91.700 | -44,09 | 3.160 | 63.080,00 | |||
| 2026-02-09 | 13F | Huntington National Bank | 267 | -10,70 | 9 | -10,00 | ||||
| 2026-02-11 | 13F | Simplex Trading, Llc | Call | 458.800 | 230,55 | 15.810 | 395.150,00 | |||
| 2026-04-23 | 13F | waypoint wealth counsel | 0 | -100,00 | 0 | |||||
| 2026-02-11 | 13F | Heartland Advisors Inc | 0 | -100,00 | 0 | |||||
| 2026-01-29 | 13F | Marathon Capital Management | 30.000 | 0,00 | 1.034 | 2,68 | ||||
| 2026-02-10 | 13F | Bearing Point Capital, Llc | 143.451 | 640,97 | 4.943 | 661,63 | ||||
| 2026-02-18 | 13F/A | Empowered Funds, LLC | 172.478 | 97,84 | 5.944 | 103,18 | ||||
| 2026-02-12 | 13F | Brinker Capital Investments, LLC | 40.118 | -5,71 | 1.382 | -3,15 | ||||
| 2025-11-20 | 13F | Maven Securities LTD | Put | 0 | -100,00 | 0 | -100,00 | |||
| 2026-04-30 | 13F | Torren Management, LLC | 0 | -100,00 | 0 | |||||
| 2025-11-13 | 13F | Twin Tree Management, LP | Put | 0 | -100,00 | 0 | -100,00 | |||
| 2026-02-13 | 13F | Quarry LP | 6.689 | 102,51 | 231 | 109,09 | ||||
| 2026-02-17 | 13F | Public Employees Retirement System Of Ohio | 210.914 | 3,57 | 7.268 | 6,35 | ||||
| 2025-11-14 | 13F | WealthTrak Capital Management LLC | 0 | -100,00 | 0 | |||||
| 2026-02-13 | 13F | Kore Advisors LP | 228.907 | 9,57 | 7.888 | 12,52 | ||||
| 2026-02-13 | 13F | Citigroup Inc | 171.258 | 0,86 | 5.902 | 3,56 | ||||
| 2026-02-13 | 13F | Sourcerock Group LLC | 9.164.128 | 17,70 | 315.796 | 20,85 | ||||
| 2026-02-09 | 13F | Wellington Shields Capital Management, LLC | 8.000 | 0,00 | 276 | 2,61 | ||||
| 2026-02-17 | 13F | T. Rowe Price Investment Management, Inc. | 313 | 0,00 | 0 | |||||
| 2026-04-30 | 13F | Kailix Advisors LLC | 0 | -100,00 | 0 | |||||
| 2026-04-27 | 13F | Counterpoint Mutual Funds LLC | 8.515 | 361 | ||||||
| 2026-04-27 | 13F | Truist Financial Corp | 18.957 | -0,06 | 805 | 23,12 | ||||
| 2026-02-12 | 13F | Chilton Capital Management Llc | 5.665 | 0,00 | 195 | 2,63 | ||||
| 2026-04-21 | 13F | Trust Co Of Virginia /va | 10.200 | -6,54 | 433 | 14,89 | ||||
| 2026-02-12 | 13F | BlackRock, Inc. | 26.092.695 | -7,54 | 899.154 | -5,06 | ||||
| 2026-01-14 | 13F | ORG Partners LLC | 132 | 0,00 | 5 | 0,00 | ||||
| 2026-02-13 | 13F | Resources Investment Advisors, LLC. | 11.223 | -1,52 | 387 | 1,05 | ||||
| 2026-01-29 | 13F | Comerica Bank | 74.449 | -6,67 | 2.566 | -4,18 | ||||
| 2026-02-17 | 13F | Raymond James Financial Inc | 4.348.020 | -3,56 | 151.254 | -0,03 | ||||
| 2026-02-13 | 13F | MAI Capital Management | 96 | 209,68 | 3 | 200,00 | ||||
| 2026-02-17 | 13F | Capital Impact Advisors, LLC | 1.146.775 | 372,52 | 39.518 | 385,23 | ||||
| 2026-02-02 | 13F | Horizon Investments, LLC | 371.039 | 553.689,55 | 12.786 | 639.200,00 | ||||
| 2026-02-10 | 13F | Acadian Asset Management Llc | 6.329 | -96,67 | 0 | -100,00 | ||||
| 2026-02-11 | 13F | Prestige Wealth Management Group LLC | 64 | 0,00 | 2 | 0,00 | ||||
| 2026-02-11 | 13F | IMA Wealth, Inc. | 5 | 0,00 | 0 | |||||
| 2026-04-16 | 13F | Ellsworth Advisors, LLC | 108.904 | 4.622 | ||||||
| 2026-02-12 | 13F | Johnson Financial Group, Inc. | 58 | 0,00 | 2 | 0,00 | ||||
| 2026-04-24 | 13F | Root Financial Partners, LLC | 2.201 | 142,40 | 93 | 200,00 | ||||
| 2026-02-10 | 13F | Jupiter Asset Management Ltd | 1.732.790 | 10,27 | 59.712 | 13,23 | ||||
| 2026-02-13 | 13F | SRS Capital Advisors, Inc. | 470 | -99,19 | 16 | -99,18 | ||||
| 2026-02-17 | 13F | Mountain Lake Investment Management LLC | 99.192 | -2,38 | 3.418 | 0,26 | ||||
| 2026-04-08 | 13F | DiNuzzo Private Wealth, Inc. | 534 | -0,56 | 23 | 22,22 | ||||
| 2026-02-17 | 13F | Merewether Investment Management, LP | 727.700 | 25.077 | ||||||
| 2026-02-06 | 13F | Cullen/frost Bankers, Inc. | 7 | 0 | ||||||
| 2026-02-13 | 13F | Aptus Capital Advisors, LLC | Put | 10.000 | 345 | |||||
| 2026-02-13 | 13F | Aptus Capital Advisors, LLC | 14.258 | 491 | ||||||
| 2026-02-17 | 13F | Millennium Management Llc | Put | 84.500 | 272,25 | 2.912 | 282,52 | |||
| 2026-02-10 | 13F | Goldman Sachs Group Inc | 4.007.431 | 26,39 | 138.096 | 29,78 | ||||
| 2026-04-16 | 13F | Toth Financial Advisory Corp | 0 | -100,00 | 0 | |||||
| 2026-02-17 | 13F | Millennium Management Llc | 1.146.832 | -41,11 | 39.520 | -39,53 | ||||
| 2026-02-17 | 13F | Millennium Management Llc | Call | 49.300 | 89,62 | 1.699 | 94,72 | |||
| 2026-02-17 | 13F | Blackstone Group Inc | 0 | -100,00 | 0 | |||||
| 2026-02-10 | 13F | Goldman Sachs Group Inc | Call | 87.100 | 0,00 | 3.001 | 2,67 | |||
| 2026-02-10 | 13F | Goldman Sachs Group Inc | Put | 102.100 | 0,00 | 3.518 | 2,69 | |||
| 2026-02-17 | 13F | Zimmer Partners, LP | 284.000 | 5,19 | 9.787 | 8,00 | ||||
| 2025-11-13 | 13F | Banco BTG Pactual S.A. | 0 | -100,00 | 0 | -100,00 | ||||
| 2026-02-13 | 13F | Palisade Asset Management, LLC | 0 | -100,00 | 0 | |||||
| 2026-02-17 | 13F | Agf Management Ltd | 213.112 | 43,83 | 7.344 | 47,69 | ||||
| 2026-02-05 | 13F | S&co Inc | 479.399 | 3,23 | 17 | 6,67 | ||||
| 2026-02-17 | 13F | Two Sigma Investments, Lp | Put | 12.900 | 445 | |||||
| 2026-02-17 | 13F | Two Sigma Investments, Lp | Call | 6.600 | 227 | |||||
| 2026-02-17 | 13F | Two Sigma Investments, Lp | 796.662 | 57,58 | 27.453 | 61,81 | ||||
| 2026-02-13 | 13F | Financial Network Wealth Advisors LLC | 540 | 152,34 | 19 | 157,14 | ||||
| 2026-02-03 | 13F | Morse Asset Management, Inc | 2.875 | 99 | ||||||
| 2026-04-14 | 13F | Bay Harbor Wealth Management, LLC | 47 | 51,61 | 2 | 0,00 | ||||
| 2026-02-17 | 13F | Pinnacle Financial Partners, Inc. | 17.575 | 606 | ||||||
| 2026-02-13 | 13F | Parkside Financial Bank & Trust | 18.301 | 0,52 | 631 | 3,11 | ||||
| 2026-02-18 | 13F | Vident Advisory, LLC | 50.064 | 10,29 | 1.725 | 13,26 | ||||
| 2026-02-13 | 13F | Sei Investments Co | 244.682 | 15,58 | 8.432 | 18,68 | ||||
| 2026-02-17 | 13F | Massar Capital Management, LP | 11.000 | 0,00 | 379 | 2,71 | ||||
| 2026-02-12 | 13F | Annandale Capital, LLC | 79.704 | 8,07 | 3 | -91,67 | ||||
| 2026-02-17 | 13F | LMR Partners LLP | Put | 25.900 | 0,00 | 893 | 2,65 | |||
| 2026-02-17 | 13F | LMR Partners LLP | Call | 22.700 | 0,00 | 782 | 2,76 | |||
| 2026-02-17 | 13F | LMR Partners LLP | 19.751 | 40,43 | 681 | 44,07 | ||||
| 2026-04-13 | 13F | True Wealth Design, LLC | 1.802 | 41,00 | 76 | 72,73 | ||||
| 2026-01-20 | 13F | Savvy Advisors, Inc. | 6.426 | 221 | ||||||
| 2026-02-17 | 13F | Palo Duro Investment Partners, Lp | 1.933.488 | -16,50 | 66.628 | -14,26 | ||||
| 2026-02-03 | 13F | Bokf, Na | 1.998 | -97,56 | 69 | -97,53 | ||||
| 2026-04-30 | 13F | Nuveen, LLC | 883.135 | -3,72 | 37.480 | 18,58 | ||||
| 2026-02-11 | 13F | Winton Capital Group Ltd | 286.201 | 315,48 | 9.862 | 326,74 | ||||
| 2026-04-17 | 13F | RFG Advisory, LLC | 11.948 | 507 | ||||||
| 2026-04-28 | 13F | BW Gestao de Investimentos Ltda. | 23.653 | -84,56 | 1.004 | -81,00 | ||||
| 2026-02-06 | 13F | Gsa Capital Partners Llp | 0 | -100,00 | 0 | |||||
| 2026-02-03 | 13F | Legacy Wealth Managment, LLC/ID | 258 | 0,00 | 9 | 0,00 | ||||
| 2026-02-06 | 13F | Bare Financial Services, Inc | 17 | 0,00 | 1 | |||||
| 2026-04-17 | 13F | Bell Investment Advisors, Inc | 46 | 0,00 | 2 | 0,00 | ||||
| 2026-04-28 | 13F | Stratos Wealth Partners, LTD. | 17.973 | 5,46 | 763 | 29,81 | ||||
| 2026-04-22 | 13F | Spirepoint Private Client, Llc | 28.229 | 0,00 | 1.198 | 23,25 | ||||
| 2026-02-13 | 13F | Smartleaf Asset Management LLC | 4.577 | 19,19 | 161 | 25,00 | ||||
| 2026-02-04 | 13F | Ameritas Advisory Services, LLC | 0 | -100,00 | 0 | |||||
| 2026-02-17 | 13F | Limestone Investment Advisors LP | 0 | -100,00 | 0 | |||||
| 2025-11-14 | 13F | Sig Brokerage, Lp | Call | 0 | -100,00 | 0 | ||||
| 2026-02-09 | 13F | Annis Gardner Whiting Capital Advisors, LLC | 19 | 0,00 | 1 | |||||
| 2026-01-26 | 13F | Cwm, Llc | 485.297 | 247,39 | 17 | 300,00 | ||||
| 2026-02-17 | 13F | Peconic Partners Llc | 300.000 | 10.338 | ||||||
| 2026-04-27 | 13F | Oxbow Advisors, LLC | 9.752 | -93,34 | 414 | -91,81 | ||||
| 2026-02-13 | 13F | Van Eck Associates Corp | 0 | -100,00 | 0 | |||||
| 2026-02-09 | 13F | Keating Financial Advisory Services, Inc. | 145 | 5 | ||||||
| 2025-11-06 | 13F | Oppenheimer & Co Inc | 0 | -100,00 | 0 | |||||
| 2026-04-22 | 13F | Pictet Asset Management Holding SA | 47.696 | 7,17 | 2.024 | 32,03 | ||||
| 2026-01-23 | 13F | Avion Wealth | 15 | 0,00 | 0 | |||||
| 2026-01-21 | 13F | Newbridge Financial Services Group, Inc. | 938 | 0,00 | 32 | 3,23 | ||||
| 2026-02-17 | 13F | Captrust Financial Advisors | 74.707 | 17,80 | 2.574 | 20,96 | ||||
| 2026-04-30 | 13F | Independence Bank of Kentucky | 100 | 0,00 | 4 | 33,33 | ||||
| 2026-02-11 | 13F | SOUTH STATE Corp | 46 | 0,00 | 2 | 0,00 | ||||
| 2026-02-10 | 13F | Texas Yale Capital Corp. | 27.360 | 0,00 | 943 | 2,61 | ||||
| 2026-02-13 | 13F | Stifel Financial Corp | 211.643 | 69,92 | 7.293 | 74,52 | ||||
| 2026-01-27 | 13F | Zurcher Kantonalbank (Zurich Cantonalbank) | 97.620 | -28,46 | 3.364 | -26,56 | ||||
| 2026-02-12 | 13F | Wealthspire Advisors, LLC | 0 | -100,00 | 0 | |||||
| 2026-02-09 | 13F | MQS Management LLC | 0 | -100,00 | 0 | |||||
| 2026-02-12 | 13F | Rossby Financial, LCC | 8 | 0 | ||||||
| 2026-02-25 | 13F | Mariner Investment Group Llc | Call | 0 | -100,00 | 0 | ||||
| 2026-02-17 | 13F | Tortoise Capital Advisors, L.l.c. | 368.542 | -5,54 | 12.700 | -3,02 | ||||
| 2026-04-02 | 13F | Ares Financial Consulting, LLC | 21 | 0,00 | 1 | |||||
| 2026-02-13 | 13F | Entropy Technologies, LP | 17.363 | 598 | ||||||
| 2026-04-24 | 13F | Greenfield Seitz Capital Management, LLC | 366.535 | 142,59 | 15.556 | 198,79 | ||||
| 2026-02-02 | 13F | Salzhauer Michael | Call | 35.000 | 0,00 | 42 | -42,25 | |||
| 2026-02-10 | 13F | Quantbot Technologies LP | 0 | -100,00 | 0 | |||||
| 2026-02-13 | 13F | Gemsstock Ltd. | 949.754 | 34,14 | 32.729 | 37,73 | ||||
| 2026-02-17 | 13F | Optiver Holding B.V. | 121 | -80,23 | 4 | -80,00 | ||||
| 2026-02-09 | 13F | Quest Partners LLC | 17.192 | 17,40 | 592 | 20,57 | ||||
| 2026-02-17 | 13F | Van Den Berg Management I, Inc | 7.970 | 0,95 | 275 | 3,79 | ||||
| 2026-02-10 | 13F | Fort Sheridan Advisors Llc | 29.721 | -0,68 | 1.024 | 1,99 | ||||
| 2026-02-12 | 13F | Commonwealth Equity Services, Llc | 98.171 | 11,16 | 3.383 | 169.000,00 | ||||
| 2025-11-14 | 13F | Cubist Systematic Strategies, LLC | 0 | -100,00 | 0 | -100,00 | ||||
| 2026-04-08 | 13F | Birchbrook, Inc. | 0 | -100,00 | 0 | |||||
| 2026-02-17 | 13F | Aventail Capital Group, LP | 1.713.233 | 553,55 | 59.038 | 571,12 | ||||
| 2026-04-17 | 13F | Vermillion Wealth Management, Inc. | 18 | 1 | ||||||
| 2026-04-16 | 13F | Diversified Trust Co | 17.012 | 722 | ||||||
| 2026-02-13 | 13F | Commerce Bank | 12.179 | 0,00 | 420 | 2,70 | ||||
| 2025-11-26 | 13F/A | Jpmorgan Chase & Co | Put | 0 | -100,00 | 0 | -100,00 | |||
| 2026-04-30 | 13F | Sequoia Financial Advisors, LLC | 8.175 | -3,89 | 347 | 18,09 | ||||
| 2026-02-11 | 13F | Cerity Partners LLC | 426.948 | 47,53 | 14.713 | 51,48 | ||||
| 2026-04-21 | 13F | GHP Investment Advisors, Inc. | 9 | 0 | ||||||
| 2026-02-17 | 13F | Second Line Capital, LLC | 20.375 | 20.275,00 | 361 | 5.057,14 | ||||
| 2026-02-13 | 13F | Thomist Capital Management, LP | 0 | -100,00 | 0 | |||||
| 2026-04-13 | 13F | Gateway Investment Advisers Llc | 4.752 | 202 | ||||||
| 2026-04-27 | 13F | New York State Teachers Retirement System | 243.513 | -8,26 | 10 | 11,11 | ||||
| 2026-02-09 | 13F | Bleakley Financial Group, LLC | 17.728 | 611 | ||||||
| 2026-02-13 | 13F | Edgestream Partners, L.P. | 21.107 | 727 | ||||||
| 2026-02-17 | 13F | Nomura Holdings Inc | Call | 50.000 | 56,25 | 1.723 | 60,58 | |||
| 2026-02-17 | 13F | Tudor Investment Corp Et Al | Call | 71.300 | 2.457 | |||||
| 2026-02-12 | 13F | Federated Hermes, Inc. | 50.872 | -4,07 | 1.753 | -1,46 | ||||
| 2026-02-17 | 13F | Tudor Investment Corp Et Al | 199.152 | 6.863 | ||||||
| 2026-02-17 | 13F | Tudor Investment Corp Et Al | Put | 316.100 | 10.893 | |||||
| 2026-04-24 | 13F | Retirement Systems of Alabama | 717.223 | 1,07 | 30.439 | 24,48 | ||||
| 2026-02-03 | 13F | Everence Capital Management Inc | 0 | -100,00 | 0 | |||||
| 2026-02-13 | 13F | Landscape Capital Management, L.l.c. | 13.055 | 450 | ||||||
| 2026-02-13 | 13F | Cohen & Steers, Inc. | 0 | -100,00 | 0 | |||||
| 2026-02-17 | 13F | Bank Of America Corp /de/ | 763.651 | -52,18 | 26.315 | -50,90 | ||||
| 2026-04-16 | 13F | Uhlmann Price Securities, Llc | 10.877 | -27,97 | 462 | -11,35 | ||||
| 2026-02-17 | 13F | Worldquant Millennium Advisors Llc | 22.992 | 792 | ||||||
| 2026-04-13 | 13F | Gradient Investments LLC | 18.027 | 58,28 | 765 | 95,15 | ||||
| 2026-02-17 | 13F | Lonestar Capital Management LLC | 0 | -100,00 | 0 | |||||
| 2026-02-13 | 13F | Wells Fargo & Company/mn | 155.564 | -4,65 | 5.361 | -2,10 | ||||
| 2026-02-17 | 13F | Black Maple Capital Management LP | 16.100 | -95,36 | 555 | -95,24 | ||||
| 2026-02-03 | 13F | Mitsubishi UFJ Kokusai Asset Management Co., Ltd. | 821 | 0,00 | 28 | 3,70 | ||||
| 2026-04-13 | 13F | Creative Financial Designs Inc /adv | 59 | 126,92 | 3 | |||||
| 2026-01-27 | 13F | Brighton Jones Llc | 0 | -100,00 | 0 | |||||
| 2026-02-18 | 13F | Beacon Pointe Advisors, LLC | 9.480 | 15,08 | 327 | 18,12 | ||||
| 2026-02-12 | 13F | CoreCommodity Management, LLC | 0 | -100,00 | 0 | -100,00 | ||||
| 2026-02-27 | 13F | Strategic Investment Solutions, Inc. /IL | 0 | -100,00 | 0 | |||||
| 2025-11-12 | 13F | Neo Ivy Capital Management | 0 | -100,00 | 0 | |||||
| 2026-02-12 | 13F | Castleark Management Llc | 234.290 | 8.074 | ||||||
| 2026-02-17 | 13F | Summit Trail Advisors, Llc | 11.818 | -98,00 | 407 | -97,95 | ||||
| 2026-01-29 | 13F | DecisionPoint Financial, LLC | 8 | 0,00 | 0 | |||||
| 2026-02-17 | 13F | Empyrean Capital Partners, LP | 101.400 | 0,00 | 3.494 | 2,70 | ||||
| 2026-04-22 | 13F | Stone House Investment Management, LLC | 14 | 1 | ||||||
| 2026-04-30 | 13F | Barnett & Company, Inc. | 14.400 | -20,88 | 611 | -2,55 | ||||
| 2025-11-14 | 13F | Voloridge Investment Management, Llc | 0 | -100,00 | 0 | |||||
| 2026-02-17 | 13F | Advisory Services Network, LLC | 0 | -100,00 | 0 | |||||
| 2026-01-28 | 13F | CAPROCK Group, Inc. | 57.245 | 5,61 | 1.973 | 13,99 | ||||
| 2026-04-27 | 13F | Capital Advisors Inc/ok | 5.159 | 219 | ||||||
| 2026-02-04 | 13F | Versor Investments LP | 15.900 | 123,94 | 548 | 129,83 | ||||
| 2025-11-12 | 13F | Empirical Asset Management, LLC | 0 | -100,00 | 0 | |||||
| 2026-02-12 | 13F | DRW Securities, LLC | Call | 105.000 | -16,00 | 3.618 | -13,80 | |||
| 2026-02-17 | 13F | Saba Capital Management, L.P. | 9.400 | -6,00 | 324 | -3,58 | ||||
| 2026-02-12 | 13F | DRW Securities, LLC | 7.060 | -22,35 | 243 | -20,33 | ||||
| 2026-02-12 | 13F | DRW Securities, LLC | Put | 50.000 | 1.723 | |||||
| 2026-04-27 | 13F | Moran Wealth Management, LLC | 59.693 | 34,47 | 2.533 | 65,66 | ||||
| 2026-04-29 | 13F | Skopos Labs, Inc. | 24.866 | 25,40 | 1.055 | 53,79 | ||||
| 2026-02-13 | 13F | State Street Corp | 9.886.132 | -2,81 | 340.676 | -0,20 | ||||
| 2026-02-17 | 13F | Aquatic Capital Management LLC | 94.232 | 3.247 | ||||||
| 2026-02-06 | 13F | Tortoise Investment Management, LLC | 0 | -100,00 | 0 | |||||
| 2026-04-28 | 13F | SBI Okasan Asset Management Co.Ltd. | 1.300 | 0,00 | 57 | 29,55 | ||||
| 2026-02-10 | 13F | JTC Employer Solutions Trusteee Ltd | 3.500 | 0,00 | 0 | |||||
| 2026-02-12 | 13F | Distillate Capital Partners LLC | 15 | 1.400,00 | 1 | |||||
| 2026-04-23 | 13F | TFC Financial Management | 1 | 0,00 | 0 | |||||
| 2026-04-15 | 13F | FNY Investment Advisers, LLC | 0 | -100,00 | 0 | |||||
| 2026-04-20 | 13F | Ronald Blue Trust, Inc. | 885 | -7,81 | 38 | 12,12 | ||||
| 2026-02-13 | 13F | Dynamic Technology Lab Private Ltd | 0 | -100,00 | 0 | |||||
| 2026-02-12 | 13F | Quadrant Capital Group Llc | 20.306 | 0,08 | 700 | 2,79 | ||||
| 2026-02-11 | 13F | Rise Advisors, LLC | 0 | -100,00 | 0 | -100,00 | ||||
| 2026-02-13 | 13F | Squarepoint Ops LLC | Put | 38.000 | 211,48 | 1.309 | 220,05 | |||
| 2026-02-13 | 13F | Morgan Stanley | 3.417.825 | -11,45 | 117.778 | -9,07 | ||||
| 2026-02-13 | 13F | Squarepoint Ops LLC | 2.175.759 | 22,09 | 74.977 | 25,36 | ||||
| 2026-02-13 | 13F | Marshall Wace, Llp | 488.409 | 16.831 | ||||||
| 2026-02-11 | 13F | O'shaughnessy Asset Management, Llc | 21.653 | -7,84 | 746 | -5,33 | ||||
| 2026-04-17 | 13F | CENTRAL TRUST Co | 10 | -97,65 | 0 | -100,00 | ||||
| 2026-02-13 | 13F | Mariner, LLC | 183.947 | 77,49 | 6.348 | 82,52 | ||||
| 2026-04-21 | 13F | Pinnacle Associates Ltd | 123.734 | 5.251 | ||||||
| 2026-02-13 | 13F | Squarepoint Ops LLC | Call | 103.500 | 157,46 | 3.567 | 164,34 | |||
| 2025-11-12 | 13F | MGB Wealth Management, LLC | 0 | -100,00 | 0 | |||||
| 2026-02-17 | 13F | Clear Street Markets Llc | 0 | -100,00 | 0 | |||||
| 2026-04-16 | 13F | Stanley-Laman Group, Ltd. | 145.748 | 7,22 | 6.186 | 32,05 | ||||
| 2026-02-13 | 13F | Ieq Capital, Llc | 346.985 | 30,19 | 11.957 | 33,69 | ||||
| 2025-11-14 | 13F | Capstone Investment Advisors, Llc | 9.920 | 333 | ||||||
| 2025-11-14 | 13F | Ossiam | 0 | -100,00 | 0 | |||||
| 2026-02-13 | 13F | Arkadios Wealth Advisors | 134.911 | 4.649 | ||||||
| 2026-02-17 | 13F | PDT Partners, LLC | 0 | -100,00 | 0 | |||||
| 2026-04-28 | 13F | SBI Securities Co., Ltd. | 3.304 | 98,20 | 140 | 145,61 | ||||
| 2026-04-20 | 13F | Ritholtz Wealth Management | 9.973 | 7,62 | 423 | 32,60 | ||||
| 2025-11-05 | 13F | Caliber Wealth Management, LLC / KS | 0 | -100,00 | 0 | |||||
| 2026-02-13 | 13F | Prudential Financial Inc | 141.726 | 48,05 | 4.975 | 54,86 | ||||
| 2026-04-30 | 13F | Mv Capital Management, Inc. | 0 | -100,00 | 0 | |||||
| 2026-02-13 | 13F | Fiduciary Trust Co | 122.700 | -1,64 | 4.228 | 1,00 | ||||
| 2026-02-10 | 13F | Bridges Investment Management Inc | 6.595 | 227 | ||||||
| 2026-02-17 | 13F | Northern Trust Corp | 2.358.165 | -3,65 | 81.262 | -1,07 | ||||
| 2025-11-14 | 13F | Maverick Capital Ltd | 0 | -100,00 | 0 | |||||
| 2025-11-14 | 13F | Castle Hook Partners LP | 0 | -100,00 | 0 | |||||
| 2026-02-17 | 13F | Graham Capital Management, L.P. | 43.872 | 1.512 | ||||||
| 2026-02-05 | 13F | Thrivent Financial For Lutherans | 117.817 | 14,83 | 4 | 33,33 | ||||
| 2026-02-17 | 13F | Cetera Investment Advisers | 22.790 | -3,33 | 785 | -0,76 | ||||
| 2026-02-17 | 13F | Adage Capital Partners Gp, L.l.c. | 3.438.110 | 13,73 | 118.477 | 16,78 | ||||
| 2026-02-19 | 13F | Invesco Ltd. | 4.999.747 | 17,98 | 172.291 | 21,14 | ||||
| 2026-02-12 | 13F | Jane Street Group, Llc | Put | 2.450.700 | 333,68 | 84.451 | 345,32 | |||
| 2025-11-14 | 13F | Icon Wealth Advisors, LLC | 0 | -100,00 | 0 | -100,00 | ||||
| 2026-04-28 | 13F | Bfsg, Llc | 122 | 0,00 | 5 | 25,00 | ||||
| 2026-02-12 | 13F | Jane Street Group, Llc | Call | 518.700 | 256,01 | 17.874 | 265,60 | |||
| 2026-02-17 | 13F | Dark Forest Capital Management Lp | 56.369 | -51,12 | 1.942 | -58,19 | ||||
| 2026-04-09 | 13F | Wedmont Private Capital | 21.821 | 0,29 | 855 | 19,61 | ||||
| 2026-01-23 | 13F | Assetmark, Inc | 154 | 13,24 | 5 | 25,00 | ||||
| 2026-02-13 | 13F | Boston Partners | 40.540 | -42,51 | 1.397 | -40,96 | ||||
| 2026-02-17 | 13F | Parallax Volatility Advisers, L.P. | Put | 277.600 | 9.566 | |||||
| 2026-02-09 | 13F | Coldstream Capital Management Inc | 7.344 | -0,58 | 253 | 2,43 | ||||
| 2026-02-17 | 13F | Parallax Volatility Advisers, L.P. | 26.841 | 925 | ||||||
| 2026-04-23 | 13F | American National Bank | 0 | -100,00 | 0 | |||||
| 2026-01-05 | 13F | Union Bancaire Privee, UBP SA | 0 | -100,00 | 0 | |||||
| 2026-02-17 | 13F | Parallax Volatility Advisers, L.P. | Call | 189.500 | 1.479,17 | 6.530 | 1.524,38 | |||
| 2026-02-12 | 13F | Summit Financial, LLC | 15.659 | 0,00 | 540 | 2,67 | ||||
| 2026-02-13 | 13F | DC Investments Management, LLC | 128.841 | 4,91 | 4.440 | 7,72 | ||||
| 2026-02-05 | 13F | Tejara Capital Ltd | 139.900 | 251,51 | 4.821 | 261,05 | ||||
| 2026-02-17 | 13F | Interval Partners, LP | 0 | -100,00 | 0 | |||||
| 2026-02-06 | 13F | Larson Financial Group LLC | 116 | 205,26 | 4 | 200,00 | ||||
| 2026-02-17 | 13F | Lsp Investment Advisors, Llc | 189.500 | 15,83 | 6.530 | 18,94 | ||||
| 2026-04-20 | 13F | State of Alaska, Department of Revenue | 28.787 | -1,42 | 1 | 0,00 | ||||
| 2026-02-17 | 13F | Ameriprise Financial Inc | 1.986.568 | -15,17 | 68.457 | -12,89 | ||||
| 2026-04-29 | 13F | Garde Capital, Inc. | 22.406 | 0,00 | 951 | 23,06 | ||||
| 2026-04-22 | 13F | Janney Montgomery Scott LLC | 26.763 | 53,10 | 1 | |||||
| 2026-04-20 | 13F | Jfs Wealth Advisors, Llc | 230 | -14,50 | 10 | 0,00 | ||||
| 2026-02-13 | 13F | JustInvest LLC | 25.524 | 4,71 | 880 | 7,46 | ||||
| 2026-02-17 | 13F | Scarborough Advisors, LLC | 1 | 0,00 | 0 | |||||
| 2026-02-17 | 13F | D. E. Shaw & Co., Inc. | 4.010.441 | -22,97 | 138.200 | -20,90 | ||||
| 2026-02-12 | 13F | State Board Of Administration Of Florida Retirement System | 241.551 | -1,35 | 8.324 | 1,29 | ||||
| 2026-02-13 | 13F | Caitong International Asset Management Co., Ltd | 1.623 | 56 | ||||||
| 2026-02-17 | 13F | D. E. Shaw & Co., Inc. | Call | 90.000 | 3.101 | |||||
| 2026-02-17 | 13F | D. E. Shaw & Co., Inc. | Put | 38.000 | 1.309 | |||||
| 2026-02-17 | 13F | ISAM Funds (UK) Ltd | 8.573 | -81,20 | 295 | -80,72 | ||||
| 2026-04-28 | 13F | Quent Capital, LLC | 3.490 | -12,79 | 148 | 8,03 | ||||
| 2026-02-13 | 13F | Fieldview Capital Management, LLC | 80.840 | 329,31 | 2.786 | 341,36 | ||||
| 2026-02-06 | 13F | Evoke Wealth, Llc | 17.358 | 99,01 | 598 | 104,79 | ||||
| 2026-04-23 | 13F | Rexford Capital Inc | 2 | 0 | ||||||
| 2026-02-13 | 13F | HITE Hedge Asset Management LLC | 162.709 | -78,45 | 5.607 | -77,88 | ||||
| 2026-04-27 | 13F | Leonteq Securities AG | 5.128 | 14,36 | 218 | 40,91 | ||||
| 2026-02-17 | 13F | Citadel Advisors Llc | Put | 548.100 | -18,62 | 18.888 | -16,44 | |||
| 2026-02-17 | 13F | Citadel Advisors Llc | Call | 1.606.700 | 219,61 | 55.367 | 228,19 | |||
| 2026-02-12 | 13F | Cloud Capital Management, LLC | 0 | -100,00 | 0 | |||||
| 2026-02-17 | 13F | Citadel Advisors Llc | 411.899 | -73,53 | 14.194 | -72,82 | ||||
| 2026-04-14 | 13F | Thurston, Springer, Miller, Herd & Titak, Inc. | 63 | 3 | ||||||
| 2026-01-30 | 13F | Citizens National Bank Trust Department | 16.534 | 10,85 | 570 | 13,80 | ||||
| 2026-04-10 | 13F | Viking Fund Management Llc | 120.000 | 0,00 | 5.093 | 23,14 | ||||
| 2026-02-17 | 13F | Gotham Asset Management, LLC | 244.200 | -62,82 | 8.415 | -61,83 | ||||
| 2025-11-10 | 13F | Garda Capital Partners Lp | Put | 0 | -100,00 | 0 | ||||
| 2025-11-14 | 13F | Mount Yale Investment Advisors, LLC | 0 | -100,00 | 0 | -100,00 | ||||
| 2025-11-10 | 13F | Garda Capital Partners Lp | Call | 0 | -100,00 | 0 | ||||
| 2026-02-17 | 13F | Mercer Global Advisors Inc /adv | 60.111 | 35,66 | 2.071 | 39,27 | ||||
| 2026-02-12 | 13F | Federation des caisses Desjardins du Quebec | 22.913 | 17,31 | 790 | 20,46 | ||||
| 2026-04-16 | 13F | Park National Corp /oh/ | 12.612 | 5,10 | 535 | 29,54 | ||||
| 2026-04-15 | 13F | Exchange Traded Concepts, Llc | 8.518 | 3,37 | 362 | 27,56 | ||||
| 2026-02-12 | 13F | Voya Investment Management Llc | 167.175 | -8,58 | 5.761 | -6,13 | ||||
| 2026-04-15 | 13F | Merit Financial Group, LLC | 25.287 | 25,21 | 1.073 | 54,39 | ||||
| 2026-02-19 | 13F | Atomi Financial Group, Inc. | 7.424 | -8,58 | 256 | -6,25 | ||||
| 2026-02-13 | 13F | Treasurer of the State of North Carolina | 121.390 | -6,81 | 4 | 0,00 | ||||
| 2026-04-28 | 13F | Altfest L J & Co Inc | 23.210 | 1,46 | 985 | 25,00 | ||||
| 2026-01-23 | 13F | Financial Connections Group, Inc. | 200 | 100,00 | 0 | |||||
| 2026-04-21 | 13F | Hennessy Advisors Inc | 19.900 | 26,75 | 845 | 56,01 | ||||
| 2026-02-11 | 13F | Parallel Advisors, LLC | 2.108 | 16,66 | 73 | 20,00 | ||||
| 2026-04-20 | 13F | Davis Investment Partners, LLC | 15.174 | 644 | ||||||
| 2026-02-10 | 13F | Nomura Asset Management Co Ltd | 5.318 | 0,02 | 183 | 2,81 | ||||
| 2026-02-13 | 13F | Colony Group, LLC | 113.346 | 9,14 | 3.906 | 8,02 | ||||
| 2026-04-06 | 13F | Versant Capital Management, Inc | 3.552 | 27,18 | 151 | 56,25 | ||||
| 2026-01-30 | 13F | Us Bancorp \de\ | 105.293 | 41,29 | 3.628 | 45,12 | ||||
| 2026-02-10 | 13F | New Mexico Educational Retirement Board | 60.800 | 0,00 | 2 | 0,00 | ||||
| 2026-02-06 | 13F | Auxano Advisors, LLC | 10.440 | 6,02 | 360 | 8,79 | ||||
| 2026-04-16 | 13F | Capital Advisors, Ltd. LLC | 217 | 0,00 | 0 | |||||
| 2026-04-29 | 13F | WPG Advisers, LLC | 50 | 0,00 | 2 | 100,00 | ||||
| 2026-02-17 | 13F | Cinctive Capital Management LP | 46.595 | -86,27 | 1.606 | -85,90 | ||||
| 2026-02-12 | 13F | Kahn Brothers Group Inc /de/ | 6.242 | -65,02 | 215 | -64,05 | ||||
| 2026-04-13 | 13F | IFP Advisors, Inc | 2.257 | -33,05 | 96 | -18,10 | ||||
| 2025-11-10 | 13F | Citigroup Inc | Call | 0 | -100,00 | 0 | -100,00 | |||
| 2026-04-29 | 13F/A | Salem Investment Counselors Inc | 943 | 40 | ||||||
| 2026-02-10 | 13F | Intech Investment Management Llc | 47.246 | -88,39 | 1.628 | -88,08 | ||||
| 2026-04-17 | 13F | Fifth Third Wealth Advisors LLC | 9.362 | 4,34 | 397 | 28,48 | ||||
| 2026-02-11 | 13F | Twin Tree Management, LP | Call | 11.800 | -93,11 | 407 | -92,94 | |||
| 2026-02-17 | 13F | Long Focus Capital Management, Llc | 1.311.540 | 0,19 | 45.196 | 2,88 | ||||
| 2025-11-14 | 13F | National Bank Of Canada /fi/ | 0 | -100,00 | 0 | |||||
| 2026-02-12 | 13F | Steward Partners Investment Advisory, Llc | 16.567 | 29,39 | 571 | 32,87 | ||||
| 2026-02-12 | 13F | Caerus Investment Advisors, LLC | 13.578 | -7,07 | 468 | -4,69 | ||||
| 2026-02-12 | 13F | BRYN MAWR TRUST Co | 0 | -100,00 | 0 | -100,00 | ||||
| 2025-11-05 | 13F | Machina Capital S.a.s. | 0 | -100,00 | 0 | |||||
| 2026-02-17 | 13F | Webs Creek Capital Management LP | 1.503.951 | 51.826 | ||||||
| 2025-11-14 | 13F | Zacks Investment Management | 0 | -100,00 | 0 | -100,00 | ||||
| 2026-02-05 | 13F | Allworth Financial LP | 5.717 | 64,90 | 197 | 69,83 | ||||
| 2026-02-05 | 13F | HFM Investment Advisors, LLC | 21 | 40,00 | 1 | |||||
| 2026-04-24 | 13F | Gilliland Jeter Wealth Management LLC | 22.385 | 0,00 | 950 | 23,22 | ||||
| 2026-01-28 | 13F | U S Global Investors Inc | 5.000 | -50,00 | 172 | -48,66 | ||||
| 2026-02-17 | 13F | Aqr Capital Management Llc | 4.694.364 | 35,38 | 161.768 | 39,01 | ||||
| 2026-02-17 | 13F | Corigliano Investment Advisers, LLC | 907.500 | 9,01 | 31.272 | 11,93 | ||||
| 2026-04-30 | 13F | First Horizon Corp | 69 | 0,00 | 3 | 0,00 | ||||
| 2026-02-17 | 13F | Wellington Management Group Llp | 11.309.130 | -39,37 | 389.713 | -37,74 | ||||
| 2025-11-17 | 13F | Jacobs Levy Equity Management, Inc | 0 | -100,00 | 0 | -100,00 | ||||
| 2026-01-27 | 13F | TD Waterhouse Canada Inc. | 218 | 0,00 | 8 | 0,00 | ||||
| 2026-04-17 | 13F | AdvisorNet Financial, Inc | 175 | 150,00 | 7 | 250,00 | ||||
| 2026-04-23 | 13F | Private Wealth Management Group, LLC | 173 | 0,00 | 7 | 40,00 | ||||
| 2026-02-17 | 13F | DME Capital Management, LP | 1.014.070 | 34.945 | ||||||
| 2026-02-18 | 13F | GWM Advisors LLC | 115.616 | 1.317,04 | 2.617 | 858,24 | ||||
| 2026-04-23 | 13F | Forum Financial Management, LP | 0 | -100,00 | 0 | |||||
| 2026-02-11 | 13F | Brandywine Global Investment Management, LLC | 215.470 | 77,77 | 7.425 | 82,57 | ||||
| 2026-02-17 | 13F | Magnetar Financial LLC | 0 | -100,00 | 0 | -100,00 | ||||
| 2026-02-12 | 13F | MetLife Investment Management, LLC | 548.646 | -1,60 | 18.906 | 1,04 | ||||
| 2026-01-29 | 13F | Dunhill Financial, LLC | 6 | 0 | ||||||
| 2026-02-17 | 13F | Advisor Group Holdings, Inc. | 12.960 | -14,01 | 447 | -10,26 | ||||
| 2026-02-17 | 13F | Atom Investors LP | 75.186 | 2.591 | ||||||
| 2026-04-16 | 13F | Vaughan Nelson Investment Management, L.p. | 1.441.273 | -17,85 | 61.168 | 1,18 | ||||
| 2026-02-17 | 13F | Clough Capital Partners L P | 343.821 | 11.848 | ||||||
| 2026-02-12 | 13F | Colrain Capital Llc | 290.300 | 14,04 | 10.004 | 17,10 | ||||
| 2026-02-23 | 13F | Revere Asset Management, Inc | 0 | -100,00 | 0 | |||||
| 2026-02-02 | 13F | VELA Investment Management, LLC | 129.130 | 6,16 | 4.450 | 8,99 | ||||
| 2026-04-13 | 13F | Gill Capital Partners, Llc | 19.742 | 116,42 | 838 | 166,56 | ||||
| 2026-02-03 | 13F | Carlson Capital L P | 0 | -100,00 | 0 | |||||
| 2026-02-17 | 13F | Guggenheim Capital Llc | 7.742 | -17,52 | 267 | -15,29 | ||||
| 2026-02-17 | 13F | Lighthouse Investment Partners, LLC | 332.500 | 10,83 | 11.458 | 13,80 | ||||
| 2026-02-17 | 13F | Creative Planning | 80.690 | 43,34 | 2.781 | 47,17 | ||||
| 2026-02-12 | 13F | Ensign Peak Advisors, Inc | 48.847 | -62,86 | 1.683 | -61,87 | ||||
| 2026-04-28 | 13F | Flagship Harbor Advisors, Llc | 0 | -100,00 | 0 | |||||
| 2025-11-12 | 13F | CIBC Bancorp USA Inc. | 2.303.152 | 77.294 | ||||||
| 2026-02-17 | 13F | Toronto Dominion Bank | 509 | 18 | ||||||
| 2026-02-10 | 13F | Bank of New York Mellon Corp | 3.101.208 | 22,51 | 106.868 | 25,80 | ||||
| 2026-02-02 | 13F | Fifth Third Bancorp | 2.959 | 3,07 | 102 | 5,21 | ||||
| 2026-02-04 | 13F | Independent Advisor Alliance | 56.378 | 1,91 | 1.943 | 4,63 | ||||
| 2025-11-12 | 13F | Blair William & Co/il | 0 | -100,00 | 0 | -100,00 | ||||
| 2026-02-13 | 13F | Pinnacle Wealth Planning Services, Inc. | 1.256 | 43 | ||||||
| 2026-02-10 | 13F | Fielder Capital Group LLC | 128.430 | 7,30 | 4.426 | 10,18 | ||||
| 2026-02-17 | 13F | Aster Capital Management (DIFC) Ltd | 2.140 | -84,12 | 74 | -83,85 | ||||
| 2026-01-13 | 13F | Mather Group, Llc. | 0 | -100,00 | 0 | |||||
| 2026-02-17 | 13F | Pennant Select, LLC | 213.269 | 0,00 | 7.349 | 2,68 | ||||
| 2026-02-09 | 13F | Legal & General Group Plc | 525.814 | -8,02 | 18.120 | -5,56 | ||||
| 2025-11-14 | 13F | Daiwa Securities Group Inc. | 0 | -100,00 | 0 | -100,00 | ||||
| 2026-02-06 | 13F | Covestor Ltd | 371 | -0,54 | 0 | |||||
| 2026-04-27 | 13F | Qrg Capital Management, Inc. | 6.368 | 270 | ||||||
| 2026-02-13 | 13F | Toroso Investments, LLC | 11.944 | -76,11 | 412 | -75,51 | ||||
| 2026-02-12 | 13F | Bank Of Montreal /can/ | 68.622 | 42,96 | 2.365 | 46,83 | ||||
| 2026-02-17 | 13F | Manatuck Hill Partners, LLC | 6.200 | -69,00 | 214 | -68,26 | ||||
| 2025-11-07 | 13F | Synovus Financial Corp | 16.712 | 561 | ||||||
| 2026-04-29 | 13F | Hughes Financial Services, LLC | 0 | -100,00 | 0 | |||||
| 2026-02-09 | 13F | Geode Capital Management, Llc | 5.344.559 | -2,44 | 184.229 | 0,18 | ||||
| 2026-01-26 | 13F | Quadrant Private Wealth Management, LLC | 0 | -100,00 | 0 | |||||
| 2025-11-14 | 13F | Virtu Financial LLC | 0 | -100,00 | 0 | |||||
| 2026-02-18 | 13F | State of Tennessee, Treasury Department | 94.095 | -4,11 | 3.422 | 3,92 | ||||
| 2026-01-30 | 13F | Glenorchy Capital Ltd | 57.099 | -1,41 | 1.968 | 1,24 | ||||
| 2026-01-07 | 13F | Hilltop National Bank | 0 | -100,00 | 0 | |||||
| 2025-11-14 | 13F | Cubist Systematic Strategies, LLC | Call | 10.300 | 758,33 | 346 | 618,75 | |||
| 2025-11-14 | 13F | Cubist Systematic Strategies, LLC | Put | 10.300 | 346 | |||||
| 2025-11-14 | 13F | Voleon Capital Management Lp | 0 | -100,00 | 0 | -100,00 | ||||
| 2026-02-06 | 13F | EverSource Wealth Advisors, LLC | 5.909 | 38,94 | 204 | 42,96 | ||||
| 2026-02-10 | 13F | Principia Wealth Advisory, LLC | 16 | -5,88 | 1 | |||||
| 2026-04-28 | 13F | SeaBridge Investment Advisors LLC | 99.880 | 37,27 | 4.239 | 69,05 | ||||
| 2026-02-17 | 13F | Cobalt Capital Management, Inc. | 0 | -100,00 | 0 | |||||
| 2026-04-23 | 13F | Farmers & Merchants Investments Inc | 258 | 0,00 | 11 | 25,00 | ||||
| 2026-02-06 | 13F | HighTower Advisors, LLC | 145.751 | 73,54 | 5.023 | 78,21 | ||||
| 2026-02-13 | 13F | Public Employees Retirement Association Of Colorado | 30.242 | 0,00 | 1 | 0,00 | ||||
| 2026-04-17 | 13F | Krilogy Financial LLC | 11.762 | 20,56 | 441 | 27,54 | ||||
| 2026-04-20 | 13F | Hilton Head Capital Partners, LLC | 1.739 | 35,33 | 74 | 65,91 | ||||
| 2026-02-17 | 13F | Man Group plc | 647.395 | 113,03 | 22.309 | 118,74 | ||||
| 2026-01-22 | 13F | Accordant Advisory Group Inc | 48.189 | 15,21 | 1.661 | 18,32 | ||||
| 2026-04-15 | 13F | Norden Group Llc | 10.387 | -3,57 | 441 | 18,60 | ||||
| 2026-02-17 | 13F | Banco Bilbao Vizcaya Argentaria, S.a. | 0 | -100,00 | 0 | |||||
| 2026-02-17 | 13F | Alphadyne Asset Management, LLC | 28.199 | 972 | ||||||
| 2026-02-17 | 13F | Alphadyne Asset Management, LLC | Call | 213.300 | 7.350 | |||||
| 2026-02-04 | 13F | Swiss Life Asset Management Ltd | 13.601 | 0,00 | 469 | 2,63 | ||||
| 2026-02-17 | 13F | Alphadyne Asset Management, LLC | Put | 188.400 | 6.492 | |||||
| 2026-02-03 | 13F | NewEdge Wealth, LLC | 583.110 | 20.094 | ||||||
| 2026-02-27 | 13F/A | Barclays Plc | Call | 0 | -100,00 | 0 | -100,00 | |||
| 2026-02-12 | 13F | California Public Employees Retirement System | 513.992 | -0,42 | 17.712 | 2,26 | ||||
| 2026-02-13 | 13F | SIR Capital Management, L.P. | 514.666 | -46,29 | 17.735 | -44,85 | ||||
| 2026-02-10 | 13F | Eurizon Capital SGR S.p.A. | 1.702.433 | 58.831 | ||||||
| 2026-02-17 | 13F | RMB Capital Management, LLC | 9.306 | 321 | ||||||
| 2026-02-13 | 13F | Barclays Plc | 454.631 | -18,71 | 15.667 | -16,53 | ||||
| 2026-02-13 | 13F | Barclays Plc | Put | 650.000 | -57,56 | 22.399 | -56,42 | |||
| 2026-02-11 | 13F | Meeder Asset Management Inc | 18.888 | 12.492,00 | 651 | 12.900,00 | ||||
| 2026-01-28 | 13F | Geneos Wealth Management Inc. | 2.300 | -28,68 | 79 | -26,85 | ||||
| 2026-01-30 | 13F | Sigma Planning Corp | 10.445 | 11,13 | 360 | 13,97 | ||||
| 2025-11-12 | 13F | NewSquare Capital LLC | 0 | -100,00 | 0 | |||||
| 2026-02-17 | 13F | SailingStone Capital Partners LLC | 869.229 | 60,03 | 29.954 | 64,32 | ||||
| 2026-04-30 | 13F | Nisa Investment Advisors, Llc | 39.964 | 1,95 | 1.696 | 25,63 | ||||
| 2026-04-22 | 13F | Sterling Capital Management LLC | 9.788 | -43,01 | 415 | -29,78 | ||||
| 2026-04-24 | 13F | Private Advisor Group, LLC | 6.221 | 264 | ||||||
| 2026-04-15 | 13F | Fortitude Family Office, LLC | 346 | 55,86 | 15 | 100,00 | ||||
| 2026-02-17 | 13F | Lazard Asset Management Llc | 139.070 | -13,93 | 4.792 | -11,62 | ||||
| 2026-02-17 | 13F | Brevan Howard Capital Management LP | 59.428 | -52,96 | 2.031 | -52,09 | ||||
| 2026-02-13 | 13F | Avos Capital Management, LLC | 21.107 | 12,23 | 727 | 15,21 | ||||
| 2026-02-17 | 13F | OnyxPoint Global Management LP | Call | 20.500 | 0,00 | 706 | 2,77 | |||
| 2025-11-14 | 13F | Arosa Capital Management LP | 0 | -100,00 | 0 | -100,00 | ||||
| 2026-04-20 | 13F | Kestra Private Wealth Services, Llc | 6.956 | 295 | ||||||
| 2026-04-28 | 13F | Nbt Bank N A /ny | 71 | 3 | ||||||
| 2026-04-08 | 13F | Wealth Enhancement Advisory Services, Llc | 117.128 | 57,98 | 4.196 | 75,86 | ||||
| 2026-01-28 | 13F | Universal- Beteiligungs- und Servicegesellschaft mbH | 494.597 | 13,32 | 17.218 | 17,54 | ||||
| 2026-02-06 | 13F | Meiji Yasuda Asset Management Co Ltd. | 6.725 | -1,39 | 232 | 1,32 | ||||
| 2026-02-10 | 13F | State of Wyoming | 1.240 | -88,09 | 43 | -87,97 | ||||
| 2026-02-17 | 13F | Aristotle Atlantic Partners, Llc | 565.039 | 66,40 | 19.471 | 70,87 | ||||
| 2026-04-08 | 13F | NorthCrest Asset Manangement, LLC | 13.395 | 5,71 | 542 | 30,05 | ||||
| 2026-02-17 | 13F | Toronto Dominion Bank | Call | 216.700 | 7.467 | |||||
| 2026-02-13 | 13F | Great West Life Assurance Co /can/ | 170.299 | 0,00 | 6 | 0,00 | ||||
| 2026-04-10 | 13F | Intellectus Partners, LLC | 18.550 | 0,00 | 787 | 23,16 | ||||
| 2026-02-13 | 13F | Victory Capital Management Inc | 1.107.596 | -2,93 | 38.168 | -0,33 | ||||
| 2026-02-17 | 13F | Delaware Management Holdings, Inc. | 222.671 | 7.673 | ||||||
| 2026-04-29 | 13F | Jackson Thornton Asset Management, Llc | 5.974 | -4,60 | 226 | 11,88 | ||||
| 2026-02-17 | 13F | Signature Equity Partners, LLC | 52 | 2 | ||||||
| 2025-11-21 | 13F | Watts Gwilliam & Co., LLC | 110.076 | 0,00 | 3.694 | 5,21 | ||||
| 2026-02-17 | 13F | Numerai GP LLC | 7.330 | 253 | ||||||
| 2026-02-11 | 13F | Allianz Asset Management GmbH | 112.462 | 3,90 | 3.875 | 6,69 | ||||
| 2026-02-10 | 13F | Savant Capital, LLC | 9.426 | 14,92 | 325 | 17,82 | ||||
| 2026-04-27 | 13F | BIP Wealth, LLC | 46.483 | 0,00 | 1.973 | 23,17 | ||||
| 2026-02-17 | 13F | Alliancebernstein L.p. | 355.590 | 1,92 | 12.254 | 4,65 | ||||
| 2026-01-26 | 13F | Ckw Financial Group | 111 | -43,94 | 0 | |||||
| 2026-01-30 | 13F | Mitsubishi UFJ Trust & Banking Corp | 14.106 | -60,16 | 486 | -59,09 | ||||
| 2026-02-11 | 13F | Ing Groep Nv | 65.300 | -65,90 | 2.250 | -64,99 | ||||
| 2026-04-09 | 13F | Nelson, Van Denburg & Campbell Wealth Management Group, LLC | 9.451 | 0,00 | 401 | 23,38 | ||||
| 2026-02-17 | 13F | Boothbay Fund Management, Llc | 249.790 | 16,84 | 8.608 | 19,97 | ||||
| 2025-11-03 | 13F | Stonegate Investment Group, LLC | 56.132 | -17,41 | 1.884 | -31,20 | ||||
| 2026-02-17 | 13F | SummitTX Capital, L.P. | 0 | -100,00 | 0 | |||||
| 2026-02-17 | 13F | Nokomis Capital, L.L.C. | 335.208 | 0,00 | 11.551 | 2,68 | ||||
| 2026-04-15 | 13F | Activest Wealth Management | 222 | 6,22 | 9 | 28,57 | ||||
| 2026-01-29 | 13F | Riggs Asset Managment Co. Inc. | 40.593 | 1.399 | ||||||
| 2026-04-24 | 13F | Yousif Capital Management, Llc | 90.379 | -4,59 | 3.836 | 23,19 | ||||
| 2026-04-28 | 13F | Stephens Investment Management Group LLC | 1.180.915 | -0,59 | 50.118 | 22,43 | ||||
| 2026-02-13 | 13F | Transamerica Financial Advisors, Inc. | 4 | 0 | ||||||
| 2026-02-11 | 13F | Waddell & Associates, Llc | 6.882 | 237 | ||||||
| 2026-01-29 | 13F | D.a. Davidson & Co. | 32.128 | 8,07 | 1.107 | 11,03 | ||||
| 2026-01-23 | 13F | Optima Capital Llc | 32 | 1 | ||||||
| 2026-01-08 | 13F | Goodman Financial Corp | 460.806 | 4,56 | 15.879 | 7,36 | ||||
| 2026-02-17 | 13F | XTX Topco Ltd | 18.368 | -19,17 | 633 | -17,06 | ||||
| 2026-02-05 | 13F | Bessemer Group Inc | 1.372 | -1,29 | 0 | |||||
| 2026-04-27 | 13F | HB Wealth Management, LLC | 13.607 | 31,27 | 577 | 61,62 | ||||
| 2026-02-12 | 13F | Loomis Sayles & Co L P | 923.030 | 5,07 | 31.808 | 7,89 | ||||
| 2026-01-30 | 13F | Pekin Hardy Strauss, Inc. | 208.719 | 20,07 | 7.192 | 23,30 | ||||
| 2026-02-17 | 13F | DV Trading LLC | 100 | 3 | ||||||
| 2026-04-01 | 13F | Confluence Investment Management Llc | 0 | -100,00 | 0 | |||||
| 2026-02-12 | 13F | Swiss National Bank | 578.700 | 1,17 | 19.942 | 3,89 | ||||
| 2026-02-17 | 13F | Jump Financial, LLC | 29.805 | -88,32 | 1.027 | -88,01 | ||||
| 2025-11-07 | 13F | Sierra Ocean, Llc | 0 | -100,00 | 0 | |||||
| 2026-02-17 | 13F | Susquehanna Advisors Group, Inc. | 48.000 | 109,46 | 1.654 | 115,08 | ||||
| 2026-02-17 | 13F | Per Stirling Capital Management, LLC. | 17.065 | 48,61 | 588 | 52,73 | ||||
| 2026-01-12 | 13F | Rialto Wealth Management, LLC | 33 | 22,22 | 1 | |||||
| 2026-01-15 | 13F | Allspring Global Investments Holdings, LLC | 584.186 | 25,08 | 19.985 | 22,34 | ||||
| 2026-02-10 | 13F | Mutual Of America Capital Management Llc | 121.968 | -10,01 | 4.203 | -7,59 | ||||
| 2026-02-11 | 13F | Group One Trading, L.p. | Call | 673.800 | 374,84 | 23.219 | 387,59 | |||
| 2026-02-11 | 13F | Group One Trading, L.p. | Put | 626.900 | 248,08 | 21.603 | 257,41 | |||
| 2026-02-11 | 13F | Group One Trading, L.p. | 32.854 | -48,13 | 1.132 | -46,73 | ||||
| 2026-02-17 | 13F | Quantinno Capital Management LP | 79.223 | 75,21 | 2.730 | 79,96 | ||||
| 2025-11-14 | 13F | Texas Permanent School Fund | 0 | -100,00 | 0 | |||||
| 2026-02-12 | 13F | Dimensional Fund Advisors Lp | 9.085.648 | 13,99 | 313.106 | 17,06 | ||||
| 2025-11-14 | 13F | ExodusPoint Capital Management, LP | 226.139 | -33,79 | 7.589 | 58.276,92 | ||||
| 2026-02-11 | 13F | Los Angeles Capital Management Llc | 1.200 | 36 | ||||||
| 2026-02-06 | 13F | Mraz, Amerine & Associates, Inc. | 150.769 | 1,07 | 5.196 | 3,78 | ||||
| 2026-02-17 | 13F | Covalis Capital Llp | 433.075 | 14.924 | ||||||
| 2026-04-22 | 13F | Peak Planning Group, LLC | 0 | -100,00 | 0 | |||||
| 2026-02-13 | 13F | Acumen Wealth Advisors, LLC | 260 | 9 | ||||||
| 2026-01-29 | 13F | UBS Group AG | Put | 2.500 | -98,08 | 86 | -98,04 | |||
| 2026-01-29 | 13F | UBS Group AG | Call | 1.500 | 0,00 | 52 | 2,00 | |||
| 2026-04-16 | 13F | Evolve Private Wealth, Llc | 5.974 | -28,62 | 254 | -12,15 | ||||
| 2026-01-29 | 13F | UBS Group AG | 937.677 | -47,32 | 32.312 | -45,91 | ||||
| 2026-04-13 | 13F | Massmutual Trust Co Fsb/adv | 610 | -9,50 | 26 | 8,70 | ||||
| 2026-02-17 | 13F | Qube Research & Technologies Ltd | Call | 3.400 | 0,00 | 117 | 2,63 | |||
| 2026-02-17 | 13F | Qube Research & Technologies Ltd | 2.241.345 | -36,83 | 77.237 | -35,14 | ||||
| 2026-02-17 | 13F | MIRAE ASSET GLOBAL ETFS HOLDINGS Ltd. | 8.255 | 284 | ||||||
| 2026-02-10 | 13F | Moors & Cabot, Inc. | 8.655 | 2,55 | 298 | 5,30 | ||||
| 2026-02-12 | 13F | South Dakota Investment Council | 16.858 | -8,67 | 1 | |||||
| 2025-11-14 | 13F | Progeny 3, Inc. | 0 | -100,00 | 0 | |||||
| 2026-04-28 | 13F | Stephens Inc /ar/ | 10.213 | 433 | ||||||
| 2026-01-29 | 13F | State Of Michigan Retirement System | 69.300 | -0,86 | 2.388 | 1,83 | ||||
| 2026-02-17 | 13F | Price T Rowe Associates Inc /md/ | 232.279 | 6,84 | 8 | 14,29 | ||||
| 2026-02-17 | 13F | Maryland State Retirement & Pension System | 14.705 | 0,00 | 507 | 2,64 | ||||
| 2025-11-13 | 13F | Quantitative Investment Management, LLC | 0 | -100,00 | 0 | |||||
| 2026-02-17 | 13F | Tower Research Capital LLC (TRC) | 7.479 | -47,95 | 258 | -46,68 | ||||
| 2026-02-17 | 13F | Balyasny Asset Management Llc | Call | 55.200 | 1.902 | |||||
| 2026-02-17 | 13F | Balyasny Asset Management Llc | Put | 122.400 | 4.218 | |||||
| 2026-02-17 | 13F | Balyasny Asset Management Llc | 1.795.192 | 3.970,73 | 61.862 | 4.082,69 | ||||
| 2026-02-17 | 13F | Oxford Asset Management Llp | 13.136 | -7,55 | 453 | -5,04 | ||||
| 2026-04-29 | 13F | Police & Firemen's Retirement System of New Jersey | 121.819 | 0,00 | 5.170 | 23,16 | ||||
| 2026-02-17 | 13F | Aristeia Capital Llc | 190.989 | -34,68 | 6.581 | -32,94 | ||||
| 2026-02-12 | 13F | CIBC Private Wealth Group, LLC | 753.091 | -17,53 | 25.952 | -15,32 | ||||
| 2026-04-07 | 13F | Park Avenue Securities Llc | 7.105 | 7,29 | 0 | |||||
| 2026-02-13 | 13F | Manufacturers Life Insurance Company, The | 0 | -100,00 | 0 | |||||
| 2026-04-27 | 13F | Portman Square Capital LLP | Call | 0 | -100,00 | 0 | ||||
| 2026-02-05 | 13F | Amalgamated Bank | 133.448 | -0,26 | 5 | 0,00 | ||||
| 2026-04-27 | 13F | Portman Square Capital LLP | Put | 0 | -100,00 | 0 | ||||
| 2026-02-03 | 13F | Crossmark Global Holdings, Inc. | 17.399 | -3,64 | 600 | -0,99 | ||||
| 2026-02-10 | 13F | Sivia Capital Partners, LLC | 10.638 | 367 | ||||||
| 2026-04-07 | 13F | Signaturefd, Llc | 4.210 | -0,64 | 179 | 21,92 | ||||
| 2026-02-13 | 13F | Snowwater Investment Partners, Llc | 7.444 | 257 | ||||||
| 2026-02-04 | 13F | Community Bank, N.A. | 392 | 0,00 | 14 | 0,00 | ||||
| 2026-02-17 | 13F | Concentric Capital Strategies, LP | 0 | -100,00 | 0 | -100,00 | ||||
| 2026-02-11 | 13F | Illinois Municipal Retirement Fund | 25.183 | 868 | ||||||
| 2026-02-17 | 13F | Capital Fund Management S.a. | 398.503 | 103,82 | 13.732 | 109,30 | ||||
| 2026-02-13 | 13F | Neuberger Berman Group LLC | 3.815.524 | 1,45 | 131.485 | 4,17 | ||||
| 2026-02-13 | 13F | Mml Investors Services, Llc | 108.404 | 3.736 | ||||||
| 2026-02-09 | 13F | Waratah Capital Advisors Ltd. | 590.000 | 20.331 | ||||||
| 2026-04-24 | 13F | Strs Ohio | 73.930 | -0,01 | 3.138 | 23,16 | ||||
| 2026-04-15 | 13F | Cypress Wealth Services, LLC | 5.014 | 213 | ||||||
| 2026-02-20 | 13F | Sunbelt Securities, Inc. | 888 | 0,00 | 31 | 3,45 | ||||
| 2026-02-10 | 13F | Rothschild Investment Llc | 7.107 | 0,54 | 245 | 2,95 |