Grundlæggende statistik
| Institutionelle aktier (lange) | 106.514.119 (ex 13D/G) - change of 2,61MM shares 2,51% MRQ |
| Institutionel værdi (lang) | $ 5.693.281 USD ($1000) |
Institutionelt ejerskab og aktionærer
Sunoco LP - Limited Partnership (US:SUN) har 330 institutionelle ejere og aktionærer, der har indsendt 13D/G- eller 13F-formularer til Securities Exchange Commission (SEC). Disse institutioner har i alt 106,514,119 aktier. Største aktionærer omfatter AMLP - ALERIAN MLP ETF, Alps Advisors Inc, Invesco Ltd., Goldman Sachs Group Inc, MLPRX - Invesco Oppenheimer SteelPath MLP Income Fund Class C, MIRAE ASSET GLOBAL ETFS HOLDINGS Ltd., MLPA - Global X MLP ETF, GLPAX - Goldman Sachs MLP Energy Infrastructure Fund Class A Shares, MLPEX - Invesco Oppenheimer SteelPath MLP Select 40 Fund Class C, and Energy Income Partners, LLC .
Sunoco LP - Limited Partnership (NYSE:SUN) institutionel ejerskabsstruktur viser aktuelle positioner i virksomheden efter institutioner og fonde, samt seneste ændringer i positionsstørrelse. Større aktionærer kan omfatte individuelle investorer, investeringsforeninger, hedgefonde eller institutioner. Skema 13D angiver, at investoren besidder (eller besidder) mere end 5 % af virksomheden og har til hensigt (eller har til hensigt at) aktivt at forfølge en ændring i forretningsstrategi. Skema 13G indikerer en passiv investering på over 5%.
The share price as of September 12, 2025 is 50,11 / share. Previously, on September 13, 2024, the share price was 53,50 / share. This represents a decline of 6,34% over that period.

Fondens stemningsscore
Fund Sentiment Score (fka Ownership Accumulation Score) finder de aktier, der bliver mest købt af fonde. Det er resultatet af en sofistikeret, multi-faktor kvantitativ model, der identificerer virksomheder med de højeste niveauer af institutionel akkumulering. Scoringsmodellen bruger en kombination af den samlede stigning i oplyste ejere, ændringerne i porteføljeallokeringer i disse ejere og andre målinger. Tallet går fra 0 til 100, hvor højere tal indikerer et højere niveau af akkumulering for sine jævnaldrende, og 50 er gennemsnittet.
Opdateringsfrekvens: Dagligt
Se Ownership Explorer, som giver en liste over højest rangerende virksomheder.
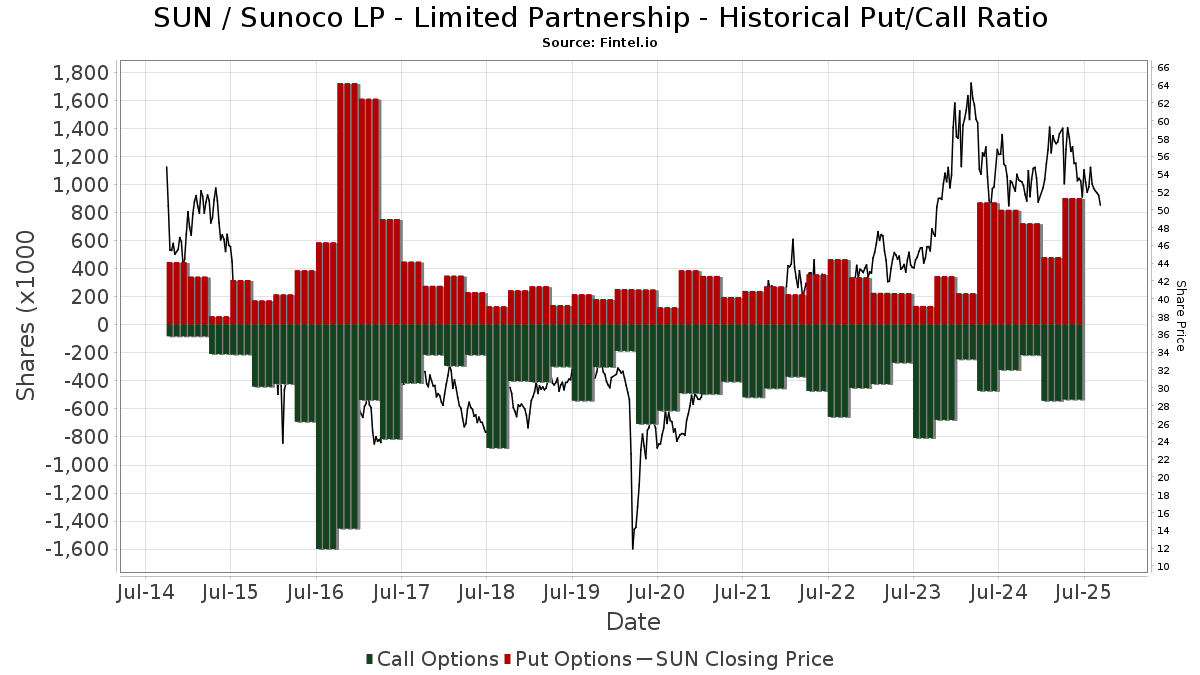
Institutionel Put/Call-forhold
Ud over at indberette standardaktie- og gældsudstedelser skal institutter med mere end 100 mill. aktiver under forvaltning også oplyse deres put- og call-optionsbeholdninger. Da salgsoptioner generelt indikerer negativ stemning, og købsoptioner indikerer positiv stemning, kan vi få en fornemmelse af den overordnede institutionelle stemning ved at plotte forholdet mellem put og kald. Diagrammet til højre viser det historiske put/call-forhold for dette instrument.
Brug af Put/Call Ratio som en indikator for investorernes stemning overvinder en af de vigtigste mangler ved at bruge totalt institutionelt ejerskab, som er, at en betydelig mængde af aktiver under forvaltning investeres passivt for at spore indekser. Passivt forvaltede fonde køber typisk ikke optioner, så indikatoren for put/call-forholdet følger mere nøje følelsen af aktivt forvaltede fonde.
13D/G-arkivering
Vi præsenterer 13D/G ansøgninger separat fra 13F ansøgninger på grund af den forskellige behandling af SEC. 13D/G-ansøgninger kan indgives af grupper af investorer (med én ledende), hvorimod 13F-ansøgninger ikke kan. Dette resulterer i situationer, hvor en investor kan indsende en 13D/G, der rapporterer én værdi for de samlede aktier (der repræsenterer alle de aktier, der ejes af investorgruppen), men derefter indsender en 13F, der rapporterer en anden værdi for de samlede aktier (der udelukkende repræsenterer deres egne) ejendomsret). Det betyder, at aktieejerskab af 13D/G-arkiver og 13F-arkiveringer ofte ikke er direkte sammenlignelige, så vi præsenterer dem separat.
Bemærk: Fra den 16. maj 2021 viser vi ikke længere ejere, der ikke har indsendt en 13D/G inden for det seneste år. Tidligere viste vi den fulde historie af 13D/G-arkiver. Generelt skal enheder, der er forpligtet til at indgive 13D/G-ansøgninger, indgive mindst årligt, før de indsender en afsluttende ansøgning. Dog forlader fonde nogle gange positioner uden at indsende en afsluttende ansøgning (dvs. de afvikler), så visning af den fulde historie resulterede nogle gange i forvirring om det nuværende ejerskab. For at undgå forvirring viser vi nu kun 'aktuelle' ejere - det vil sige - ejere, der har anmeldt inden for det seneste år.
Upgrade to unlock premium data.
| Fil dato | Form | Investor | Forrige Aktier |
Seneste Aktier |
Δ Aktier (Procent) |
Ejendomsret (Procent) |
Δ Ejerskab (Procent) |
|
|---|---|---|---|---|---|---|---|---|
| 2025-07-09 | ALPS ADVISORS INC | 23,132,625 | 23,489,829 | 1.54 | 15.38 | 1.52 | ||
| 2024-11-08 | Invesco Ltd. | 1,227,260 | 8,670,067 | 606.46 | 6.40 | 326.67 |
13F og NPORT arkivering
Detaljer om 13F-arkivering er gratis. Detaljer om NP-ansøgninger kræver et premium-medlemskab. Grønne rækker angiver nye positioner. Røde rækker angiver lukkede positioner. Klik på linket ikon for at se den fulde transaktionshistorik.
Opgrader
for at låse premium-data op og eksportere til Excel ![]() .
.
| Fil dato | Kilde | Investor | Type | Gennemsnitlig pris (Øst) |
Aktier | Δ Aktier (%) |
Rapporteret Værdi ($1000) |
Δ Værdi (%) |
Port Alloc (%) |
|
|---|---|---|---|---|---|---|---|---|---|---|
| 2025-07-08 | 13F | Nbc Securities, Inc. | 266 | 166,00 | 0 | |||||
| 2025-08-04 | 13F | Arkadios Wealth Advisors | 7.399 | 4,15 | 397 | -3,88 | ||||
| 2025-07-31 | 13F | Carnegie Capital Asset Management, LLC | 5.847 | 12,33 | 313 | 15,93 | ||||
| 2025-08-11 | 13F | Annis Gardner Whiting Capital Advisors, LLC | 800 | 0,00 | 43 | -8,70 | ||||
| 2025-08-13 | 13F | MONECO Advisors, LLC | 0 | -100,00 | 0 | -100,00 | ||||
| 2025-06-17 | NP | GSRAX - Goldman Sachs Rising Dividend Growth Fund Class A | 107.226 | -18,63 | 6.235 | -15,99 | ||||
| 2025-05-12 | 13F | Simplex Trading, Llc | 0 | -100,00 | 0 | |||||
| 2025-04-25 | 13F | Kieckhefer Group Llc | 0 | -100,00 | 0 | |||||
| 2025-08-25 | 13F/A | Neuberger Berman Group LLC | 670.269 | 4,00 | 35.920 | -4,01 | ||||
| 2025-07-10 | 13F | Exchange Traded Concepts, Llc | 114.820 | -3,05 | 6.153 | -10,51 | ||||
| 2025-07-14 | 13F | Farmers & Merchants Investments Inc | 257 | 0,00 | 14 | -7,14 | ||||
| 2025-07-07 | 13F | Wealth Alliance Advisory Group, LLC | 0 | -100,00 | 0 | |||||
| 2025-07-29 | 13F | Spirit Of America Management Corp/ny | 13.500 | 0,00 | 723 | -7,66 | ||||
| 2025-08-15 | 13F | Security National Bank Of Sioux City Iowa /ia/ | 7.000 | 0,00 | 375 | -7,64 | ||||
| 2025-08-14 | 13F | Avid Wealth Partners LLC | 6.398 | -59,59 | 343 | -62,79 | ||||
| 2025-08-15 | 13F | CI Private Wealth, LLC | 26.248 | 1.407 | ||||||
| 2025-05-07 | 13F | Sheaff Brock Investment Advisors, LLC | 4.376 | 254 | ||||||
| 2025-08-12 | 13F | MAI Capital Management | 5.587 | 0,05 | 299 | -7,72 | ||||
| 2025-07-21 | 13F | DHJJ Financial Advisors, Ltd. | 500 | 0,00 | 27 | -10,34 | ||||
| 2025-08-08 | 13F | Hartland & Co., LLC | 3.736 | 30,31 | 200 | 20,48 | ||||
| 2025-08-05 | 13F | Key FInancial Inc | 973 | 1,67 | 52 | -5,45 | ||||
| 2025-07-29 | NP | SPMHX - Invesco Oppenheimer SteelPath MLP Alpha Fund Class R5 | 893.961 | 0,00 | 48.220 | -8,28 | ||||
| 2025-08-12 | 13F | Marshall & Sterling Wealth Advisors Inc. | 602 | 0,00 | 32 | -5,88 | ||||
| 2025-08-08 | 13F | Wealth Alliance | 5.561 | 298 | ||||||
| 2025-05-09 | 13F | Delta Financial Group, Inc. | 9.094 | 1 | ||||||
| 2025-08-13 | 13F | Congress Wealth Management LLC / DE / | 19.522 | -0,49 | 1.046 | -7,35 | ||||
| 2025-08-11 | 13F | Principal Securities, Inc. | 1.327 | 163,29 | 71 | 184,00 | ||||
| 2025-07-28 | 13F | BRYN MAWR TRUST Co | 80 | -97,40 | 4 | -97,75 | ||||
| 2025-07-24 | 13F | Us Bancorp \de\ | 18.984 | -12,19 | 1.017 | -18,96 | ||||
| 2025-08-12 | 13F | Journey Strategic Wealth Llc | 10.458 | -14,90 | 560 | -21,46 | ||||
| 2025-08-14 | 13F | Wells Fargo & Company/mn | 161.332 | -14,94 | 8.646 | -21,49 | ||||
| 2025-07-30 | NP | SOAEX - Spirit of America Energy Fund Class A | 13.500 | 0,00 | 728 | -8,20 | ||||
| 2025-07-21 | 13F | Ameriflex Group, Inc. | 1.078 | 0,00 | 57 | -8,06 | ||||
| 2025-06-25 | NP | EIPX - FT Energy Income Partners Strategy ETF | 105.143 | 3,43 | 6.114 | 6,78 | ||||
| 2025-05-06 | 13F | AE Wealth Management LLC | 0 | -100,00 | 0 | -100,00 | ||||
| 2025-07-25 | 13F | Apollon Wealth Management, LLC | 27.349 | -29,99 | 1.466 | -35,38 | ||||
| 2025-08-14 | 13F | IHT Wealth Management, LLC | 10.302 | 2,10 | 552 | -5,64 | ||||
| 2025-08-14 | 13F | Recurrent Investment Advisors LLC | 933.586 | 0,08 | 50.031 | -7,63 | ||||
| 2025-07-28 | 13F | Rosenberg Matthew Hamilton | 1.835 | 98 | ||||||
| 2025-08-13 | 13F | Icon Advisers Inc/co | 0 | -100,00 | 0 | |||||
| 2025-08-13 | 13F | Natixis | 15.100 | -57,05 | 809 | -60,67 | ||||
| 2025-07-17 | 13F | Wolff Wiese Magana Llc | 176 | 162,69 | 9 | 200,00 | ||||
| 2025-08-14 | 13F | Fmr Llc | 24.189 | 13,78 | 1.296 | 5,02 | ||||
| 2025-08-13 | 13F | Cary Street Partner Investment Advisory Llc | 6.116 | 0,00 | 328 | -7,89 | ||||
| 2025-08-14 | 13F | UBS Group AG | 1.151.153 | 12,30 | 61.690 | 3,66 | ||||
| 2025-06-09 | NP | Bmc Fund Inc | 473 | 0,00 | 28 | 3,85 | ||||
| 2025-08-14 | 13F | Group One Trading, L.p. | 0 | -100,00 | 0 | -100,00 | ||||
| 2025-08-12 | 13F | LPL Financial LLC | 190.659 | 3,10 | 10.217 | -4,83 | ||||
| 2025-08-14 | 13F | Group One Trading, L.p. | Put | 3.500 | -38,60 | 188 | -43,33 | |||
| 2025-08-14 | 13F | Group One Trading, L.p. | Call | 82.100 | 1.809,30 | 4.400 | 1.666,67 | |||
| 2025-08-14 | 13F | Bank Of America Corp /de/ | Call | 43.400 | 2.326 | |||||
| 2025-08-14 | 13F | Bank Of America Corp /de/ | 166.822 | 4,94 | 8.940 | -3,14 | ||||
| 2025-06-25 | NP | Duff & Phelps Global Utility Income Fund Inc. | 91.000 | -9,00 | 5.292 | 4,15 | ||||
| 2025-05-12 | 13F | Greenland Capital Management LP | 0 | -100,00 | 0 | -100,00 | ||||
| 2025-08-12 | 13F | Mcdonald Partners Llc | 15.506 | 0,03 | 831 | -7,67 | ||||
| 2025-07-30 | 13F | Green Square Capital Advisors Llc | 7.038 | 0,00 | 377 | -7,60 | ||||
| 2025-08-13 | 13F | Grantham, Mayo, Van Otterloo & Co. LLC | Put | 395.100 | 21.173 | |||||
| 2025-08-14 | 13F | Van Eck Associates Corp | 33.757 | 14,43 | 2 | 0,00 | ||||
| 2025-08-12 | 13F | Advisors Asset Management, Inc. | 50.528 | 2,03 | 2.708 | -5,84 | ||||
| 2025-07-02 | 13F | Crumly & Associates Inc. | 4.711 | 0,00 | 252 | -7,69 | ||||
| 2025-07-29 | 13F | Stephens Inc /ar/ | 6.569 | -13,75 | 352 | -20,36 | ||||
| 2025-08-05 | 13F | Huntington National Bank | 330 | 0,00 | 18 | -10,53 | ||||
| 2025-08-14 | 13F | Clarity Asset Management, Inc. | 400 | 21 | ||||||
| 2025-08-14 | 13F | Dividend Asset Capital, Llc | 21.978 | -13,40 | 1.178 | -20,10 | ||||
| 2025-05-30 | NP | ICBAX - ICON Natural Resources and Infrastructure Fund Investor Class | 56.000 | 55,56 | 3.251 | 75,63 | ||||
| 2025-07-07 | 13F | Thurston, Springer, Miller, Herd & Titak, Inc. | 200 | 11 | ||||||
| 2025-07-29 | 13F | Private Trust Co Na | 650 | 0,00 | 35 | -8,11 | ||||
| 2025-08-14 | 13F | Hrt Financial Lp | 75.133 | 69,77 | 4 | 100,00 | ||||
| 2025-07-21 | 13F | Hudson Valley Investment Advisors Inc /adv | 12.030 | 0,00 | 645 | -7,74 | ||||
| 2025-08-08 | 13F | Avantax Advisory Services, Inc. | 12.721 | -1,48 | 682 | -9,08 | ||||
| 2025-07-17 | 13F | Coastline Trust Co | 180 | 0,00 | 10 | -10,00 | ||||
| 2025-08-01 | 13F | Bessemer Group Inc | 1.360 | 41,67 | 0 | |||||
| 2025-08-14 | 13F | Bnp Paribas Arbitrage, Sa | 8.420 | -15,25 | 451 | -21,70 | ||||
| 2025-07-21 | 13F | Hilltop National Bank | 80 | 0,00 | 4 | 0,00 | ||||
| 2025-07-17 | 13F | Centennial Wealth Advisory LLC | 0 | -100,00 | 0 | |||||
| 2025-07-30 | 13F | Avidian Wealth Solutions, LLC | 6.785 | -1,15 | 364 | -8,79 | ||||
| 2025-08-14 | 13F | Stifel Financial Corp | 32.159 | -66,14 | 1.723 | -68,75 | ||||
| 2025-08-18 | 13F | Wolverine Trading, Llc | Put | 24.700 | 66,89 | 1.341 | 53,08 | |||
| 2025-08-18 | 13F | Wolverine Trading, Llc | 5.988 | 325 | ||||||
| 2025-08-18 | 13F | Wolverine Trading, Llc | Call | 22.800 | 121,36 | 1.238 | 103,28 | |||
| 2025-08-11 | 13F | Pineridge Advisors LLC | 173 | 1,76 | 9 | 0,00 | ||||
| 2025-07-31 | 13F | Waldron Private Wealth LLC | 71.000 | 0,00 | 3.805 | -7,71 | ||||
| 2025-08-19 | 13F | Anchor Investment Management, LLC | 3.000 | 0,00 | 161 | -8,05 | ||||
| 2025-06-30 | NP | INVESCO ACTIVELY MANAGED EXCHANGE-TRADED FUND TRUST - Invesco SteelPath MLP & Energy Infrastructure ETF | 8.340 | 485 | ||||||
| 2025-07-23 | NP | Lmp Capital & Income Fund Inc. | 81.658 | 0,00 | 4.405 | -8,29 | ||||
| 2025-08-04 | 13F | IFG Advisory, LLC | 13.755 | 0,00 | 737 | -7,64 | ||||
| 2025-07-30 | NP | AMLP - ALERIAN MLP ETF | 23.527.894 | 3,79 | 1.269.095 | -4,81 | ||||
| 2025-08-13 | 13F | Lido Advisors, LLC | 0 | -100,00 | 0 | |||||
| 2025-08-04 | 13F | Pensionmark Financial Group, Llc | 4.500 | -6,25 | 241 | -13,31 | ||||
| 2025-08-07 | 13F | Midwest Trust Co | 7.595 | 407 | ||||||
| 2025-08-06 | 13F | Kayne Anderson Capital Advisors Lp | 0 | -100,00 | 0 | |||||
| 2025-05-14 | 13F | Peak6 Llc | Call | 0 | -100,00 | 0 | -100,00 | |||
| 2025-04-21 | 13F | Nelson, Van Denburg & Campbell Wealth Management Group, LLC | 0 | -100,00 | 0 | |||||
| 2025-07-22 | 13F | IMC-Chicago, LLC | Put | 64.800 | 68,31 | 3.473 | 55,35 | |||
| 2025-08-12 | 13F | J.w. Cole Advisors, Inc. | 64.881 | -7,65 | 3.477 | -14,78 | ||||
| 2025-07-22 | 13F | IMC-Chicago, LLC | Call | 19.700 | 24,68 | 1.056 | 15,05 | |||
| 2025-07-31 | 13F | CVA Family Office, LLC | 79 | 0,00 | 4 | 0,00 | ||||
| 2025-08-13 | 13F | Custom Index Systems, Llc | 11.418 | 17,04 | 612 | 7,95 | ||||
| 2025-05-14 | 13F | Peak6 Llc | Put | 0 | -100,00 | 0 | -100,00 | |||
| 2025-08-11 | 13F | Citigroup Inc | 247.417 | 448,45 | 13.259 | 406,26 | ||||
| 2025-07-28 | 13F | Davidson Trust Co | 9.000 | 0,00 | 482 | -7,66 | ||||
| 2025-08-13 | 13F | Townsquare Capital Llc | 0 | -100,00 | 0 | |||||
| 2025-08-15 | 13F | Kestra Advisory Services, LLC | 63.302 | -2,82 | 3.392 | -10,29 | ||||
| 2025-08-13 | 13F | First Trust Advisors Lp | 45.761 | -42,73 | 2.452 | -47,13 | ||||
| 2025-08-14 | 13F | Two Sigma Securities, Llc | 5.684 | 305 | ||||||
| 2025-08-14 | 13F | Vivaldi Asset Management, LLC | 3.926 | 210 | ||||||
| 2025-08-14 | 13F | GWM Advisors LLC | 7.088 | 226,18 | 380 | 200,79 | ||||
| 2025-07-30 | 13F | Studio Investment Management Llc | 0 | -100,00 | 0 | |||||
| 2025-08-08 | 13F | Creative Planning | 36.641 | 0,11 | 1.964 | -7,62 | ||||
| 2025-06-25 | NP | SMLPX - Westwood Salient MLP & Energy Infrastructure Fund Institutional Shares | 0 | -100,00 | 0 | -100,00 | ||||
| 2025-07-18 | 13F | Truist Financial Corp | 0 | -100,00 | 0 | |||||
| 2025-08-12 | 13F | Steward Partners Investment Advisory, Llc | 1.058 | 0,00 | 57 | -8,20 | ||||
| 2025-08-12 | 13F | Bowen Hanes & Co Inc | 600.000 | 0,00 | 32.154 | -7,70 | ||||
| 2025-08-12 | 13F | Jpmorgan Chase & Co | 771.976 | -54,41 | 41.370 | -57,92 | ||||
| 2025-08-04 | 13F | Flagship Harbor Advisors, Llc | 0 | -100,00 | 0 | |||||
| 2025-06-25 | NP | AMZA - InfraCap MLP ETF | 1.000.764 | -19,97 | 58.194 | -17,38 | ||||
| 2025-08-18 | 13F | Geneos Wealth Management Inc. | 233 | 1,75 | 12 | -7,69 | ||||
| 2025-07-21 | 13F | Monticello Wealth Management, Llc | 4.674 | 0,73 | 251 | -7,06 | ||||
| 2025-08-14 | 13F | Great Valley Advisor Group, Inc. | 0 | -100,00 | 0 | |||||
| 2025-05-05 | 13F | Eagle Bay Advisors LLC | 0 | -100,00 | 0 | -100,00 | ||||
| 2025-08-11 | 13F | Private Advisor Group, LLC | 21.154 | -42,12 | 1.134 | -46,61 | ||||
| 2025-08-18 | 13F | Castleark Management Llc | 27.840 | 0,00 | 1.492 | -7,74 | ||||
| 2025-07-11 | 13F | Farther Finance Advisors, LLC | 6.213 | 185,39 | 333 | 161,42 | ||||
| 2025-07-18 | 13F | Liberty Capital Management, Inc. | 4.384 | 0,00 | 235 | -7,87 | ||||
| 2025-08-14 | 13F | Talon Private Wealth, LLC | 2.050 | 110 | ||||||
| 2025-07-08 | 13F | Parallel Advisors, LLC | 671 | 1,36 | 36 | -7,89 | ||||
| 2025-07-11 | 13F/A | Umb Bank N A/mo | 90 | 0,00 | 5 | -20,00 | ||||
| 2025-08-08 | 13F | Citizens Financial Group Inc/ri | 4.639 | 0,00 | 249 | -7,81 | ||||
| 2025-08-12 | 13F | Barr E S & Co | 0 | -100,00 | 0 | |||||
| 2025-08-13 | 13F | Summit Financial, LLC | 93.181 | 0,00 | 4.994 | -7,71 | ||||
| 2025-07-23 | NP | EIPI - FT Energy Income Partners Enhanced Income ETF | 256.448 | -1,27 | 13.833 | -9,45 | ||||
| 2025-08-12 | 13F | Jaffetilchin Investment Partners, LLC | 6.883 | -0,68 | 369 | -8,46 | ||||
| 2025-07-25 | 13F | Concurrent Investment Advisors, LLC | 0 | -100,00 | 0 | |||||
| 2025-07-29 | 13F | Oxbow Advisors, LLC | 10.595 | 32,44 | 568 | 22,20 | ||||
| 2025-05-15 | 13F | Virtus Investment Advisers, Inc. | 0 | -100,00 | 0 | |||||
| 2025-08-14 | 13F | Wiley Bros.-aintree Capital, Llc | 4.665 | 5,07 | 250 | -4,58 | ||||
| 2025-07-28 | 13F | Allianz Asset Management GmbH | 146.300 | -51,95 | 7.840 | -55,65 | ||||
| 2025-08-05 | 13F | Sigma Planning Corp | 16.306 | -10,90 | 874 | -17,80 | ||||
| 2025-07-31 | 13F | Richards, Merrill & Peterson, Inc. | 0 | -100,00 | 0 | |||||
| 2025-08-14 | 13F | Cooperman Leon G | 1.470.000 | 415,79 | 78.777 | 376,08 | ||||
| 2025-08-13 | 13F | Brown Advisory Inc | 12.174 | 10,95 | 652 | 2,35 | ||||
| 2025-08-01 | 13F | Envestnet Asset Management Inc | 31.266 | -4,10 | 1.676 | -11,47 | ||||
| 2025-08-06 | 13F | Commonwealth Equity Services, Llc | 33.750 | 6,02 | 2 | 0,00 | ||||
| 2025-07-10 | 13F | Focus Financial Network, Inc. | 19.200 | 10,64 | 1.029 | 2,09 | ||||
| 2025-06-25 | NP | CFLGX - ClearBridge Tactical Dividend Income Fund Class A This fund is a listed as child fund of Clearbridge, Llc and if that institution has disclosed ownership in this security, then these positions will not be double counted when calculating total shares and total value | 32.166 | 0,00 | 1.870 | 3,26 | ||||
| 2025-07-21 | 13F | Quent Capital, LLC | 0 | -100,00 | 0 | |||||
| 2025-07-25 | 13F | We Are One Seven, LLC | 6.566 | -36,59 | 352 | -41,60 | ||||
| 2025-07-23 | 13F | Cohen Capital Management, Inc. | 8.210 | 0,00 | 440 | -7,77 | ||||
| 2025-07-24 | 13F | IFP Advisors, Inc | 2.014 | -29,70 | 108 | -35,54 | ||||
| 2025-08-11 | 13F | Cornerstone Planning Group LLC | 909 | 49 | ||||||
| 2025-07-25 | 13F | Cwm, Llc | 392 | 3,70 | 0 | |||||
| 2025-07-25 | 13F | Cypress Capital Group | 8.620 | 462 | ||||||
| 2025-07-23 | 13F | PARK CIRCLE Co | 36.350 | 0,00 | 1.948 | -7,73 | ||||
| 2025-07-29 | 13F | Kanawha Capital Management Llc | 3.800 | 0,00 | 204 | -7,73 | ||||
| 2025-08-26 | NP | FIRST TRUST VARIABLE INSURANCE TRUST - First Trust Multi Income Allocation Portfolio Class I This fund is a listed as child fund of First Trust Advisors Lp and if that institution has disclosed ownership in this security, then these positions will not be double counted when calculating total shares and total value | 668 | 5,03 | 36 | -2,78 | ||||
| 2025-08-05 | 13F | Simplex Trading, Llc | Put | 5.300 | -71,20 | 0 | -100,00 | |||
| 2025-08-13 | 13F | Rudius Management LP | 33 | 0,00 | 2 | 0,00 | ||||
| 2025-08-05 | 13F | Simplex Trading, Llc | Call | 4.100 | -74,38 | 0 | ||||
| 2025-07-14 | 13F | U.S. Capital Wealth Advisors, LLC | 9.996 | 7,87 | 536 | -0,56 | ||||
| 2025-07-24 | 13F | Baldwin Brothers Inc/ma | 11.360 | 0,00 | 609 | -7,74 | ||||
| 2025-08-14 | 13F | Clark Capital Management Group, Inc. | 5.500 | 295 | ||||||
| 2025-08-08 | 13F | Kingsview Wealth Management, LLC | 9.584 | 0,58 | 514 | -7,23 | ||||
| 2025-07-28 | NP | Neuberger Berman Mlp Income Fund Inc. | 420.000 | 0,00 | 22.655 | -8,28 | ||||
| 2025-08-13 | 13F | Transce3nd, LLC | 376 | 0,00 | 20 | -4,76 | ||||
| 2025-08-14 | 13F | Susquehanna Fundamental Investments, Llc | 35.402 | -64,49 | 1.897 | -67,22 | ||||
| 2025-08-08 | 13F | Compass Wealth Management LLC | 0 | -100,00 | 0 | |||||
| 2025-07-29 | NP | OSPPX - Invesco Oppenheimer SteelPath MLP Alpha Plus Fund Class R6 | 366.903 | -0,80 | 19.791 | -9,02 | ||||
| 2025-08-01 | 13F | Boyd Watterson Asset Management Llc/oh | 146 | 0,00 | 8 | -12,50 | ||||
| 2025-05-30 | NP | FLDZ - RiverNorth Patriot ETF | 252 | 6,33 | 15 | 16,67 | ||||
| 2025-08-14 | 13F | Sunbelt Securities, Inc. | 231 | 0,00 | 12 | -15,38 | ||||
| 2025-07-23 | 13F | Kingswood Wealth Advisors, Llc | 0 | -100,00 | 0 | -100,00 | ||||
| 2025-08-04 | 13F | L.m. Kohn & Company | 5.400 | 0,00 | 289 | -7,67 | ||||
| 2025-07-28 | 13F | Private Wealth Asset Management, LLC | 406 | 0,00 | 22 | -8,70 | ||||
| 2025-08-14 | 13F | IPG Investment Advisors LLC | 0 | -100,00 | 0 | |||||
| 2025-07-30 | 13F | Gables Capital Management Inc. | 40 | 0,00 | 2 | 0,00 | ||||
| 2025-08-14 | 13F | Financial Network Wealth Advisors LLC | 98 | 0,00 | 5 | 0,00 | ||||
| 2025-08-14 | 13F | Mercer Global Advisors Inc /adv | 6.901 | 22,34 | 370 | 12,84 | ||||
| 2025-07-31 | 13F | Oppenheimer & Co Inc | 7.365 | 0,00 | 395 | -7,73 | ||||
| 2025-08-06 | 13F | Ing Groep Nv | 183.100 | -33,66 | 9.812 | -38,77 | ||||
| 2025-07-30 | 13F | D.a. Davidson & Co. | 4.631 | 2,21 | 248 | -5,70 | ||||
| 2025-08-14 | 13F | Kovitz Investment Group Partners, LLC | 11.798 | 0,00 | 632 | -7,74 | ||||
| 2025-08-19 | 13F | Newbridge Financial Services Group, Inc. | 4.243 | 3,19 | 227 | -4,62 | ||||
| 2025-08-14 | 13F | Glen Eagle Advisors, LLC | 143 | 0,00 | 8 | -12,50 | ||||
| 2025-08-18 | 13F/A | National Bank Of Canada /fi/ | 103 | 0,00 | 6 | 0,00 | ||||
| 2025-08-12 | 13F | Global Retirement Partners, LLC | 1.633 | 0,00 | 88 | 3,57 | ||||
| 2025-09-02 | NP | EIPIX - EIP Growth and Income Fund Class I | 28.320 | 0,00 | 1.566 | -4,86 | ||||
| 2025-08-07 | 13F | King Luther Capital Management Corp | 6.143 | 0,00 | 329 | -7,58 | ||||
| 2025-07-25 | 13F | Atria Wealth Solutions, Inc. | 0 | -100,00 | 0 | |||||
| 2025-08-12 | 13F | Garrett Wealth Advisory Group, LLC | 4.933 | 0,00 | 264 | -7,69 | ||||
| 2025-08-04 | 13F | Assetmark, Inc | 190 | 90,00 | 10 | 100,00 | ||||
| 2025-07-22 | 13F | DAVENPORT & Co LLC | 0 | -100,00 | 0 | |||||
| 2025-07-24 | 13F | Cascade Investment Group, Inc. | 24.875 | -2,36 | 1.333 | -9,87 | ||||
| 2025-08-14 | 13F | Icon Wealth Advisors, LLC | 2.443 | 19,23 | 131 | 10,17 | ||||
| 2025-07-17 | 13F | Independence Bank of Kentucky | 1.022 | 0,00 | 55 | -8,47 | ||||
| 2025-08-05 | 13F | Bank of New York Mellon Corp | 4.919 | 14,98 | 264 | 6,05 | ||||
| 2025-08-14 | 13F | Hilltop Holdings Inc. | 11.937 | -1,88 | 640 | -9,49 | ||||
| 2025-06-25 | NP | VLPAX - Virtus Duff & Phelps Select MLP and Energy Fund Class A | 22.263 | 86,08 | 1.295 | 92,27 | ||||
| 2025-08-11 | 13F | Independent Advisor Alliance | 9.254 | 13,57 | 496 | 4,65 | ||||
| 2025-08-11 | 13F | HighTower Advisors, LLC | 24.587 | -4,40 | 1.318 | -11,79 | ||||
| 2025-08-28 | NP | Amplify ETF Trust - Amplify Natural Resources Dividend Income ETF | 1.824 | -64,66 | 98 | -67,56 | ||||
| 2025-07-21 | NP | GLPAX - Goldman Sachs MLP Energy Infrastructure Fund Class A Shares | 2.409.916 | -11,38 | 129.991 | -18,72 | ||||
| 2025-07-30 | NP | ALTY - Global X SuperDividend Alternatives ETF This fund is a listed as child fund of Mirae Asset Global Investments Co., Ltd. and if that institution has disclosed ownership in this security, then these positions will not be double counted when calculating total shares and total value | 8.305 | 4,02 | 448 | -4,69 | ||||
| 2025-08-26 | NP | MDIV - Multi-Asset Diversified Income Index Fund This fund is a listed as child fund of First Trust Advisors Lp and if that institution has disclosed ownership in this security, then these positions will not be double counted when calculating total shares and total value | 45.759 | -42,73 | 2.452 | -47,13 | ||||
| 2025-07-21 | 13F | Patriot Financial Group Insurance Agency, LLC | 4.856 | -2,78 | 260 | -10,03 | ||||
| 2025-07-11 | 13F | Miller Howard Investments Inc /ny | 691.096 | 0,56 | 37.036 | -7,18 | ||||
| 2025-08-07 | 13F | American Financial Group Inc | 19.500 | 0,00 | 1.045 | -7,69 | ||||
| 2025-08-14 | 13F | Caption Management, LLC | Put | 28.000 | 0,00 | 1.501 | -7,69 | |||
| 2025-05-01 | 13F | High Note Wealth, LLC | 0 | -100,00 | 0 | |||||
| 2025-07-24 | 13F | Lee Financial Co | 3.819 | 205 | ||||||
| 2025-05-14 | 13F | Caitlin John, LLC | 0 | -100,00 | 0 | |||||
| 2025-07-29 | 13F | Stratos Wealth Partners, LTD. | 9.559 | -0,84 | 512 | -8,41 | ||||
| 2025-07-18 | 13F | PFG Investments, LLC | 5.671 | -14,82 | 304 | -21,50 | ||||
| 2025-04-14 | NP | TPYP - Tortoise North American Pipeline Fund | 128.241 | 2,72 | 7.542 | 6,98 | ||||
| 2025-08-05 | 13F | GPS Wealth Strategies Group, LLC | 685 | -44,94 | 37 | -50,00 | ||||
| 2025-08-14 | 13F | Citadel Advisors Llc | 0 | -100,00 | 0 | |||||
| 2025-07-09 | 13F | Gilman Hill Asset Management, LLC | 23.009 | 23,21 | 1.233 | 13,75 | ||||
| 2025-08-14 | 13F | Jane Street Group, Llc | 46.783 | 672,38 | 2.507 | 614,25 | ||||
| 2025-08-06 | 13F | Moors & Cabot, Inc. | 15.424 | 0,00 | 827 | -7,71 | ||||
| 2025-08-08 | 13F | Cetera Investment Advisers | 35.902 | 7,21 | 1.924 | -1,08 | ||||
| 2025-07-29 | 13F | Uhlmann Price Securities, Llc | 8.786 | -10,24 | 471 | -17,25 | ||||
| 2025-07-10 | 13F | Wealth Enhancement Advisory Services, Llc | 41.101 | 681,09 | 2.262 | 641,31 | ||||
| 2025-08-07 | 13F | CENTRAL TRUST Co | 560 | 0,00 | 30 | -6,25 | ||||
| 2025-07-22 | 13F | Capital Advisors Inc/ok | 7.258 | 0,47 | 389 | -7,40 | ||||
| 2025-07-23 | 13F | Ellsworth Advisors, LLC | 34.565 | 10,28 | 1.852 | 1,81 | ||||
| 2025-08-15 | 13F | Tower Research Capital LLC (TRC) | 227 | -78,09 | 12 | -80,00 | ||||
| 2025-08-14 | 13F | Jane Street Group, Llc | Call | 81.000 | 62,00 | 4.341 | 49,50 | |||
| 2025-08-06 | 13F | First Horizon Advisors, Inc. | 57 | -79,79 | 3 | -81,25 | ||||
| 2025-08-14 | 13F | Jane Street Group, Llc | Put | 35.100 | -71,25 | 1.881 | -73,47 | |||
| 2025-08-26 | NP | AZBAX - AllianzGI Small-Cap Fund Class A | 4.380 | 0,00 | 235 | -7,87 | ||||
| 2025-08-14 | 13F | RMB Capital Management, LLC | 4.809 | 258 | ||||||
| 2025-08-14 | 13F | Snowden Capital Advisors LLC | 5.233 | 1,95 | 280 | -6,04 | ||||
| 2025-07-30 | 13F | Cullen/frost Bankers, Inc. | 1.955 | 0,00 | 105 | -7,96 | ||||
| 2025-08-14 | 13F | McIlrath & Eck, LLC | 3.436 | 0,20 | 184 | -7,54 | ||||
| 2025-08-13 | 13F | Basso Capital Management, L.p. | 5.680 | 0,00 | 304 | -7,60 | ||||
| 2025-08-13 | 13F | Virtus ETF Advisers LLC | 0 | -100,00 | 0 | |||||
| 2025-05-13 | 13F | UBS Group AG | Call | 0 | -100,00 | 0 | -100,00 | |||
| 2025-08-15 | 13F | Captrust Financial Advisors | 41.789 | -1,06 | 2.239 | -8,69 | ||||
| 2025-08-12 | 13F | Longfellow Investment Management Co Llc | 574 | 0,00 | 31 | -9,09 | ||||
| 2025-08-14 | 13F | Royal Bank Of Canada | 158.961 | -0,10 | 8.518 | -7,80 | ||||
| 2025-06-25 | NP | EMLP - First Trust North American Energy Infrastructure Fund This fund is a listed as child fund of First Trust Advisors Lp and if that institution has disclosed ownership in this security, then these positions will not be double counted when calculating total shares and total value | 1.143.935 | 6,62 | 66.520 | 10,07 | ||||
| 2025-08-28 | NP | Elevation Series Trust - RiverNorth Patriot ETF | 305 | 16 | ||||||
| 2025-08-13 | 13F | Cresset Asset Management, LLC | 0 | -100,00 | 0 | |||||
| 2025-08-14 | 13F | Tortoise Capital Advisors, L.l.c. | 1.404.738 | 15,75 | 75.280 | 6,84 | ||||
| 2025-05-29 | NP | CPAEX - Counterpoint Tactical Equity Fund Class A Shares | 6.386 | 7,53 | 371 | 21,31 | ||||
| 2025-07-15 | 13F | Retirement Income Solutions, Inc | 0 | -100,00 | 0 | |||||
| 2025-05-15 | 13F | CAPROCK Group, Inc. | 12.152 | 9,83 | 706 | 23,90 | ||||
| 2025-08-12 | 13F | Virtu Financial LLC | 12.752 | 1 | ||||||
| 2025-08-14 | 13F | Raymond James Financial Inc | 365.953 | 5,47 | 19.611 | -2,65 | ||||
| 2025-07-25 | 13F | M.e. Allison & Co., Inc. | 11.745 | 0,00 | 629 | -7,64 | ||||
| 2025-08-13 | 13F | Jump Financial, LLC | 0 | -100,00 | 0 | |||||
| 2025-08-14 | 13F | TCG Advisory Services, LLC | 206.606 | -0,11 | 11.072 | -7,80 | ||||
| 2025-07-21 | 13F | Ameritas Advisory Services, LLC | 5.187 | 3,86 | 278 | 0,36 | ||||
| 2025-06-30 | NP | CVY - Invesco Zacks Multi-Asset Income ETF This fund is a listed as child fund of Invesco Ltd. and if that institution has disclosed ownership in this security, then these positions will not be double counted when calculating total shares and total value | 13.708 | -11,16 | 797 | -8,29 | ||||
| 2025-07-22 | 13F | Chung Wu Investment Group, LLC | 1.800 | 96 | ||||||
| 2025-08-06 | 13F | Atlantic Union Bankshares Corp | 11 | 1 | ||||||
| 2025-07-29 | NP | MLPEX - Invesco Oppenheimer SteelPath MLP Select 40 Fund Class C | 1.937.652 | -5,60 | 104.517 | -13,42 | ||||
| 2025-08-12 | 13F | PSI Advisors, LLC | 9.220 | 0,11 | 494 | -7,49 | ||||
| 2025-08-11 | 13F | Alps Advisors Inc | 23.489.829 | 1,54 | 1.258.820 | -6,27 | ||||
| 2025-08-18 | 13F/A | Westwood Holdings Group Inc | 29.030 | 13,42 | 1.556 | 4,64 | ||||
| 2025-08-13 | 13F | Northern Trust Corp | 4.278 | -5,02 | 229 | -12,26 | ||||
| 2025-04-29 | 13F | CoreFirst Bank & Trust | 0 | -100,00 | 0 | |||||
| 2025-07-22 | 13F | Kercheville Advisors, LLC | 154.080 | 0,00 | 8.257 | -7,69 | ||||
| 2025-08-07 | 13F | Alpha Cubed Investments, LLC | 0 | -100,00 | 0 | |||||
| 2025-08-15 | 13F | Morgan Stanley | 1.110.476 | -4,57 | 59.510 | -11,92 | ||||
| 2025-08-08 | 13F | Sittner & Nelson, Llc | 5.000 | 0,00 | 268 | -7,93 | ||||
| 2025-08-14 | 13F | Warren Averett Asset Management, LLC | 77.701 | 4,19 | 4.164 | -3,83 | ||||
| 2025-08-13 | 13F | Johnson Financial Group, Inc. | 1.200 | 0,00 | 64 | -7,25 | ||||
| 2025-08-19 | 13F | State of Wyoming | 2.080 | 111 | ||||||
| 2025-08-06 | 13F | Wedbush Securities Inc | 9.483 | -9,26 | 1 | |||||
| 2025-08-12 | 13F | Tradition Wealth Management, LLC | 9.840 | 0,57 | 527 | -7,22 | ||||
| 2025-07-11 | 13F | Caldwell Securities, Inc | 261 | 0,00 | 14 | -13,33 | ||||
| 2025-07-23 | 13F | Sachetta, LLC | 0 | -100,00 | 0 | |||||
| 2025-08-29 | NP | PIMCO Energy & Tactical Credit Opportunities Fund | 146.300 | -48,90 | 7.840 | -52,83 | ||||
| 2025-07-28 | 13F | Bridges Investment Management Inc | 4.927 | 0,00 | 264 | -7,69 | ||||
| 2025-08-14 | 13F | Citadel Advisors Llc | Call | 174.100 | -4,97 | 9.330 | -12,28 | |||
| 2025-08-14 | 13F | Citadel Advisors Llc | Put | 44.100 | -47,00 | 2.363 | -51,08 | |||
| 2025-08-13 | 13F | M&t Bank Corp | 13.106 | 0,00 | 702 | -7,63 | ||||
| 2025-08-14 | 13F | Barnett & Company, Inc. | 42.333 | 0,00 | 2.269 | -7,69 | ||||
| 2025-08-11 | 13F | Summit Wealth Partners, LLC | 0 | -100,00 | 0 | |||||
| 2025-08-14 | 13F/A | Rockefeller Capital Management L.P. | 14.976 | 13,14 | 803 | 4,43 | ||||
| 2025-09-04 | 13F/A | Advisor Group Holdings, Inc. | 56.245 | -8,16 | 3.014 | -15,22 | ||||
| 2025-08-14 | 13F | Benjamin Edwards Inc | 7.741 | 0,00 | 415 | -7,80 | ||||
| 2025-08-08 | 13F | Good Life Advisors, LLC | 8.151 | 2,05 | 437 | -5,83 | ||||
| 2025-03-25 | 13F | Arrow Investment Advisors, LLC | 0 | -100,00 | 0 | |||||
| 2025-07-29 | 13F | Empirical Asset Management, LLC | 28.505 | 0,00 | 1.528 | -7,73 | ||||
| 2025-07-31 | 13F | CNB Bank | 500 | 0,00 | 27 | -10,34 | ||||
| 2025-08-14 | 13F | EP Wealth Advisors, Inc. | 8.886 | 3,45 | 476 | -4,42 | ||||
| 2025-06-26 | NP | HFCGX - Hennessy Cornerstone Growth Fund Investor Class | 125.100 | 7.275 | ||||||
| 2025-04-14 | NP | TORIX - Tortoise MLP & Pipeline Fund Institutional Class Shares | 650.759 | 0,00 | 38.271 | 4,16 | ||||
| 2025-07-22 | 13F | Wealthcare Advisory Partners LLC | 10.063 | 0,56 | 539 | -7,23 | ||||
| 2025-08-08 | 13F | Avalon Trust Co | 500 | 0,00 | 27 | -10,34 | ||||
| 2025-08-18 | 13F | Front Row Advisors LLC | 1.350 | 0,00 | 72 | -7,69 | ||||
| 2025-08-08 | 13F | Pnc Financial Services Group, Inc. | 17.755 | 0,74 | 951 | -7,04 | ||||
| 2025-08-04 | 13F | ELCO Management Co., LLC | 26.185 | 0,36 | 1.403 | -7,33 | ||||
| 2025-08-14 | 13F | Goldman Sachs Group Inc | 6.504.694 | -0,29 | 348.587 | -7,96 | ||||
| 2025-06-30 | NP | RMLPX - Recurrent MLP & Infrastructure Fund Class I | 883.988 | 10,36 | 51.404 | 13,93 | ||||
| 2025-07-31 | 13F | Cambridge Investment Research Advisors, Inc. | 24.423 | -3,21 | 1 | 0,00 | ||||
| 2025-08-07 | 13F | Allworth Financial LP | 5.235 | 465,95 | 281 | 418,52 | ||||
| 2025-06-26 | NP | BlackRock Funds II - BLACKROCK MULTI-ASSET INCOME PORTFOLIO INVESTOR C SHARES | 16.653 | 0,00 | 968 | 3,20 | ||||
| 2025-07-14 | 13F | Armstrong Advisory Group, Inc | 211 | 2,93 | 11 | 10,00 | ||||
| 2025-08-07 | 13F | HighPoint Advisor Group LLC | 5.584 | 23,16 | 299 | 11,57 | ||||
| 2025-07-09 | 13F | Byrne Asset Management LLC | 200 | 0,00 | 11 | -9,09 | ||||
| 2025-08-01 | 13F | Rossby Financial, LCC | 200 | 0,00 | 11 | -9,09 | ||||
| 2025-08-14 | 13F | MIRAE ASSET GLOBAL ETFS HOLDINGS Ltd. | 2.805.106 | -5,81 | 150.326 | -13,06 | ||||
| 2025-08-14 | 13F | Susquehanna International Group, Llp | Put | 291.200 | 70,29 | 15.605 | 57,18 | |||
| 2025-08-14 | 13F | Susquehanna International Group, Llp | 51.467 | 258,93 | 2.758 | 231,49 | ||||
| 2025-07-29 | 13F | International Assets Investment Management, Llc | 11.061 | -1,70 | 593 | -9,34 | ||||
| 2025-08-14 | 13F | Susquehanna International Group, Llp | Call | 104.500 | -59,90 | 5.600 | -62,99 | |||
| 2025-08-14 | 13F | Glenmede Investment Management, LP | 38.800 | 2.079 | ||||||
| 2025-08-11 | 13F | Hexagon Capital Partners LLC | 0 | -100,00 | 0 | |||||
| 2025-08-18 | 13F | N.E.W. Advisory Services LLC | 181 | 0,00 | 10 | -10,00 | ||||
| 2025-07-14 | 13F | Counterpoint Mutual Funds LLC | 0 | -100,00 | 0 | |||||
| 2025-07-28 | 13F | Harbour Investments, Inc. | 530 | 0,00 | 28 | -6,67 | ||||
| 2025-08-13 | 13F | Finer Wealth Management, Inc. | 32.942 | 2,68 | 1.765 | -5,21 | ||||
| 2025-08-04 | 13F | Keybank National Association/oh | 0 | -100,00 | 0 | |||||
| 2025-08-14 | 13F | Blackstone Group Inc | 1.796.281 | 2,38 | 96.263 | -5,51 | ||||
| 2025-07-24 | NP | FSDIX - Fidelity Strategic Dividend & Income Fund This fund is a listed as child fund of Fmr Llc and if that institution has disclosed ownership in this security, then these positions will not be double counted when calculating total shares and total value | 21.989 | 3,43 | 1.186 | -5,12 | ||||
| 2025-05-16 | 13F | Coppell Advisory Solutions LLC | 0 | -100,00 | 0 | |||||
| 2025-07-10 | 13F | Chickasaw Capital Management Llc | 144.429 | 4,66 | 8 | -12,50 | ||||
| 2025-08-14 | 13F/A | Barclays Plc | 444.238 | 35.410,63 | 24 | |||||
| 2025-08-06 | 13F | Ethos Financial Group, LLC | 4.142 | -46,74 | 222 | -51,00 | ||||
| 2025-04-21 | 13F | ORG Partners LLC | 0 | -100,00 | 0 | |||||
| 2025-07-29 | NP | Tortoise Capital Series Trust - Tortoise Energy Infrastructure Total Return Fund A Class | 609.557 | 32.880 | ||||||
| 2025-08-12 | 13F | Inscription Capital, LLC | 3.740 | -31,69 | 200 | -39,39 | ||||
| 2025-08-08 | 13F | Larson Financial Group LLC | 300 | 16 | ||||||
| 2025-08-15 | 13F | Resources Management Corp /ct/ /adv | 1.780 | 0,00 | 0 | |||||
| 2025-07-18 | 13F | Bartlett & Co. Wealth Management Llc | 330 | 0,00 | 18 | -10,53 | ||||
| 2025-08-14 | 13F | Infrastructure Capital Advisors, Llc | 982.653 | 231,48 | 52.660 | 558,41 | ||||
| 2025-07-28 | 13F | WealthPLAN Partners, LLC | 7.214 | 0,14 | 387 | -7,66 | ||||
| 2025-08-12 | 13F | Clearbridge Investments, LLC | 662.929 | -3,28 | 35.526 | -10,73 | ||||
| 2025-08-13 | 13F | Baird Financial Group, Inc. | 16.266 | -2,14 | 872 | -9,74 | ||||
| 2025-07-07 | 13F | Global Wealth Strategies & Associates | 33 | 0,00 | 2 | 0,00 | ||||
| 2025-08-13 | 13F | Invesco Ltd. | 9.080.481 | -0,93 | 486.623 | -8,56 | ||||
| 2025-08-13 | 13F | EverSource Wealth Advisors, LLC | 1.884 | 0,00 | 101 | -8,26 | ||||
| 2025-08-14 | 13F | Toroso Investments, LLC | 0 | -100,00 | 0 | |||||
| 2025-08-13 | 13F | Cary Street Partners Financial Llc | 16.119 | 0,00 | 864 | -7,70 | ||||
| 2025-08-14 | 13F | Mariner, LLC | 49.524 | 37,14 | 2.654 | 26,62 | ||||
| 2025-07-23 | NP | Clearbridge Energy Mlp Opportunity Fund Inc. This fund is a listed as child fund of Clearbridge, Llc and if that institution has disclosed ownership in this security, then these positions will not be double counted when calculating total shares and total value | 409.772 | -5,21 | 22.103 | -13,05 | ||||
| 2025-08-11 | 13F | HHM Wealth Advisors, LLC | 1.200 | 0,00 | 64 | -7,25 | ||||
| 2025-07-07 | 13F | Fractal Investments LLC | 616.542 | 11,54 | 33.040 | 2,95 | ||||
| 2025-07-30 | NP | MLPA - Global X MLP ETF This fund is a listed as child fund of Mirae Asset Global Investments Co., Ltd. and if that institution has disclosed ownership in this security, then these positions will not be double counted when calculating total shares and total value | 2.783.223 | -5,86 | 150.127 | -13,66 | ||||
| 2025-07-28 | 13F | Mutual Advisors, LLC | 4.622 | 0,02 | 247 | -9,19 | ||||
| 2025-08-12 | 13F | Park Square Financial Group, LLC | 380 | 0,00 | 20 | -9,09 | ||||
| 2025-08-12 | 13F | Willis Investment Counsel | 4.883 | 0,00 | 262 | -7,77 | ||||
| 2025-05-15 | 13F | Nomura Holdings Inc | 0 | -100,00 | 0 | |||||
| 2025-08-12 | 13F | Proequities, Inc. | Put | 0 | 0 | |||||
| 2025-08-12 | 13F | Proequities, Inc. | Call | 0 | 0 | |||||
| 2025-05-12 | 13F | Sandy Spring Bank | 11 | 0,00 | 1 | |||||
| 2025-08-12 | 13F | Proequities, Inc. | 0 | 0 | ||||||
| 2025-07-29 | NP | Tortoise Capital Series Trust - TORTOISE NORTH AMERICAN PIPELINE FUND | 114.989 | 6.203 | ||||||
| 2025-08-13 | 13F | Nbw Capital Llc | 76.009 | 1,92 | 4.073 | -5,91 | ||||
| 2025-08-14 | 13F | Abound Financial, Llc | 0 | -100,00 | 0 | |||||
| 2025-08-01 | 13F | Financial Counselors Inc | 0 | -100,00 | 0 | |||||
| 2025-07-30 | 13F | Whittier Trust Co Of Nevada Inc | 50.351 | -30,24 | 2.698 | -35,61 | ||||
| 2025-05-08 | 13F | Gsa Capital Partners Llp | 0 | -100,00 | 0 | |||||
| 2025-08-14 | 13F | Css Llc/il | Put | 12.500 | 670 | |||||
| 2025-04-28 | 13F | Strategic Financial Concepts, LLC | 0 | -100,00 | 0 | -100,00 | ||||
| 2025-07-29 | NP | MLPRX - Invesco Oppenheimer SteelPath MLP Income Fund Class C | 5.854.810 | 1,74 | 315.808 | -6,69 | ||||
| 2025-08-13 | 13F | Baker Avenue Asset Management, LP | 10.000 | 0,00 | 536 | -7,76 | ||||
| 2025-07-25 | 13F | Stephens Consulting, LLC | 100 | 0,00 | 5 | 0,00 | ||||
| 2025-08-14 | 13F | Mml Investors Services, Llc | 13.988 | -9,50 | 1 | |||||
| 2025-07-17 | 13F | CWA Asset Management Group, LLC | 4.087 | -5,70 | 219 | -12,75 | ||||
| 2025-05-15 | 13F | Glenmede Trust Co Na | 46.000 | 0,00 | 2.671 | 12,85 | ||||
| 2025-08-06 | 13F | Quadrant Private Wealth Management, LLC | 4.040 | 0,00 | 217 | -7,69 | ||||
| 2025-07-10 | 13F | Farmers & Merchants Trust Co of Chambersburg PA | 2.000 | 0,00 | 0 | |||||
| 2025-08-14 | 13F | Ameriprise Financial Inc | 37.488 | 8,10 | 1.996 | -0,84 | ||||
| 2025-08-12 | 13F | CIBC Private Wealth Group, LLC | 126.245 | 0,84 | 6.765 | 7,26 | ||||
| 2025-05-06 | 13F | Venturi Wealth Management, LLC | 0 | -100,00 | 0 | |||||
| 2025-08-14 | 13F | SWAN Capital LLC | 74 | 4 | ||||||
| 2025-07-31 | 13F | Oppenheimer Asset Management Inc. | 6.479 | -5,88 | 347 | -13,03 | ||||
| 2025-05-14 | 13F | Estabrook Capital Management | 0 | -100,00 | 0 | |||||
| 2025-08-12 | 13F | Bokf, Na | 12.293 | 0,00 | 659 | -7,71 | ||||
| 2025-08-13 | 13F | Crescent Grove Advisors, LLC | 43.419 | 68,26 | 2.327 | 55,27 | ||||
| 2025-08-13 | 13F | Jones Financial Companies Lllp | 5.991 | 25,70 | 325 | 15,25 | ||||
| 2025-08-13 | 13F | Russell Investments Group, Ltd. | 746 | 0,00 | 40 | -9,30 | ||||
| 2025-07-03 | 13F | Garde Capital, Inc. | 148 | 0,00 | 8 | -12,50 | ||||
| 2025-07-17 | 13F | XML Financial, LLC | 9.221 | -15,75 | 494 | -22,20 | ||||
| 2025-08-14 | 13F | Zurich Insurance Group Ltd/FI | 27.200 | 0,00 | 1.458 | -7,73 | ||||
| 2025-08-14 | 13F | Energy Income Partners, LLC | 1.883.992 | 4,07 | 100.963 | -3,94 | ||||
| 2025-08-29 | 13F | Total Investment Management Inc | 22 | 1 | ||||||
| 2025-06-26 | NP | GYLD - Arrow Dow Jones Global Yield ETF | 2.314 | -12,71 | 135 | -10,07 | ||||
| 2025-08-11 | 13F | United Advisor Group, LLC | 8.093 | 8,21 | 434 | -0,23 | ||||
| 2025-08-14 | 13F | CoreCap Advisors, LLC | 577 | 0,00 | 31 | -9,09 | ||||
| 2025-08-11 | 13F | Duff & Phelps Investment Management Co | 113.263 | 470,05 | 6.070 | 426,37 | ||||
| 2025-08-04 | 13F | Linscomb & Williams, Inc. | 14.740 | 0,00 | 790 | -7,72 | ||||
| 2025-07-08 | 13F/A | Adams Asset Advisors, LLC | 571.547 | 0,40 | 30.629 | -7,33 | ||||
| 2025-07-14 | 13F | Whitener Capital Management, Inc. | 4.510 | 0,22 | 242 | -7,66 | ||||
| 2025-07-21 | 13F | Sovereign Investment Advisors, LLC | 43.522 | 2.332 | ||||||
| 2025-07-29 | 13F | Harbor Asset Planning, Inc. | 762 | 41 | ||||||
| 2025-08-13 | 13F | Northwestern Mutual Wealth Management Co | 0 | -100,00 | 0 | |||||
| 2025-07-21 | 13F | Hennessy Advisors Inc | 166.800 | 8.939 | ||||||
| 2025-08-07 | 13F | Parkside Financial Bank & Trust | 1.379 | 95,88 | 74 | 82,50 | ||||
| 2025-07-08 | 13F/A | Salem Investment Counselors Inc | 2.666 | 0,00 | 143 | -7,79 | ||||
| 2025-07-17 | 13F | Janney Montgomery Scott LLC | 17.086 | 18,27 | 1 | |||||
| 2025-08-12 | 13F | BlackRock, Inc. | 16.924 | -61,95 | 907 | -64,91 | ||||
| 2025-08-06 | 13F | Texas Yale Capital Corp. | 90.666 | 11,28 | 4.859 | 2,71 | ||||
| 2025-07-11 | 13F | Quad-Cities Investment Group, LLC | 13.577 | 4,11 | 728 | -3,96 | ||||
| 2025-07-22 | 13F | Cedar Mountain Advisors, LLC | 93 | 0,00 | 5 | -20,00 | ||||
| 2025-07-08 | 13F | Strategic Advocates LLC | 5.977 | -9,93 | 320 | -16,88 | ||||
| 2025-08-19 | 13F | National Asset Management, Inc. | 9.387 | -10,91 | 503 | -7,20 | ||||
| 2025-08-07 | 13F | Pinnacle Holdings, LLC | 41.450 | 0,00 | 2.221 | -7,69 | ||||
| 2025-08-14 | 13F | Aster Capital Management (DIFC) Ltd | 0 | -100,00 | 0 | |||||
| 2025-08-21 | NP | EINC - VanEck Vectors Energy Income ETF | 24.521 | 21,00 | 1.314 | 11,73 |