Grundlæggende statistik
| Institutionelle aktier (lange) | 290.253.541 - 91,42% (ex 13D/G) - change of -44,07MM shares -13,18% MRQ |
| Institutionel værdi (lang) | $ 6.708.403 USD ($1000) |
Institutionelt ejerskab og aktionærer
The Mosaic Company (US:MOS) har 677 institutionelle ejere og aktionærer, der har indsendt 13D/G- eller 13F-formularer til Securities Exchange Commission (SEC). Disse institutioner har i alt 290,253,541 aktier. Største aktionærer omfatter Fmr Llc, Vanguard Group Inc, BlackRock, Inc., Dimensional Fund Advisors Lp, State Street Corp, Invesco Ltd., Geode Capital Management, Llc, Aqr Capital Management Llc, Goldman Sachs Group Inc, and Morgan Stanley .
The Mosaic Company (NYSE:MOS) institutionel ejerskabsstruktur viser aktuelle positioner i virksomheden efter institutioner og fonde, samt seneste ændringer i positionsstørrelse. Større aktionærer kan omfatte individuelle investorer, investeringsforeninger, hedgefonde eller institutioner. Skema 13D angiver, at investoren besidder (eller besidder) mere end 5 % af virksomheden og har til hensigt (eller har til hensigt at) aktivt at forfølge en ændring i forretningsstrategi. Skema 13G indikerer en passiv investering på over 5%.
The share price as of April 10, 2026 is 24,75 / share. Previously, on April 11, 2025, the share price was 25,81 / share. This represents a decline of 4,11% over that period.

Fondens stemningsscore
Fund Sentiment Score (fka Ownership Accumulation Score) finder de aktier, der bliver mest købt af fonde. Det er resultatet af en sofistikeret, multi-faktor kvantitativ model, der identificerer virksomheder med de højeste niveauer af institutionel akkumulering. Scoringsmodellen bruger en kombination af den samlede stigning i oplyste ejere, ændringerne i porteføljeallokeringer i disse ejere og andre målinger. Tallet går fra 0 til 100, hvor højere tal indikerer et højere niveau af akkumulering for sine jævnaldrende, og 50 er gennemsnittet.
Opdateringsfrekvens: Dagligt
Se Ownership Explorer, som giver en liste over højest rangerende virksomheder.
AI+ Ask Fintel’s AI assistant about The Mosaic Company.
Select a question to share a public post with an AI-crafted answer.
Thinking of good questions…
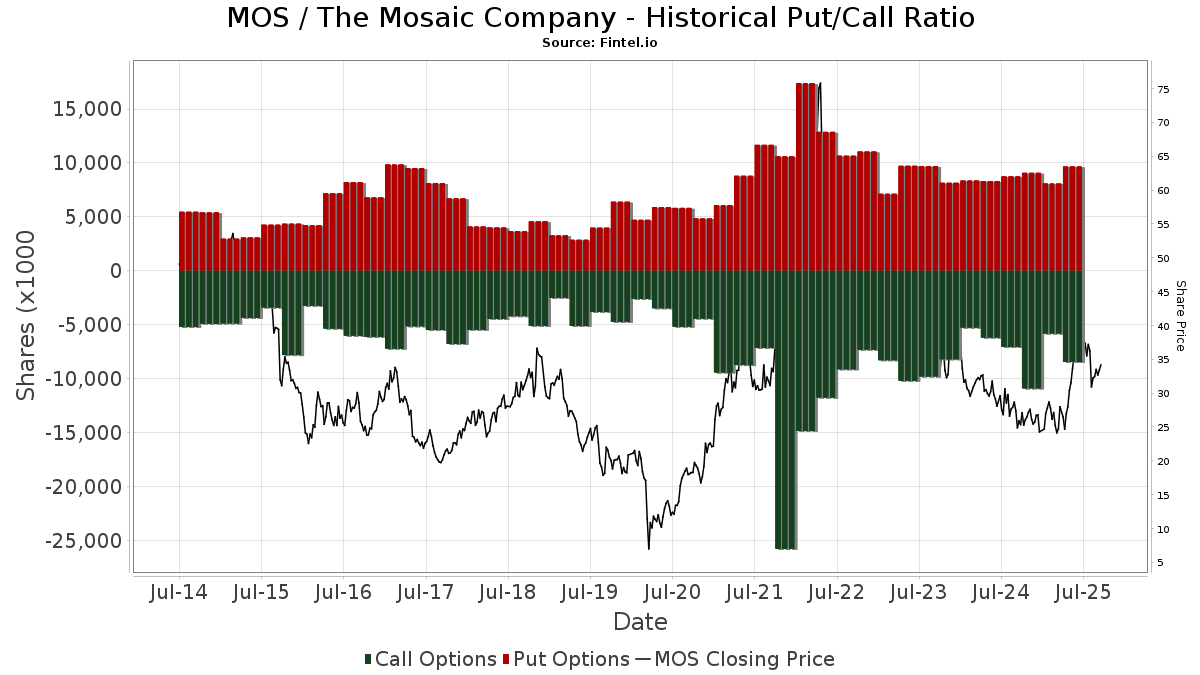
Institutionel Put/Call-forhold
Ud over at indberette standardaktie- og gældsudstedelser skal institutter med mere end 100 mill. aktiver under forvaltning også oplyse deres put- og call-optionsbeholdninger. Da salgsoptioner generelt indikerer negativ stemning, og købsoptioner indikerer positiv stemning, kan vi få en fornemmelse af den overordnede institutionelle stemning ved at plotte forholdet mellem put og kald. Diagrammet til højre viser det historiske put/call-forhold for dette instrument.
Brug af Put/Call Ratio som en indikator for investorernes stemning overvinder en af de vigtigste mangler ved at bruge totalt institutionelt ejerskab, som er, at en betydelig mængde af aktiver under forvaltning investeres passivt for at spore indekser. Passivt forvaltede fonde køber typisk ikke optioner, så indikatoren for put/call-forholdet følger mere nøje følelsen af aktivt forvaltede fonde.
13D/G-arkivering
Vi præsenterer 13D/G ansøgninger separat fra 13F ansøgninger på grund af den forskellige behandling af SEC. 13D/G-ansøgninger kan indgives af grupper af investorer (med én ledende), hvorimod 13F-ansøgninger ikke kan. Dette resulterer i situationer, hvor en investor kan indsende en 13D/G, der rapporterer én værdi for de samlede aktier (der repræsenterer alle de aktier, der ejes af investorgruppen), men derefter indsender en 13F, der rapporterer en anden værdi for de samlede aktier (der udelukkende repræsenterer deres egne) ejendomsret). Det betyder, at aktieejerskab af 13D/G-arkiver og 13F-arkiveringer ofte ikke er direkte sammenlignelige, så vi præsenterer dem separat.
Bemærk: Fra den 16. maj 2021 viser vi ikke længere ejere, der ikke har indsendt en 13D/G inden for det seneste år. Tidligere viste vi den fulde historie af 13D/G-arkiver. Generelt skal enheder, der er forpligtet til at indgive 13D/G-ansøgninger, indgive mindst årligt, før de indsender en afsluttende ansøgning. Dog forlader fonde nogle gange positioner uden at indsende en afsluttende ansøgning (dvs. de afvikler), så visning af den fulde historie resulterede nogle gange i forvirring om det nuværende ejerskab. For at undgå forvirring viser vi nu kun 'aktuelle' ejere - det vil sige - ejere, der har anmeldt inden for det seneste år.
Upgrade to unlock premium data.
| Fil dato | Form | Investor | Forrige Aktier |
Seneste Aktier |
Δ Aktier (Procent) |
Ejendomsret (Procent) |
Δ Ejerskab (Procent) |
|
|---|---|---|---|---|---|---|---|---|
| 2026-02-05 | FMR LLC | 35,141,149 | 39,980,660 | 13.77 | 12.60 | 13.51 | ||
| 2025-08-14 | PRICE T ROWE ASSOCIATES INC /MD/ | 16,311,021 | 2,378,333 | -85.42 | 0.70 | -86.27 | ||
| 2025-04-17 | BlackRock, Inc. | 28,714,873 | 21,250,408 | -26.00 | 6.70 | -25.56 |
13F og NPORT arkivering
Detaljer om 13F-arkivering er gratis. Detaljer om NP-ansøgninger kræver et premium-medlemskab. Grønne rækker angiver nye positioner. Røde rækker angiver lukkede positioner. Klik på linket ikon for at se den fulde transaktionshistorik.
Opgrader
for at låse premium-data op og eksportere til Excel ![]() .
.
Important Note
In an effort to reduce load times for our mobile users, we are testing some ways to deliver lighter pages.
In this first test, we will deliver only the most recent 750 transactions (out of 1001 for this stock). If you are interested in loading *all* the transactions for this company, click the "load all" button below. This is just a test and if you don't like it, please let us know by submitting some gentle feedback via the link at the bottom of this page.
Load All| Fil dato | Kilde | Investor | Type | Gennemsnitlig pris (Øst) |
Aktier | Δ Aktier (%) |
Rapporteret Værdi ($1000) |
Δ Værdi (%) |
Port Alloc (%) |
|
|---|---|---|---|---|---|---|---|---|---|---|
| 2026-02-12 | 13F | Intesa Sanpaolo Wealth Management | 2.000 | 48 | ||||||
| 2026-02-13 | 13F | De Lisle Partners LLP | 130.989 | 0,00 | 3.155 | -30,53 | ||||
| 2026-02-17 | 13F | Delta Global Management LP | 34.304 | 826 | ||||||
| 2026-01-28 | 13F | Salomon & Ludwin, LLC | 0 | -100,00 | 0 | |||||
| 2026-02-17 | 13F | Delaware Management Holdings, Inc. | 49.417 | 1.190 | ||||||
| 2026-01-26 | 13F | Abundance Wealth Counselors | 21.343 | -3,39 | 514 | -32,90 | ||||
| 2026-02-10 | 13F | Eurizon Capital SGR S.p.A. | 115.016 | 2.771 | ||||||
| 2026-02-17 | 13F | Diameter Capital Partners LP | Call | 0 | -100,00 | 0 | ||||
| 2026-02-06 | 13F | Mitsubishi UFJ Asset Management (UK) Ltd. | 18.000 | 63,64 | 0 | |||||
| 2026-02-13 | 13F | Diametric Capital, LP | 17.251 | 416 | ||||||
| 2026-02-12 | 13F | Summit Financial, LLC | 154.708 | -0,09 | 3.727 | -30,61 | ||||
| 2025-11-14 | 13F | Teza Capital Management LLC | 0 | -100,00 | 0 | -100,00 | ||||
| 2026-02-12 | 13F | EntryPoint Capital, LLC | 19.707 | 475 | ||||||
| 2025-11-14 | 13F | Point72 (DIFC) Ltd | 0 | -100,00 | 0 | -100,00 | ||||
| 2026-01-28 | 13F | West Michigan Advisors, Llc | 12.340 | -4,16 | 297 | -33,41 | ||||
| 2026-02-12 | 13F | M&G Plc | 348.631 | 71,01 | 8.367 | 17,27 | ||||
| 2026-02-17 | 13F | Point72 Asset Management, L.P. | Put | 541.000 | 1.015,46 | 13.033 | 675,25 | |||
| 2026-02-17 | 13F | Point72 Asset Management, L.P. | Call | 346.800 | 85,95 | 8.354 | 29,18 | |||
| 2026-02-17 | 13F | Wellington Management Group Llp | 1.443.298 | 6,78 | 34.769 | -25,82 | ||||
| 2026-02-04 | 13F | Blackhawk Capital Partners LLC. | 0 | -100,00 | 0 | |||||
| 2026-02-17 | 13F | Citadel Advisors Llc | 2.157.938 | 157,81 | 51.985 | 79,09 | ||||
| 2026-02-02 | 13F | Bay Harbor Wealth Management, LLC | 30 | 25,00 | 1 | |||||
| 2026-02-17 | 13F | Citadel Advisors Llc | Call | 1.414.500 | 53,62 | 34.075 | 6,71 | |||
| 2026-01-26 | 13F | Mountain Hill Investment Partners Corp. | 250 | 0,00 | 6 | -25,00 | ||||
| 2026-02-17 | 13F | Point72 Asset Management, L.P. | 666.965 | -41,21 | 16.067 | -59,16 | ||||
| 2026-01-23 | 13F | Valley National Advisers Inc | 42 | 0 | ||||||
| 2026-02-17 | 13F | Citadel Advisors Llc | Put | 2.077.400 | 29,13 | 50.045 | -10,30 | |||
| 2025-11-04 | 13F | Delta Asset Management Llc/tn | 0 | -100,00 | 0 | -100,00 | ||||
| 2026-02-03 | 13F | Ballentine Partners, LLC | 0 | -100,00 | 0 | |||||
| 2026-02-12 | 13F | Hollencrest Capital Management | 0 | -100,00 | 0 | |||||
| 2026-01-21 | 13F | Oak Thistle LLC | 31.723 | 764 | ||||||
| 2026-01-30 | 13F | Mitsubishi UFJ Trust & Banking Corp | 108.699 | -44,69 | 2.619 | -61,58 | ||||
| 2026-02-11 | 13F | Rise Advisors, LLC | 0 | -100,00 | 0 | |||||
| 2026-01-22 | 13F | V-Square Quantitative Management LLC | 11.597 | 279 | ||||||
| 2026-02-13 | 13F | Glen Eagle Advisors, LLC | 0 | -100,00 | 0 | |||||
| 2026-02-17 | 13F | DZ BANK AG Deutsche Zentral Genossenschafts Bank, Frankfurt am Main | 0 | -100,00 | 0 | |||||
| 2026-02-10 | 13F | REAP Financial Group, LLC | 209 | 0,97 | 5 | -28,57 | ||||
| 2026-02-13 | 13F | Verition Fund Management LLC | 165.000 | -43,46 | 3.975 | -60,74 | ||||
| 2026-01-28 | 13F | WPG Advisers, LLC | 539 | -0,37 | 13 | -33,33 | ||||
| 2026-02-13 | 13F | Verition Fund Management LLC | Put | 15.200 | -90,87 | 366 | -93,66 | |||
| 2026-02-13 | 13F | Prudential Financial Inc | 189.048 | -24,92 | 4.554 | -47,85 | ||||
| 2026-02-06 | 13F | Lsv Asset Management | 1.597.790 | -16,37 | 38 | -42,42 | ||||
| 2026-01-26 | 13F | Moran Wealth Management, LLC | 49.793 | 61,07 | 1.200 | 11,85 | ||||
| 2026-01-05 | 13F | Chesapeake Asset Management Llc | 0 | -100,00 | 0 | |||||
| 2026-02-17 | 13F | Norinchukin Bank, The | 17.901 | 6,31 | 431 | -26,07 | ||||
| 2026-02-12 | 13F | Cibc World Markets Corp | Call | 30.000 | 140,00 | 723 | 58,33 | |||
| 2026-02-09 | 13F | Coldstream Capital Management Inc | 0 | -100,00 | 0 | |||||
| 2026-01-27 | 13F | Financial Management Professionals, Inc. | 16 | 0,00 | 0 | |||||
| 2026-04-06 | 13F | Highline Wealth Partners Llc | 1 | 0 | ||||||
| 2026-02-02 | 13F | Oppenheimer & Co Inc | 0 | -100,00 | 0 | |||||
| 2026-02-11 | 13F | Jpmorgan Chase & Co | Call | 329.600 | 0,00 | 7.940 | -30,53 | |||
| 2026-02-12 | 13F | South Dakota Investment Council | 46.948 | 180,32 | 1 | |||||
| 2025-11-14 | 13F | Wetherby Asset Management Inc | 22.383 | 6,70 | 776 | 1,44 | ||||
| 2026-02-11 | 13F | Jpmorgan Chase & Co | 957.205 | -43,50 | 23.059 | -60,75 | ||||
| 2026-02-17 | 13F | Lighthouse Investment Partners, LLC | 35.324 | -66,40 | 851 | -76,68 | ||||
| 2026-02-06 | 13F | Kimelman & Baird, LLC | 1.200 | 0,00 | 29 | -31,71 | ||||
| 2026-02-12 | 13F | California Public Employees Retirement System | 592.043 | -1,15 | 14.262 | -31,34 | ||||
| 2025-10-30 | 13F | Traub Capital Management LLC | 0 | -100,00 | 0 | -100,00 | ||||
| 2026-01-07 | 13F | CWA Asset Management Group, LLC | 33.612 | -86,71 | 810 | -90,78 | ||||
| 2026-02-04 | 13F | Oregon Public Employees Retirement Fund | 36.304 | 0,00 | 875 | -30,58 | ||||
| 2026-02-06 | 13F | Gsa Capital Partners Llp | 25.689 | 1 | ||||||
| 2026-02-06 | 13F | Addison Advisors LLC | 105 | 3 | ||||||
| 2026-04-08 | 13F | AAFMAA Wealth Management & Trust LLC | 10.292 | 262 | ||||||
| 2026-02-13 | 13F | Wexford Capital Lp | 1.074 | 11,76 | 26 | -24,24 | ||||
| 2026-02-17 | 13F | Alphadyne Asset Management, LLC | Call | 9.900 | 238 | |||||
| 2026-02-17 | 13F | Alphadyne Asset Management, LLC | Put | 5.900 | 142 | |||||
| 2026-04-10 | 13F | Quaker Wealth Management, LLC | 1 | -66,67 | 0 | |||||
| 2026-02-05 | 13F | Allworth Financial LP | 1.437 | -75,20 | 35 | -83,00 | ||||
| 2025-11-14 | 13F/A | Skopos Labs, Inc. | 0 | -100,00 | 0 | -100,00 | ||||
| 2026-02-17 | 13F | Advisory Services Network, LLC | 10.925 | 5,48 | 263 | -26,74 | ||||
| 2025-11-07 | 13F | Sierra Ocean, Llc | 0 | -100,00 | 0 | -100,00 | ||||
| 2026-01-26 | 13F | Decker Retirement Planning Inc. | 11 | -93,17 | 0 | -100,00 | ||||
| 2026-02-10 | 13F | Catalyst Capital Advisors LLC | 59.790 | 0,00 | 1.440 | -30,54 | ||||
| 2025-11-14 | 13F | Sofos Investments, Inc. | 0 | -100,00 | 0 | -100,00 | ||||
| 2026-02-13 | 13F | Victory Capital Management Inc | 2.730.570 | 65,34 | 65.779 | 14,85 | ||||
| 2026-02-12 | 13F | Quadrant Capital Group Llc | 1.569 | -87,71 | 38 | -91,63 | ||||
| 2026-02-09 | 13F | Cary Street Partner Investment Advisory Llc | 692 | -3,22 | 17 | -33,33 | ||||
| 2026-02-03 | 13F | International Assets Investment Management, Llc | 10.907 | 263 | ||||||
| 2026-02-03 | 13F | Sumitomo Mitsui DS Asset Management Company, Ltd | 0 | -100,00 | 0 | |||||
| 2026-02-13 | 13F | Citigroup Inc | Put | 0 | -100,00 | 0 | -100,00 | |||
| 2026-02-13 | 13F | Blueshift Asset Management, LLC | 9.055 | 44,37 | 218 | 0,46 | ||||
| 2026-01-26 | 13F | Old Point Trust & Financial Services N A | 3.100 | -38,00 | 75 | -57,23 | ||||
| 2026-01-21 | 13F | Greenleaf Trust | 13.881 | -27,56 | 334 | -49,70 | ||||
| 2026-02-11 | 13F | Twin Tree Management, LP | Put | 14.800 | -62,34 | 357 | -73,86 | |||
| 2026-02-11 | 13F | Twin Tree Management, LP | 10.732 | -26,82 | 259 | -49,21 | ||||
| 2026-02-17 | 13F | Tower Research Capital LLC (TRC) | 6.019 | -65,34 | 145 | -76,08 | ||||
| 2025-12-01 | 13F | CMC Financial Group | 0 | -100,00 | 0 | -100,00 | ||||
| 2026-01-16 | 13F | Ronald Blue Trust, Inc. | 1.502 | 8,37 | 36 | -25,00 | ||||
| 2026-02-18 | 13F | Beacon Pointe Advisors, LLC | 10.205 | -3,35 | 246 | -33,06 | ||||
| 2026-01-29 | 13F | Camelot Portfolios, LLC | 1 | 0 | ||||||
| 2026-02-11 | 13F | Twin Tree Management, LP | Call | 92.700 | 76,91 | 2.233 | 22,89 | |||
| 2026-02-13 | 13F | Ieq Capital, Llc | 54.949 | -88,03 | 1.324 | -91,69 | ||||
| 2026-02-17 | 13F | Oxford Asset Management Llp | 46.586 | 1.122 | ||||||
| 2026-01-27 | 13F | Zurcher Kantonalbank (Zurich Cantonalbank) | 95.035 | -4,46 | 2.289 | -33,63 | ||||
| 2026-02-11 | 13F | Meeder Asset Management Inc | 152 | 4 | ||||||
| 2026-02-13 | 13F | Verition Fund Management LLC | Call | 0 | -100,00 | 0 | -100,00 | |||
| 2026-02-17 | 13F | Millennium Management Llc | 1.338.041 | 125,36 | 32.233 | 56,55 | ||||
| 2026-02-17 | 13F | Millennium Management Llc | Put | 169.900 | -38,35 | 4.093 | -57,18 | |||
| 2026-01-28 | 13F | Old National Bancorp /in/ | 65.783 | -75,86 | 1.585 | -83,24 | ||||
| 2026-01-27 | 13F | Ninety One UK Ltd | 855.286 | 30,82 | 20.604 | -9,13 | ||||
| 2026-02-13 | 13F | Morgan Stanley | 4.955.715 | -4,77 | 119.383 | -33,85 | ||||
| 2026-02-17 | 13F | Millennium Management Llc | Call | 156.300 | 456,23 | 3.765 | 286,55 | |||
| 2026-01-22 | 13F | Evermay Wealth Management Llc | 305 | 0,00 | 7 | -30,00 | ||||
| 2026-02-13 | 13F | Neo Ivy Capital Management | 19.990 | 15,23 | 482 | -19,97 | ||||
| 2026-02-17 | 13F | Voloridge Investment Management, Llc | 692.145 | -67,95 | 16.674 | -77,73 | ||||
| 2026-02-12 | 13F | Colonial Trust Co / SC | 169 | 5,62 | 4 | -20,00 | ||||
| 2026-01-23 | 13F | Westside Investment Management, Inc. | 65 | 2 | ||||||
| 2026-02-11 | 13F | Janney Montgomery Scott LLC | 0 | -100,00 | 0 | |||||
| 2026-02-11 | 13F | Brandywine Global Investment Management, LLC | 205.673 | -1,76 | 4.955 | -31,76 | ||||
| 2026-02-13 | 13F | Timelo Investment Management Inc. | 55.000 | 1.325 | ||||||
| 2025-11-14 | 13F | Caption Management, LLC | 0 | -100,00 | 0 | -100,00 | ||||
| 2025-11-14 | 13F | Ion Asset Management Ltd. | 27.150 | 0,00 | 942 | -4,95 | ||||
| 2026-02-10 | 13F | Bank of New York Mellon Corp | 4.111.009 | -46,62 | 99.034 | -62,92 | ||||
| 2026-02-12 | 13F | Empirical Finance, LLC | 11.933 | -4,01 | 287 | -33,41 | ||||
| 2026-01-29 | 13F | Dunhill Financial, LLC | 24 | 118,18 | 1 | |||||
| 2026-02-03 | 13F | SBI Securities Co., Ltd. | 1.171 | 13,36 | 28 | -20,00 | ||||
| 2026-01-14 | 13F | USA Financial Portformulas Corp | 0 | -100,00 | 0 | |||||
| 2026-02-05 | 13F | Bank Julius Baer & Co. Ltd, Zurich | 62.069 | 43,16 | 1.495 | -0,53 | ||||
| 2026-01-23 | 13F | Howard Capital Management Inc. | 85.730 | 0,00 | 2.065 | -30,54 | ||||
| 2026-01-21 | 13F | Yousif Capital Management, Llc | 47.340 | -3,17 | 1.280 | -24,54 | ||||
| 2026-01-16 | 13F | Capital Performance Advisors Llp | 0 | -100,00 | 0 | |||||
| 2026-02-17 | 13F | GeoWealth Management, LLC | 0 | -100,00 | 0 | |||||
| 2026-01-14 | 13F | Spire Wealth Management | 820 | 65,32 | 20 | 11,76 | ||||
| 2026-02-06 | 13F | Newport Trust Co | 566.866 | 1,99 | 13.656 | -29,16 | ||||
| 2026-02-10 | 13F | Sivia Capital Partners, LLC | 13.459 | 63,06 | 324 | 13,29 | ||||
| 2026-02-13 | 13F | Mufg Securities Americas Inc. | 8.551 | -0,09 | 206 | -30,74 | ||||
| 2025-11-14 | 13F | Petrus Trust Company, LTA | 0 | -100,00 | 0 | -100,00 | ||||
| 2026-02-05 | 13F | Stephens Inc /ar/ | 20.965 | -15,80 | 505 | -41,48 | ||||
| 2025-11-14 | 13F | Point72 Asia (Singapore) Pte. Ltd. | 0 | -100,00 | 0 | -100,00 | ||||
| 2026-02-20 | 13F | Dorsey Wright & Associates | 0 | -100,00 | 0 | |||||
| 2026-02-18 | 13F | GWM Advisors LLC | 1.326 | -98,96 | 32 | -99,30 | ||||
| 2026-02-13 | 13F | Wbi Investments, Inc. | 9.476 | -48,46 | 228 | -64,21 | ||||
| 2026-01-23 | 13F | Sumitomo Mitsui Trust Holdings, Inc. | 49.458 | -17,73 | 1.191 | -42,85 | ||||
| 2025-11-12 | 13F | Sciencast Management LP | 0 | -100,00 | 0 | -100,00 | ||||
| 2026-01-26 | 13F | JNBA Financial Advisors | 500 | 0,00 | 12 | -29,41 | ||||
| 2026-02-17 | 13F | Woodline Partners LP | 732.290 | 64,94 | 17.641 | 14,57 | ||||
| 2025-11-14 | 13F | Balyasny Asset Management Llc | 0 | -100,00 | 0 | -100,00 | ||||
| 2026-01-15 | 13F | Polianta Ltd | 61.400 | 65,05 | 1 | 0,00 | ||||
| 2026-02-12 | 13F | State Board Of Administration Of Florida Retirement System | 297.528 | -2,68 | 7.167 | -32,40 | ||||
| 2026-02-11 | 13F | Vise Technologies, Inc. | 0 | -100,00 | 0 | |||||
| 2025-11-10 | 13F | Raiffeisen Bank International AG | 0 | -100,00 | 0 | -100,00 | ||||
| 2026-02-10 | 13F | Goldman Sachs Group Inc | 5.739.237 | 84,05 | 138.258 | 27,85 | ||||
| 2026-02-10 | 13F | Goldman Sachs Group Inc | Put | 30.000 | 0,00 | 723 | -30,58 | |||
| 2026-01-29 | 13F | Nbc Securities, Inc. | 480 | 0,00 | 12 | -31,25 | ||||
| 2026-01-28 | 13F | Teacher Retirement System Of Texas | 63.224 | -46,31 | 1.523 | -62,70 | ||||
| 2025-11-13 | 13F | Panagora Asset Management Inc | 0 | -100,00 | 0 | -100,00 | ||||
| 2026-02-13 | 13F | BNP Paribas Asset Management Holding S.A. | 251.224 | 2.049,97 | 6 | |||||
| 2026-02-17 | 13F | Magnetar Financial LLC | 53.590 | 1.291 | ||||||
| 2026-01-21 | 13F | Cidel Asset Management Inc | 9.077 | 11,20 | 219 | -22,97 | ||||
| 2026-01-08 | 13F | Armstrong Advisory Group, Inc | 0 | -100,00 | 0 | -100,00 | ||||
| 2025-11-14 | 13F | Cito Capital Group, LLC | 0 | -100,00 | 0 | |||||
| 2026-02-12 | 13F | BRYN MAWR TRUST Co | 4.233 | -52,15 | 102 | -66,99 | ||||
| 2026-02-10 | 13F | Fideuram Asset Management (Ireland) dac | 910 | 25 | ||||||
| 2026-02-11 | 13F | Havemeyer Place LP | 14.110 | 340 | ||||||
| 2026-02-06 | 13F | Leonteq Securities AG | 88.672 | 254,22 | 2.136 | 146,08 | ||||
| 2026-02-11 | 13F | Los Angeles Capital Management Llc | 1.420 | 39 | ||||||
| 2026-01-23 | 13F | Robeco Institutional Asset Management B.V. | 13.510 | 0,00 | 325 | -30,56 | ||||
| 2026-02-17 | 13F | Toronto Dominion Bank | 54.569 | -78,44 | 1.315 | -85,03 | ||||
| 2026-02-10 | 13F | Bnp Paribas Arbitrage, Sa | Call | 0 | -100,00 | 0 | -100,00 | |||
| 2025-11-21 | 13F/A | Tcfg Wealth Management, Llc | 0 | -100,00 | 0 | -100,00 | ||||
| 2025-11-14 | 13F | Gts Securities Llc | 0 | -100,00 | 0 | -100,00 | ||||
| 2026-02-18 | 13F | Hanlon Investment Management, Inc. | 0 | -100,00 | 0 | |||||
| 2026-03-17 | 13F | Stance Capital Llc | 0 | -100,00 | 0 | -100,00 | ||||
| 2026-02-13 | 13F | Nfj Investment Group, Llc | 0 | -100,00 | 0 | |||||
| 2026-02-17 | 13F | Brevan Howard Capital Management LP | 102.773 | 7,63 | 2.476 | -25,25 | ||||
| 2026-02-10 | 13F | Principia Wealth Advisory, LLC | 23 | 9,52 | 1 | |||||
| 2025-11-14 | 13F | Wolverine Trading, Llc | Put | 183.500 | 56,04 | 6.367 | 53,31 | |||
| 2026-02-17 | 13F | Jones Financial Companies Lllp | 9.794 | 55,48 | 236 | 5,86 | ||||
| 2026-01-30 | 13F | Keybank National Association/oh | 60.662 | 17,72 | 1.461 | -18,24 | ||||
| 2026-02-11 | 13F | Franklin Resources Inc | 230.734 | -45,52 | 5.558 | -62,16 | ||||
| 2026-02-03 | 13F | Sequoia Financial Advisors, LLC | 15.540 | 39,23 | 374 | -3,36 | ||||
| 2026-01-15 | 13F | Fortitude Family Office, LLC | 194 | -17,45 | 5 | -50,00 | ||||
| 2026-01-16 | 13F | Banque Pictet & Cie Sa | 0 | -100,00 | 0 | -100,00 | ||||
| 2026-01-02 | 13F | Global Wealth Strategies & Associates | 0 | -100,00 | 0 | -100,00 | ||||
| 2026-01-27 | 13F | TD Waterhouse Canada Inc. | 14.946 | -49,20 | 360 | -63,88 | ||||
| 2026-02-03 | 13F | Crossmark Global Holdings, Inc. | 23.948 | 9,47 | 577 | -24,01 | ||||
| 2026-02-04 | 13F | Virginia Retirement Systems Et Al | 96.750 | -11,08 | 2.331 | -38,25 | ||||
| 2026-01-05 | 13F | Roxbury Financial LLC | 329 | 0,92 | 8 | -36,36 | ||||
| 2025-10-14 | 13F | Delta Capital Management Llc | 0 | -100,00 | 0 | |||||
| 2025-11-14 | 13F | Wolverine Trading, Llc | 10.028 | -82,84 | 348 | -83,19 | ||||
| 2025-11-14 | 13F | Wolverine Trading, Llc | Call | 258.900 | 31,29 | 8.984 | 28,97 | |||
| 2026-02-17 | 13F | Captrust Financial Advisors | 45.057 | -34,00 | 1.085 | -54,16 | ||||
| 2026-02-17 | 13F | Schonfeld Strategic Advisors LLC | 0 | -100,00 | 0 | |||||
| 2026-02-17 | 13F | T. Rowe Price Investment Management, Inc. | 196 | 0,00 | 0 | |||||
| 2026-02-09 | 13F | Murphy Pohlad Asset Management LLC | 28.575 | -13,34 | 688 | -39,81 | ||||
| 2026-02-10 | 13F | Winthrop Capital Management, LLC | 50 | 0 | ||||||
| 2026-02-05 | 13F | Thrivent Financial For Lutherans | 96.625 | -10,91 | 2 | -33,33 | ||||
| 2026-01-16 | 13F | Banque Pictet & Cie Sa | Put | 0 | -100,00 | 0 | -100,00 | |||
| 2026-02-11 | 13F | Metis Global Partners, LLC | 51.207 | 17,10 | 1.234 | -18,67 | ||||
| 2026-01-21 | 13F | Clayton Financial Group LLC | 19 | 0 | ||||||
| 2026-02-13 | 13F | Barclays Plc | 1.056.596 | -12,65 | 25.453 | -21,42 | ||||
| 2026-02-17 | 13F | Vinva Investment Management Ltd | 9.289 | -48,04 | 335 | -64,58 | ||||
| 2026-02-17 | 13F | DV Trading LLC | 1.030 | 25 | ||||||
| 2025-10-30 | 13F | Twin Peaks Wealth Advisors, LLC | 0 | -100,00 | 0 | -100,00 | ||||
| 2026-02-17 | 13F | SummitTX Capital, L.P. | 25.833 | 622 | ||||||
| 2026-01-29 | 13F | State Of Michigan Retirement System | 83.108 | -3,15 | 2.002 | -32,71 | ||||
| 2026-02-04 | 13F | Swiss Life Asset Management Ltd | 17.354 | 19,40 | 418 | -17,06 | ||||
| 2026-02-10 | 13F | Westpac Banking Corp | 2.552 | 61 | ||||||
| 2025-11-14 | 13F | Caption Management, LLC | Put | 0 | -100,00 | 0 | -100,00 | |||
| 2026-01-23 | 13F | Private Wealth Management Group, LLC | 78 | 36,84 | 2 | 0,00 | ||||
| 2026-02-05 | 13F | Td Private Client Wealth Llc | 843 | -19,79 | 20 | -44,44 | ||||
| 2026-02-11 | 13F | Hughes Financial Services, LLC | 0 | -100,00 | 0 | |||||
| 2026-02-17 | 13F | Farringdon Capital, Ltd. | 0 | -100,00 | 0 | |||||
| 2026-02-12 | 13F | JPL Wealth Management, LLC | 0 | -100,00 | 0 | |||||
| 2026-02-12 | 13F | Hm Payson & Co | 11.200 | 0,00 | 270 | -30,67 | ||||
| 2026-02-12 | 13F | Barings Llc | 85.299 | 15,43 | 2.055 | -19,83 | ||||
| 2026-01-20 | 13F | Toth Financial Advisory Corp | 4 | 0 | ||||||
| 2026-02-09 | 13F | Jackson Creek Investment Advisors LLC | 0 | -100,00 | 0 | |||||
| 2026-02-17 | 13F | Parallax Volatility Advisers, L.P. | Put | 188.800 | 4.548 | |||||
| 2026-02-24 | 13F | Bell Investment Advisors, Inc | 169 | 83,70 | 4 | 33,33 | ||||
| 2026-02-17 | 13F | Parallax Volatility Advisers, L.P. | Call | 80.000 | 0,00 | 1.927 | -30,53 | |||
| 2026-01-05 | 13F | GoalVest Advisory LLC | 1.014 | 24 | ||||||
| 2026-02-05 | 13F | Cambridge Investment Research Advisors, Inc. | 45.679 | 19,09 | 1 | 0,00 | ||||
| 2026-02-09 | 13F | Shufro Rose & Co Llc | 14.700 | -32,26 | 354 | -39,59 | ||||
| 2026-02-17 | 13F | Parallax Volatility Advisers, L.P. | 125.367 | 3.020 | ||||||
| 2026-01-30 | 13F | Pekin Hardy Strauss, Inc. | 186.250 | -22,49 | 4.487 | -46,17 | ||||
| 2026-01-20 | 13F | SOA Wealth Advisors, LLC. | 2 | 0,00 | 0 | |||||
| 2026-02-12 | 13F | Federated Hermes, Inc. | 272.222 | 0,42 | 6.558 | -30,25 | ||||
| 2026-02-12 | 13F | Rossby Financial, LCC | 143 | 3 | ||||||
| 2026-02-17 | 13F | Gotham Asset Management, LLC | 269.619 | -38,33 | 6.495 | -57,16 | ||||
| 2026-02-06 | 13F | Envestnet Portfolio Solutions, Inc. | 64.896 | -7,20 | 1.563 | -35,55 | ||||
| 2026-02-13 | 13F | Edgestream Partners, L.P. | 0 | -100,00 | 0 | |||||
| 2026-01-07 | 13F | Aventura Private Wealth, LLC | 250 | 0,00 | 6 | -25,00 | ||||
| 2025-11-13 | 13F | Change Path, LLC | 0 | -100,00 | 0 | -100,00 | ||||
| 2026-02-13 | 13F | Candriam Luxembourg S.C.A. | 25.793 | -3,23 | 621 | -32,79 | ||||
| 2026-01-29 | 13F | Quent Capital, LLC | 189 | -67,41 | 5 | -80,00 | ||||
| 2026-01-23 | 13F | Inlight Wealth Management, LLC | 2 | 0,00 | 0 | |||||
| 2026-01-15 | 13F | Burns Matteson Capital Management, LLC | 0 | -100,00 | 0 | |||||
| 2026-01-21 | 13F | Capital Advisors, Ltd. LLC | 602 | -6,23 | 0 | |||||
| 2026-02-02 | 13F | Nkcfo Llc | 0 | -100,00 | 0 | |||||
| 2026-02-13 | 13F | Delos Wealth Advisors, LLC | 145 | 3 | ||||||
| 2026-01-14 | 13F | Kaufman Rossin Wealth, LLC | 0 | -100,00 | 0 | |||||
| 2026-01-29 | 13F | Managed Asset Portfolios, Llc | 701.113 | 0,81 | 16.890 | -29,98 | ||||
| 2026-02-10 | 13F | Nomura Asset Management Co Ltd | 14.860 | 8,82 | 358 | -24,52 | ||||
| 2026-01-15 | 13F | Retirement Systems of Alabama | 67.525 | -0,26 | 1.627 | -30,72 | ||||
| 2026-02-18 | 13F/A | Fuller & Thaler Asset Management, Inc. | 0 | -100,00 | 0 | -100,00 | ||||
| 2026-02-11 | 13F | Ing Groep Nv | 49.273 | -93,87 | 1.187 | -95,74 | ||||
| 2026-02-04 | 13F | Marco Investment Management Llc | 37.350 | -10,97 | 900 | -38,17 | ||||
| 2026-02-17 | 13F | Nomura Holdings Inc | 65.945 | 91,07 | 1.589 | 32,78 | ||||
| 2025-11-14 | 13F | Texas Permanent School Fund | 0 | -100,00 | 0 | -100,00 | ||||
| 2026-02-17 | 13F | EFG International AG | 200 | 5 | ||||||
| 2026-02-17 | 13F | Turas Capital Management LP | 132.216 | 3.185 | ||||||
| 2026-02-18 | 13F | First Citizens Bank & Trust Co | 75.234 | -5,55 | 1.812 | -34,40 | ||||
| 2026-01-21 | 13F | Westfuller Advisors, LLC | 0 | -100,00 | 0 | |||||
| 2026-02-10 | 13F | Mutual Of America Capital Management Llc | 34.073 | -0,94 | 821 | -31,21 | ||||
| 2026-02-17 | 13F | ION Fund Management Ltd | 27.150 | 654 | ||||||
| 2026-01-28 | 13F | Klp Kapitalforvaltning As | 78.400 | 2,08 | 1.889 | -29,10 | ||||
| 2026-02-17 | 13F | NEOS Investment Management LLC | 45.906 | 19,27 | 1.106 | -17,17 | ||||
| 2026-02-13 | 13F | Headlands Technologies LLC | 31.398 | 756 | ||||||
| 2025-11-14 | 13F | Blue Capital, Inc. | 0 | -100,00 | 0 | -100,00 | ||||
| 2026-02-13 | 13F | Caxton Associates Llp | 0 | -100,00 | 0 | |||||
| 2025-11-14 | 13F | Binnacle Investments Inc | 89 | 0,00 | 3 | 0,00 | ||||
| 2026-02-12 | 13F | Advisors Asset Management, Inc. | 5.955 | 19,27 | 143 | -17,34 | ||||
| 2026-01-28 | 13F | Legacy Capital Group California, Inc. | 9.151 | -56,72 | 220 | -69,99 | ||||
| 2026-01-29 | 13F | Sanctuary Advisors, LLC | 0 | -100,00 | 0 | -100,00 | ||||
| 2026-02-13 | 13F | Rhumbline Advisers | 632.068 | 4,23 | 15.226 | -27,60 | ||||
| 2026-04-06 | 13F | Versant Capital Management, Inc | 1.955 | 784,62 | 50 | 880,00 | ||||
| 2026-01-20 | 13F | Princeton Global Asset Management LLC | 314 | 0,00 | 8 | -30,00 | ||||
| 2026-02-02 | 13F | Hussman Strategic Advisors, Inc. | 84.000 | 0,00 | 2.024 | -30,55 | ||||
| 2026-01-23 | 13F | State of Alaska, Department of Revenue | 84.894 | 149,73 | 2 | 100,00 | ||||
| 2026-02-11 | 13F | CSM Advisors, LLC | 27.350 | -95,27 | 1 | -100,00 | ||||
| 2026-02-17 | 13F | Mirabella Financial Services Llp | 22.581 | 544 | ||||||
| 2026-02-13 | 13F | Botty Investors LLC | 0 | -100,00 | 0 | |||||
| 2026-02-13 | 13F | Chevy Chase Trust Holdings, Inc. | 160.949 | -0,63 | 3.877 | -30,98 | ||||
| 2026-02-13 | 13F | Rafferty Asset Management, LLC | 26.581 | -1,73 | 640 | -31,77 | ||||
| 2025-11-13 | 13F | Employees Retirement System of Texas | 0 | -100,00 | 0 | -100,00 | ||||
| 2025-11-14 | 13F | Aquatic Capital Management LLC | 0 | -100,00 | 0 | -100,00 | ||||
| 2026-02-17 | 13F | Trexquant Investment LP | 191.096 | 4.604 | ||||||
| 2025-11-14 | 13F | Orion Resource Partners LP | 0 | -100,00 | 0 | -100,00 | ||||
| 2026-02-12 | 13F | APG Asset Management N.V. | 51.258 | -11,29 | 1.051 | -38,36 | ||||
| 2026-02-17 | 13F | Quantitative Investment Management, LLC | 80.349 | 2 | ||||||
| 2026-02-11 | 13F | CenterBook Partners LP | 171.428 | 4.130 | ||||||
| 2026-02-09 | 13F | Harbour Investments, Inc. | 331 | -18,87 | 8 | -50,00 | ||||
| 2026-02-17 | 13F | Cambria Investment Management, L.P. | 0 | -100,00 | 0 | |||||
| 2026-02-12 | 13F | Marex Group plc | 27.018 | -42,30 | 651 | -59,95 | ||||
| 2025-10-24 | 13F | Hemington Wealth Management | 369 | 8,53 | 0 | |||||
| 2026-02-02 | 13F | Danske Bank A/s | 3.100 | -11,43 | 75 | -38,84 | ||||
| 2026-01-29 | 13F | Northern Oak Wealth Management Inc | 0 | -100,00 | 0 | |||||
| 2026-02-05 | 13F | Everstar Asset Management, LLC | 0 | -100,00 | 0 | |||||
| 2026-02-13 | 13F | Walleye Capital LLC | Call | 46.300 | 66,55 | 1.115 | 15,66 | |||
| 2026-02-13 | 13F | Walleye Capital LLC | Put | 63.100 | 106,21 | 1.520 | 43,26 | |||
| 2026-02-13 | 13F | Walleye Capital LLC | 26.115 | -54,18 | 629 | -68,17 | ||||
| 2026-02-04 | 13F | Pacer Advisors, Inc. | 0 | -100,00 | 0 | |||||
| 2026-02-13 | 13F | Mml Investors Services, Llc | 0 | -100,00 | 0 | |||||
| 2026-02-13 | 13F | Smartleaf Asset Management LLC | 1.117 | -1,59 | 27 | -33,33 | ||||
| 2026-02-03 | 13F | K.J. Harrison & Partners Inc | 46.000 | 1.108 | ||||||
| 2026-02-04 | 13F | Oxbow Advisors, LLC | 190.470 | 8,00 | 4.588 | -24,98 | ||||
| 2025-11-13 | 13F | FORA Capital, LLC | 0 | -100,00 | 0 | -100,00 | ||||
| 2026-02-06 | 13F | Pnc Financial Services Group, Inc. | 44.778 | -32,34 | 1.079 | -53,03 | ||||
| 2025-11-14 | 13F | Massar Capital Management, LP | 0 | -100,00 | 0 | -100,00 | ||||
| 2026-04-02 | 13F | Aspect Partners, LLC | 10 | -9,09 | 0 | |||||
| 2026-02-11 | 13F | Deutsche Bank Ag\ | 2.473.994 | -23,73 | 59.599 | -47,02 | ||||
| 2026-02-13 | 13F | Parkside Financial Bank & Trust | 1.198 | -11,78 | 29 | -40,43 | ||||
| 2026-02-06 | 13F | Resona Asset Management Co.,Ltd. | 3.464 | 0,00 | 83 | -30,83 | ||||
| 2026-02-04 | 13F | Madison Asset Management, LLC | 0 | -100,00 | 0 | |||||
| 2026-01-12 | 13F | Contravisory Investment Management, Inc. | 0 | -100,00 | 0 | |||||
| 2026-02-13 | 13F | Adams Natural Resources Fund, Inc. | 21.201 | 0,00 | 511 | -30,61 | ||||
| 2026-02-11 | 13F | Inceptionr Llc | 11.794 | -65,99 | 284 | -76,37 | ||||
| 2026-02-02 | 13F | Miracle Mile Advisors, LLC | 0 | -100,00 | 0 | |||||
| 2026-02-12 | 13F | UniSuper Management Pty Ltd | 66.550 | 13,13 | 1.603 | -21,42 | ||||
| 2026-02-06 | 13F | EverSource Wealth Advisors, LLC | 10.223 | -42,03 | 246 | -59,74 | ||||
| 2026-02-18 | 13F | Mackenzie Financial Corp | 16.356 | -94,13 | 394 | -95,92 | ||||
| 2026-01-26 | 13F | Greenwood Capital Associates Llc | 20.911 | 20,78 | 504 | -16,17 | ||||
| 2026-02-17 | 13F | Susquehanna International Group, Llp | Put | 1.409.300 | 33,22 | 33.950 | -7,46 | |||
| 2026-02-17 | 13F | Susquehanna International Group, Llp | Call | 840.100 | -25,11 | 20.238 | -47,98 | |||
| 2026-02-17 | 13F | Susquehanna International Group, Llp | 929.478 | 174,29 | 22.391 | 90,53 | ||||
| 2026-02-05 | 13F | Pinnacle Associates Ltd | 62.553 | 31,43 | 1.507 | -8,73 | ||||
| 2026-02-13 | 13F | Bollard Group LLC | 208 | -83,16 | 0 | |||||
| 2026-02-17 | 13F | Polymer Capital Management (US) LLC | 60.039 | 143,36 | 1.446 | 69,12 | ||||
| 2026-02-13 | 13F | Public Employees Retirement Association Of Colorado | 32.213 | 0,00 | 1 | -100,00 | ||||
| 2025-11-14 | 13F | Point72 Hong Kong Ltd | 18.985 | -72,10 | 658 | -73,49 | ||||
| 2026-01-29 | 13F | Comerica Bank | 108.861 | 53,60 | 2.622 | 6,72 | ||||
| 2026-02-10 | 13F | Envestnet Asset Management Inc | 101.317 | -94,63 | 2.441 | -96,27 | ||||
| 2026-01-30 | 13F | Jennison Associates Llc | 267.722 | 9,53 | 6.449 | -23,91 | ||||
| 2026-01-16 | 13F | Louisiana State Employees Retirement System | 16.200 | -2,99 | 390 | -32,64 | ||||
| 2026-01-16 | 13F | Banque Pictet & Cie Sa | Call | 54.000 | 38,46 | 1.301 | -3,85 | |||
| 2026-02-12 | 13F | Ensign Peak Advisors, Inc | 76.992 | -6,03 | 1.855 | -34,74 | ||||
| 2026-04-09 | 13F | Dorato Capital Management | 930 | 0,00 | 25 | -4,00 | ||||
| 2026-02-17 | 13F | Mercer Global Advisors Inc /adv | 36.935 | -51,95 | 890 | -66,64 | ||||
| 2026-02-17 | 13F | Susquehanna Fundamental Investments, Llc | 18.310 | -96,03 | 441 | -97,24 | ||||
| 2026-02-17 | 13F | Guggenheim Capital Llc | 50.969 | -62,94 | 1.228 | -74,27 | ||||
| 2026-02-17 | 13F | Voleon Capital Management Lp | 0 | -100,00 | 0 | -100,00 | ||||
| 2026-04-03 | 13F | Investors Research Corp | 10.375 | 5,06 | 265 | 11,39 | ||||
| 2026-02-11 | 13F | Fox Run Management, L.l.c. | 42.295 | 22,42 | 1.019 | -15,03 | ||||
| 2025-11-14 | 13F | Dauntless Investment Group, LLC | 0 | -100,00 | 0 | -100,00 | ||||
| 2026-02-13 | 13F | JustInvest LLC | 58.997 | -8,26 | 1.421 | -36,28 | ||||
| 2026-01-26 | 13F | Abbington Investment Group | 86.840 | 39,00 | 2.092 | -3,46 | ||||
| 2026-02-17 | 13F | Clear Street Markets Llc | 471 | -13,74 | 11 | -38,89 | ||||
| 2026-02-17 | 13F | Lazard Asset Management Llc | 22.822 | -26,31 | 550 | -48,88 | ||||
| 2026-02-18 | 13F | State of Tennessee, Treasury Department | 123.688 | -0,69 | 3.401 | -21,25 | ||||
| 2026-02-02 | 13F | CENTRAL TRUST Co | 598 | 0,00 | 14 | -30,00 | ||||
| 2026-02-09 | 13F | Keating Financial Advisory Services, Inc. | 123 | 3 | ||||||
| 2026-02-17 | 13F | Russell Investments Group, Ltd. | 1.022.877 | -15,96 | 24.642 | -41,62 | ||||
| 2026-04-06 | 13F | GAMMA Investing LLC | 18.352 | 43,27 | 468 | 51,62 | ||||
| 2026-02-17 | 13F | Bank Of America Corp /de/ | Call | 0 | -100,00 | 0 | -100,00 | |||
| 2026-02-17 | 13F | Price T Rowe Associates Inc /md/ | 1.543.885 | -3,63 | 37 | -32,73 | ||||
| 2026-02-19 | 13F | Atomi Financial Group, Inc. | 0 | -100,00 | 0 | |||||
| 2026-02-11 | 13F | O'shaughnessy Asset Management, Llc | 27.030 | -46,42 | 651 | -62,78 | ||||
| 2026-01-28 | 13F | Universal- Beteiligungs- und Servicegesellschaft mbH | 300.940 | 10,42 | 7.269 | -23,09 | ||||
| 2026-02-17 | 13F | Glenmede Trust Co Na | 10.431 | 20,56 | 251 | 7,73 | ||||
| 2026-02-17 | 13F | Bank Of America Corp /de/ | Put | 0 | -100,00 | 0 | -100,00 | |||
| 2026-02-13 | 13F | Van Eck Associates Corp | 1.251.927 | -15,76 | 30 | -41,18 | ||||
| 2026-01-29 | 13F | IMC-Chicago, LLC | 195.207 | 461,62 | 4.703 | 290,21 | ||||
| 2026-01-29 | 13F | IMC-Chicago, LLC | Put | 371.900 | 10,00 | 8.959 | -23,59 | |||
| 2026-01-29 | 13F | IMC-Chicago, LLC | Call | 319.500 | -27,65 | 7.697 | -49,75 | |||
| 2026-02-10 | 13F | State of Wyoming | 6.809 | -31,87 | 164 | -52,60 | ||||
| 2026-02-17 | 13F | Maryland State Retirement & Pension System | 14.952 | 0,00 | 360 | -30,50 | ||||
| 2026-01-29 | 13F | Financial Life Planners | 0 | -100,00 | 0 | |||||
| 2026-01-16 | 13F | Tema Etfs Llc | 5.747 | 138 | ||||||
| 2026-01-09 | 13F | Assenagon Asset Management S.A. | 54.054 | 1.302 | ||||||
| 2026-02-05 | 13F | Sapient Capital Llc | 0 | -100,00 | 0 | |||||
| 2026-02-13 | 13F | Meixler Investment Management, Ltd. | 0 | -100,00 | 0 | -100,00 | ||||
| 2025-11-17 | 13F | PDT Partners, LLC | 0 | -100,00 | 0 | -100,00 | ||||
| 2026-02-10 | 13F | Axq Capital, Lp | 62.963 | 485,21 | 1.517 | 306,43 | ||||
| 2026-04-02 | 13F | Ares Financial Consulting, LLC | 37 | 0,00 | 1 | |||||
| 2026-02-05 | 13F | Northwestern Mutual Investment Management Company, Llc | 10.140 | 0,25 | 244 | -30,29 | ||||
| 2025-10-20 | 13F | Diversified Trust Co | 0 | -100,00 | 0 | -100,00 | ||||
| 2026-01-22 | 13F | Massachusetts Financial Services Co /ma/ | 0 | -100,00 | 0 | |||||
| 2026-03-20 | 13F/A | Hsbc Holdings Plc | Call | 77.600 | -11,11 | 1.881 | -37,75 | |||
| 2026-02-09 | 13F | Beck Bode, LLC | 0 | -100,00 | 0 | |||||
| 2026-03-20 | 13F/A | Hsbc Holdings Plc | 1.014.987 | 62,69 | 24.556 | 13,64 | ||||
| 2026-01-30 | 13F | Archer Investment Corp | 40 | 0,00 | 1 | -100,00 | ||||
| 2026-01-09 | 13F | SG Americas Securities, LLC | 734.482 | 764,18 | 18 | 750,00 | ||||
| 2026-03-20 | 13F/A | Hsbc Holdings Plc | Put | 168.400 | -10,99 | 4.081 | -37,66 | |||
| 2026-02-17 | 13F | Altshuler Shaham Ltd | Call | 21 | 4 | |||||
| 2026-01-14 | 13F | Exchange Traded Concepts, Llc | 5.181 | 20,49 | 125 | -16,78 | ||||
| 2026-02-13 | 13F | Charles Schwab Investment Management Inc | 3.795.475 | 2,62 | 91.433 | -28,72 | ||||
| 2026-02-13 | 13F | Great West Life Assurance Co /can/ | 198.225 | 17,81 | 5 | -20,00 | ||||
| 2026-02-13 | 13F | Ubs Asset Management Americas Inc | 1.000.346 | 2,16 | 24.098 | -29,04 | ||||
| 2026-02-17 | 13F | Freestone Grove Partners LP | 102.510 | 2.469 | ||||||
| 2026-02-10 | 13F | Norges Bank | 4.280.977 | 103.129 | ||||||
| 2026-01-23 | 13F | Optima Capital Llc | 207 | 5 | ||||||
| 2026-02-17 | 13F | Altshuler Shaham Ltd | 1.011 | 24 | ||||||
| 2026-02-23 | 13F | Virtu Financial LLC | 52.323 | 1 | ||||||
| 2026-02-06 | 13F | Handelsbanken Fonder AB | 76.200 | 0,00 | 2 | -50,00 | ||||
| 2026-02-19 | 13F | Mcguire Capital Advisors Inc | 725 | 17 | ||||||
| 2026-02-17 | 13F | Dark Forest Capital Management Lp | 66.300 | 30,87 | 1.597 | -9,05 | ||||
| 2026-02-17 | 13F | Boothbay Fund Management, Llc | 38.853 | 125,93 | 936 | 56,88 | ||||
| 2026-02-06 | 13F | Twin Capital Management Inc | 0 | -100,00 | 0 | -100,00 | ||||
| 2025-10-24 | 13F | Loring Wolcott & Coolidge Fiduciary Advisors Llp/ma | 0 | -100,00 | 0 | -100,00 | ||||
| 2025-10-31 | 13F | Estate Counselors, LLC | 0 | -100,00 | 0 | -100,00 | ||||
| 2026-02-12 | 13F | Hrt Financial Lp | 28.500 | 174,04 | 1 | |||||
| 2025-11-17 | 13F | LGT Financial Advisors LLC | 0 | -100,00 | 0 | |||||
| 2025-11-12 | 13F | Lansing Street Advisors | 0 | -100,00 | 0 | -100,00 | ||||
| 2026-02-12 | 13F | Wealthspire Advisors, LLC | 0 | -100,00 | 0 | |||||
| 2026-02-05 | 13F | HighMark Wealth Management LLC | 85 | 0,00 | 2 | 0,00 | ||||
| 2025-11-14 | 13F | AXA Investment Managers S.A. | 71.753 | 2.488 | ||||||
| 2026-02-11 | 13F | Deseret Mutual Benefit Administrators | 1.944 | 14,42 | 47 | -20,69 | ||||
| 2026-01-27 | 13F | Forum Financial Management, LP | 13.660 | 0,14 | 329 | -30,44 | ||||
| 2026-02-06 | 13F | Poehling Capital Management, LLC | 0 | -100,00 | 0 | |||||
| 2026-02-06 | 13F | Global Retirement Partners, LLC | 2.368 | -8,99 | 57 | -36,67 | ||||
| 2025-10-27 | 13F | Kiker Wealth Management, LLC | 0 | -100,00 | 0 | |||||
| 2026-01-21 | 13F | SJS Investment Consulting Inc. | 720 | 2.780,00 | 17 | |||||
| 2026-02-09 | 13F/A | Swedbank AB | 510.983 | 0,00 | 12.310 | -30,54 | ||||
| 2026-02-12 | 13F | Xponance, Inc. | 64.576 | 3,50 | 1.556 | -28,11 | ||||
| 2026-02-24 | 13F | Chelsea Counsel Co | 1.000 | 0,00 | 24 | -29,41 | ||||
| 2026-02-13 | 13F | Quinn Opportunity Partners LLC | 29.814 | -12,41 | 718 | -39,15 | ||||
| 2026-02-11 | 13F | Allianz Asset Management GmbH | 2.279.462 | 4,84 | 54.912 | -27,18 | ||||
| 2026-02-13 | 13F | Transamerica Financial Advisors, Inc. | 107 | 114,00 | 3 | 100,00 | ||||
| 2026-02-03 | 13F | Mitsubishi UFJ Kokusai Asset Management Co., Ltd. | 415.927 | 18,42 | 10.406 | -14,57 | ||||
| 2026-01-22 | 13F | Pinnacle Bancorp, Inc. | 274 | 53,07 | 7 | 0,00 | ||||
| 2026-02-17 | 13F | Laird Norton Trust Company, Llc | 17.793 | 429 | ||||||
| 2026-02-17 | 13F | Crawford Fund Management, LLC | Call | 82.000 | -13,68 | 1.975 | -40,04 | |||
| 2026-02-17 | 13F | Capital Fund Management S.a. | Put | 144.400 | 22,06 | 3.479 | -15,21 | |||
| 2026-02-17 | 13F | Capital Fund Management S.a. | Call | 124.800 | 0,24 | 3.006 | -30,37 | |||
| 2026-01-16 | 13F | Standard Life Aberdeen plc | 18.034 | -44,87 | 434 | -61,76 | ||||
| 2025-11-14 | 13F | Mbb Public Markets I Llc | 0 | -100,00 | 0 | |||||
| 2026-02-13 | 13F | Integrated Wealth Concepts LLC | 44.872 | 122,24 | 1.081 | 54,29 | ||||
| 2026-02-06 | 13F | Bastion Asset Management Inc. | 0 | -100,00 | 0 | |||||
| 2026-02-13 | 13F | MAI Capital Management | 10.717 | -3,71 | 258 | -32,99 | ||||
| 2026-02-10 | 13F | Rothschild Investment Llc | 504 | -95,53 | 12 | -96,93 | ||||
| 2026-02-19 | 13F | Invesco Ltd. | 11.840.398 | 28,89 | 285.235 | -10,47 | ||||
| 2026-02-13 | 13F | Y-Intercept (Hong Kong) Ltd | 143.524 | 3.457 | ||||||
| 2026-02-11 | 13F | TCTC Holdings, LLC | 645 | 0,00 | 16 | -31,82 | ||||
| 2026-02-06 | 13F | PKO BP BANKOWY Universal Pension Society JSC | 35.000 | 0,00 | 843 | -30,50 | ||||
| 2026-02-12 | 13F | Caerus Investment Advisors, LLC | 0 | -100,00 | 0 | |||||
| 2026-01-12 | 13F | Rialto Wealth Management, LLC | 63 | -11,27 | 2 | -50,00 | ||||
| 2026-02-17 | 13F | Utah Retirement Systems | 52.400 | 0,00 | 1.262 | -30,54 | ||||
| 2025-12-22 | 13F | Sherman Porfolios, Llc | 0 | -100,00 | 0 | -100,00 | ||||
| 2026-01-13 | 13F | Mather Group, Llc. | 0 | -100,00 | 0 | |||||
| 2026-01-26 | 13F | Mirae Asset Global Investments Co., Ltd. | 54.745 | -37,72 | 1.319 | -56,76 | ||||
| 2026-01-30 | 13F | Trifecta Capital Advisors, LLC | 0 | -100,00 | 0 | |||||
| 2026-02-06 | 13F | ProShare Advisors LLC | 125.316 | 57,47 | 3.019 | 9,39 | ||||
| 2026-02-12 | 13F | Investment Research Partners LLC | 17.547 | -3,32 | 423 | -18,69 | ||||
| 2026-02-17 | 13F | Auxier Asset Management | 59.274 | -1,01 | 1.428 | -31,26 | ||||
| 2026-02-17 | 13F | Algert Global Llc | 387.295 | 1,88 | 9 | -30,77 | ||||
| 2026-01-27 | 13F | Brighton Jones Llc | 0 | -100,00 | 0 | |||||
| 2026-02-17 | 13F | Moore Capital Management, Lp | 231.177 | -15,76 | 5.569 | -41,48 | ||||
| 2026-03-04 | 13F | SHP Wealth Management | 500 | 12 | ||||||
| 2026-02-02 | 13F | Core Alternative Capital | 127.262 | -3,95 | 3.066 | -33,28 | ||||
| 2026-01-26 | 13F | Cwm, Llc | 89.129 | -64,17 | 2 | -75,00 | ||||
| 2026-02-12 | 13F | Sit Investment Associates Inc | 0 | -100,00 | 0 | |||||
| 2025-11-14 | 13F | Point72 Europe (London) LLP | 92.013 | 31,26 | 3.191 | 24,79 | ||||
| 2026-01-29 | 13F | Teachers Retirement System Of The State Of Kentucky | 24.845 | 0,00 | 1 | |||||
| 2026-02-17 | 13F | Jump Financial, LLC | 324.595 | -17,12 | 7.819 | -42,43 | ||||
| 2026-02-12 | 13F | Cibc World Markets Corp | 33.140 | -82,11 | 798 | -88,19 | ||||
| 2025-11-14 | 13F | Full Sail Capital, LLC | 6.627 | 230 | ||||||
| 2026-01-22 | 13F | Foundation Resource Management Inc | 651.468 | 1,29 | 15.694 | -29,64 | ||||
| 2026-02-17 | 13F | Quadrature Capital Ltd | 53.745 | 6,95 | 1.295 | -25,72 | ||||
| 2026-02-23 | 13F | Mv Capital Management, Inc. | 53 | -76,96 | 1 | -85,71 | ||||
| 2026-01-22 | 13F | Fiduciary Alliance LLC | 0 | -100,00 | 0 | |||||
| 2026-02-17 | 13F | FIL Ltd | 862 | 1,53 | 21 | -31,03 | ||||
| 2026-02-05 | 13F | Cardinal Point Capital Management, ULC | 0 | -100,00 | 0 | |||||
| 2025-10-31 | 13F | BCJ Capital Management, LLC | 0 | -100,00 | 0 | -100,00 | ||||
| 2026-02-04 | 13F | Sentry Investment Management Llc | 869 | 0,00 | 0 | |||||
| 2026-01-30 | 13F | State of New Jersey Common Pension Fund D | 113.650 | 1,79 | 2.738 | -29,31 | ||||
| 2026-02-13 | 13F | Colony Group, LLC | 226.555 | 159,57 | 5.465 | 80,60 | ||||
| 2026-02-27 | 13F | Strategic Investment Solutions, Inc. /IL | 660 | 22,22 | 16 | -16,67 | ||||
| 2026-02-09 | 13F | Huntington National Bank | 1.634 | -47,54 | 39 | -63,89 | ||||
| 2026-02-17 | 13F | Credit Agricole S A | 96.412 | -37,23 | 2.323 | -56,40 | ||||
| 2026-02-11 | 13F | First Command Advisory Services, Inc. | 163 | 0,00 | 4 | -40,00 | ||||
| 2026-01-27 | 13F | Probity Advisors, Inc. | 0 | -100,00 | 0 | |||||
| 2026-02-13 | 13F | Walleye Trading LLC | Call | 187.600 | -22,38 | 4.519 | -46,09 | |||
| 2026-02-13 | 13F | Walleye Trading LLC | 138.014 | -4,50 | 3.325 | -33,67 | ||||
| 2026-02-09 | 13F | Atlantic Trust, LLC | 30 | -77,10 | 1 | -100,00 | ||||
| 2026-04-08 | 13F | Arlington Trust Co LLC | 78 | 2 | ||||||
| 2026-02-13 | 13F | Ceredex Value Advisors LLC | 733.551 | 17.671 | ||||||
| 2026-02-04 | 13F | Hartford Investment Management Co | 18.648 | 0,00 | 449 | -30,50 | ||||
| 2026-02-13 | 13F | Walleye Trading LLC | Put | 223.800 | 16,26 | 5.391 | -19,24 | |||
| 2025-11-14 | 13F | Hawk Ridge Capital Management Lp | 0 | -100,00 | 0 | -100,00 | ||||
| 2026-01-21 | 13F | Sowell Financial Services LLC | 16.660 | 401 | ||||||
| 2026-02-10 | 13F | 360 Financial, Inc. | 7.000 | 0,00 | 243 | 0,00 | ||||
| 2026-01-27 | 13F | First Horizon Corp | 288 | -55,56 | 7 | -72,73 | ||||
| 2026-02-10 | 13F/A | Northwestern Mutual Wealth Management Co | 22.757 | 5,74 | 548 | -26,54 | ||||
| 2026-02-17 | 13F | Warren Averett Asset Management, LLC | 0 | -100,00 | 0 | |||||
| 2026-04-07 | 13F | Sage Capital Advisors,llc | 360.665 | 9.197 | ||||||
| 2026-01-23 | 13F | Patton Fund Management, Inc. | 9.066 | 19,89 | 218 | -16,79 | ||||
| 2026-02-05 | 13F | Applied Finance Capital Management, LLC | 0 | -100,00 | 0 | |||||
| 2026-02-20 | 13F/A | Prestige Wealth Management Group LLC | 0 | -100,00 | 0 | |||||
| 2026-02-02 | 13F | Strs Ohio | 7.558 | 0,17 | 182 | -30,27 | ||||
| 2026-02-03 | 13F | Ethic Inc. | 16.290 | -4,30 | 392 | -33,56 | ||||
| 2026-01-29 | 13F | UMA Financial Services, Inc. | 19 | -89,73 | 0 | -100,00 | ||||
| 2026-02-12 | 13F | Jane Street Group, Llc | Call | 252.000 | -33,89 | 6.071 | -54,08 | |||
| 2026-02-12 | 13F | Jane Street Group, Llc | Put | 1.002.000 | 7,83 | 24.138 | -25,09 | |||
| 2026-02-12 | 13F | Jane Street Group, Llc | 9.209 | -87,13 | 222 | -91,09 | ||||
| 2025-11-14 | 13F | GeoSphere Capital Management | 0 | -100,00 | 0 | -100,00 | ||||
| 2026-01-12 | 13F | CVA Family Office, LLC | 3.600 | -21,21 | 87 | -45,57 | ||||
| 2026-02-05 | 13F | Requisite Capital Management, LLC | 0 | -100,00 | 0 | |||||
| 2026-02-10 | 13F | DT Investment Partners, LLC | 759 | 0,00 | 18 | -30,77 | ||||
| 2025-11-13 | 13F | Texas Capital Bancshares Inc/tx | 20 | 1 | ||||||
| 2026-02-11 | 13F | Simplex Trading, Llc | Put | 251.500 | 10,99 | 6.059 | 86.442,86 | |||
| 2026-02-17 | 13F | Creative Planning | 95.860 | 3,87 | 2.309 | -27,84 | ||||
| 2026-02-11 | 13F | Simplex Trading, Llc | Call | 316.800 | -14,38 | 7.632 | 63.491,67 | |||
| 2026-02-17 | 13F | Man Group plc | 491.731 | 257,17 | 11.846 | 148,11 | ||||
| 2026-04-06 | 13F | CX Institutional | 5.335 | 16,05 | 0 | |||||
| 2026-02-06 | 13F | Tortoise Investment Management, LLC | 0 | -100,00 | 0 | |||||
| 2026-02-17 | 13F | Css Llc/il | Call | 20.000 | 300,00 | 482 | 178,03 | |||
| 2026-02-12 | 13F | McMillan Office, Inc. | 95 | 2 | ||||||
| 2026-02-17 | 13F | Css Llc/il | 34.008 | 306,89 | 819 | 183,39 | ||||
| 2026-02-17 | 13F | Humankind Investments LLC | 0 | -100,00 | 0 | |||||
| 2026-02-06 | 13F | Plan A Wealth LLC | 11.854 | 7,29 | 286 | -25,59 | ||||
| 2025-11-05 | 13F | John G Ullman & Associates Inc | 0 | -100,00 | 0 | -100,00 | ||||
| 2026-02-13 | 13F | Bornite Capital Management LP | 300.000 | 7.227 | ||||||
| 2026-02-13 | 13F | Neuberger Berman Group LLC | 39.562 | -14,35 | 953 | -40,47 | ||||
| 2026-02-13 | 13F | Goehring & Rozencwajg Associates, LLC | 451.046 | 5,33 | 10.866 | -26,84 | ||||
| 2025-10-15 | 13F | Stephens Consulting, LLC | 0 | -100,00 | 0 | |||||
| 2026-02-13 | 13F | Schroder Investment Management Group | 53.247 | -75,43 | 1.286 | -82,91 | ||||
| 2026-02-10 | 13F | Savant Capital, LLC | 16.512 | -21,59 | 398 | -45,62 | ||||
| 2026-02-04 | 13F | Clark Wealth Partners | 0 | -100,00 | 0 | |||||
| 2026-02-26 | 13F | Anchor Investment Management, LLC | 0 | -100,00 | 0 | |||||
| 2026-02-17 | 13F | PharVision Advisers, LLC | 0 | -100,00 | 0 | |||||
| 2026-01-22 | 13F | Paragon Capital Management Ltd | 0 | -100,00 | 0 | |||||
| 2026-02-10 | 13F | Moors & Cabot, Inc. | 13.670 | 2,32 | 329 | -28,94 | ||||
| 2026-02-13 | 13F | Pine Valley Investments Ltd Liability Co | Call | 7.769 | 6,12 | |||||
| 2026-02-13 | 13F | Pine Valley Investments Ltd Liability Co | 1.187.466 | 301,31 | 28.606 | 178,78 | ||||
| 2026-02-13 | 13F | Mariner, LLC | 108.283 | -17,98 | 2.609 | -43,01 | ||||
| 2026-02-17 | 13F | Brown Financial Advisors | 0 | -100,00 | 0 | |||||
| 2026-02-13 | 13F | Bridgewater Associates, LP | 28.466 | -50,53 | 686 | -65,66 | ||||
| 2026-02-09 | 13F | Key FInancial Inc | 69 | 0,00 | 2 | -50,00 | ||||
| 2026-02-12 | 13F | Cloud Capital Management, LLC | 0 | -100,00 | 0 | |||||
| 2026-02-09 | 13F | Bleakley Financial Group, LLC | 135.745 | 1,56 | 3.270 | -29,45 | ||||
| 2026-02-11 | 13F | Cerity Partners LLC | 64.933 | -75,67 | 1.564 | -83,10 | ||||
| 2026-02-13 | 13F | Toroso Investments, LLC | 46.379 | 38,46 | 1.117 | -3,79 | ||||
| 2026-02-03 | 13F | Generali Asset Management SPA SGR | 43.420 | 0,00 | 1.046 | -30,56 | ||||
| 2026-02-10 | 13F | Quantbot Technologies LP | 0 | -100,00 | 0 | -100,00 | ||||
| 2026-02-06 | 13F | Evoke Wealth, Llc | 0 | -100,00 | 0 | |||||
| 2026-02-13 | 13F | Gmt Capital Corp | 945.600 | -58,50 | 22.780 | -71,17 | ||||
| 2026-02-11 | 13F | Zions Bancorporation, National Association /ut/ | 453 | 297,37 | 11 | 233,33 | ||||
| 2025-10-20 | 13F | Shilanski & Associates, Inc. | 58.374 | 2.024 | ||||||
| 2026-02-17 | 13F | DoubleLine ETF Adviser LP | 0 | -100,00 | 0 | |||||
| 2026-02-12 | 13F | Commonwealth Equity Services, Llc | 13.629 | -10,25 | 328 | |||||
| 2026-02-12 | 13F | MetLife Investment Management, LLC | 647.713 | -0,34 | 15.603 | -30,78 | ||||
| 2025-11-14 | 13F | Genus Capital Management Inc. | 0 | -100,00 | 0 | -100,00 | ||||
| 2026-01-07 | 13F | Massmutual Trust Co Fsb/adv | 210 | -58,42 | 5 | -70,59 | ||||
| 2026-02-17 | 13F | Rexford Capital Inc | 761 | 0,00 | 18 | -30,77 | ||||
| 2026-02-13 | 13F | Hudson Bay Capital Management LP | Call | 65.000 | 1.566 | |||||
| 2026-02-17 | 13F | Advisor Group Holdings, Inc. | 54.835 | -19,93 | 1.321 | -42,62 | ||||
| 2026-01-29 | 13F | Calamos Wealth Management LLC | 27.957 | 0,00 | 673 | -30,55 | ||||
| 2026-02-13 | 13F | Pinnacle Wealth Planning Services, Inc. | 1.260 | 30 | ||||||
| 2026-02-13 | 13F | Cohen & Steers, Inc. | 488.959 | 15,84 | 12 | -21,43 | ||||
| 2026-02-10 | 13F | Connor, Clark & Lunn Investment Management Ltd. | 294.991 | 400,63 | 7.106 | 247,82 | ||||
| 2026-01-20 | 13F | Joule Financial, LLC | 0 | -100,00 | 0 | -100,00 | ||||
| 2026-02-10 | 13F | Ritter Daniher Financial Advisory LLC / DE | 75 | 2 | ||||||
| 2026-02-11 | 13F | Group One Trading, L.p. | Put | 199.000 | 13,13 | 4.794 | -21,43 | |||
| 2026-02-11 | 13F | Group One Trading, L.p. | 155.335 | 3,05 | 3.742 | -28,41 | ||||
| 2026-02-10 | 13F | Goldman Sachs Group Inc | Call | 0 | -100,00 | 0 | -100,00 | |||
| 2026-02-11 | 13F | Group One Trading, L.p. | Call | 206.300 | -1,81 | 4.970 | -31,80 | |||
| 2026-02-17 | 13F | Twinbeech Capital Lp | 45.633 | 1.099 | ||||||
| 2026-02-13 | 13F | Gen-Wealth Partners Inc | 1.337 | 32 | ||||||
| 2026-02-13 | 13F | Allianz Se | 56.800 | 0,00 | 1.368 | -30,52 | ||||
| 2026-02-11 | 13F | SOUTH STATE Corp | 15.890 | -7,08 | 383 | -35,58 | ||||
| 2026-02-05 | 13F | North Dakota State Investment Board | 10.819 | 261 | ||||||
| 2025-11-07 | 13F | Shell Asset Management Co | 0 | 0 | ||||||
| 2026-02-17 | 13F | D. E. Shaw & Co., Inc. | Put | 252.200 | 36,25 | 6.075 | -5,36 | |||
| 2026-02-17 | 13F | D. E. Shaw & Co., Inc. | 3.014.612 | -33,17 | 72.622 | -53,58 | ||||
| 2026-02-17 | 13F | Aster Capital Management (DIFC) Ltd | 3.744 | 43,83 | 90 | 0,00 | ||||
| 2026-02-12 | 13F | CoreCommodity Management, LLC | 0 | -100,00 | 0 | |||||
| 2026-02-02 | 13F | Breakwater Investment Management | 0 | -100,00 | 0 | |||||
| 2026-02-17 | 13F | Aqr Capital Management Llc | 7.759.651 | -8,14 | 186.930 | -35,84 | ||||
| 2026-02-13 | 13F | Caitong International Asset Management Co., Ltd | 0 | -100,00 | 0 | |||||
| 2026-01-20 | 13F | Thurston, Springer, Miller, Herd & Titak, Inc. | 35 | 1 | ||||||
| 2026-02-02 | 13F | Sachetta, LLC | 118 | 31,11 | 3 | -33,33 | ||||
| 2026-02-02 | 13F | Fifth Third Bancorp | 23.746 | -1,50 | 572 | -31,58 | ||||
| 2026-02-06 | 13F | Covestor Ltd | 364 | 0,28 | 0 | |||||
| 2026-02-17 | 13F | Tudor Investment Corp Et Al | Put | 9.600 | 231 | |||||
| 2026-02-13 | 13F | QTR Family Wealth, LLC | 0 | -100,00 | 0 | |||||
| 2026-02-04 | 13F | Securian Asset Management, Inc | 8.630 | -43,50 | 208 | -60,87 | ||||
| 2026-02-17 | 13F | Tudor Investment Corp Et Al | Call | 12.100 | -63,77 | 291 | -74,87 | |||
| 2026-01-26 | 13F | Parcion Private Wealth LLC | 0 | -100,00 | 0 | |||||
| 2026-02-13 | 13F | Wells Fargo & Company/mn | 396.703 | 38,16 | 9.557 | -4,04 | ||||
| 2026-01-21 | 13F | Newbridge Financial Services Group, Inc. | 2.102 | 0,00 | 51 | -30,56 | ||||
| 2026-02-12 | 13F | Distillate Capital Partners LLC | 8 | 700,00 | 0 | |||||
| 2026-01-27 | 13F | Asset Management One Co., Ltd. | 11.914 | 4,03 | 287 | -27,96 | ||||
| 2026-02-10 | 13F | Td Asset Management Inc | 368.079 | 2,83 | 8.867 | -28,57 | ||||
| 2026-02-17 | 13F | Tudor Investment Corp Et Al | 0 | -100,00 | 0 | -100,00 | ||||
| 2026-02-17 | 13F | D. E. Shaw & Co., Inc. | Call | 11.700 | -36,07 | 282 | -55,68 | |||
| 2026-02-13 | 13F | Centerpoint Advisors, LLC | 200 | 0,00 | 0 | |||||
| 2026-02-12 | 13F | Great Lakes Advisors, Llc | 114.472 | -31,35 | 2.758 | -52,32 | ||||
| 2026-02-10 | 13F | Daiwa Securities Group Inc. | 24.392 | 6,28 | 1 | |||||
| 2026-01-20 | 13F | Tritonpoint Wealth, Llc | 0 | -100,00 | 0 | |||||
| 2026-02-12 | 13F | Swiss National Bank | 625.744 | 1,72 | 15.074 | -29,34 | ||||
| 2026-02-13 | 13F | Recurrent Investment Advisors LLC | 52.047 | 108,55 | 1.254 | 44,86 | ||||
| 2026-02-13 | 13F | TRUE Private Wealth Advisors | 8.320 | 0,00 | 200 | -30,56 | ||||
| 2026-02-09 | 13F | Cary Street Partners Financial Llc | 19.604 | 1,98 | 472 | -29,13 | ||||
| 2026-01-15 | 13F | Allspring Global Investments Holdings, LLC | 17.547 | 22,22 | 439 | -9,48 | ||||
| 2026-02-06 | 13F | Cadence Wealth Management LLC | 35.238 | 32,64 | 849 | -7,93 | ||||
| 2026-01-14 | 13F | Jfs Wealth Advisors, Llc | 341 | 51,56 | 8 | 14,29 | ||||
| 2026-02-13 | 13F | Ossiam | 0 | -100,00 | 0 | |||||
| 2026-02-05 | 13F | Amalgamated Bank | 66.762 | 10,13 | 2 | -50,00 | ||||
| 2025-12-02 | 13F | Allworth Financial LP | Call | 3 | ||||||
| 2026-02-11 | 13F | GW&K Investment Management, LLC | 320 | 59,20 | 0 | |||||
| 2026-02-17 | 13F | Wiley Bros.-aintree Capital, Llc | 0 | -100,00 | 0 | |||||
| 2026-01-14 | 13F | Pallas Capital Advisors LLC | 0 | -100,00 | 0 | |||||
| 2026-01-23 | 13F | Live Oak Private Wealth LLC | 190.810 | -14,20 | 4.597 | -40,40 | ||||
| 2025-11-14 | 13F | WealthTrak Capital Management LLC | 0 | -100,00 | 0 | -100,00 | ||||
| 2026-02-13 | 13F | Police & Firemen's Retirement System of New Jersey | 132.758 | -4,95 | 3.198 | -33,97 | ||||
| 2026-01-29 | 13F | D.a. Davidson & Co. | 0 | -100,00 | 0 | |||||
| 2026-02-03 | 13F | Chesapeake Capital Corp /il/ | 0 | -100,00 | 0 | |||||
| 2026-04-09 | 13F | Butensky & Cohen Financial Security, Inc | 174.065 | 4,38 | 4.439 | 10,48 | ||||
| 2026-02-13 | 13F | Pin Oak Investment Advisors Inc | 300 | 0,00 | 0 | -100,00 | ||||
| 2026-01-22 | 13F | Maseco Llp | 309 | 0,00 | 7 | -30,00 | ||||
| 2026-01-30 | 13F | Catalytic Wealth RIA, LLC | 0 | -100,00 | 0 | |||||
| 2026-02-13 | 13F | Centiva Capital, LP | 20.418 | 492 | ||||||
| 2026-01-28 | 13F | DekaBank Deutsche Girozentrale | 70.314 | 0,00 | 2 | 0,00 | ||||
| 2026-02-17 | 13F | Public Employees Retirement System Of Ohio | 102.332 | -3,38 | 2.465 | -32,89 | ||||
| 2026-01-22 | 13F | Bfsg, Llc | 39 | 0,00 | 1 | -100,00 | ||||
| 2026-02-12 | 13F | Aegis Financial Corp | 853.638 | 20.564 | ||||||
| 2026-02-13 | 13F | National Bank Of Canada /fi/ | 207.609 | -7,15 | 5.001 | -35,50 | ||||
| 2026-02-05 | 13F | S&co Inc | 973.872 | -9,48 | 23 | -37,84 | ||||
| 2026-02-18 | 13F/A | Empowered Funds, LLC | 410.978 | 1.815,98 | 9.900 | 1.232,44 | ||||
| 2025-11-13 | 13F | Total Investment Management Inc | 0 | -100,00 | 0 | -100,00 | ||||
| 2026-02-10 | 13F | Foundations Investment Advisors, LLC | 14.020 | 338 | ||||||
| 2026-01-26 | 13F | Pursuit Wealth Management LLC | 19.539 | 471 | ||||||
| 2026-02-17 | 13F | Merewether Investment Management, LP | 0 | -100,00 | 0 | |||||
| 2026-01-20 | 13F | AdvisorNet Financial, Inc | 1.954 | 24,46 | 47 | -12,96 | ||||
| 2025-11-14 | 13F | Toronto Dominion Bank | Put | 0 | -100,00 | 0 | -100,00 | |||
| 2026-02-05 | 13F | Convergence Investment Partners, LLC | 37.231 | -39,35 | 897 | -57,89 | ||||
| 2026-02-11 | 13F | Ameritas Investment Partners, Inc. | 2.893 | 0,00 | 70 | -31,00 | ||||
| 2026-01-21 | 13F | Hunter Associates Investment Management Llc | 0 | -100,00 | 0 | |||||
| 2026-02-10 | 13F | Murphy & Mullick Capital Management Corp | 8 | 0 | ||||||
| 2026-02-17 | 13F | California State Teachers Retirement System | 299.858 | -0,09 | 7.224 | -30,60 | ||||
| 2025-11-12 | 13F | Simplex Trading, Llc | 0 | -100,00 | 0 | -100,00 | ||||
| 2026-01-22 | 13F | Financial Consulate, Inc | 0 | -100,00 | 0 | -100,00 | ||||
| 2026-02-10 | 13F | Root Financial Partners, LLC | 871 | -28,14 | 21 | -52,38 | ||||
| 2026-02-13 | 13F | Healthcare Of Ontario Pension Plan Trust Fund | 12.547 | -95,31 | 302 | -96,74 | ||||
| 2026-02-17 | 13F | Weiss Asset Management LP | 654.408 | 15.765 | ||||||
| 2026-02-10 | 13F | Acadian Asset Management Llc | 0 | -100,00 | 0 | |||||
| 2026-02-17 | 13F | Mairs & Power Inc | 24.000 | -18,64 | 578 | -43,50 | ||||
| 2026-02-05 | 13F | New York Life Investment Management Llc | 57.364 | -23,15 | 1.382 | -46,64 | ||||
| 2026-01-16 | 13F | Compagnie Lombard Odier SCmA | 1.000 | 0,00 | 24 | -29,41 | ||||
| 2026-02-17 | 13F | Ilex Capital Partners (UK) LLP | 0 | -100,00 | 0 | -100,00 | ||||
| 2026-02-10 | 13F | Commonwealth Of Pennsylvania Public School Empls Retrmt Sys | 73.831 | -3,13 | 1.779 | -32,73 | ||||
| 2026-02-10 | 13F | Thompson Siegel & Walmsley Llc | 2.978.232 | 35,80 | 72 | -6,58 | ||||
| 2026-02-11 | 13F | Erste Asset Management GmbH | 0 | 0 | ||||||
| 2026-01-30 | 13F | Activest Wealth Management | 611 | 645,12 | 15 | 600,00 | ||||
| 2026-02-04 | 13F | Versor Investments LP | 44.006 | 396,40 | 1.060 | 245,28 | ||||
| 2026-01-30 | 13F | Us Bancorp \de\ | 37.404 | -12,65 | 901 | -39,33 | ||||
| 2026-01-16 | 13F | FNY Investment Advisers, LLC | 160 | 0 | ||||||
| 2026-01-29 | 13F | Rakuten Securities, Inc. | 964 | 555,78 | 23 | 360,00 | ||||
| 2026-02-02 | 13F | Headinvest, Llc | 24.000 | 0,00 | 578 | -30,53 | ||||
| 2026-02-17 | 13F | Raymond James Financial Inc | 1.371.029 | 25,65 | 33.028 | -12,72 | ||||
| 2026-02-20 | 13F | Kovitz Investment Group Partners, LLC | 0 | -100,00 | 0 | |||||
| 2026-03-16 | 13F/A | Rockefeller Capital Management L.P. | 31.065 | 57,83 | 748 | 9,68 | ||||
| 2026-02-17 | 13F | MIRAE ASSET GLOBAL ETFS HOLDINGS Ltd. | 196.257 | 43,40 | 4.728 | -0,40 | ||||
| 2026-02-09 | 13F | Legal & General Group Plc | 714.051 | -0,92 | 17.201 | -31,17 | ||||
| 2026-02-12 | 13F | Johnson Financial Group, Inc. | 210 | -90,40 | 5 | -93,33 | ||||
| 2026-02-17 | 13F | Gate City Capital Management, Llc | 541.332 | 157,88 | 13.041 | 79,15 | ||||
| 2025-12-16 | 13F | Garde Capital, Inc. | 0 | -100,00 | 0 | |||||
| 2026-02-13 | 13F | Stifel Financial Corp | 131.385 | 24,43 | 3.165 | -13,55 | ||||
| 2026-02-11 | 13F | Nikko Asset Management Americas, Inc. | 17.276 | -1,14 | 416 | -31,24 | ||||
| 2025-10-22 | 13F | Geneos Wealth Management Inc. | 0 | -100,00 | 0 | -100,00 | ||||
| 2026-02-03 | 13F | Strengthening Families & Communities, LLC | 2.894 | -31,63 | 70 | -49,26 | ||||
| 2026-01-23 | 13F | Palouse Capital Management, Inc. | 100 | 2 | ||||||
| 2026-01-07 | 13F | Qp Wealth Management, Llc | 0 | -100,00 | 0 | -100,00 | ||||
| 2026-02-06 | 13F | HighTower Advisors, LLC | Put | 0 | -100,00 | 0 | -100,00 | |||
| 2026-02-17 | 13F | XTX Topco Ltd | 11.927 | 287 | ||||||
| 2026-02-05 | 13F | Stoneridge Investment Partners Llc | 28.805 | 19,76 | 1 | |||||
| 2026-01-29 | 13F | UBS Group AG | Put | 313.500 | -38,95 | 7.552 | -57,59 | |||
| 2026-01-29 | 13F | UBS Group AG | Call | 161.100 | 15,40 | 3.881 | -19,85 | |||
| 2026-01-29 | 13F | UBS Group AG | 2.207.033 | -18,41 | 53.167 | -43,33 | ||||
| 2026-02-10 | 13F | Bnp Paribas Arbitrage, Sa | 1.148.996 | 9,57 | 27.679 | -23,89 | ||||
| 2025-11-14 | 13F | Bridgefront Capital, LLC | 0 | -100,00 | 0 | -100,00 | ||||
| 2026-02-17 | 13F | Caption Management, LLC | Call | 6.500 | 157 | |||||
| 2026-01-30 | 13F | Citizens Financial Group Inc/ri | 0 | -100,00 | 0 | |||||
| 2026-02-13 | 13F | A4 Wealth Advisors LLC | 0 | -100,00 | 0 | |||||
| 2026-02-17 | 13F | Prelude Capital Management, Llc | 14.355 | 66,88 | 346 | 15,77 | ||||
| 2026-02-06 | 13F | Larson Financial Group LLC | 156 | 26,83 | 4 | -25,00 | ||||
| 2026-02-17 | 13F | Balyasny Asset Management Llc | Call | 135.700 | 200,22 | 3.269 | 108,62 | |||
| 2026-02-10 | 13F | Jupiter Asset Management Ltd | 215.646 | -80,62 | 5.195 | -86,54 | ||||
| 2026-02-17 | 13F | Blair William & Co/il | 30.967 | -9,35 | 746 | -37,08 | ||||
| 2026-02-10 | 13F | Inspire Trust Co, N.a. | 139.380 | 0,00 | 3.358 | -30,54 | ||||
| 2026-02-17 | 13F | Balyasny Asset Management Llc | Put | 11.800 | -15,11 | 284 | -41,08 | |||
| 2026-02-27 | 13F | Groupama Asset Managment | 29.708 | -9,41 | 716 | -37,12 | ||||
| 2026-01-27 | 13F | Krilogy Financial LLC | 13.033 | 15,64 | 369 | 25,08 | ||||
| 2025-11-14 | 13F | Capstone Investment Advisors, Llc | Put | 30.500 | 147,97 | 1.058 | 135,94 | |||
| 2026-02-10 | 13F | CIBC Asset Management Inc | 70.751 | 75,16 | 1.704 | 21,71 | ||||
| 2026-02-05 | 13F | Canada Post Corp Registered Pension Plan | 7.969 | -17,75 | 192 | -43,15 | ||||
| 2026-02-17 | 13F | Agf Management Ltd | 15.454 | 43,09 | 372 | -0,53 | ||||
| 2025-11-14 | 13F | Cubist Systematic Strategies, LLC | 713.618 | 151,60 | 24.748 | 139,18 | ||||
| 2025-11-14 | 13F | Capstone Investment Advisors, Llc | Call | 8.600 | 298 | |||||
| 2026-02-17 | 13F | Driehaus Capital Management Llc | 0 | -100,00 | 0 | |||||
| 2025-11-14 | 13F | Cubist Systematic Strategies, LLC | Put | 225.800 | 316,61 | 7.831 | 296,05 | |||
| 2025-11-14 | 13F | Cubist Systematic Strategies, LLC | Call | 59.700 | -71,08 | 2.070 | -72,51 | |||
| 2025-11-14 | 13F | Capstone Investment Advisors, Llc | 16.029 | 556 | ||||||
| 2025-10-16 | 13F | Yeomans Consulting Group, Inc. | 0 | -100,00 | 0 | -100,00 | ||||
| 2025-11-14 | 13F | Mount Yale Investment Advisors, LLC | 0 | -100,00 | 0 | -100,00 | ||||
| 2026-02-17 | 13F | Cim Investment Mangement Inc | 14.986 | 0,00 | 361 | -30,44 | ||||
| 2026-02-17 | 13F | Two Sigma Advisers, Lp | 112.400 | -96,59 | 2.708 | -97,63 | ||||
| 2026-02-17 | 13F | Redwood Investment Management, Llc | 30.116 | -16,01 | 1 | -100,00 | ||||
| 2025-10-21 | 13F | Crowley Wealth Management, Inc. | 0 | -100,00 | 0 | |||||
| 2025-10-24 | 13F | We Are One Seven, LLC | 0 | -100,00 | 0 | -100,00 | ||||
| 2026-02-12 | 13F | Portland Investment Counsel Inc. | 541.202 | 13.038 | ||||||
| 2026-02-12 | 13F | Sustainable Insight Capital Management, LLC | 0 | -100,00 | 0 | |||||
| 2026-01-27 | 13F | Evergreen Capital Management Llc | 9.118 | 25,70 | 220 | -12,75 | ||||
| 2026-02-13 | 13F | Palisade Asset Management, LLC | 0 | -100,00 | 0 | |||||
| 2026-02-17 | 13F | Regal Investment Advisors LLC | 16.860 | 406 | ||||||
| 2026-02-09 | 13F | Terril Brothers, Inc. | 761.960 | 347,17 | 18.356 | 210,63 | ||||
| 2026-02-02 | 13F | Truist Financial Corp | 283.473 | -91,25 | 6.829 | -93,92 | ||||
| 2026-02-14 | 13F | Copley Financial Group, Inc. | 0 | -100,00 | 0 | |||||
| 2026-02-06 | 13F | Profund Advisors Llc | 0 | -100,00 | 0 | |||||
| 2026-01-26 | 13F | KBC Group NV | 365.133 | 0,91 | 9 | -33,33 | ||||
| 2026-01-27 | 13F | WealthCollab, LLC | 0 | -100,00 | 0 | |||||
| 2026-01-28 | 13F | Arizona State Retirement System | 88.091 | -6,16 | 2.122 | -34,81 | ||||
| 2026-02-06 | 13F | Curat Global, LLC | 115 | 0,00 | 3 | -33,33 | ||||
| 2026-02-03 | 13F | Garner Asset Management Corp | 11.659 | -5,66 | 281 | -34,12 | ||||
| 2026-02-13 | 13F | Squarepoint Ops LLC | Call | 203.600 | 248,63 | 4.905 | 142,17 | |||
| 2026-02-13 | 13F | Squarepoint Ops LLC | Put | 139.100 | 3,81 | 3.351 | -27,91 | |||
| 2026-02-13 | 13F | Squarepoint Ops LLC | 3.641.860 | 75,98 | 87.732 | 22,24 | ||||
| 2026-02-13 | 13F | Pathstone Holdings, LLC | 63.270 | -21,79 | 1.524 | -45,67 | ||||
| 2026-01-26 | 13F | Whittier Trust Co Of Nevada Inc | 36 | 0,00 | 1 | -100,00 | ||||
| 2026-01-23 | 13F | Assetmark, Inc | 44 | -88,33 | 1 | -92,31 | ||||
| 2026-02-17 | 13F | Janus Henderson Group Plc | 509.460 | 153,21 | 12.270 | 75,94 | ||||
| 2026-02-06 | 13F | Csenge Advisory Group | 0 | -100,00 | 0 | |||||
| 2026-02-17 | 13F | Fmr Llc | 40.061.882 | 8,26 | 965.091 | -24,80 | ||||
| 2026-02-09 | 13F | Optimize Financial Inc | 9.282 | 1,44 | 224 | -29,65 | ||||
| 2026-02-13 | 13F | State Street Corp | 13.174.708 | 1,86 | 317.379 | -29,25 | ||||
| 2026-02-11 | 13F | Buckingham Strategic Partners | 0 | -100,00 | 0 | |||||
| 2026-02-17 | 13F | Bank Of America Corp /de/ | 2.316.249 | -39,95 | 55.798 | -58,28 | ||||
| 2026-01-29 | 13F | Nbc Securities, Inc. | Put | 12 | 3 | |||||
| 2026-02-05 | 13F | Qsemble Capital Management, LP | 29.250 | -42,26 | 705 | -59,91 | ||||
| 2026-01-30 | 13F | Valued Wealth Advisors LLC | 52 | -24,64 | 1 | -50,00 | ||||
| 2026-02-17 | 13F | NorthRock Partners, LLC | 0 | -100,00 | 0 | |||||
| 2026-02-17 | 13F | State Of Wisconsin Investment Board | 257.404 | -30,75 | 6.201 | -51,90 | ||||
| 2025-11-14 | 13F | Axa S.a. | 0 | -100,00 | 0 | -100,00 | ||||
| 2025-11-12 | 13F | Intech Investment Management Llc | 0 | -100,00 | 0 | -100,00 | ||||
| 2026-02-17 | 13F | Rakuten Investment Management, Inc. | 28.309 | 572,26 | 681 | 26,35 | ||||
| 2026-01-15 | 13F | Trust Co | 10 | 0 | ||||||
| 2026-01-28 | 13F | CAPROCK Group, Inc. | 0 | -100,00 | 0 | |||||
| 2026-02-06 | 13F | Creative Financial Designs Inc /adv | 96 | 0,00 | 2 | -33,33 | ||||
| 2026-02-10 | 13F | Private Wealth Asset Management, LLC | 2.201 | -1,65 | 53 | -31,17 | ||||
| 2026-02-11 | 13F | Donald Smith & Co., Inc. | 4.622.405 | 25,16 | 111.354 | -13,06 | ||||
| 2026-02-17 | 13F | Nomura Holdings Inc | Call | 0 | -100,00 | 0 | ||||
| 2026-01-21 | 13F | Sound Income Strategies, LLC | 35 | -91,78 | 1 | -100,00 | ||||
| 2026-02-11 | 13F | Dorsey & Whitney Trust CO LLC | 0 | -100,00 | 0 | |||||
| 2026-02-17 | 13F | Northern Trust Corp | 4.834.182 | 2,96 | 116.455 | -28,48 | ||||
| 2026-02-17 | 13F | Armistice Capital, Llc | 12.389 | 32,73 | 298 | -7,74 | ||||
| 2026-02-13 | 13F | Bank Of Nova Scotia | 169.376 | -66,32 | 4.080 | -76,61 | ||||
| 2026-02-03 | 13F | Farmers & Merchants Investments Inc | 247 | 0,00 | 6 | -37,50 | ||||
| 2026-02-10 | 13F | Natixis Advisors, L.p. | 11.091 | -74,31 | 0 | -100,00 | ||||
| 2026-01-08 | 13F | True Wealth Design, LLC | 21 | -97,39 | 1 | -100,00 | ||||
| 2026-01-14 | 13F | Sicart Associates LLC | 93.440 | -14,83 | 2.251 | -40,85 | ||||
| 2026-02-05 | 13F | Bessemer Group Inc | 6.256 | 332,64 | 0 | |||||
| 2025-11-05 | 13F | Machina Capital S.a.s. | 0 | -100,00 | 0 | -100,00 | ||||
| 2025-11-14 | 13F | National Bank Of Canada /fi/ | Put | 0 | -100,00 | 0 | -100,00 | |||
| 2026-02-02 | 13F | Cornerstone Planning Group LLC | 8 | -42,86 | 0 | |||||
| 2026-02-13 | 13F | Sei Investments Co | 698.913 | 34,14 | 16.835 | -6,83 | ||||
| 2025-10-31 | 13F | Symphony Financial, Ltd. Co. | 0 | -100,00 | 0 | -100,00 | ||||
| 2026-01-15 | 13F | Uncommon Cents Investing LLC | 17.535 | 15,10 | 422 | -20,08 | ||||
| 2026-02-03 | 13F | Credit Industriel Et Commercial | Put | 100.000 | -9,09 | 2.409 | -36,84 | |||
| 2026-02-06 | 13F | Marble Harbor Investment Counsel, LLC | 10.795 | -23,95 | 260 | -47,15 | ||||
| 2026-02-17 | 13F | Two Sigma Investments, Lp | 225.946 | -90,25 | 5.443 | -93,23 | ||||
| 2026-02-13 | 13F | Kayne Anderson Rudnick Investment Management Llc | 24 | 0,00 | 1 | |||||
| 2026-02-17 | 13F | Royal Bank Of Canada | 338.562 | -26,47 | 8.156 | -48,93 | ||||
| 2026-01-23 | 13F | Lincoln Capital Corp | 0 | -100,00 | 0 | |||||
| 2026-01-27 | 13F | Revisor Wealth Management LLC | 24.726 | 0,02 | 696 | -15,74 | ||||
| 2026-02-03 | 13F | Credit Industriel Et Commercial | 23.539 | 193,54 | 567 | 103,96 | ||||
| 2026-01-23 | 13F | Transcend Wealth Collective, Llc | 0 | -100,00 | 0 | |||||
| 2026-01-15 | 13F | Nisa Investment Advisors, Llc | 44.756 | -48,53 | 1.078 | -64,25 | ||||
| 2026-02-12 | 13F | CIBC Private Wealth Group, LLC | 1.172 | -66,25 | 28 | -76,67 | ||||
| 2026-01-27 | 13F | Belpointe Asset Management LLC | 0 | -100,00 | 0 |