Grundlæggende statistik
| Institutionelle ejere | 384 total, 366 long only, 2 short only, 16 long/short - change of 21,84% MRQ |
| Gennemsnitlig porteføljeallokering | 0.5509 % - change of 7,22% MRQ |
| Institutionelle aktier (lange) | 50.995.200 (ex 13D/G) - change of 7,16MM shares 16,33% MRQ |
| Institutionel værdi (lang) | $ 4.946.192 USD ($1000) |
Institutionelt ejerskab og aktionærer
iShares, Inc. - iShares MSCI South Korea ETF (US:EWY) har 384 institutionelle ejere og aktionærer, der har indsendt 13D/G- eller 13F-formularer til Securities Exchange Commission (SEC). Disse institutioner har i alt 50,995,200 aktier. Største aktionærer omfatter State of Tennessee, Treasury Department, Bank Of America Corp /de/, Morgan Stanley, Bridgewater Associates, LP, Hsbc Holdings Plc, Appaloosa Lp, Susquehanna International Group, Llp, Temasek Holdings (Private) Ltd, Sun Life Financial Inc, and Tudor Investment Corp Et Al .
iShares, Inc. - iShares MSCI South Korea ETF (ARCA:EWY) institutionel ejerskabsstruktur viser aktuelle positioner i virksomheden efter institutioner og fonde, samt seneste ændringer i positionsstørrelse. Større aktionærer kan omfatte individuelle investorer, investeringsforeninger, hedgefonde eller institutioner. Skema 13D angiver, at investoren besidder (eller besidder) mere end 5 % af virksomheden og har til hensigt (eller har til hensigt at) aktivt at forfølge en ændring i forretningsstrategi. Skema 13G indikerer en passiv investering på over 5%.
The share price as of March 11, 2026 is 132,85 / share. Previously, on March 12, 2025, the share price was 55,95 / share. This represents an increase of 137,44% over that period.

Fondens stemningsscore
Fund Sentiment Score (fka Ownership Accumulation Score) finder de aktier, der bliver mest købt af fonde. Det er resultatet af en sofistikeret, multi-faktor kvantitativ model, der identificerer virksomheder med de højeste niveauer af institutionel akkumulering. Scoringsmodellen bruger en kombination af den samlede stigning i oplyste ejere, ændringerne i porteføljeallokeringer i disse ejere og andre målinger. Tallet går fra 0 til 100, hvor højere tal indikerer et højere niveau af akkumulering for sine jævnaldrende, og 50 er gennemsnittet.
Opdateringsfrekvens: Dagligt
Se Ownership Explorer, som giver en liste over højest rangerende virksomheder.
AI+ Ask Fintel’s AI assistant about iShares, Inc. - iShares MSCI South Korea ETF.
Select a question to share a public post with an AI-crafted answer.
Thinking of good questions…
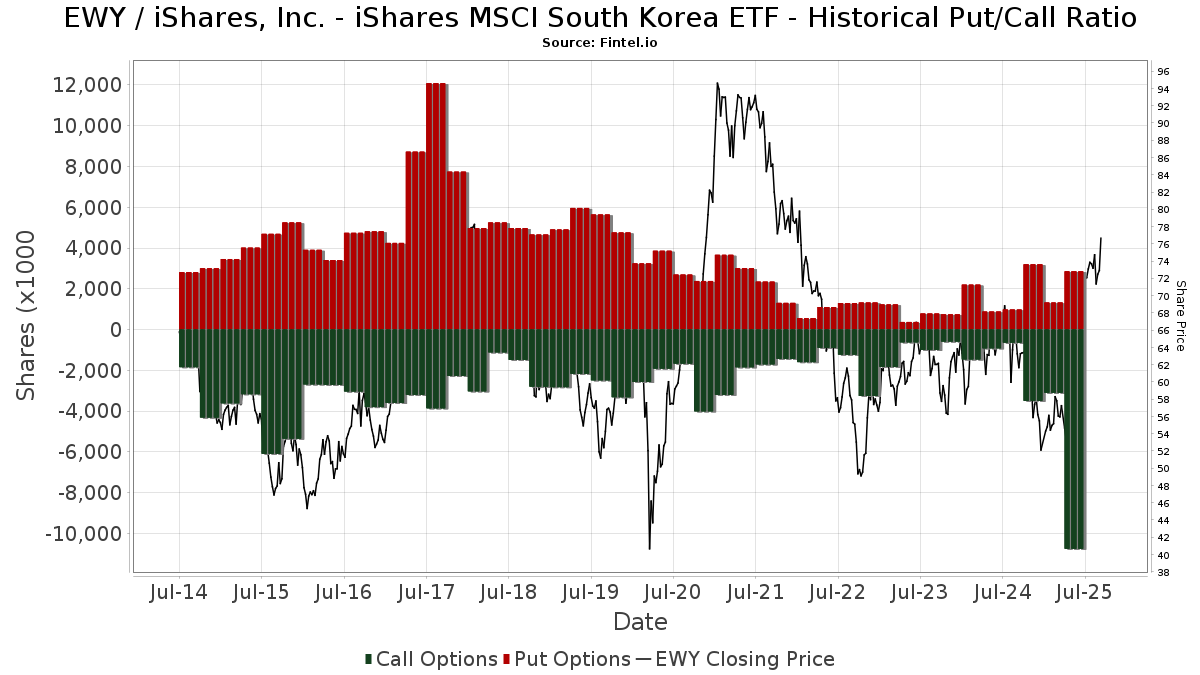
Institutionel Put/Call-forhold
Ud over at indberette standardaktie- og gældsudstedelser skal institutter med mere end 100 mill. aktiver under forvaltning også oplyse deres put- og call-optionsbeholdninger. Da salgsoptioner generelt indikerer negativ stemning, og købsoptioner indikerer positiv stemning, kan vi få en fornemmelse af den overordnede institutionelle stemning ved at plotte forholdet mellem put og kald. Diagrammet til højre viser det historiske put/call-forhold for dette instrument.
Brug af Put/Call Ratio som en indikator for investorernes stemning overvinder en af de vigtigste mangler ved at bruge totalt institutionelt ejerskab, som er, at en betydelig mængde af aktiver under forvaltning investeres passivt for at spore indekser. Passivt forvaltede fonde køber typisk ikke optioner, så indikatoren for put/call-forholdet følger mere nøje følelsen af aktivt forvaltede fonde.
13F og NPORT arkivering
Detaljer om 13F-arkivering er gratis. Detaljer om NP-ansøgninger kræver et premium-medlemskab. Grønne rækker angiver nye positioner. Røde rækker angiver lukkede positioner. Klik på linket ikon for at se den fulde transaktionshistorik.
Opgrader
for at låse premium-data op og eksportere til Excel ![]() .
.
| Fil dato | Kilde | Investor | Type | Gennemsnitlig pris (Øst) |
Aktier | Δ Aktier (%) |
Rapporteret Værdi ($1000) |
Δ Værdi (%) |
Port Alloc (%) |
|
|---|---|---|---|---|---|---|---|---|---|---|
| 2026-02-09 | 13F | Mondrian Investment Partners LTD | 6.561 | 14,84 | 638 | 39,39 | ||||
| 2026-02-10 | 13F | Advisor Resource Council | 2.146 | 260 | ||||||
| 2025-11-14 | 13F | Marex Group plc | Put | 0 | -100,00 | 0 | -100,00 | |||
| 2026-02-17 | 13F | Brevan Howard Capital Management LP | Call | 80.000 | 700,00 | 7.778 | 870,91 | |||
| 2026-02-13 | 13F | Bay Colony Advisory Group, Inc d/b/a Bay Colony Advisors | 6.328 | 615 | ||||||
| 2026-01-27 | 13F | WestEnd Advisors, LLC | 1.186 | 91,29 | 115 | 134,69 | ||||
| 2026-02-17 | 13F | DV Trading LLC | 2.617 | 254 | ||||||
| 2026-02-17 | 13F | Ancora Advisors, LLC | 18 | 0,00 | 2 | 0,00 | ||||
| 2026-01-05 | 13F | Chesapeake Asset Management Llc | 0 | -100,00 | 0 | -100,00 | ||||
| 2026-01-27 | 13F | Evergreen Capital Management Llc | 107.640 | -8,00 | 10.465 | 11,66 | ||||
| 2026-01-16 | 13F | Pictet North America Advisors SA | 2.265 | 220 | ||||||
| 2026-01-26 | 13F | AE Wealth Management LLC | 298 | 727,78 | 29 | 1.300,00 | ||||
| 2026-01-30 | 13F | Pekin Hardy Strauss, Inc. | 102.867 | 13,49 | 10.001 | 37,74 | ||||
| 2025-10-27 | 13F | Belvedere Trading LLC | Call | 0 | -100,00 | 0 | -100,00 | |||
| 2026-02-09 | 13F | Huntington National Bank | 0 | |||||||
| 2026-02-13 | 13F | Rhumbline Advisers | 121.818 | 13,47 | 11.843 | 37,73 | ||||
| 2026-01-29 | 13F | IMC-Chicago, LLC | 0 | -100,00 | 0 | |||||
| 2026-01-22 | 13F | Trium Capital LLP | 0 | -100,00 | 0 | |||||
| 2026-02-06 | 13F | HighTower Advisors, LLC | 61.403 | 2,31 | 5.970 | 24,17 | ||||
| 2026-01-22 | 13F | BOCHK Asset Management Ltd | 700 | -68,18 | 68 | -61,36 | ||||
| 2026-02-17 | 13F | Prelude Capital Management, Llc | 0 | -100,00 | 0 | |||||
| 2026-02-10 | 13F | CIBC Asset Management Inc | 2.506 | -56,58 | 244 | -47,40 | ||||
| 2025-10-28 | 13F | BRYN MAWR TRUST Co | 5.194 | 0,00 | 416 | 11,83 | ||||
| 2026-02-13 | 13F | Morgan Stanley | 3.405.205 | 31,46 | 331.054 | 59,56 | ||||
| 2026-02-12 | 13F | CIBC Private Wealth Group, LLC | 105.286 | 0,02 | 10.236 | 21,40 | ||||
| 2026-02-09 | 13F | Harbour Investments, Inc. | 520 | 86,38 | 51 | 127,27 | ||||
| 2026-02-10 | 13F/A | Northwestern Mutual Wealth Management Co | 3.537 | 7.589,13 | 344 | 11.333,33 | ||||
| 2026-02-12 | 13F | Callan Family Office, LLC | 2.486 | -7,55 | 242 | 12,09 | ||||
| 2026-02-13 | 13F | Causeway Capital Management Llc | 110.800 | -50,07 | 10.772 | -39,40 | ||||
| 2026-01-27 | 13F | Waterfront Wealth Inc. | 8.436 | -23,86 | 992 | 0,10 | ||||
| 2026-01-29 | 13F | Sanctuary Advisors, LLC | 6.393 | 32,44 | 621 | 60,88 | ||||
| 2026-01-29 | 13F | Mivtachim The Workers Social Insurance Fund Ltd. (Under Special Management) | 33.000 | 3.208 | ||||||
| 2026-02-12 | 13F | Intesa Sanpaolo Wealth Management | 320 | 31 | ||||||
| 2026-01-26 | 13F | Whittier Trust Co Of Nevada Inc | 20.730 | 2.231 | ||||||
| 2026-02-12 | 13F | Nuveen, LLC | 84.200 | 348,18 | 8.186 | 444,22 | ||||
| 2026-02-03 | 13F | Yacktman Asset Management Lp | 1.144.611 | 111.279 | ||||||
| 2026-01-14 | 13F | Petredis Investment Advisors Llc | 4.302 | 418 | ||||||
| 2026-01-23 | 13F | Private Wealth Management Group, LLC | 1.320 | 0,00 | 128 | 21,90 | ||||
| 2026-02-02 | 13F | Benjamin Edwards Inc | 19.345 | 1.881 | ||||||
| 2026-02-10 | 13F | Clear Harbor Asset Management, LLC | 0 | -100,00 | 0 | |||||
| 2026-01-02 | 13F | Boltwood Capital Management | 4.000 | 0,00 | 389 | 21,25 | ||||
| 2026-02-17 | 13F | Sig Brokerage, Lp | Call | 139.700 | 13.582 | |||||
| 2026-02-11 | 13F | Hilton Head Capital Partners, LLC | 12 | 1 | ||||||
| 2026-02-13 | 13F | Smartleaf Asset Management LLC | 23 | 0,00 | 2 | 100,00 | ||||
| 2026-02-17 | 13F | Bank Of America Corp /de/ | Put | 0 | -100,00 | 0 | ||||
| 2026-01-16 | 13F | Ronald Blue Trust, Inc. | 1.954 | -1,56 | 190 | 19,62 | ||||
| 2026-02-11 | 13F | Deutsche Bank Ag\ | 1.586 | 0,00 | 154 | 21,26 | ||||
| 2026-02-11 | 13F | Capital Analysts, Inc. | 245 | -29,60 | 0 | |||||
| 2025-11-10 | 13F | Resources Investment Advisors, LLC. | 0 | -100,00 | 0 | |||||
| 2026-01-21 | 13F | Daytona Street Capital LLC | 535 | 52 | ||||||
| 2026-02-13 | 13F | Quinn Opportunity Partners LLC | 16.000 | 0,00 | 1.556 | 21,39 | ||||
| 2026-02-05 | 13F | Bank Julius Baer & Co. Ltd, Zurich | 1.329 | -37,72 | 129 | -24,12 | ||||
| 2025-11-12 | 13F | CIBC Bancorp USA Inc. | 105.265 | 8.432 | ||||||
| 2026-02-17 | 13F | National Asset Management, Inc. | 4.478 | -9,02 | 435 | 10,41 | ||||
| 2025-09-26 | NP | FXINX - Fidelity Flex International Focused Index Fund | 12.239 | 891 | ||||||
| 2026-02-04 | 13F | Ameritas Advisory Services, LLC | 0 | -100,00 | 0 | |||||
| 2026-02-04 | 13F | BCJ Capital Management, LLC | 8.588 | -83,60 | 835 | -80,11 | ||||
| 2026-02-11 | 13F | O'shaughnessy Asset Management, Llc | 211 | -82,46 | 21 | -79,17 | ||||
| 2026-02-13 | 13F | Wells Fargo & Company/mn | Call | 50.000 | -60,00 | 4.861 | -51,45 | |||
| 2026-02-13 | 13F | Gould Asset Management Llc /ca/ | 13.027 | 0,00 | 1.266 | 21,38 | ||||
| 2026-02-13 | 13F | Rafferty Asset Management, LLC | 1.224.622 | 43,95 | 119.058 | 74,72 | ||||
| 2026-01-29 | 13F | UBS Group AG | Put | 25.000 | -39,02 | 2.430 | -26,00 | |||
| 2026-01-29 | 13F | UBS Group AG | Call | 269.000 | -56,03 | 26.152 | -46,63 | |||
| 2026-01-29 | 13F | UBS Group AG | 488.483 | 47,89 | 47.490 | 79,50 | ||||
| 2026-02-12 | 13F | Loomis Sayles & Co L P | 11.850 | 1.152 | ||||||
| 2026-02-13 | 13F | Wells Fargo & Company/mn | Put | 150.000 | 0,00 | 14.583 | 21,37 | |||
| 2026-02-17 | 13F | Banco Bilbao Vizcaya Argentaria, S.a. | 0 | -100,00 | 0 | |||||
| 2026-02-11 | 13F | Jpmorgan Chase & Co | 465.068 | -61,51 | 45.214 | -53,28 | ||||
| 2026-02-17 | 13F | Cetera Investment Advisers | 81.220 | 9,97 | 7.896 | 33,49 | ||||
| 2026-02-13 | 13F | Bank Of Nova Scotia | 773.600 | 195,15 | 75.209 | 258,24 | ||||
| 2026-02-13 | 13F | Dynamic Technology Lab Private Ltd | 0 | -100,00 | 0 | |||||
| 2025-11-14 | 13F | Capstone Investment Advisors, Llc | Put | 0 | -100,00 | 0 | -100,00 | |||
| 2026-01-23 | 13F | Guidance Capital, Inc | 7.524 | 20,95 | 873 | 52,45 | ||||
| 2026-02-17 | 13F | EFG International AG | 2.133 | 207 | ||||||
| 2026-02-17 | 13F | Blair William & Co/il | 1.089 | -2,33 | 106 | 17,98 | ||||
| 2025-11-14 | 13F | Capstone Investment Advisors, Llc | Call | 0 | -100,00 | 0 | -100,00 | |||
| 2025-10-31 | 13F | Y-Intercept (Hong Kong) Ltd | 0 | -100,00 | 0 | |||||
| 2026-01-29 | 13F | Comerica Bank | 245.631 | -10,69 | 23.880 | 8,40 | ||||
| 2026-02-13 | 13F | USS Investment Management Ltd | 740.253 | -14,66 | 71.960 | 3,57 | ||||
| 2026-02-17 | 13F | Susquehanna International Group, Llp | Put | 1.804.400 | 101,99 | 175.424 | 145,17 | |||
| 2026-02-02 | 13F | GenTrust, LLC | 15.880 | -12,96 | 1.544 | 5,61 | ||||
| 2026-02-17 | 13F | Susquehanna International Group, Llp | Call | 729.300 | -62,93 | 70.903 | -55,01 | |||
| 2026-02-11 | 13F | Prudential Plc | 20.300 | 1.974 | ||||||
| 2026-02-17 | 13F | Adams Wealth Management | 163.458 | 2,51 | 15.891 | 24,43 | ||||
| 2026-02-04 | 13F | Biltmore Family Office, LLC | 13 | 1 | ||||||
| 2026-02-12 | 13F | Castleark Management Llc | 1.010 | 98 | ||||||
| 2026-02-24 | 13F | Bell Investment Advisors, Inc | 7 | 0,00 | 1 | |||||
| 2026-02-17 | 13F | Private Advisor Group, LLC | 3.849 | 374 | ||||||
| 2026-02-13 | 13F | Wells Fargo & Company/mn | 47.507 | -20,05 | 4.619 | -2,96 | ||||
| 2026-02-17 | 13F | Susquehanna International Group, Llp | 286.734 | 27.876 | ||||||
| 2026-02-13 | 13F | Acumen Wealth Advisors, LLC | 83 | 8 | ||||||
| 2026-02-02 | 13F | Mutual Advisors, LLC | 2.188 | 213 | ||||||
| 2026-02-13 | 13F | Walleye Trading LLC | Call | 0 | -100,00 | 0 | -100,00 | |||
| 2026-02-13 | 13F | Gts Securities Llc | 30.505 | 179,71 | 2.966 | 239,63 | ||||
| 2026-02-10 | 13F | Bnp Paribas Arbitrage, Sa | Put | 0 | -100,00 | 0 | -100,00 | |||
| 2026-02-17 | 13F | XTX Topco Ltd | 9.084 | 79,24 | 883 | 118,02 | ||||
| 2026-02-12 | 13F | Steward Partners Investment Advisory, Llc | 5 | 0 | ||||||
| 2026-02-09 | 13F | Fisher Asset Management, LLC | 3.419 | 6,25 | 332 | 29,18 | ||||
| 2026-02-10 | 13F | Bnp Paribas Arbitrage, Sa | Call | 0 | -100,00 | 0 | -100,00 | |||
| 2026-02-13 | 13F | Mml Investors Services, Llc | 11.519 | 0,06 | 1.120 | 21,37 | ||||
| 2026-01-14 | 13F | Tradewinds Capital Management, LLC | 324.352 | 31.534 | ||||||
| 2026-02-13 | 13F | Arkadios Wealth Advisors | 3.809 | -32,38 | 370 | -17,96 | ||||
| 2026-01-23 | 13F | Rsm Us Wealth Management Llc | 4.584 | -2,30 | 452 | 20,53 | ||||
| 2026-01-08 | 13F | Grove Bank & Trust | 100 | 0,00 | 10 | 12,50 | ||||
| 2026-02-11 | 13F | Mirae Asset Securities (usa) Inc. | Put | 40.076 | 3.889 | |||||
| 2026-01-22 | 13F | Maseco Llp | 82 | 8 | ||||||
| 2025-11-07 | 13F | Synovus Financial Corp | 5.015 | -3,71 | 402 | 7,51 | ||||
| 2026-02-10 | 13F | Td Asset Management Inc | 738.632 | -51,93 | 71.810 | -41,65 | ||||
| 2026-02-10 | 13F | Black Swift Group, LLC | 92.276 | -6,56 | 8.971 | 13,43 | ||||
| 2026-02-06 | 13F | Copia Wealth Management | 1.029 | 100 | ||||||
| 2026-02-17 | 13F | Harding Loevner Lp | 14.060 | 1.367 | ||||||
| 2026-01-14 | 13F | USA Financial Portformulas Corp | 1.650 | 160 | ||||||
| 2026-02-13 | 13F | Ubs Asset Management Americas Inc | 6.599 | 642 | ||||||
| 2026-02-17 | 13F | Balyasny Asset Management Llc | Call | 30.000 | 2.917 | |||||
| 2026-02-13 | 13F | Peak6 Llc | Call | 8.400 | -76,92 | 817 | -72,01 | |||
| 2026-02-13 | 13F | Peak6 Llc | Put | 5.700 | 16,33 | 554 | 41,33 | |||
| 2026-02-17 | 13F | Balyasny Asset Management Llc | 132.318 | 12.864 | ||||||
| 2026-02-06 | 13F | Pnc Financial Services Group, Inc. | 3.844 | 5,03 | 374 | 27,30 | ||||
| 2026-02-10 | 13F | One Capital Management, LLC | 6.844 | 12,45 | 665 | 36,55 | ||||
| 2025-11-14 | 13F | DRW Securities, LLC | 0 | -100,00 | 0 | |||||
| 2026-02-09 | 13F | Legal & General Group Plc | 35.500 | 0,00 | 3.451 | 21,35 | ||||
| 2026-01-12 | 13F | JGP Wealth Management, LLC | 4.250 | 53,21 | 413 | 78,79 | ||||
| 2026-02-17 | 13F | Dauntless Investment Group, LLC | 9.449 | 41,56 | 919 | 71,91 | ||||
| 2026-02-13 | 13F | Stifel Financial Corp | 29.007 | 11,08 | 2.820 | 34,86 | ||||
| 2025-10-30 | 13F | Envestnet Portfolio Solutions, Inc. | 0 | -100,00 | 0 | |||||
| 2026-01-23 | 13F | LOM Asset Management Ltd | 1.480 | 190,20 | 144 | 248,78 | ||||
| 2025-11-14 | 13F | Cubist Systematic Strategies, LLC | 55.278 | 4.428 | ||||||
| 2026-02-12 | 13F | Bank Of Montreal /can/ | 1.747 | 41,00 | 170 | 70,71 | ||||
| 2026-02-17 | 13F | Russell Investments Group, Ltd. | 15.390 | 1.496 | ||||||
| 2026-02-17 | 13F | Warren Averett Asset Management, LLC | 2.209 | 215 | ||||||
| 2026-01-27 | 13F | Shayne & Co., Llc | 4.375 | 0,00 | 425 | 21,43 | ||||
| 2026-02-19 | 13F | First Growth Capital LLC | 2.488 | 325 | ||||||
| 2026-02-17 | 13F | State Of Wisconsin Investment Board | 167.800 | 48,76 | 16.314 | 80,55 | ||||
| 2026-02-13 | 13F | Manufacturers Life Insurance Company, The | 659.198 | 279,67 | 64.087 | 360,83 | ||||
| 2026-02-17 | 13F | Maytus Capital Management, LLC | 110.000 | -45,35 | 10.694 | -33,66 | ||||
| 2026-02-03 | 13F | Lmcg Investments, Llc | 52.667 | -2,97 | 5.120 | 17,78 | ||||
| 2026-02-17 | 13F | Royal Bank Of Canada | 89.574 | -90,14 | 8.707 | -88,03 | ||||
| 2026-01-16 | 13F | Morris Retirement Advisors, LLC | 2.963 | 10,35 | 288 | 33,95 | ||||
| 2026-02-13 | 13F | Integrated Wealth Concepts LLC | 11.565 | -49,92 | 1.124 | -39,21 | ||||
| 2025-11-14 | 13F | KADENSA CAPITAL Ltd | 0 | -100,00 | 0 | |||||
| 2026-01-14 | 13F | Trust Co Of Oklahoma | 2.063 | 201 | ||||||
| 2026-02-17 | 13F | Scientech Research LLC | 3.921 | 381 | ||||||
| 2026-02-12 | 13F | EHP Funds Inc. | 8.450 | -46,84 | 822 | -35,51 | ||||
| 2025-09-26 | NP | MSTFX - Morningstar International Equity Fund | 133.055 | -45,69 | 9.688 | -29,63 | ||||
| 2026-01-16 | 13F | Perigon Wealth Management, LLC | 18.714 | 1.819 | ||||||
| 2025-09-29 | NP | KORU - Direxion Daily MSCI South Korea Bull 3X Shares | 890.762 | 15,86 | 64.856 | 50,13 | ||||
| 2026-03-05 | 13F | Gunpowder Capital Management, LLC dba Oliver Wealth Management | 136 | 13 | ||||||
| 2026-02-03 | 13F | Costello Asset Management, INC | 34 | 3,03 | 3 | 50,00 | ||||
| 2025-11-13 | 13F | Richard Bernstein Advisors LLC | 0 | -100,00 | 0 | |||||
| 2026-01-12 | 13F | DAVENPORT & Co LLC | 11.870 | 1.154 | ||||||
| 2026-02-13 | 13F | SRS Capital Advisors, Inc. | 61 | 6 | ||||||
| 2026-01-27 | 13F | Checchi Capital Advisers, LLC | 31.924 | 2,92 | 3.104 | 24,92 | ||||
| 2026-02-12 | 13F | Jane Street Group, Llc | 3.932 | -94,53 | 382 | -93,36 | ||||
| 2026-02-17 | 13F | Kingdon Capital Management, L.l.c. | Put | 75.000 | -60,53 | 7.292 | -52,09 | |||
| 2026-02-12 | 13F | Jane Street Group, Llc | Put | 903.800 | 2.902,66 | 87.867 | 3.544,42 | |||
| 2026-02-17 | 13F | Kingdon Capital Management, L.l.c. | 115.000 | -14,81 | 11.180 | 3,39 | ||||
| 2026-02-17 | 13F | Clear Street Markets Llc | 63.100 | 6.135 | ||||||
| 2025-11-14 | 13F | Lazard Asset Management Llc | 0 | -100,00 | 0 | |||||
| 2026-02-12 | 13F | Brinker Capital Investments, LLC | 3.169 | 21,37 | 308 | 47,37 | ||||
| 2026-02-09 | 13F | Jefferies Financial Group Inc. | 6.268 | -90,77 | 609 | -88,76 | ||||
| 2025-11-14 | 13F | Oasis Management Co Ltd. | Put | 0 | -100,00 | 0 | ||||
| 2026-02-12 | 13F | Earnest Partners Llc | 31.390 | 23,18 | 3.052 | 49,49 | ||||
| 2026-02-13 | 13F | Kestra Advisory Services, LLC | 19.039 | 1.851 | ||||||
| 2026-01-13 | 13F | Signal Advisors Wealth, LLC | 2.115 | 206 | ||||||
| 2026-01-23 | 13F | TFC Financial Management | 156 | 0,00 | 15 | 25,00 | ||||
| 2026-01-30 | 13F | Bogart Wealth, LLC | 102 | 10 | ||||||
| 2026-02-12 | 13F | Jane Street Group, Llc | Call | 256.200 | 18,34 | 24.908 | 43,63 | |||
| 2026-01-23 | 13F | Webster Bank, N. A. | 600 | 0,00 | 58 | 20,83 | ||||
| 2026-02-12 | 13F | Provida Pension Fund Administrator | 0 | -100,00 | 0 | |||||
| 2026-02-06 | 13F | Berbice Capital Management LLC | 350 | 34 | ||||||
| 2026-01-26 | 13F | Private Trust Co Na | 485 | 120,45 | 47 | 176,47 | ||||
| 2026-02-02 | 13F | Van Berkom & Associates Inc. | 514 | 0 | ||||||
| 2026-02-06 | 13F | Global Retirement Partners, LLC | 4.618 | -0,71 | 449 | 20,43 | ||||
| 2026-03-06 | 13F | Hsbc Holdings Plc | 1.897.337 | 1.764,16 | 184.457 | 2.162,43 | ||||
| 2026-02-05 | 13F | Allworth Financial LP | 192 | 149,35 | 19 | 200,00 | ||||
| 2026-02-17 | 13F | Amundi | 8.116 | -21,65 | 789 | -10,14 | ||||
| 2026-02-17 | 13F | Edmond De Rothschild Holding S.a. | 1.386 | 0,00 | 135 | 20,72 | ||||
| 2026-02-13 | 13F | Colony Group, LLC | 12.667 | 103,75 | 1.231 | 147,69 | ||||
| 2026-02-13 | 13F | Cullen Capital Management, LLC | 269.232 | 20,87 | 26.175 | 46,71 | ||||
| 2026-02-12 | 13F | Elo Mutual Pension Insurance Co | 184.496 | 17.937 | ||||||
| 2026-02-18 | 13F | GWM Advisors LLC | 9.566 | 930 | ||||||
| 2025-10-29 | 13F | ADAPT Investment Managers SA | Call | 0 | -100,00 | 0 | ||||
| 2025-10-29 | 13F | ADAPT Investment Managers SA | Put | 0 | -100,00 | 0 | ||||
| 2025-11-06 | 13F | Atria Investments Llc | 0 | -100,00 | 0 | |||||
| 2026-02-12 | 13F | Adviser Investments LLC | 2.739 | 0,00 | 266 | 21,46 | ||||
| 2026-01-30 | 13F | Innealta Capital, Llc | 36.059 | 21,42 | 3.506 | 47,39 | ||||
| 2026-02-13 | 13F | Karpus Management, Inc. | 0 | -100,00 | 0 | |||||
| 2026-02-03 | 13F | Providence First Trust Co | 7.995 | 777 | ||||||
| 2026-01-15 | 13F | Cobblestone Asset Management LLC | 0 | -100,00 | 0 | |||||
| 2026-02-02 | 13F | Horizon Investments, LLC | 384.396 | 4.270.966,67 | 37.371 | |||||
| 2026-01-30 | 13F | Wealthfront Advisers Llc | 4.061 | -92,75 | 395 | -87,74 | ||||
| 2026-02-17 | 13F | Millennium Management Llc | Call | 150.000 | 14.583 | |||||
| 2026-02-17 | 13F | Bank Of America Corp /de/ | 5.395.817 | 53,66 | 524.581 | 86,50 | ||||
| 2026-02-17 | 13F | Lombard Odier Asset Management (USA) Corp | 8.439 | 820 | ||||||
| 2026-02-09 | 13F | Knights of Columbus Asset Advisors LLC | 5.820 | 0,00 | 566 | 21,24 | ||||
| 2026-02-09 | 13F | Leavell Investment Management, Inc. | 15.468 | 4,97 | 1.504 | 27,37 | ||||
| 2026-02-12 | 13F | Glaxis Capital Management, LLC | 30.000 | 2.917 | ||||||
| 2026-03-04 | 13F | Leonteq Securities AG | Put | 0 | -100,00 | 0 | ||||
| 2026-02-11 | 13F | Viewpoint Capital Management LLC | 1 | 0,00 | 0 | |||||
| 2025-11-14 | 13F | ExodusPoint Capital Management, LP | 1.340 | 107 | ||||||
| 2026-02-17 | 13F | NewSquare Capital LLC | 11.495 | 1.118 | ||||||
| 2026-02-10 | 13F | Operose Advisors LLC | 0 | -100,00 | 0 | |||||
| 2026-01-14 | 13F | Exchange Traded Concepts, Llc | 385.237 | 36.038,56 | 37.453 | 43.961,18 | ||||
| 2026-02-17 | 13F | Appaloosa Lp | 1.875.000 | 182.288 | ||||||
| 2026-02-09 | 13F | Valence8 US LP | 46.557 | -44,41 | 4.526 | -32,53 | ||||
| 2026-02-13 | 13F | Atlas Capital Advisors Llc | 35 | 3 | ||||||
| 2026-02-17 | 13F | Millennium Management Llc | 12.927 | 223,42 | 1.257 | 292,50 | ||||
| 2026-02-13 | 13F | Walleye Trading LLC | Put | 9.900 | -1,00 | 962 | 20,10 | |||
| 2025-09-23 | NP | GEBAX - Goldman Sachs ESG Emerging Markets Equity Fund Class A Shares | 781 | 57 | ||||||
| 2026-01-12 | 13F | Fiduciary Financial Group, Llc | 36.155 | -8,26 | 3.515 | 11,34 | ||||
| 2026-02-18 | 13F | State of Tennessee, Treasury Department | 6.830.675 | -5,48 | 836.143 | 44,45 | ||||
| 2026-01-12 | 13F | Robinson Value Management, Ltd. | 18.947 | 0,28 | 1.842 | 21,74 | ||||
| 2025-11-07 | 13F | Standard Life Aberdeen plc | 0 | -100,00 | 0 | |||||
| 2026-02-03 | 13F | SBI Securities Co., Ltd. | 2.616 | 195,26 | 254 | 262,86 | ||||
| 2026-02-17 | 13F | Caption Management, LLC | Call | 30.000 | 2.917 | |||||
| 2026-01-23 | 13F | Altfest L J & Co Inc | 49.090 | -17,30 | 4.773 | 0,38 | ||||
| 2026-02-17 | 13F | Caption Management, LLC | 5.400 | 525 | ||||||
| 2026-02-12 | 13F | Principal Securities, Inc. | 0 | -100,00 | 0 | |||||
| 2026-02-09 | 13F | Main Street Research LLC | 355.461 | 34.558 | ||||||
| 2026-02-17 | 13F | Qube Research & Technologies Ltd | 7.389 | 83,08 | 718 | 122,29 | ||||
| 2026-01-26 | 13F | Phillips Financial Management, Llc | 317 | -21,73 | 31 | -6,25 | ||||
| 2026-02-06 | 13F | Fortis Group Advisors, LLC | 12.825 | 160.212,50 | 1.570 | |||||
| 2026-02-11 | 13F | Cerity Partners LLC | 33.010 | 9,51 | 3.209 | 32,93 | ||||
| 2026-02-13 | 13F | MAI Capital Management | 50 | -55,36 | 5 | -50,00 | ||||
| 2025-09-26 | NP | MSTSX - Morningstar Unconstrained Allocation Fund | 67.909 | -62,64 | 4.944 | -51,60 | ||||
| 2026-02-13 | 13F | City Of London Investment Management Co Ltd | 919.724 | 23,49 | 89.416 | 49,88 | ||||
| 2026-02-17 | 13F | Boothbay Fund Management, Llc | 0 | -100,00 | 0 | |||||
| 2025-09-24 | NP | BlackRock ETF Trust - iShares International Country Rotation Active ETF | 5.809 | 95,52 | 423 | 154,22 | ||||
| 2026-01-26 | 13F | SeaBridge Investment Advisors LLC | 8.580 | -6,83 | 834 | 13,16 | ||||
| 2026-02-12 | 13F | Marex Group plc | 5.639 | -29,89 | 548 | -14,91 | ||||
| 2026-01-20 | 13F | Nvwm, Llc | 300 | 29 | ||||||
| 2026-02-17 | 13F | BlueCrest Capital Management Ltd | 42.454 | 4.127 | ||||||
| 2026-02-17 | 13F | Moneda S.A. Administradora General de Fondos | 14.602 | 21,79 | 1.420 | 22,12 | ||||
| 2026-01-30 | 13F/A | M&t Bank Corp | 3.842 | 16,49 | 374 | 41,29 | ||||
| 2026-02-10 | 13F | CIBC World Markets Inc. | 85.040 | 4,71 | 8.268 | 27,09 | ||||
| 2026-02-11 | 13F | Empowered Funds, LLC | 52.814 | 5.135 | ||||||
| 2026-02-13 | 13F | Global Endowment Management, LP | 9.000 | 47,30 | 875 | 78,94 | ||||
| 2026-02-02 | 13F | Caisse Des Depots Et Consignations | 162.000 | 0,00 | 15.911 | 22,91 | ||||
| 2026-02-17 | 13F | Driehaus Capital Management Llc | 0 | -100,00 | 0 | |||||
| 2026-01-20 | 13F | FLP Wealth Management, LLC | 1.556 | -53,27 | 312 | 17,29 | ||||
| 2026-01-23 | 13F | Nbt Bank N A /ny | 157 | 0,00 | 15 | 25,00 | ||||
| 2026-02-17 | 13F | Two Sigma Securities, Llc | 16.815 | 1.635 | ||||||
| 2026-01-27 | 13F | First Horizon Corp | 17 | 2 | ||||||
| 2026-02-10 | 13F | Jordan Park Group LLC | 84.581 | -74,61 | 8.223 | -61,00 | ||||
| 2026-02-17 | 13F | Toronto Dominion Bank | 7 | 0,00 | 1 | |||||
| 2026-02-20 | 13F | Sunbelt Securities, Inc. | 151 | -87,31 | 15 | -85,26 | ||||
| 2025-10-28 | 13F | Wolverine Asset Management Llc | 0 | -100,00 | 0 | |||||
| 2026-02-11 | 13F | Total Wealth Planning & Management, Inc. | 5.841 | -12,79 | 568 | 18,13 | ||||
| 2026-02-17 | 13F | Ameriprise Financial Inc | 37.781 | 435,37 | 3.673 | 550,09 | ||||
| 2026-01-29 | 13F | RMG Wealth Management LLC | 261 | 24 | ||||||
| 2026-02-19 | 13F | CI Private Wealth, LLC | 2.420 | 238 | ||||||
| 2026-02-17 | 13F | Michelson Medical Research Foundation, Inc. | 0 | -100,00 | 0 | |||||
| 2026-01-23 | 13F | Bellevue Asset Management, Llc | 100 | 0,00 | 10 | 12,50 | ||||
| 2026-02-02 | 13F | Nkcfo Llc | 35.500 | -22,83 | 3 | 0,00 | ||||
| 2026-02-10 | 13F | Cercano Management LLC | 132.765 | 0,00 | 12.907 | 21,37 | ||||
| 2026-02-13 | 13F | Squarepoint Ops LLC | 0 | -100,00 | 0 | -100,00 | ||||
| 2026-02-17 | 13F | Graham Capital Management, L.P. | 0 | -100,00 | 0 | |||||
| 2026-02-11 | 13F | Simplex Trading, Llc | 0 | -100,00 | 0 | |||||
| 2026-02-13 | 13F | First Trust Advisors Lp | 38.619 | -4,44 | 3.755 | 15,97 | ||||
| 2026-02-17 | 13F | Pinnacle Financial Partners, Inc. | 4.877 | 474 | ||||||
| 2026-01-28 | 13F | Proathlete Wealth Management Llc | 14 | 16,67 | 1 | |||||
| 2026-02-12 | 13F | Federated Hermes, Inc. | 0 | -100,00 | 0 | |||||
| 2026-02-17 | 13F | DZ BANK AG Deutsche Zentral Genossenschafts Bank, Frankfurt am Main | 178.008 | 41,20 | 17.306 | 71,37 | ||||
| 2026-02-02 | 13F | Summit Place Financial Advisors, LLC | 26.002 | -2,61 | 2.528 | 18,19 | ||||
| 2026-02-13 | 13F | Citigroup Inc | Call | 0 | -100,00 | 0 | -100,00 | |||
| 2025-11-12 | 13F | Wealthedge Investment Advisors, Llc | 0 | -100,00 | 0 | |||||
| 2026-02-17 | 13F | Point72 Asset Management, L.P. | Call | 75.800 | 7.369 | |||||
| 2026-02-12 | 13F | Marex Group plc | Call | 0 | -100,00 | 0 | -100,00 | |||
| 2026-02-17 | 13F | Point72 Asset Management, L.P. | 118.083 | 11.480 | ||||||
| 2026-02-17 | 13F | Point72 Asset Management, L.P. | Put | 7.500 | 729 | |||||
| 2026-02-11 | 13F | Allianz Asset Management GmbH | 44.595 | -0,83 | 4.336 | 20,38 | ||||
| 2025-11-14 | 13F | Sentinus, LLC | 0 | -100,00 | 0 | |||||
| 2026-01-21 | 13F | Naviter Wealth, LLC | 2.380 | 231 | ||||||
| 2026-02-17 | 13F | BCV Asset Management Inc. | 24.425 | 2.698 | ||||||
| 2026-02-17 | 13F | Twin Focus Capital Partners, Llc | 4.955 | 0,00 | 482 | 21,46 | ||||
| 2026-02-17 | 13F | Quadrature Capital Ltd | 6.546 | 636 | ||||||
| 2026-02-17 | 13F | Jain Global LLC | 65.448 | 119,47 | 6.363 | 166,42 | ||||
| 2026-02-17 | 13F | Jain Global LLC | Call | 150.000 | -72,22 | 14.583 | -66,29 | |||
| 2026-02-17 | 13F | Silvercrest Asset Management Group Llc | 3.373 | 12,32 | 328 | 36,25 | ||||
| 2026-02-10 | 13F | Continuum Advisory, LLC | 9.432 | 917 | ||||||
| 2026-02-11 | 13F | Arizona PSPRS Trust | 23.500 | 2.285 | ||||||
| 2026-02-17 | 13F | Sona Asset Management (us) Llc | Call | 0 | -100,00 | 0 | ||||
| 2026-01-23 | 13F | Tower View Investment Management & Research LLC | 15.090 | 1.467 | ||||||
| 2026-02-12 | 13F | Custom Index Systems, Llc | 5.745 | -8,59 | 559 | 10,93 | ||||
| 2026-02-17 | 13F | Royal Bank Of Canada | Call | 0 | -100,00 | 0 | ||||
| 2026-01-21 | 13F | Stone House Investment Management, LLC | 63 | 6 | ||||||
| 2026-02-03 | 13F | Coston, McIsaac & Partners | 26 | 0 | ||||||
| 2026-02-12 | 13F | Renaissance Technologies Llc | 0 | -100,00 | 0 | |||||
| 2026-02-17 | 13F | Torno Capital, Llc | Call | 400.000 | 38.888 | |||||
| 2026-02-17 | 13F | Torno Capital, Llc | Put | 570.000 | 55.415 | |||||
| 2026-02-12 | 13F | BlackRock, Inc. | 419.738 | 90,62 | 40.807 | 131,35 | ||||
| 2026-01-26 | 13F | Nations Financial Group Inc, /ia/ /adv | 30.000 | 0,00 | 2.917 | 21,35 | ||||
| 2026-02-17 | 13F | BTG Pactual Asset Management US LLC | 0 | -100,00 | 0 | |||||
| 2026-02-10 | 13F | Lido Advisors, LLC | 50.156 | 2,14 | 4.079 | 3,71 | ||||
| 2025-09-23 | NP | GEMHX - Goldman Sachs Emerging Markets Equity ex. China Fund Class A Shares | 1.247 | 91 | ||||||
| 2026-02-13 | 13F | Vontobel Holding Ltd. | 127.576 | 5,18 | 12.403 | 27,66 | ||||
| 2026-02-13 | 13F | Barclays Plc | 910.980 | 70,82 | 88.565 | 107,33 | ||||
| 2026-02-13 | 13F | Barclays Plc | Put | 100.000 | 9.722 | |||||
| 2026-02-09 | 13F | Morningstar Investment Management LLC | 38.951 | -42,64 | 4 | -40,00 | ||||
| 2026-02-13 | 13F | National Bank Of Canada /fi/ | 352 | -39,21 | 34 | -26,09 | ||||
| 2025-11-14 | 13F | Caisse De Depot Et Placement Du Quebec | 0 | -100,00 | 0 | |||||
| 2026-02-11 | 13F | Barrow Hanley Mewhinney & Strauss Llc | 268 | 26 | ||||||
| 2026-02-13 | 13F | Barclays Plc | Call | 0 | -100,00 | 0 | -100,00 | |||
| 2026-01-26 | 13F | Mirae Asset Global Investments Co., Ltd. | 196.435 | 90,04 | 19.097 | 130,67 | ||||
| 2025-10-24 | 13F | Swmg, Llc | 0 | -100,00 | 0 | |||||
| 2026-02-17 | 13F | Aragon Global Management, LP | 67.200 | 6.533 | ||||||
| 2026-02-13 | 13F | Aptus Capital Advisors, LLC | 84 | -32,80 | 8 | -20,00 | ||||
| 2026-02-13 | 13F | LFG Wealth Partners, LLC | 23.625 | 2.297 | ||||||
| 2025-10-30 | 13F | Ridgewood Investments LLC | Call | 0 | -100,00 | 0 | -100,00 | |||
| 2026-01-15 | 13F | Nilsine Partners, LLC | 29.353 | 2.854 | ||||||
| 2026-02-13 | 13F | DeepCurrents Investment Group LLC | 3.038 | 0,00 | 295 | 21,40 | ||||
| 2026-02-13 | 13F | Strategic Global Advisors, LLC | 6.830 | 664 | ||||||
| 2026-02-17 | 13F | Two Sigma Investments, Lp | 175.805 | 431,13 | 17.092 | 544,70 | ||||
| 2026-02-10 | 13F | Goldman Sachs Group Inc | Call | 280.000 | 27.222 | |||||
| 2026-02-10 | 13F | Goldman Sachs Group Inc | Put | 500.000 | 48.610 | |||||
| 2026-02-13 | 13F | Transamerica Financial Advisors, Inc. | 18 | 2 | ||||||
| 2026-01-15 | 13F | Hara Capital LLC | 442 | 0,00 | 43 | 20,00 | ||||
| 2026-02-04 | 13F | Atlantic Union Bankshares Corp | 25 | 2 | ||||||
| 2026-01-07 | 13F | St. Louis Financial Planners Asset Management, LLC | 23.700 | 2.304 | ||||||
| 2025-11-07 | 13F | Credit Industriel Et Commercial | Put | 0 | -100,00 | 0 | ||||
| 2026-02-13 | 13F | Bridgewater Associates, LP | 2.072.358 | 1,83 | 201.475 | 23,59 | ||||
| 2025-11-07 | 13F | Credit Industriel Et Commercial | 0 | -100,00 | 0 | |||||
| 2026-02-11 | 13F | Twin Tree Management, LP | 0 | -100,00 | 0 | |||||
| 2026-02-17 | 13F | Sona Asset Management (us) Llc | 53.000 | -28,38 | 5.153 | -13,08 | ||||
| 2026-02-17 | 13F | Basso Capital Management, L.p. | 10.572 | 710,11 | 1.028 | 887,50 | ||||
| 2026-01-12 | 13F | VisionPoint Advisory Group, LLC | 8.625 | 839 | ||||||
| 2026-02-11 | 13F | Group One Trading, L.p. | 0 | -100,00 | 0 | |||||
| 2026-02-12 | 13F | Wealthspire Advisors, LLC | 0 | -100,00 | 0 | |||||
| 2026-02-10 | 13F | Belvedere Trading LLC | 8.671 | 843 | ||||||
| 2026-02-17 | 13F | Creative Planning | 5.240 | 4,09 | 509 | 26,30 | ||||
| 2026-02-12 | 13F | Commonwealth Equity Services, Llc | 23.884 | -4,01 | 2.322 | 232.000,00 | ||||
| 2025-11-20 | 13F | Maven Securities LTD | 0 | -100,00 | 0 | |||||
| 2026-02-03 | 13F | International Assets Investment Management, Llc | 44 | 4 | ||||||
| 2026-01-09 | 13F | SG Americas Securities, LLC | 0 | -100,00 | 0 | |||||
| 2026-02-23 | 13F | Vinland Capital Management Gestora de Recursos LTDA. | 0 | -100,00 | 0 | -100,00 | ||||
| 2026-02-17 | 13F | Ehrenkranz Partners L.P. | 159.100 | 0,00 | 15.468 | 21,38 | ||||
| 2026-02-17 | 13F | Citadel Advisors Llc | 689.290 | 110,88 | 67.013 | 155,96 | ||||
| 2026-02-17 | 13F | GeoWealth Management, LLC | 14.128 | -28,50 | 1.374 | -13,21 | ||||
| 2025-11-14 | 13F | Cubist Systematic Strategies, LLC | Call | 0 | -100,00 | 0 | -100,00 | |||
| 2026-02-17 | 13F | Citadel Advisors Llc | Call | 170.600 | -82,23 | 16.586 | -78,44 | |||
| 2026-02-17 | 13F | Citadel Advisors Llc | Put | 352.200 | 1,24 | 34.241 | 22,87 | |||
| 2025-11-14 | 13F | PointState Capital LP | 0 | -100,00 | 0 | -100,00 | ||||
| 2026-01-21 | 13F | Portside Wealth Group, LLC | 2.514 | -12,25 | 244 | 6,55 | ||||
| 2025-09-29 | NP | HECA - Hedgeye Capital Allocation ETF | 6.161 | 449 | ||||||
| 2025-12-16 | 13F | Garde Capital, Inc. | 0 | -100,00 | 0 | |||||
| 2026-02-13 | 13F | Bollard Group LLC | 4.776 | 0 | ||||||
| 2025-11-13 | 13F | Prudential Financial Inc | 0 | -100,00 | 0 | |||||
| 2026-01-14 | 13F | Game Plan Financial Advisors, LLC | 79 | 8 | ||||||
| 2026-01-27 | 13F | Journey Advisory Group, LLC | 60.001 | 0,33 | 5.833 | 21,77 | ||||
| 2026-02-13 | 13F | Peak6 Llc | 0 | -100,00 | 0 | -100,00 | ||||
| 2026-01-27 | 13F | BigSur Wealth Management LLC | 750 | 0,00 | 73 | 20,00 | ||||
| 2026-02-12 | 13F | Stamos Capital Partners, L.p. | 18.537 | -2,90 | 1.802 | 17,85 | ||||
| 2025-11-04 | 13F | Telos Capital Management, Inc. | 0 | -100,00 | 0 | |||||
| 2026-01-29 | 13F | Concurrent Investment Advisors, LLC | 2.604 | 253 | ||||||
| 2026-01-29 | 13F | Kercheville Advisors, LLC | 1.950 | 226 | ||||||
| 2026-02-13 | 13F | Edgestream Partners, L.P. | 2.544 | 247 | ||||||
| 2026-02-13 | 13F | Arrowstreet Capital, Limited Partnership | 3.994 | -99,65 | 388 | -99,58 | ||||
| 2026-02-17 | 13F | Fmr Llc | 353.138 | -31,60 | 34.332 | -16,98 | ||||
| 2026-01-28 | 13F | Geneos Wealth Management Inc. | 30 | 0,00 | 3 | 0,00 | ||||
| 2026-02-10 | 13F | Goldman Sachs Group Inc | 217.589 | -76,99 | 21.154 | -72,07 | ||||
| 2026-02-13 | 13F | Avos Capital Management, LLC | 16.876 | 0,00 | 1.641 | 21,39 | ||||
| 2026-01-22 | 13F | Elm3 Financial Group, LLC | 10.598 | -7,73 | 1.030 | 11,96 | ||||
| 2026-02-17 | 13F | Nissay Asset Management Corp /japan/ /adv | 44.147 | 4.292 | ||||||
| 2026-02-06 | 13F | Banque Cantonale Vaudoise | 0 | -100,00 | 0 | |||||
| 2026-02-05 | 13F | Mount Lucas Management LP | 10.725 | -15,76 | 1.043 | 2,26 | ||||
| 2026-02-13 | 13F | Schroder Investment Management Group | 830.627 | -33,94 | 81.916 | -18,81 | ||||
| 2026-01-14 | 13F | ORG Partners LLC | 18 | 0,00 | 2 | 0,00 | ||||
| 2026-01-15 | 13F | Private Advisory Group LLC | 225.139 | -8,16 | 21.888 | 11,47 | ||||
| 2026-02-17 | 13F | Zacks Investment Management | 17.107 | 13,89 | 1.663 | 38,24 | ||||
| 2026-02-10 | 13F | Bank of New York Mellon Corp | 2.522 | 245 | ||||||
| 2026-02-05 | 13F | Pacitti Group Inc. | 3.369 | -1,06 | 327 | 20,22 | ||||
| 2026-02-17 | 13F | Tower Research Capital LLC (TRC) | 767 | -50,26 | 75 | -39,84 | ||||
| 2026-01-16 | 13F | Banque Pictet & Cie Sa | 84.769 | 5,74 | 8.241 | 28,34 | ||||
| 2026-02-10 | 13F | BlackDiamond Wealth Management Inc. | 2.797 | 353 | ||||||
| 2026-02-19 | 13F | Invesco Ltd. | 29.443 | -48,03 | 2.862 | -36,92 | ||||
| 2026-02-12 | 13F | AlphaCentric Advisors LLC | 1.619 | 157 | ||||||
| 2026-02-06 | 13F | Fairtree Asset Management (Pty) Ltd | 373 | -42,08 | 36 | -29,41 | ||||
| 2025-11-14 | 13F | LMR Partners LLP | 0 | -100,00 | 0 | -100,00 | ||||
| 2026-01-21 | 13F | Newbridge Financial Services Group, Inc. | 8 | 0,00 | 1 | |||||
| 2026-02-18 | 13F | CacheTech Inc. | 171.626 | 2,74 | 16.685 | 24,70 | ||||
| 2025-11-13 | 13F | Pinnbrook Capital Management Lp | 0 | -100,00 | 0 | |||||
| 2025-11-13 | 13F | Pinnbrook Capital Management Lp | Call | 0 | -100,00 | 0 | ||||
| 2026-01-21 | 13F | Mainstream Capital Management LLC | 2.378 | -14,21 | 231 | 4,05 | ||||
| 2026-02-20 | 13F | Kovitz Investment Group Partners, LLC | 6.264 | 8,81 | 609 | 31,89 | ||||
| 2026-02-09 | 13F | Key FInancial Inc | 451 | 0,00 | 44 | 19,44 | ||||
| 2026-02-11 | 13F | Manchester Capital Management LLC | 900 | 87 | ||||||
| 2026-01-28 | 13F | Migdal Insurance & Financial Holdings Ltd. | 2.980 | 0,00 | 0 | |||||
| 2026-01-29 | 13F | UMA Financial Services, Inc. | 63 | 0,00 | 6 | 20,00 | ||||
| 2026-01-08 | 13F | Wealth Enhancement Advisory Services, Llc | 7.251 | 183,69 | 780 | 266,20 | ||||
| 2026-01-20 | 13F | SOA Wealth Advisors, LLC. | 38 | 0,00 | 4 | 0,00 | ||||
| 2025-11-14 | 13F | Wolverine Trading, Llc | Call | 119.500 | -22,70 | 9.589 | -12,33 | |||
| 2026-02-17 | 13F | Bank Of America Corp /de/ | Call | 0 | -100,00 | 0 | ||||
| 2025-11-14 | 13F | Wolverine Trading, Llc | 112.545 | 55,81 | 9.031 | 76,75 | ||||
| 2026-01-16 | 13F | Bangor Savings Bank | 55 | 5 | ||||||
| 2026-01-26 | 13F | Paradigm Financial Partners, Llc | 54.385 | 5.287 | ||||||
| 2025-11-14 | 13F | Wolverine Trading, Llc | Put | 87.700 | 17,88 | 7.037 | 33,71 | |||
| 2026-02-13 | 13F | Glen Eagle Advisors, LLC | 5 | 0,00 | 1 | |||||
| 2025-11-14 | 13F | Cubist Systematic Strategies, LLC | Put | 0 | -100,00 | 0 | -100,00 | |||
| 2026-02-17 | 13F | J. Goldman & Co LP | 3.000 | 292 | ||||||
| 2026-02-11 | 13F | 1776 Wealth LLC | 2.946 | 286 | ||||||
| 2026-02-10 | 13F | Texas Yale Capital Corp. | 4.810 | 0,00 | 468 | 21,30 | ||||
| 2026-02-13 | 13F | Sei Investments Co | 173.315 | 105,37 | 16.850 | 149,28 | ||||
| 2026-02-10 | 13F | Quantbot Technologies LP | 5.109 | 497 | ||||||
| 2025-11-12 | 13F | Itau Unibanco Holding S.A. | 0 | -100,00 | 0 | |||||
| 2026-02-17 | 13F | Prostatis Group LLC | 42.218 | -4,21 | 4.104 | 16,26 | ||||
| 2026-02-10 | 13F | Castlekeep Investment Advisors Llc | 5.525 | 0,00 | 537 | 21,49 | ||||
| 2026-02-11 | 13F | Strategic Advocates LLC | 386 | 38 | ||||||
| 2026-02-02 | 13F | Advisors Preferred, LLC | 121 | 12 | ||||||
| 2026-02-17 | 13F | Soros Capital Management Llc | 52.600 | -82,90 | 5.114 | -79,25 | ||||
| 2026-01-16 | 13F | FNY Investment Advisers, LLC | 0 | -100,00 | 0 | |||||
| 2026-01-21 | 13F | Yousif Capital Management, Llc | 240.855 | -10,97 | 26.728 | 23,34 | ||||
| 2026-02-10 | 13F | Envestnet Asset Management Inc | 71.072 | 0,24 | 6.910 | 21,66 | ||||
| 2026-02-13 | 13F | Marathon Trading Investment Management LLC | 4.000 | 0,00 | 389 | 21,25 | ||||
| 2026-02-12 | 13F | Index Technologies Group LLC | 3.096 | 301 | ||||||
| 2026-02-17 | 13F | Price T Rowe Associates Inc /md/ | 9.797 | 1 | ||||||
| 2026-02-11 | 13F | Meeder Asset Management Inc | 9.018 | 877 | ||||||
| 2026-01-23 | 13F | Eagle Bay Advisors LLC | 246 | 24 | ||||||
| 2025-10-10 | 13F | Fluent Financial, LLC | 0 | -100,00 | 0 | |||||
| 2025-10-23 | 13F | Park Avenue Securities Llc | 0 | -100,00 | 0 | |||||
| 2026-02-13 | 13F | Solstein Capital, LLC | 1.566 | 152 | ||||||
| 2026-02-10 | 13F | Smith Group Asset Management, LLC | 11.120 | 1.081 | ||||||
| 2026-02-17 | 13F | Owl Creek Asset Management, L.P. | 228.263 | 22.192 | ||||||
| 2025-11-13 | 13F | Banco BTG Pactual S.A. | 0 | -100,00 | 0 | -100,00 | ||||
| 2026-02-17 | 13F | Owl Creek Asset Management, L.P. | Call | 73.300 | -97,00 | 7.126 | -96,36 | |||
| 2026-01-29 | 13F | Nbc Securities, Inc. | 295 | -8,39 | 29 | 12,00 | ||||
| 2026-02-10 | 13F | Mutual Of America Capital Management Llc | 112.684 | 10.958 | ||||||
| 2026-02-05 | 13F | Bessemer Group Inc | 52.649 | -12,28 | 5 | 25,00 | ||||
| 2026-02-06 | 13F | Larson Financial Group LLC | 416 | 281,65 | 40 | 400,00 | ||||
| 2026-02-13 | 13F | Marshall Wace, Llp | 0 | -100,00 | 0 | |||||
| 2026-02-11 | 13F | Twin Tree Management, LP | Put | 0 | -100,00 | 0 | ||||
| 2026-02-06 | 13F | Gsa Capital Partners Llp | 3.558 | -29,05 | 0 | |||||
| 2025-11-14 | 13F | Capstone Investment Advisors, Llc | 3.103 | -83,60 | 249 | -81,74 | ||||
| 2026-02-17 | 13F | Quantitative Investment Management, LLC | 0 | -100,00 | 0 | |||||
| 2025-11-12 | 13F | Headlands Technologies LLC | 0 | -100,00 | 0 | |||||
| 2026-02-11 | 13F | Financiere des Professionnels - Fonds d,investissement inc. | 65.000 | 0,00 | 6.319 | 21,38 | ||||
| 2026-02-02 | 13F | CX Institutional | 9 | -18,18 | 0 | |||||
| 2026-02-17 | 13F | Advisor Group Holdings, Inc. | 10.056 | 71,17 | 978 | 121,27 | ||||
| 2026-02-17 | 13F | Optiver Holding B.V. | 2.296 | -96,31 | 223 | -95,53 | ||||
| 2026-02-17 | 13F | Advisory Services Network, LLC | 9.173 | 338,69 | 892 | 433,53 | ||||
| 2026-02-11 | 13F | Mirae Asset Securities (usa) Inc. | 40.076 | 3.896 | ||||||
| 2026-02-04 | 13F | NAN FUNG TRINITY (HK) Ltd | 920.800 | 0,00 | 89.520 | 21,37 | ||||
| 2025-10-23 | 13F | Spire Wealth Management | 0 | -100,00 | 0 | |||||
| 2026-02-13 | 13F | Flow Traders U.s. Llc | 0 | -100,00 | 0 | |||||
| 2026-02-10 | 13F | Foundations Investment Advisors, LLC | 70.774 | 6.881 | ||||||
| 2026-01-22 | 13F | Venturi Wealth Management, LLC | 69.480 | 6.755 | ||||||
| 2026-02-11 | 13F | Franklin Resources Inc | 324 | -0,31 | 31 | 19,23 | ||||
| 2026-02-11 | 13F | Clearbridge Investments, LLC | 14.157 | -18,53 | 1.376 | -1,08 | ||||
| 2025-10-14 | 13F | Monument Capital Management | 0 | -100,00 | 0 | -100,00 | ||||
| 2026-02-11 | 13F | Arrowpoint Investment Partners (Singapore) Pte. Ltd. | 0 | -100,00 | 0 | |||||
| 2026-02-09 | 13F | Arrow Investment Advisors, LLC | 3.848 | 374 | ||||||
| 2026-02-17 | 13F | Temasek Holdings (Private) Ltd | 1.594.998 | 116,59 | 155.066 | 162,89 | ||||
| 2026-01-23 | 13F | Diversify Advisory Services, LLC | 8.769 | 1,88 | 984 | 13,49 | ||||
| 2026-01-23 | 13F | Assetmark, Inc | 11.816 | 57,84 | 1.149 | 91,65 | ||||
| 2026-02-05 | 13F | Stephens Inc /ar/ | 4.280 | -9,89 | 416 | 9,47 | ||||
| 2026-01-05 | 13F | Union Bancaire Privee, UBP SA | 32.963 | -9,53 | 3.147 | 12,40 | ||||
| 2026-01-29 | 13F | J. Team Financial, Inc. | 3.963 | 385 | ||||||
| 2026-01-27 | 13F | Friedenthal Financial | 1.566 | -15,90 | 152 | 2,01 | ||||
| 2026-02-12 | 13F | Federation des caisses Desjardins du Quebec | 89.034 | 433,14 | 8.656 | 547,34 | ||||
| 2026-01-26 | 13F | Cwm, Llc | 879 | -2,01 | 0 | |||||
| 2026-02-17 | 13F | New Vernon Capital Holdings II LLC | 167.809 | 0,00 | 16.314 | 21,37 | ||||
| 2026-01-23 | 13F | Farther Finance Advisors, LLC | 2.104 | 27,52 | 205 | 54,55 | ||||
| 2026-02-06 | 13F | Covestor Ltd | 35 | -7,89 | 0 | |||||
| 2026-02-11 | 13F | Westerkirk Capital Inc. | 120.237 | 308,52 | 11.689 | 395,93 | ||||
| 2026-02-09 | 13F | Kingsview Wealth Management, LLC | 0 | -100,00 | 0 | |||||
| 2025-11-14 | 13F | Schonfeld Strategic Advisors LLC | 0 | -100,00 | 0 | |||||
| 2026-02-06 | 13F | IFP Advisors, Inc | 503 | 403,00 | 49 | 500,00 | ||||
| 2026-02-13 | 13F | Squarepoint Ops LLC | Call | 302.200 | 5.110,34 | 29.380 | 6.231,68 | |||
| 2026-02-13 | 13F | Squarepoint Ops LLC | Put | 6.000 | -20,00 | 583 | -2,83 | |||
| 2026-02-13 | 13F | Healthcare Of Ontario Pension Plan Trust Fund | 530.000 | 51.527 | ||||||
| 2026-02-02 | 13F | Breakwater Investment Management | 763 | 0,00 | 74 | 21,31 | ||||
| 2026-02-17 | 13F | Aristotle Capital Management, LLC | 63.965 | -2,76 | 6.219 | 18,03 | ||||
| 2026-02-14 | 13F | Rockefeller Capital Management L.P. | 270.843 | -2,52 | 26.332 | 18,32 | ||||
| 2026-01-30 | 13F | Us Bancorp \de\ | 2.751 | 15,88 | 267 | 40,53 | ||||
| 2026-02-13 | 13F | SPX Equities Gestao de Recursos Ltda | 1.574 | -94,75 | 153 | -93,63 | ||||
| 2026-02-13 | 13F | Wexford Capital Lp | 0 | -100,00 | 0 | |||||
| 2026-02-17 | 13F | Cresset Asset Management, LLC | 13.885 | 345,75 | 1.350 | 441,77 | ||||
| 2026-01-26 | 13F | Washington Growth Strategies Llc | 5.999 | -0,35 | 583 | 20,95 | ||||
| 2026-02-05 | 13F | Cambridge Investment Research Advisors, Inc. | 7.161 | 45,96 | 1 | |||||
| 2025-11-12 | 13F | Sumitomo Mitsui Financial Group, Inc. | 0 | -100,00 | 0 | |||||
| 2026-02-11 | 13F | Gordian Capital Singapore Pte Ltd | 0 | -100,00 | 0 | |||||
| 2025-12-09 | 13F/A | Tudor Investment Corp Et Al | Call | 1.388.200 | 11,94 | 111.195 | 24,92 | |||
| 2026-01-28 | 13F | Oversea-Chinese Banking CORP Ltd | 22.740 | -0,95 | 2.211 | 20,17 | ||||
| 2026-01-15 | 13F | Allspring Global Investments Holdings, LLC | 43.122 | -39,99 | 4.408 | -23,44 | ||||
| 2026-02-11 | 13F | Cypress Capital Group | 7.550 | 0,00 | 734 | 21,52 | ||||
| 2026-02-17 | 13F | Fwl Investment Management, Llc | 41.748 | 4.059 | ||||||
| 2025-11-14 | 13F | Engineers Gate Manager LP | 0 | -100,00 | 0 | -100,00 | ||||
| 2026-02-18 | 13F | Beacon Pointe Advisors, LLC | 5.240 | -2,29 | 509 | 18,65 | ||||
| 2026-02-04 | 13F | Abc Arbitrage Sa | 0 | -100,00 | 0 | |||||
| 2026-02-06 | 13F | Creative Financial Designs Inc /adv | 704 | 68 | ||||||
| 2026-02-17 | 13F | Capital Fund Management S.a. | Put | 120.500 | -19,61 | 11.715 | -2,42 | |||
| 2026-02-17 | 13F | Tudor Investment Corp Et Al | 161.407 | 107,97 | 15.692 | 152,43 | ||||
| 2026-02-17 | 13F | Capital Fund Management S.a. | Call | 214.700 | -21,76 | 20.873 | -5,03 | |||
| 2026-01-26 | 13F | Whittier Trust Co | 44.085 | 11.203,85 | 4.744 | 14.721,88 | ||||
| 2025-11-14 | 13F | Point72 Europe (London) LLP | 31.400 | 2.515 | ||||||
| 2026-02-06 | 13F | Cullen/frost Bankers, Inc. | 16 | 6,67 | 2 | 0,00 | ||||
| 2026-02-02 | 13F | Fifth Third Bancorp | 22 | 0,00 | 2 | 100,00 | ||||
| 2026-02-17 | 13F | D. E. Shaw & Co., Inc. | 0 | -100,00 | 0 | |||||
| 2026-02-11 | 13F | LPL Financial LLC | 125.489 | 8,80 | 12.200 | 32,06 | ||||
| 2026-02-13 | 13F | Citigroup Inc | 1.252.123 | -17,73 | 121.731 | -0,15 | ||||
| 2026-02-13 | 13F | Citigroup Inc | Put | 100.000 | -50,00 | 9.722 | -39,31 | |||
| 2025-11-13 | 13F | Marshall Wace, Llp | Put | 800 | 64 | |||||
| 2026-02-13 | 13F | Gemsstock Ltd. | 494.500 | 48.075 | ||||||
| 2026-02-17 | 13F | Cape Investment Advisory, Inc. | 148 | 19,35 | 14 | 55,56 | ||||
| 2026-02-17 | 13F | Raymond James Financial Inc | 45.589 | -25,18 | 4.432 | -9,18 | ||||
| 2026-01-07 | 13F | Massmutual Trust Co Fsb/adv | 7.798 | -2,46 | 758 | 18,44 | ||||
| 2026-02-17 | 13F | FIL Ltd | 153.545 | -3,85 | 14.928 | 16,69 | ||||
| 2026-01-29 | 13F | 4Thought Financial Group Inc. | 157 | -39,15 | 15 | -25,00 | ||||
| 2026-02-10 | 13F | Bnp Paribas Arbitrage, Sa | 93.079 | -50,27 | 9.049 | -39,63 | ||||
| 2026-02-05 | 13F | Wakefield Asset Management LLLP | 8.389 | -2,28 | 816 | 18,63 | ||||
| 2026-02-12 | 13F | Sun Life Financial Inc | 1.458.978 | -6,64 | 142 | 12,80 | ||||
| 2025-11-12 | 13F | Rock Creek Group, LP | 0 | -100,00 | 0 |