Grundlæggende statistik
| Institutionelle ejere | 407 total, 392 long only, 1 short only, 14 long/short - change of -11,85% MRQ |
| Gennemsnitlig porteføljeallokering | 0.3036 % - change of -14,18% MRQ |
| Institutionelle aktier (lange) | 92.878.598 (ex 13D/G) - change of -10,69MM shares -10,32% MRQ |
| Institutionel værdi (lang) | $ 5.870.096 USD ($1000) |
Institutionelt ejerskab og aktionærer
Embraer S.A. - Depositary Receipt (Common Stock) (US:ERJ) har 407 institutionelle ejere og aktionærer, der har indsendt 13D/G- eller 13F-formularer til Securities Exchange Commission (SEC). Disse institutioner har i alt 92,878,598 aktier. Største aktionærer omfatter GQG Partners LLC, Jennison Associates Llc, Brandes Investment Partners, Lp, Morgan Stanley, Ubs Asset Management Americas Inc, Bank Of America Corp /de/, Jpmorgan Chase & Co, American Century Companies Inc, Invesco Ltd., and Egerton Capital (UK) LLP .
Embraer S.A. - Depositary Receipt (Common Stock) (NYSE:ERJ) institutionel ejerskabsstruktur viser aktuelle positioner i virksomheden efter institutioner og fonde, samt seneste ændringer i positionsstørrelse. Større aktionærer kan omfatte individuelle investorer, investeringsforeninger, hedgefonde eller institutioner. Skema 13D angiver, at investoren besidder (eller besidder) mere end 5 % af virksomheden og har til hensigt (eller har til hensigt at) aktivt at forfølge en ændring i forretningsstrategi. Skema 13G indikerer en passiv investering på over 5%.
The share price as of October 31, 2025 is 64,48 / share. Previously, on March 14, 2025, the share price was 52,33 / share. This represents an increase of 23,22% over that period.

Fondens stemningsscore
Fund Sentiment Score (fka Ownership Accumulation Score) finder de aktier, der bliver mest købt af fonde. Det er resultatet af en sofistikeret, multi-faktor kvantitativ model, der identificerer virksomheder med de højeste niveauer af institutionel akkumulering. Scoringsmodellen bruger en kombination af den samlede stigning i oplyste ejere, ændringerne i porteføljeallokeringer i disse ejere og andre målinger. Tallet går fra 0 til 100, hvor højere tal indikerer et højere niveau af akkumulering for sine jævnaldrende, og 50 er gennemsnittet.
Opdateringsfrekvens: Dagligt
Se Ownership Explorer, som giver en liste over højest rangerende virksomheder.
AI+ Ask Fintel’s AI assistant about Embraer S.A. - Depositary Receipt (Common Stock).
Select a question to share a public post with an AI-crafted answer.
Thinking of good questions…
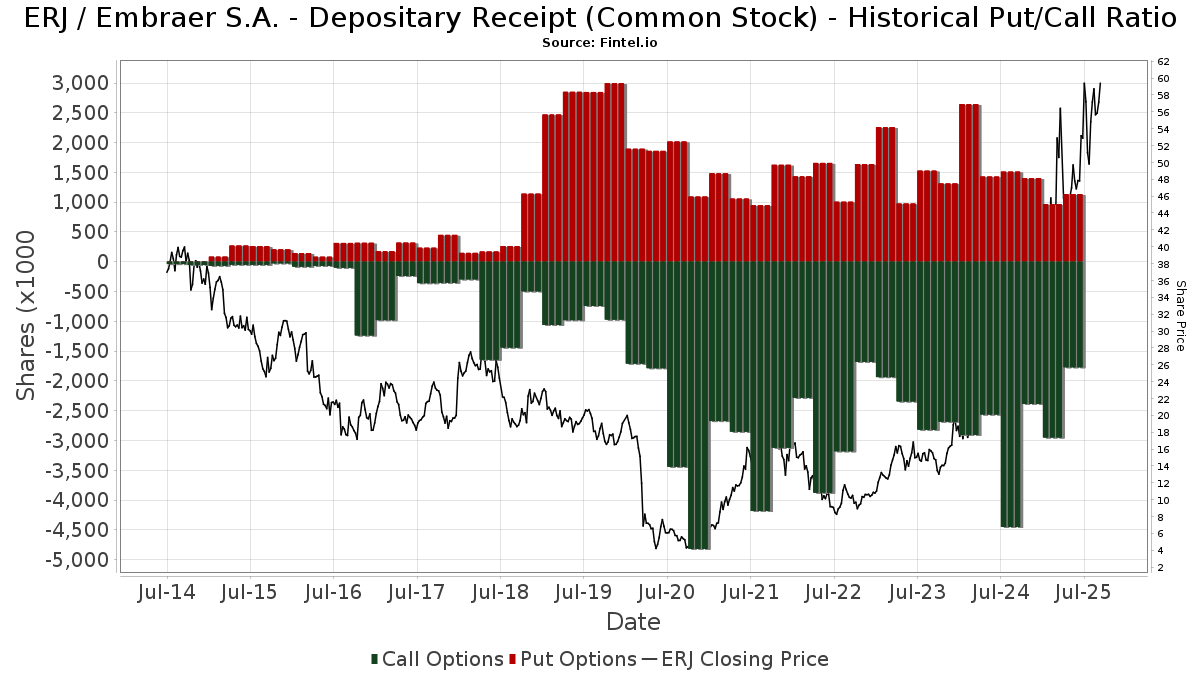
Institutionel Put/Call-forhold
Ud over at indberette standardaktie- og gældsudstedelser skal institutter med mere end 100 mill. aktiver under forvaltning også oplyse deres put- og call-optionsbeholdninger. Da salgsoptioner generelt indikerer negativ stemning, og købsoptioner indikerer positiv stemning, kan vi få en fornemmelse af den overordnede institutionelle stemning ved at plotte forholdet mellem put og kald. Diagrammet til højre viser det historiske put/call-forhold for dette instrument.
Brug af Put/Call Ratio som en indikator for investorernes stemning overvinder en af de vigtigste mangler ved at bruge totalt institutionelt ejerskab, som er, at en betydelig mængde af aktiver under forvaltning investeres passivt for at spore indekser. Passivt forvaltede fonde køber typisk ikke optioner, så indikatoren for put/call-forholdet følger mere nøje følelsen af aktivt forvaltede fonde.
13F og NPORT arkivering
Detaljer om 13F-arkivering er gratis. Detaljer om NP-ansøgninger kræver et premium-medlemskab. Grønne rækker angiver nye positioner. Røde rækker angiver lukkede positioner. Klik på linket ikon for at se den fulde transaktionshistorik.
Opgrader
for at låse premium-data op og eksportere til Excel ![]() .
.
| Fil dato | Kilde | Investor | Type | Gennemsnitlig pris (Øst) |
Aktier | Δ Aktier (%) |
Rapporteret Værdi ($1000) |
Δ Værdi (%) |
Port Alloc (%) |
|
|---|---|---|---|---|---|---|---|---|---|---|
| 2026-01-08 | 13F | NorthCrest Asset Manangement, LLC | 5.400 | 0,00 | 369 | 18,65 | ||||
| 2026-01-15 | 13F | Gunderson Capital Management Inc. | 60.528 | 402,10 | 3.896 | 435,16 | ||||
| 2026-02-10 | 13F | Bbr Partners, Llc | 0 | -100,00 | 0 | |||||
| 2026-01-20 | 13F | Perpetual Ltd | 124.687 | -22,26 | 8.026 | -17,22 | ||||
| 2026-02-17 | 13F | Strategic Investment Advisors / MI | 9.372 | -5,77 | 603 | 0,50 | ||||
| 2025-11-10 | 13F | Resources Investment Advisors, LLC. | 0 | -100,00 | 0 | |||||
| 2026-01-15 | 13F | Highline Wealth Partners Llc | 72 | 0,00 | 5 | 0,00 | ||||
| 2026-02-17 | 13F | Trexquant Investment LP | 6.029 | 388 | ||||||
| 2026-02-13 | 13F | Arrowstreet Capital, Limited Partnership | 2.435.003 | -6,17 | 156.741 | -0,08 | ||||
| 2025-09-25 | NP | JEMSX - JPMorgan Emerging Markets Equity Fund Class I | 1.424.784 | 17,65 | 82.039 | 47,46 | ||||
| 2026-02-11 | 13F | Parallel Advisors, LLC | 1.593 | 0,25 | 103 | 6,25 | ||||
| 2025-10-30 | 13F | Simplicity Wealth,LLC | 0 | -100,00 | 0 | |||||
| 2026-01-16 | 13F | Compagnie Lombard Odier SCmA | 7.313 | 0,00 | 471 | 6,33 | ||||
| 2026-02-03 | 13F | SBI Securities Co., Ltd. | 2.860 | 184 | ||||||
| 2025-09-25 | NP | DFCEX - Emerging Markets Core Equity Portfolio - Institutional Class This fund is a listed as child fund of Dimensional Fund Advisors Lp and if that institution has disclosed ownership in this security, then these positions will not be double counted when calculating total shares and total value | 905.779 | 0,00 | 52.155 | 25,34 | ||||
| 2026-01-15 | 13F | Burns Matteson Capital Management, LLC | 9.953 | 9,91 | 641 | 17,00 | ||||
| 2026-02-26 | 13F | TD Capital Management LLC | 8 | 0,00 | 1 | |||||
| 2026-02-09 | 13F | Harbour Investments, Inc. | 956 | 63,42 | 62 | 74,29 | ||||
| 2025-11-14 | 13F | Caption Management, LLC | Call | 0 | -100,00 | 0 | ||||
| 2026-02-13 | 13F | Mariner, LLC | 16.264 | 10,55 | 1.047 | 17,77 | ||||
| 2026-02-11 | 13F | Egerton Capital (UK) LLP | 3.278.140 | 54,85 | 211.014 | 64,89 | ||||
| 2025-11-07 | 13F | Sierra Ocean, Llc | 0 | -100,00 | 0 | |||||
| 2026-01-14 | 13F | ORG Wealth Partners, LLC | 187 | 6,86 | 12 | 20,00 | ||||
| 2026-02-11 | 13F | FLC Capital Advisors | 3.457 | -4,26 | 223 | 1,83 | ||||
| 2026-02-13 | 13F | Becker Capital Management Inc | 1.337.065 | -6,41 | 86.176 | -0,22 | ||||
| 2026-01-21 | 13F | Newbridge Financial Services Group, Inc. | 0 | -100,00 | 0 | |||||
| 2026-02-06 | 13F | Pnc Financial Services Group, Inc. | 7.813 | 6,55 | 503 | 13,32 | ||||
| 2026-02-17 | 13F | Advisor Group Holdings, Inc. | 35.250 | -39,82 | 2.269 | -34,21 | ||||
| 2026-02-04 | 13F | Beverly Hills Private Wealth, LLC | 26.158 | 0,00 | 1.581 | 0,00 | ||||
| 2026-01-05 | 13F | GAMMA Investing LLC | 612 | -11,18 | 39 | -4,88 | ||||
| 2026-01-21 | 13F | Sowell Financial Services LLC | 5.362 | 345 | ||||||
| 2026-01-16 | 13F | Ronald Blue Trust, Inc. | 7.167 | -11,35 | 461 | -5,53 | ||||
| 2026-02-17 | 13F | Russell Investments Group, Ltd. | 330.707 | 29,81 | 21.288 | 38,23 | ||||
| 2026-02-11 | 13F | Everett Harris & Co /ca/ | 4.200 | 0,00 | 270 | 6,72 | ||||
| 2026-02-11 | 13F | IMA Wealth, Inc. | 8 | 1 | ||||||
| 2025-10-21 | 13F | Steel Peak Wealth Management LLC | Call | 97 | 5,49 | |||||
| 2026-01-16 | 13F | West Branch Capital LLC | 3 | 0,00 | 0 | |||||
| 2026-01-26 | 13F | Cwm, Llc | 14.032 | 528,11 | 1 | |||||
| 2025-09-23 | NP | PBMIX - Polen U.S. SMID Company Growth Fund Institutional Class | 2.153 | 124 | ||||||
| 2026-02-02 | 13F | Alliance Wealth Advisors, LLC /UT | 3.498 | -15,67 | 225 | -10,00 | ||||
| 2026-02-17 | 13F | Citadel Advisors Llc | Put | 138.800 | 56,31 | 8.935 | 66,46 | |||
| 2025-11-14 | 13F | Eqis Capital Management, Inc. | 0 | -100,00 | 0 | |||||
| 2026-02-17 | 13F | Citadel Advisors Llc | Call | 83.400 | -37,57 | 5.368 | -33,53 | |||
| 2026-02-13 | 13F | Nicholas Investment Partners, LP | 428.972 | 4,22 | 27.613 | 10,97 | ||||
| 2026-02-13 | 13F | Toroso Investments, LLC | 27.691 | -1,16 | 1.782 | 5,26 | ||||
| 2025-11-12 | 13F | Barclays Plc | 0 | -100,00 | 0 | |||||
| 2026-02-13 | 13F | Atlas Capital Advisors Llc | 9.445 | -1,23 | 608 | 11,58 | ||||
| 2026-02-17 | 13F | Gilder Gagnon Howe & Co Llc | 2.323.295 | -2,18 | 149.550 | 4,17 | ||||
| 2025-11-13 | 13F | Riggs Asset Managment Co. Inc. | 0 | -100,00 | 0 | |||||
| 2026-02-13 | 13F | Neuberger Berman Group LLC | 29.218 | -0,77 | 1.885 | 6,56 | ||||
| 2026-02-17 | 13F | Nomura Holdings Inc | 0 | -100,00 | 0 | -100,00 | ||||
| 2026-01-12 | 13F | National Wealth Management Group, LLC | 12.071 | 0,04 | 777 | 6,58 | ||||
| 2026-01-26 | 13F | Asset Dedication, LLC | 1.785 | 0,00 | 115 | 6,54 | ||||
| 2026-01-14 | 13F | ORG Partners LLC | 379 | 4,12 | 24 | 9,09 | ||||
| 2025-09-25 | NP | PWJAX - PGIM Jennison International Opportunities Fund Class A | 2.916.679 | 5,01 | 167.942 | 31,61 | ||||
| 2026-02-17 | 13F | Tudor Investment Corp Et Al | Put | 16.800 | 1.081 | |||||
| 2026-02-17 | 13F | Tudor Investment Corp Et Al | Call | 35.800 | 2.304 | |||||
| 2026-02-05 | 13F | Gabelli Funds Llc | 4.500 | 0,00 | 290 | 6,25 | ||||
| 2026-02-17 | 13F | Citadel Advisors Llc | 362.288 | -50,58 | 23.320 | -47,37 | ||||
| 2026-01-29 | 13F | UMA Financial Services, Inc. | 20 | 0,00 | 1 | 0,00 | ||||
| 2026-02-10 | 13F | Future Fund LLC | 55.407 | 53,24 | 3.567 | 63,20 | ||||
| 2026-02-13 | 13F | Verition Fund Management LLC | 25.916 | -88,10 | 1.668 | -87,33 | ||||
| 2026-01-29 | 13F | Vanguard Group Inc | 714.979 | -0,75 | 46.023 | 5,69 | ||||
| 2026-02-06 | 13F | Larson Financial Group LLC | 443 | 0,23 | 29 | 7,69 | ||||
| 2026-02-12 | 13F | Renaissance Technologies Llc | 743.100 | 4,38 | 47.833 | 11,15 | ||||
| 2025-11-14 | 13F | Two Sigma Investments, Lp | 0 | -100,00 | 0 | |||||
| 2026-02-13 | 13F | Wexford Capital Lp | 2.714 | -29,40 | 175 | -25,00 | ||||
| 2025-09-23 | NP | SLANX - DWS Latin America Equity Fund Class A | 103.537 | 19,07 | 5.962 | 49,25 | ||||
| 2025-09-26 | NP | UUPIX - Ultraemerging Markets Profund Investor Class | 849 | 17,10 | 49 | 45,45 | ||||
| 2026-02-13 | 13F | Atika Capital Management LLC | 115.930 | 7.462 | ||||||
| 2025-11-12 | 13F | Barclays Plc | Call | 0 | -100,00 | 0 | ||||
| 2026-02-17 | 13F | Capital Fund Management S.a. | 59.930 | -19,34 | 3.858 | -14,12 | ||||
| 2026-01-20 | 13F | Signaturefd, Llc | 5.658 | -1,82 | 364 | 4,60 | ||||
| 2026-01-07 | 13F | Holistic Financial Partners | 5.888 | -7,48 | 379 | -1,30 | ||||
| 2026-02-17 | 13F | DV Trading LLC | 100 | 6 | ||||||
| 2026-02-17 | 13F | Glenmede Trust Co Na | 8.895 | 573 | ||||||
| 2026-01-23 | 13F | Assetmark, Inc | 482.403 | 2,61 | 31.052 | 9,26 | ||||
| 2026-01-27 | 13F | Waterfront Wealth Inc. | 20.876 | -0,26 | 1.658 | 25,82 | ||||
| 2026-01-20 | 13F | Toth Financial Advisory Corp | 3 | 0 | ||||||
| 2026-02-13 | 13F | State Street Corp | 263.755 | -26,31 | 16.978 | -21,53 | ||||
| 2026-02-17 | 13F | Man Group plc | 700.629 | 7,17 | 45.099 | 14,12 | ||||
| 2026-02-17 | 13F | SummitTX Capital, L.P. | 0 | -100,00 | 0 | |||||
| 2026-01-07 | 13F | Qp Wealth Management, Llc | 8.546 | 550 | ||||||
| 2026-02-17 | 13F | Creative Planning | 19.658 | -0,02 | 1.265 | 6,48 | ||||
| 2026-01-28 | 13F | Geneos Wealth Management Inc. | 300 | 0,00 | 19 | 5,56 | ||||
| 2026-02-12 | 13F | Advisors Asset Management, Inc. | 43.697 | 0,64 | 2.813 | 7,16 | ||||
| 2025-11-14 | 13F | Binnacle Investments Inc | 159 | -13,11 | 10 | -10,00 | ||||
| 2026-01-20 | 13F | Steel Peak Wealth Management LLC | 0 | -100,00 | 0 | -100,00 | ||||
| 2026-02-12 | 13F | Skopos Labs, Inc. | 13.756 | 56,71 | 884 | 66,79 | ||||
| 2026-01-29 | 13F | IMC-Chicago, LLC | 0 | -100,00 | 0 | -100,00 | ||||
| 2026-02-13 | 13F | SRS Capital Advisors, Inc. | 1.698 | 363,93 | 109 | 395,45 | ||||
| 2026-01-30 | 13F | Bogart Wealth, LLC | 3.000 | 0,00 | 193 | 6,63 | ||||
| 2026-01-14 | 13F | LVW Advisors, LLC | 8.767 | 0,00 | 564 | 6,62 | ||||
| 2025-11-12 | 13F | Accredited Wealth Management, LLC | 1.618 | 3.136,00 | 3 | 50,00 | ||||
| 2026-02-06 | 13F | Pinnbrook Capital Management Lp | Call | 146.500 | 9.430 | |||||
| 2025-11-14 | 13F | Maverick Capital Ltd | 0 | -100,00 | 0 | |||||
| 2026-02-17 | 13F | Amundi | 1.120.628 | 5,40 | 72.135 | 15,62 | ||||
| 2025-09-25 | NP | DEXC - Dimensional Emerging Markets ex China Core Equity ETF | 449 | 12,53 | 26 | 38,89 | ||||
| 2026-02-10 | 13F | Zweig-DiMenna Associates LLC | 195.150 | -0,56 | 12.562 | 5,88 | ||||
| 2026-02-12 | 13F | Steward Partners Investment Advisory, Llc | 153 | -3,77 | 10 | 0,00 | ||||
| 2026-02-13 | 13F | Brown Advisory Inc | 99.916 | -1,37 | 6.432 | 5,01 | ||||
| 2026-02-06 | 13F | Pinnbrook Capital Management Lp | 11.754 | -87,21 | 757 | -86,39 | ||||
| 2026-02-13 | 13F | Allianz Se | 3.239 | -90,36 | 208 | -89,75 | ||||
| 2026-02-17 | 13F | D. E. Shaw & Co., Inc. | 0 | -100,00 | 0 | |||||
| 2026-02-17 | 13F | Agf Management Ltd | 1.763.375 | -20,26 | 113.508 | -15,09 | ||||
| 2025-10-28 | 13F | Arlington Trust Co LLC | 0 | -100,00 | 0 | |||||
| 2026-01-30 | 13F | Us Bancorp \de\ | 9.768 | 14,51 | 629 | 21,94 | ||||
| 2026-02-06 | 13F | Gsa Capital Partners Llp | 16.043 | 237,39 | 1 | |||||
| 2026-02-17 | 13F | Point72 Asset Management, L.P. | Put | 7.800 | 502 | |||||
| 2026-02-17 | 13F | Point72 Asset Management, L.P. | Call | 20.300 | 1.307 | |||||
| 2025-09-25 | NP | DFA INVESTMENT DIMENSIONS GROUP INC - Emerging Markets Targeted Value Portfolio Institutional Class This fund is a listed as child fund of Dimensional Fund Advisors Lp and if that institution has disclosed ownership in this security, then these positions will not be double counted when calculating total shares and total value | 6.184 | 0,00 | 356 | 25,35 | ||||
| 2026-02-13 | 13F | Itau Unibanco Holding S.A. | 1.064.049 | 0,85 | 68.460 | 7,34 | ||||
| 2026-02-11 | 13F | Group One Trading, L.p. | Call | 224.800 | 5,54 | 14.470 | 12,39 | |||
| 2026-02-11 | 13F | Group One Trading, L.p. | Put | 15.200 | -45,32 | 978 | -41,79 | |||
| 2026-01-14 | 13F | Spire Wealth Management | 313 | -23,28 | 20 | -16,67 | ||||
| 2026-01-21 | 13F | MBA Advisors LLC | 8.618 | -5,83 | 555 | 0,18 | ||||
| 2026-02-10 | 13F | Acadian Asset Management Llc | 0 | -100,00 | 0 | |||||
| 2025-09-26 | NP | AAEMX - Alger Emerging Markets Fund Class A | 6.184 | 0,00 | 356 | 25,35 | ||||
| 2026-02-11 | 13F | Capital Wealth Planning, LLC | 275.273 | 37,61 | 18.011 | 48,96 | ||||
| 2026-02-12 | 13F | New York State Common Retirement Fund | 41.761 | 0,00 | 2.688 | 6,50 | ||||
| 2026-02-12 | 13F | EntryPoint Capital, LLC | 4.176 | 0,00 | 269 | 6,35 | ||||
| 2026-01-29 | 13F | Coronation Fund Managers Ltd. | 279.266 | -13,25 | 17.976 | -7,62 | ||||
| 2026-02-06 | 13F | Legato Capital Management LLC | 51.883 | 41,21 | 3.340 | 50,41 | ||||
| 2026-02-13 | 13F | Caitong International Asset Management Co., Ltd | 0 | -100,00 | 0 | |||||
| 2026-02-04 | 13F | BCJ Capital Management, LLC | 34.530 | 2.223 | ||||||
| 2025-09-24 | NP | IMRFX - Columbia Global Opportunities Fund Class A | 9.929 | 41,22 | 572 | 76,78 | ||||
| 2026-02-17 | 13F | Aqr Capital Management Llc | 103.320 | -36,94 | 6.626 | -33,11 | ||||
| 2026-02-12 | 13F | Callan Family Office, LLC | 27.690 | 1.782 | ||||||
| 2026-02-10 | 13F | Bruce G. Allen Investments, LLC | 1.395 | -14,57 | 90 | -9,18 | ||||
| 2026-02-11 | 13F | Axiom International Investors Llc /de | 294.808 | -0,65 | 18.977 | 5,79 | ||||
| 2026-03-06 | 13F | Hsbc Holdings Plc | 255.460 | -13,24 | 16.444 | -7,62 | ||||
| 2025-09-26 | NP | REMSX - Emerging Markets Fund Class S | 9.471 | -19,47 | 545 | 0,93 | ||||
| 2026-02-04 | 13F | C WorldWide Group Holding A/S | 6.686 | 0,00 | 0 | |||||
| 2026-02-06 | 13F | Abn Amro Investment Solutions | 8.647 | -36,64 | 557 | -32,52 | ||||
| 2026-02-11 | 13F | Group One Trading, L.p. | 0 | -100,00 | 0 | -100,00 | ||||
| 2026-02-10 | 13F | State of Wyoming | 7.478 | -1,67 | 481 | 4,79 | ||||
| 2026-01-26 | 13F | La Banque Postale Asset Management SA | 82.592 | -20,21 | 5.316 | -15,04 | ||||
| 2026-02-13 | 13F | Walleye Capital LLC | Put | 42.300 | -65,69 | 2.723 | -63,48 | |||
| 2026-02-13 | 13F | Walleye Capital LLC | 290.827 | -11,82 | 18.721 | -6,10 | ||||
| 2026-02-13 | 13F | Walleye Capital LLC | Call | 71.500 | 36,71 | 4.602 | 45,59 | |||
| 2026-02-05 | 13F | Atria Investments Llc | 19.946 | -8,03 | 1.284 | -2,14 | ||||
| 2025-10-15 | 13F | Atwood & Palmer Inc | 0 | -100,00 | 0 | |||||
| 2025-10-09 | 13F | AdvisorNet Financial, Inc | 0 | -100,00 | 0 | -100,00 | ||||
| 2026-01-14 | 13F | Jfs Wealth Advisors, Llc | 58 | 0,00 | 4 | 0,00 | ||||
| 2026-02-03 | 13F | Navellier & Associates Inc | 81.780 | -2,29 | 5.264 | 4,05 | ||||
| 2026-02-09 | 13F | Legal & General Group Plc | 5.495 | 0,00 | 354 | 6,65 | ||||
| 2026-02-17 | 13F | Raymond James Financial Inc | 25.163 | 1,08 | 1.620 | 7,65 | ||||
| 2025-11-14 | 13F | Prudential Plc | 0 | -100,00 | 0 | |||||
| 2026-02-02 | 13F | Artemis Investment Management LLP | 205.129 | -52,59 | 13.204 | -49,52 | ||||
| 2026-02-06 | 13F | Profund Advisors Llc | 8.637 | 10,36 | 556 | 17,34 | ||||
| 2026-01-16 | 13F | Bangor Savings Bank | 108 | 7 | ||||||
| 2026-02-13 | 13F | Vontobel Holding Ltd. | 5.000 | 0,00 | 322 | 6,29 | ||||
| 2026-02-11 | 13F | Simplex Trading, Llc | Put | 25.700 | -48,60 | 1.654 | ||||
| 2026-02-11 | 13F | AG Asset Advisory, LLC | 3.250 | 209 | ||||||
| 2026-01-23 | 13F | U.S. Capital Wealth Advisors, LLC | 12.147 | -0,91 | 782 | 5,40 | ||||
| 2026-02-13 | 13F | Rhumbline Advisers | 9.924 | -4,28 | 639 | 1,92 | ||||
| 2025-11-10 | 13F | Optiver Holding B.V. | 0 | -100,00 | 0 | -100,00 | ||||
| 2026-02-11 | 13F | Simplex Trading, Llc | 14.804 | 953 | ||||||
| 2026-01-22 | 13F | Financial Consulate, Inc | 4 | 0 | ||||||
| 2026-02-11 | 13F | Simplex Trading, Llc | Call | 24.700 | -70,63 | 1.590 | ||||
| 2026-02-11 | 13F | Deutsche Bank Ag\ | 13.120 | 18,79 | 845 | 26,54 | ||||
| 2026-01-29 | 13F | Nbc Securities, Inc. | 7.501 | -28,53 | 483 | -23,97 | ||||
| 2025-11-13 | 13F | Glenmede Investment Management, LP | 8.848 | 535 | ||||||
| 2026-02-17 | 13F | GeoWealth Management, LLC | 1.241 | -2,51 | 80 | 3,95 | ||||
| 2025-11-14 | 13F | Arrowpoint Investment Partners (Singapore) Pte. Ltd. | Call | 0 | -100,00 | 0 | ||||
| 2026-02-05 | 13F | Bessemer Group Inc | 8.201 | 0,00 | 1 | |||||
| 2025-11-14 | 13F | Arrowpoint Investment Partners (Singapore) Pte. Ltd. | Put | 0 | -100,00 | 0 | ||||
| 2026-02-13 | 13F | Ubs Asset Management Americas Inc | 4.142.571 | 0,73 | 266.657 | 7,26 | ||||
| 2025-09-26 | NP | AIM INVESTMENT FUNDS (INVESCO INVESTMENT FUNDS) - Invesco Oppenheimer Discovery Mid Cap Growth Fund Class R6 | 836.011 | 0,00 | 48.138 | 25,34 | ||||
| 2026-02-12 | 13F | DRW Securities, LLC | Call | 0 | -100,00 | 0 | ||||
| 2025-09-25 | NP | Thrivent Core Funds - Thrivent Core Emerging Markets Equity Fund | 3.286 | 1.163,85 | 189 | 1.618,18 | ||||
| 2026-02-10 | 13F | Goldman Sachs Group Inc | 1.545.388 | -45,14 | 99.477 | -41,58 | ||||
| 2025-11-07 | 13F | Todd Asset Management Llc | 0 | -100,00 | 0 | |||||
| 2026-02-12 | 13F | StoneX Group Inc. | 9.715 | 625 | ||||||
| 2026-02-13 | 13F | Anb Bank | 7.976 | -2,37 | 513 | 4,06 | ||||
| 2025-09-25 | NP | DFAX - Dimensional World ex U.S. Core Equity 2 ETF | 109.674 | 0,00 | 6.315 | 25,35 | ||||
| 2026-02-17 | 13F | Fmr Llc | 515.540 | 18,42 | 33.185 | 26,10 | ||||
| 2026-01-22 | 13F | Personal Cfo Solutions, Llc | 9.638 | 7,94 | 620 | 15,03 | ||||
| 2026-02-17 | 13F | American Trust Investment Advisors, LLC | 50.002 | -5,57 | 3.219 | 0,56 | ||||
| 2026-02-17 | 13F | Wiley Bros.-aintree Capital, Llc | 6.662 | -12,37 | 429 | -6,96 | ||||
| 2026-01-14 | 13F | Congress Park Capital LLC | 70.374 | -2,14 | 4.530 | 4,19 | ||||
| 2026-01-30 | 13F | Jennison Associates Llc | 5.729.568 | 3,15 | 368.812 | 9,84 | ||||
| 2026-02-10 | 13F | Daiwa Securities Group Inc. | 14.000 | 0,00 | 1 | |||||
| 2026-02-13 | 13F | MAI Capital Management | 84 | 0,00 | 5 | 0,00 | ||||
| 2026-02-06 | 13F | HighTower Advisors, LLC | 21.454 | -1,47 | 1.381 | 4,94 | ||||
| 2026-02-06 | 13F | Vestmark Advisory Solutions, Inc. | 4.965 | 320 | ||||||
| 2026-02-13 | 13F | Gen-Wealth Partners Inc | 1.142 | 79,00 | 74 | 92,11 | ||||
| 2026-01-23 | 13F | Farther Finance Advisors, LLC | 3.900 | 81,48 | 251 | 94,57 | ||||
| 2026-02-12 | 13F | Jane Street Group, Llc | Call | 67.500 | 33,14 | 4.345 | 41,78 | |||
| 2026-02-12 | 13F | Jane Street Group, Llc | 105.105 | 76,77 | 6.766 | 88,23 | ||||
| 2026-02-17 | 13F | Millennium Management Llc | 273.731 | -44,05 | 17.620 | -40,42 | ||||
| 2026-02-12 | 13F | Jane Street Group, Llc | Put | 13.600 | 875 | |||||
| 2026-03-04 | 13F | SHP Wealth Management | 31 | 2 | ||||||
| 2026-02-17 | 13F | Scientech Research LLC | 3.138 | -40,50 | 202 | -36,79 | ||||
| 2026-02-13 | 13F | Schroder Investment Management Group | 8.406 | -13,78 | 541 | -8,15 | ||||
| 2026-02-06 | 13F | Carrhae Capital LLP | 1.147.269 | -2,66 | 73.850 | 3,65 | ||||
| 2025-09-29 | NP | CTOGX - Calamos Timpani SMID Growth Fund Class R6 | 1.900 | -80,20 | 109 | -75,23 | ||||
| 2026-02-06 | 13F | TimesSquare Capital Management, LLC | 362.131 | 18,13 | 23.310 | 25,80 | ||||
| 2026-01-12 | 13F | Contravisory Investment Management, Inc. | 5.182 | 334 | ||||||
| 2026-02-10 | 13F | Thoroughbred Financial Services, Llc | 15.588 | -3,68 | 1 | |||||
| 2026-01-29 | 13F | Deltec Asset Management Llc | 81.500 | -3,55 | 5.246 | 2,70 | ||||
| 2026-01-28 | 13F | U S Global Investors Inc | 123.795 | -6,77 | 7.969 | -0,74 | ||||
| 2026-02-17 | 13F | Ibex Wealth Advisors | 74.439 | 4.792 | ||||||
| 2026-01-15 | 13F | Allspring Global Investments Holdings, LLC | 51.295 | 0,52 | 3.356 | 8,61 | ||||
| 2025-09-25 | NP | PAILX - PGIM Jennison International Small-Mid Cap Opportunities Fund Class C | 11.539 | 664 | ||||||
| 2026-02-13 | 13F | Macquarie Group Ltd | 0 | -100,00 | 0 | |||||
| 2026-02-02 | 13F | Oppenheimer Asset Management Inc. | 8.277 | -26,75 | 533 | -22,11 | ||||
| 2026-02-13 | 13F/A | Alberta Investment Management Corp | 0 | -100,00 | 0 | |||||
| 2026-02-11 | 13F | LPL Financial LLC | 152.314 | 22,33 | 9.804 | 30,27 | ||||
| 2026-02-05 | 13F | AustralianSuper Pty Ltd | 19.528 | 0,00 | 1.257 | 6,53 | ||||
| 2026-02-13 | 13F | Bridgewater Associates, LP | 0 | -100,00 | 0 | |||||
| 2026-02-17 | 13F | Ameriprise Financial Inc | 1.122.389 | 15,69 | 72.250 | 23,20 | ||||
| 2026-02-05 | 13F | Pinnacle Associates Ltd | 36.395 | -7,35 | 2.343 | -1,35 | ||||
| 2026-02-12 | 13F | Bank Of Montreal /can/ | 449.078 | 603,02 | 28.907 | 648,69 | ||||
| 2026-01-26 | 13F | Mirae Asset Global Investments Co., Ltd. | 13.043 | -0,90 | 840 | 5,53 | ||||
| 2026-01-13 | 13F | CoreCap Advisors, LLC | 600 | -40,00 | 39 | -36,67 | ||||
| 2026-01-26 | 13F | Quadrant Private Wealth Management, LLC | 9.540 | -0,01 | 615 | 6,60 | ||||
| 2025-11-21 | 13F/A | Royal Bank Of Canada | Call | 0 | -100,00 | 0 | -100,00 | |||
| 2026-02-17 | 13F | Captrust Financial Advisors | 3.713 | -1,90 | 239 | 4,82 | ||||
| 2025-09-24 | NP | EAEMX - Parametric Emerging Markets Fund Investor Class | 9.248 | 0,00 | 532 | 25,47 | ||||
| 2026-02-05 | 13F | Allworth Financial LP | 1.244 | -12,21 | 80 | -5,88 | ||||
| 2026-02-02 | 13F | Truist Financial Corp | 9.732 | -5,19 | 626 | 0,97 | ||||
| 2025-09-25 | NP | JADE - JPMorgan Active Developing Markets Equity ETF | 1.295 | 0,00 | 75 | 25,42 | ||||
| 2026-02-11 | 13F | Fox Run Management, L.l.c. | 0 | -100,00 | 0 | |||||
| 2026-02-17 | 13F | Jump Financial, LLC | 69.600 | 4.480 | ||||||
| 2026-02-17 | 13F | Optiver Holding B.V. | Put | 104.100 | 292,83 | 6.701 | 318,49 | |||
| 2025-09-26 | NP | TIOIX - TIAA-CREF International Opportunities Fund Institutional Class | 675.372 | -1,28 | 38.888 | 23,73 | ||||
| 2026-02-17 | 13F | Edmond De Rothschild Holding S.a. | 1.783 | 9,32 | 115 | 16,33 | ||||
| 2026-02-17 | 13F | Optiver Holding B.V. | Call | 140.900 | 50,70 | 9.070 | 60,46 | |||
| 2026-02-05 | 13F | DnB Asset Management AS | 484.720 | 5,31 | 31.201 | 12,17 | ||||
| 2026-01-20 | 13F | Thurston, Springer, Miller, Herd & Titak, Inc. | 1.724 | 111 | ||||||
| 2025-10-22 | 13F | Vaughan Nelson Investment Management, L.p. | 0 | -100,00 | 0 | -100,00 | ||||
| 2025-11-14 | 13F | Sig Brokerage, Lp | 0 | -100,00 | 0 | |||||
| 2025-11-13 | 13F | Kayne Anderson Rudnick Investment Management Llc | 0 | -100,00 | 0 | -100,00 | ||||
| 2026-02-13 | 13F | Mml Investors Services, Llc | 3.533 | 227 | ||||||
| 2026-02-17 | 13F | Graham Capital Management, L.P. | 245.272 | 27,57 | 15.788 | 35,85 | ||||
| 2026-02-17 | 13F | CWM Advisors, LLC | 1.420 | 91 | ||||||
| 2026-02-17 | 13F | Fred Alger Management, Llc | 16.866 | 5,96 | 1.087 | 12,89 | ||||
| 2026-02-03 | 13F | Ethic Inc. | 5.740 | 4,31 | 369 | 11,14 | ||||
| 2026-02-11 | 13F | Brandes Investment Partners, Lp | 5.155.739 | -12,37 | 331.876 | -6,68 | ||||
| 2026-02-17 | 13F | Two Sigma Securities, Llc | 0 | -100,00 | 0 | |||||
| 2026-02-17 | 13F | Rwc Asset Advisors (us) Llc | 1.239.061 | 60,22 | 79.758 | 70,61 | ||||
| 2026-02-18 | 13F | Vident Advisory, LLC | 18.469 | 4,79 | 1.189 | 11,55 | ||||
| 2025-10-22 | 13F | D.a. Davidson & Co. | 0 | -100,00 | 0 | |||||
| 2026-02-12 | 13F | Fox Hill Wealth Management | 7.089 | -0,67 | 456 | 5,80 | ||||
| 2026-02-13 | 13F | Glen Eagle Advisors, LLC | 185 | 0,00 | 12 | 0,00 | ||||
| 2026-02-09 | 13F | Employees Retirement System of Texas | 32.480 | 0,00 | 2 | 100,00 | ||||
| 2026-02-04 | 13F | Aubrey Capital Management Ltd | 311.008 | 0,00 | 20.019 | 6,48 | ||||
| 2026-02-12 | 13F | Quadrant Capital Group Llc | 7.768 | -5,61 | 500 | 0,60 | ||||
| 2025-09-26 | 13F | Capital A Wealth Management, LLC | 0 | -100,00 | 0 | |||||
| 2026-01-29 | 13F | Rakuten Securities, Inc. | 0 | -100,00 | 0 | |||||
| 2026-02-10 | 13F/A | Northwestern Mutual Wealth Management Co | 4.836 | 46,77 | 311 | 56,28 | ||||
| 2026-02-02 | 13F | Fifth Third Bancorp | 11 | 0,00 | 1 | |||||
| 2026-02-02 | 13F | Oppenheimer & Co Inc | 7.340 | 472 | ||||||
| 2026-02-03 | 13F | Garner Asset Management Corp | 600 | 39 | ||||||
| 2025-10-27 | 13F | North of South Capital LLP | 0 | -100,00 | 0 | |||||
| 2026-01-21 | 13F | SJS Investment Consulting Inc. | 372 | 1.760,00 | 24 | 2.200,00 | ||||
| 2026-02-13 | 13F | Bridgefront Capital, LLC | 9.797 | 109,83 | 631 | 123,40 | ||||
| 2025-09-26 | NP | EMES - Harbor Emerging Markets Select ETF | 2.318 | 133 | ||||||
| 2025-09-26 | NP | FTLS - First Trust Long/Short Equity ETF This fund is a listed as child fund of First Trust Advisors Lp and if that institution has disclosed ownership in this security, then these positions will not be double counted when calculating total shares and total value | Short | -53.922 | -3.105 | |||||
| 2026-02-09 | 13F | Leavell Investment Management, Inc. | 13.345 | 8,98 | 860 | 16,22 | ||||
| 2025-11-06 | 13F | Blume Capital Management, Inc. | 0 | -100,00 | 0 | |||||
| 2026-01-08 | 13F | Wealth Enhancement Advisory Services, Llc | 25.657 | 0,05 | 1.786 | 20,61 | ||||
| 2026-02-10 | 13F | Rothschild Investment Llc | 120 | 0,00 | 8 | 0,00 | ||||
| 2025-11-14 | 13F | Toronto Dominion Bank | 0 | -100,00 | 0 | |||||
| 2025-11-12 | 13F | Victory Capital Management Inc | 0 | -100,00 | 0 | |||||
| 2026-02-17 | 13F | Nomura Holdings Inc | Call | 75.200 | 4.841 | |||||
| 2026-02-18 | 13F | GWM Advisors LLC | 0 | -100,00 | 0 | |||||
| 2026-02-17 | 13F | Imprint Wealth LLC | 0 | -100,00 | 0 | |||||
| 2026-02-17 | 13F | Hamilton Wealth, LLC | 1.097 | -81,29 | 369 | 4,24 | ||||
| 2026-02-17 | 13F | Driehaus Capital Management Llc | 1.590.028 | 71,16 | 102.350 | 82,26 | ||||
| 2026-02-13 | 13F | Citigroup Inc | 7.107 | -14,05 | 457 | -8,42 | ||||
| 2026-02-17 | 13F | Bank Of America Corp /de/ | 3.601.054 | 5,66 | 231.800 | 12,51 | ||||
| 2026-02-13 | 13F | Gallo Partners, LP | 90.224 | 5.808 | ||||||
| 2026-02-12 | 13F | Rossby Financial, LCC | 5.711 | -1,91 | 368 | 4,26 | ||||
| 2026-01-27 | 13F | TD Waterhouse Canada Inc. | 100 | 6 | ||||||
| 2026-02-04 | 13F | Independent Advisor Alliance | 55.580 | -2,34 | 3.578 | 3,98 | ||||
| 2026-02-17 | 13F | Two Sigma Advisers, Lp | 78.400 | -3,33 | 5.047 | 2,94 | ||||
| 2025-10-22 | 13F | OneAscent Financial Services LLC | 3.620 | -18,58 | 219 | |||||
| 2025-09-23 | NP | GERIX - Goldman Sachs Emerging Markets Equity Insights Fund Institutional | 537.525 | 87,88 | 30.951 | 135,49 | ||||
| 2026-02-12 | 13F | Hrt Financial Lp | 7.597 | 0 | ||||||
| 2026-02-12 | 13F | BlackRock, Inc. | 134.955 | 7,97 | 8.687 | 14,98 | ||||
| 2026-01-05 | 13F | Union Bancaire Privee, UBP SA | 376.469 | 23.024 | ||||||
| 2026-02-05 | 13F | 1620 Investment Advisors, Inc. | 685 | 0,00 | 44 | 7,32 | ||||
| 2026-02-13 | 13F | National Bank Of Canada /fi/ | 515 | 33 | ||||||
| 2026-02-13 | 13F | Integrated Wealth Concepts LLC | 0 | -100,00 | 0 | |||||
| 2026-02-17 | 13F | Voloridge Investment Management, Llc | 112.493 | 702,26 | 7.241 | 754,90 | ||||
| 2026-01-15 | 13F | Gleason Group, Inc. | 3.754 | 0,00 | 242 | 6,64 | ||||
| 2026-01-12 | 13F | Legacy Wealth Asset Management, LLC | 20.774 | -5,48 | 1.337 | 0,68 | ||||
| 2026-03-12 | 13F | Nalls Sherbakoff Group, Llc | 300 | 0,00 | 19 | 280,00 | ||||
| 2026-01-09 | 13F | Inspirion Wealth Advisors, Llc | 10.156 | -16,45 | 654 | 52,21 | ||||
| 2025-09-25 | NP | PAHTX - PGIM Jennison NextGeneration Global Opportunities Fund Class C | 3.549 | 204 | ||||||
| 2026-02-10 | 13F | AdvisorShares Investments LLC | 40.046 | 4,50 | 2.578 | 11,27 | ||||
| 2026-02-12 | 13F | Principal Securities, Inc. | 0 | -100,00 | 0 | |||||
| 2026-02-13 | 13F | Walleye Trading LLC | Put | 21.800 | -47,34 | 1.403 | -43,92 | |||
| 2026-02-13 | 13F | Walleye Trading LLC | Call | 123.700 | -2,44 | 7.963 | 3,87 | |||
| 2025-11-13 | 13F | Bank Julius Baer & Co. Ltd, Zurich | 0 | -100,00 | 0 | |||||
| 2026-02-13 | 13F | Sofos Investments, Inc. | 0 | -100,00 | 0 | |||||
| 2026-03-02 | 13F | Bank Of Hawaii | 0 | -100,00 | 0 | |||||
| 2026-01-12 | 13F | Abound Wealth Management | 182 | 12 | ||||||
| 2026-01-21 | 13F | Yousif Capital Management, Llc | 3.107 | 228 | ||||||
| 2026-02-17 | 13F | Shay Capital LLC | 0 | -100,00 | 0 | |||||
| 2025-11-12 | 13F | Bellwether Advisors, LLC | 0 | -100,00 | 0 | |||||
| 2026-02-10 | 13F | Bank of New York Mellon Corp | 125.719 | -49,68 | 8.093 | -46,41 | ||||
| 2026-02-17 | 13F | Qube Research & Technologies Ltd | 393.195 | -25,62 | 25.310 | -20,80 | ||||
| 2025-11-03 | 13F | Channing Global Advisors, Llc | 0 | -100,00 | 0 | |||||
| 2026-02-12 | 13F/A | Pinebridge Investments Llc | 31.311 | 2.015 | ||||||
| 2025-09-25 | NP | TWAAX - Thrivent International Allocation Fund Class A | 444 | 1.168,57 | 26 | 2.400,00 | ||||
| 2025-09-29 | NP | CRLSX - CATHOLIC RESPONSIBLE INVESTMENTS INTERNATIONAL EQUITY FUND Institutional Shares | 0 | -100,00 | 0 | -100,00 | ||||
| 2026-02-17 | 13F | Susquehanna International Group, Llp | Put | 290.900 | -37,96 | 18.725 | -33,94 | |||
| 2026-02-17 | 13F | Susquehanna International Group, Llp | Call | 304.500 | -47,69 | 19.601 | -44,30 | |||
| 2026-02-05 | 13F | Navalign, LLC | 99 | 6 | ||||||
| 2026-02-17 | 13F | Susquehanna International Group, Llp | 82.928 | 5.338 | ||||||
| 2025-09-26 | NP | RAZAX - Multi-Asset Growth Strategy Fund Class A | 4.678 | 0,00 | 269 | 25,70 | ||||
| 2026-01-22 | 13F | Pinnacle Bancorp, Inc. | 175 | -18,22 | 11 | -8,33 | ||||
| 2025-09-29 | NP | CVGRX - Calamos Growth Fund Class A | 8.578 | -74,28 | 494 | -67,82 | ||||
| 2026-02-02 | 13F | Montag A & Associates Inc | 1.174 | -5,09 | 76 | 1,35 | ||||
| 2026-02-11 | 13F | Jpmorgan Chase & Co | 3.559.274 | -11,82 | 229.110 | -6,10 | ||||
| 2026-02-13 | 13F | Sei Investments Co | 103.728 | 3,14 | 6.677 | 9,82 | ||||
| 2026-01-28 | 13F | Kapitalo Investimentos Ltda | 99.372 | 9,07 | 6.397 | 16,14 | ||||
| 2026-01-28 | 13F | WPG Advisers, LLC | 1.119 | 5,57 | 72 | 12,50 | ||||
| 2026-02-19 | 13F | Atomi Financial Group, Inc. | 7.034 | 6,13 | 453 | 13,00 | ||||
| 2026-02-13 | 13F | Wells Fargo & Company/mn | 179.478 | -19,22 | 11.553 | -13,98 | ||||
| 2026-02-13 | 13F | Pathstone Holdings, LLC | 3.695 | 238 | ||||||
| 2026-01-23 | 13F | Yorktown Management & Research Co Inc | 4.200 | 0,00 | 270 | 6,72 | ||||
| 2026-02-13 | 13F | Maven Securities LTD | 19.562 | 30,73 | 1.259 | 39,27 | ||||
| 2026-02-10 | 13F | Bearing Point Capital, Llc | 130.745 | 8,25 | 8.416 | 15,27 | ||||
| 2026-01-21 | 13F | Stone House Investment Management, LLC | 35 | 2 | ||||||
| 2026-02-17 | 13F | XTX Topco Ltd | 17.924 | 1.154 | ||||||
| 2026-01-14 | 13F | Klein Pavlis & Peasley Financial, Inc. | 50.007 | -1,19 | 3.219 | 5,20 | ||||
| 2026-02-10 | 13F | Root Financial Partners, LLC | 32 | 0,00 | 2 | 100,00 | ||||
| 2025-10-21 | 13F | Rexford Capital Inc | 0 | -100,00 | 0 | |||||
| 2026-01-28 | 13F | Legacy Capital Group California, Inc. | 7.237 | 466 | ||||||
| 2026-01-29 | 13F | IMC-Chicago, LLC | Call | 43.700 | 31,63 | 2.813 | 40,18 | |||
| 2025-09-26 | NP | RTSSX - Tax-Managed U.S. Mid & Small Cap Fund Class S | 51.684 | 2.976 | ||||||
| 2026-01-09 | 13F | SG Americas Securities, LLC | 0 | -100,00 | 0 | |||||
| 2026-02-17 | 13F | Schonfeld Strategic Advisors LLC | 121.359 | -71,24 | 7.812 | -69,38 | ||||
| 2025-09-26 | NP | RTNAX - Tax-Managed International Equity Fund Class A | 27.093 | 1.560 | ||||||
| 2026-01-29 | 13F | Quent Capital, LLC | 38.000 | 2.446 | ||||||
| 2026-02-11 | 13F | O'shaughnessy Asset Management, Llc | 62.485 | -18,59 | 4.022 | -13,30 | ||||
| 2026-01-29 | 13F | Sanctuary Advisors, LLC | 12.538 | -6,12 | 807 | 0,00 | ||||
| 2026-02-12 | 13F | Dimensional Fund Advisors Lp | 1.532.756 | -4,71 | 98.664 | 1,47 | ||||
| 2026-01-21 | 13F | Flagship Harbor Advisors, Llc | 10 | -99,86 | 1 | -100,00 | ||||
| 2026-02-12 | 13F | Nuveen, LLC | 1.685.116 | -8,95 | 108.471 | -3,04 | ||||
| 2026-02-17 | 13F | Quantinno Capital Management LP | 23.903 | 17,27 | 1.539 | 24,84 | ||||
| 2025-09-25 | NP | Dfa Investment Trust Co - The Emerging Markets Small Cap Series This fund is a listed as child fund of Dimensional Fund Advisors Lp and if that institution has disclosed ownership in this security, then these positions will not be double counted when calculating total shares and total value | 187.677 | 0,00 | 10.806 | 25,35 | ||||
| 2026-02-17 | 13F | Capital Fund Management S.a. | Put | 26.200 | 61,73 | 1.686 | 72,22 | |||
| 2026-02-13 | 13F | Corient IA LLC | 19.920 | -20,32 | 1.282 | -15,16 | ||||
| 2026-02-17 | 13F | Capital Fund Management S.a. | Call | 54.700 | 10,95 | 3.521 | 18,15 | |||
| 2025-11-14 | 13F | Cubist Systematic Strategies, LLC | Put | 81.700 | 188,69 | 4.939 | 206,71 | |||
| 2025-09-26 | NP | BVEFX - Becker Value Equity Fund Retail Class | 31.940 | 0,00 | 1.839 | 25,36 | ||||
| 2026-01-21 | 13F | Steadtrust LLC | 7.300 | 0,00 | 470 | 6,35 | ||||
| 2025-09-25 | NP | VEIEX - Vanguard Emerging Markets Stock Index Fund Investor Shares | 306.729 | 0,00 | 17.661 | 25,34 | ||||
| 2025-11-14 | 13F | Cubist Systematic Strategies, LLC | Call | 36.700 | 105,03 | 2.219 | 117,88 | |||
| 2026-02-12 | 13F | RPg Family Wealth Advisory, LLC | 140.552 | 1,00 | 9.059 | 7,68 | ||||
| 2025-09-25 | NP | Dfa Investment Trust Co - The Emerging Markets Series This fund is a listed as child fund of Dimensional Fund Advisors Lp and if that institution has disclosed ownership in this security, then these positions will not be double counted when calculating total shares and total value | 92.800 | 0,00 | 5.343 | 25,33 | ||||
| 2026-01-12 | 13F | Eastover Investment Advisors LLC | 4.137 | 1,82 | 266 | 8,57 | ||||
| 2026-01-21 | 13F | AMS Capital Ltda | 157.258 | 10 | ||||||
| 2026-02-19 | 13F | Mcguire Capital Advisors Inc | 38 | 2 | ||||||
| 2026-02-17 | 13F | Quadrature Capital Ltd | 20.593 | 1.326 | ||||||
| 2026-02-13 | 13F | Y-Intercept (Hong Kong) Ltd | 26.824 | 13,73 | 1.727 | 21,12 | ||||
| 2026-02-17 | 13F | MIRAE ASSET GLOBAL ETFS HOLDINGS Ltd. | 1.125 | 24,72 | 72 | 33,33 | ||||
| 2026-02-10 | 13F | Quantbot Technologies LP | 15.107 | 20,61 | 972 | 28,40 | ||||
| 2026-02-17 | 13F | Ulysses Management LLC | 0 | -100,00 | 0 | |||||
| 2026-02-03 | 13F | Diversify Wealth Management, Llc | 53.235 | 3,94 | 3.860 | 16,55 | ||||
| 2026-01-15 | 13F | Trust Co | 107 | 0,00 | 7 | 0,00 | ||||
| 2026-01-08 | 13F | True Wealth Design, LLC | 19 | 46,15 | 1 | |||||
| 2025-11-14 | 13F | PineBridge Investments, L.P. | 22.134 | 14,27 | 1.338 | 21,42 | ||||
| 2026-02-12 | 13F | Marex Group plc | 0 | -100,00 | 0 | |||||
| 2025-09-26 | NP | RMYAX - Multi-Strategy Income Fund Class A | 1.644 | 89,18 | 95 | 141,03 | ||||
| 2026-02-10 | 13F | Eurizon SLJ Capital Ltd | 17.374 | 1.118 | ||||||
| 2026-02-13 | 13F | Ieq Capital, Llc | 4.875 | 3,48 | 314 | 10,21 | ||||
| 2025-09-25 | NP | DFAE - Dimensional Emerging Core Equity Market ETF | 84.075 | 0,00 | 4.841 | 25,35 | ||||
| 2026-02-12 | 13F | Commonwealth Equity Services, Llc | 28.029 | -5,35 | 1.804 | 180.300,00 | ||||
| 2026-02-17 | 13F | Cape Investment Advisory, Inc. | 76 | 5 | ||||||
| 2026-02-06 | 13F | EverSource Wealth Advisors, LLC | 1.998 | -24,40 | 129 | -19,50 | ||||
| 2026-01-30 | 13F | Rachor Investment Advisory Services, LLC | 123 | 8 | ||||||
| 2026-01-23 | 13F | Diversify Advisory Services, LLC | 18.356 | 9,33 | 1.352 | 24,52 | ||||
| 2026-02-03 | 13F | Chesapeake Capital Corp /il/ | 18.919 | 0,00 | 1.218 | 6,47 | ||||
| 2026-02-04 | 13F | Pensionmark Financial Group, Llc | 5.252 | 19,09 | 314 | 17,67 | ||||
| 2026-02-17 | 13F | Hood River Capital Management LLC | 160 | 10 | ||||||
| 2025-09-25 | NP | VGTSX - Vanguard Total International Stock Index Fund Investor Shares | 390.775 | -21,87 | 22.501 | -2,08 | ||||
| 2026-02-13 | 13F | Stifel Financial Corp | 99.358 | -4,82 | 6.396 | 1,35 | ||||
| 2026-02-12 | 13F | CIBC Private Wealth Group, LLC | 952 | -0,31 | 61 | 7,02 | ||||
| 2026-02-05 | 13F | Thrivent Financial For Lutherans | 9.847 | 1 | ||||||
| 2026-02-17 | 13F | Aquatic Capital Management LLC | 0 | -100,00 | 0 | |||||
| 2025-09-29 | NP | TRFM - AAM Transformers ETF | 6.337 | 119,27 | 365 | 175,76 | ||||
| 2026-02-05 | 13F | Stephens Inc /ar/ | 4.128 | 266 | ||||||
| 2026-02-13 | 13F | Smartleaf Asset Management LLC | 72 | 1.100,00 | 5 | |||||
| 2026-02-12 | 13F | Polen Capital Management Llc | 0 | -100,00 | 0 | |||||
| 2026-02-09 | 13F | Wcm Investment Management, Llc | 42.061 | 2.726 | ||||||
| 2026-01-29 | 13F | IMC-Chicago, LLC | Put | 0 | -100,00 | 0 | -100,00 | |||
| 2026-02-13 | 13F | Johnson Investment Counsel Inc | 0 | -100,00 | 0 | |||||
| 2026-01-27 | 13F | Brighton Jones Llc | 0 | -100,00 | 0 | |||||
| 2026-02-10 | 13F | Evolution Wealth Management Inc. | 0 | -100,00 | 0 | -100,00 | ||||
| 2025-09-26 | NP | BFRE - Westwood LBRTY Global Equity ETF | 39 | -22,00 | 2 | 0,00 | ||||
| 2026-02-10 | 13F | One Capital Management, LLC | 31.296 | 39,70 | 2.015 | 48,74 | ||||
| 2026-02-13 | 13F | Peak6 Llc | Put | 150.000 | 0,00 | 9.656 | 6,49 | |||
| 2026-02-13 | 13F | Peak6 Llc | Call | 193.100 | -37,95 | 12.430 | -33,93 | |||
| 2025-09-26 | NP | AFAIX - Alger International Small Cap Fund Class A | 873 | 50 | ||||||
| 2026-02-17 | 13F | Massar Capital Management, LP | 6.696 | 431 | ||||||
| 2026-02-12 | 13F | Brinker Capital Investments, LLC | 11.822 | -7,31 | 761 | -1,17 | ||||
| 2025-09-25 | NP | DFEM - Dimensional Emerging Markets Core Equity 2 ETF | 150.068 | 0,00 | 8.641 | 25,33 | ||||
| 2026-02-03 | 13F | Ballentine Partners, LLC | 7.100 | -20,16 | 457 | -14,90 | ||||
| 2026-02-17 | 13F | Northern Trust Corp | 252.629 | -15,45 | 16.262 | -9,97 | ||||
| 2026-02-17 | 13F | EFG International AG | 1.920 | 124 | ||||||
| 2026-02-17 | 13F | Engineers Gate Manager LP | 22.115 | 35,38 | 1.424 | 44,17 | ||||
| 2026-01-29 | 13F | UBS Group AG | 1.149.653 | 48,62 | 74.003 | 58,25 | ||||
| 2026-02-10 | 13F | CIBC World Markets Inc. | 9.610 | 47,76 | 619 | 57,25 | ||||
| 2026-02-06 | 13F | Leonteq Securities AG | 431 | -35,86 | 28 | -32,50 | ||||
| 2026-02-12 | 13F | Hm Payson & Co | 159 | 10 | ||||||
| 2026-01-27 | 13F | Regions Financial Corp | 23.791 | 3,23 | 1.531 | 9,91 | ||||
| 2025-09-25 | NP | PDEAX - PGIM JENNISON EMERGING MARKETS EQUITY OPPORTUNITIES FUND Class A | 396.529 | -48,05 | 22.832 | -34,88 | ||||
| 2025-09-22 | NP | GSEQX - Goldman Sachs Multi-Manager Global Equity Fund Class R6 Shares | 2.380 | -61,30 | 137 | -51,42 | ||||
| 2025-10-27 | 13F | Janney Montgomery Scott LLC | 0 | -100,00 | 0 | |||||
| 2025-11-14 | 13F | Wolverine Trading, Llc | 12.547 | -34,36 | 747 | -28,95 | ||||
| 2025-11-14 | 13F | Wolverine Trading, Llc | Call | 108.000 | 80,00 | 6.426 | 94,90 | |||
| 2025-11-14 | 13F | Wolverine Trading, Llc | Put | 24.600 | 50,00 | 1.464 | 62,38 | |||
| 2026-02-17 | 13F | Lighthouse Investment Partners, LLC | 7.388 | 476 | ||||||
| 2026-02-09 | 13F | IPG Investment Advisors LLC | 6.050 | 0,00 | 389 | 6,58 | ||||
| 2026-01-27 | 13F | WealthCollab, LLC | 36 | 0,00 | 2 | 0,00 | ||||
| 2026-02-20 | 13F | Dorsey Wright & Associates | 59.040 | 3,86 | 3.800 | 10,59 | ||||
| 2026-02-13 | 13F | JustInvest LLC | 22.725 | -0,68 | 1.463 | 5,71 | ||||
| 2026-02-05 | 13F | Cambridge Investment Research Advisors, Inc. | 33.772 | -0,13 | 2 | 0,00 | ||||
| 2026-02-17 | 13F | SageView Advisory Group, LLC | 103 | 7 | ||||||
| 2026-01-26 | 13F | Cottage Street Advisors LLC | 9.900 | 10,00 | 637 | 17,10 | ||||
| 2025-09-29 | NP | APITX - Yorktown Growth Fund Class L Shares | 4.200 | 0,00 | 242 | 25,52 | ||||
| 2025-11-12 | 13F | Teachers Retirement System Of The State Of Kentucky | 0 | -100,00 | 0 | |||||
| 2026-02-17 | 13F | Jones Financial Companies Lllp | 12.107 | 289,29 | 779 | 314,36 | ||||
| 2025-09-24 | NP | SWMIX - Laudus International MarketMasters Fund Select Shares | 78.628 | 2,02 | 4.527 | 27,88 | ||||
| 2026-02-11 | 13F | Ramirez Asset Management, Inc. | 128.129 | 8.248 | ||||||
| 2026-02-05 | 13F | High Note Wealth, LLC | 1 | 0,00 | 0 | |||||
| 2025-09-29 | NP | AIM INTERNATIONAL MUTUAL FUNDS (INVESCO INTERNATIONAL MUTUAL FUNDS) - Invesco Oppenheimer Global Opportunities Fund Class R5 | 194.992 | 0,00 | 11.228 | 25,34 | ||||
| 2026-01-23 | 13F | Bingham Private Wealth, Llc | 3.974 | 13,06 | 256 | 27,50 | ||||
| 2026-02-19 | 13F | Invesco Ltd. | 3.418.382 | 21,63 | 220.041 | 29,52 | ||||
| 2026-02-13 | 13F | GQG Partners LLC | 8.004.535 | -0,86 | 515.252 | 5,57 | ||||
| 2026-01-23 | 13F | Robeco Institutional Asset Management B.V. | 18.282 | -88,96 | 1.177 | -88,25 | ||||
| 2026-01-22 | 13F | Maseco Llp | 116 | 7 | ||||||
| 2026-01-22 | 13F | Evermay Wealth Management Llc | 250 | 16 | ||||||
| 2026-02-13 | 13F | SPX Equities Gestao de Recursos Ltda | 0 | -100,00 | 0 | -100,00 | ||||
| 2026-02-10 | 13F | Bnp Paribas Arbitrage, Sa | 4.421 | -19,27 | 285 | -14,20 | ||||
| 2025-11-14 | 13F | SIH Partners, LLLP | 0 | -100,00 | 0 | |||||
| 2026-01-27 | 13F | Bayforest Capital Ltd | 0 | -100,00 | 0 | |||||
| 2025-11-14 | 13F | Jain Global LLC | 0 | -100,00 | 0 | |||||
| 2026-02-09 | 13F | Hantz Financial Services, Inc. | 40.186 | -23,46 | 3 | -33,33 | ||||
| 2026-02-17 | 13F | Cetera Investment Advisers | 32.898 | 11,67 | 2.118 | 18,93 | ||||
| 2026-01-21 | 13F | Sound Income Strategies, LLC | 171 | 0,00 | 13 | 33,33 | ||||
| 2025-11-14 | 13F | Wellington Management Group Llp | 0 | -100,00 | 0 | |||||
| 2026-02-13 | 13F | Kestra Advisory Services, LLC | 0 | -100,00 | 0 | |||||
| 2026-02-13 | 13F | Clal Insurance Enterprises Holdings Ltd | 205 | -13,50 | 0 | |||||
| 2026-02-17 | 13F | National Asset Management, Inc. | 0 | -100,00 | 0 | |||||
| 2026-01-29 | 13F | Calamos Advisors LLC | 14.211 | -1,87 | 915 | 4,46 | ||||
| 2026-01-29 | 13F | Calamos Advisors LLC | Call | 22.100 | -50,00 | 1.336 | -46,92 | |||
| 2026-02-10 | 13F | GKV Capital Management Co., Inc. | 34.400 | 37,60 | 2.214 | 46,53 | ||||
| 2025-11-06 | 13F | Whipplewood Advisors, LLC | 0 | -100,00 | 0 | |||||
| 2025-09-26 | NP | UBPIX - Ultralatin America Profund Investor Class | 3.940 | 14,07 | 227 | 43,04 | ||||
| 2026-01-13 | 13F | Stonehage Fleming Financial Services Holdings Ltd | 15.527 | 0,00 | 999 | 6,50 | ||||
| 2026-02-17 | 13F | Symmetry Investments LP | 0 | -100,00 | 0 | |||||
| 2026-01-27 | 13F | Ninety One North America, Inc. | 0 | -100,00 | 0 | -100,00 | ||||
| 2026-02-10 | 13F | Envestnet Asset Management Inc | 180.804 | -12,41 | 11.638 | -6,72 | ||||
| 2025-09-26 | NP | PCEMX - PACE International Emerging Markets Equity Investments Class P | 25.037 | 87,04 | 1.442 | 134,69 | ||||
| 2025-11-12 | 13F | Miura Global Management, LLC | 0 | -100,00 | 0 | -100,00 | ||||
| 2026-02-13 | 13F | Morgan Stanley | 5.064.419 | -2,16 | 325.997 | 4,18 | ||||
| 2026-02-05 | 13F | LGT Group Foundation | 5.970 | 387 | ||||||
| 2026-02-17 | 13F | Delaware Management Holdings, Inc. | 1.096.281 | 70.568 | ||||||
| 2025-09-29 | NP | AIM INVESTMENT FUNDS (INVESCO INVESTMENT FUNDS) - Invesco Oppenheimer Global Allocation Fund Class R | 6.660 | 0,00 | 383 | 25,57 | ||||
| 2026-01-23 | 13F | Ritholtz Wealth Management | 32.755 | -2,12 | 2.108 | 4,25 | ||||
| 2026-02-05 | 13F | L & S Advisors Inc | 33.106 | -0,13 | 2.131 | 6,39 | ||||
| 2026-01-08 | 13F | Grove Bank & Trust | 141 | 0,00 | 9 | 12,50 | ||||
| 2026-01-09 | 13F | Oldfield Partners LLP | 15.631 | -68,91 | 1.006 | -66,90 | ||||
| 2026-02-14 | 13F | Rockefeller Capital Management L.P. | 55.449 | 714,83 | 3.569 | 768,37 | ||||
| 2025-09-29 | NP | CFSSX - Column Small Cap Select Fund | 28.676 | -51,28 | 1.615 | -40,32 | ||||
| 2026-01-26 | 13F | Private Trust Co Na | 280 | 311,76 | 18 | 350,00 | ||||
| 2026-02-17 | 13F | D. E. Shaw & Co., Inc. | Call | 22.600 | 1.455 | |||||
| 2026-01-13 | 13F | Dakota Wealth Management | 14.079 | 1,54 | 906 | 8,11 | ||||
| 2026-02-12 | 13F | Qtron Investments LLC | 0 | -100,00 | 0 | |||||
| 2025-11-19 | 13F | Sunbelt Securities, Inc. | 0 | -100,00 | 0 | |||||
| 2026-02-02 | 13F | Principal Financial Group Inc | 75.702 | 0,00 | 4.873 | 6,47 | ||||
| 2026-02-11 | 13F | MCF Advisors LLC | 50 | 3 | ||||||
| 2025-10-20 | 13F | Shilanski & Associates, Inc. | 9.392 | 1,47 | 568 | 7,79 | ||||
| 2025-11-07 | 13F | CenterBook Partners LP | 0 | -100,00 | 0 | -100,00 | ||||
| 2025-09-25 | NP | DFSE - Dimensional Emerging Markets Sustainability Core 1 ETF | 11.199 | 0,00 | 645 | 25,29 | ||||
| 2026-01-23 | 13F | Westside Investment Management, Inc. | 32 | 2 | ||||||
| 2025-11-05 | 13F | BI Asset Management Fondsmaeglerselskab A/S | 0 | -100,00 | 0 | |||||
| 2026-02-06 | 13F | Global Retirement Partners, LLC | 5.634 | 4.518,03 | 363 | 5.071,43 | ||||
| 2026-02-17 | 13F | Fwl Investment Management, Llc | 171 | 0,00 | 11 | 10,00 | ||||
| 2025-11-06 | 13F | Ameritas Advisory Services, LLC | 0 | -100,00 | 0 | -100,00 | ||||
| 2026-02-06 | 13F | IFP Advisors, Inc | 71 | -15,48 | 5 | -20,00 | ||||
| 2026-02-04 | 13F | D'Orazio & Associates, Inc. | 4.028 | -0,30 | 259 | 6,15 | ||||
| 2026-02-06 | 13F | Wrapmanager Inc | 3.961 | -14,04 | 255 | -8,63 | ||||
| 2026-01-29 | 13F | Aprio Wealth Management, LLC | 5.527 | 0,89 | 356 | 7,25 | ||||
| 2026-02-13 | 13F | First Trust Advisors Lp | 3.965 | 255 | ||||||
| 2026-02-13 | 13F | Marshall Wace, Llp | 144.143 | 9.278 | ||||||
| 2026-02-10 | 13F | Mitchell Capital Management Co | 53.327 | -0,12 | 3.433 | 6,35 | ||||
| 2025-11-07 | 13F | State of New Jersey Common Pension Fund D | 0 | -100,00 | 0 | -100,00 | ||||
| 2025-11-12 | 13F | NewSquare Capital LLC | 0 | -100,00 | 0 | |||||
| 2025-09-26 | NP | REBYX - U.S. Small Cap Equity Fund Class Y | 0 | -100,00 | 0 | -100,00 | ||||
| 2025-09-29 | NP | Calamos Global Total Return Fund | 0 | -100,00 | 0 | -100,00 | ||||
| 2025-09-29 | NP | CNWGX - Calamos Evolving World Growth Fund Class A | 0 | -100,00 | 0 | -100,00 | ||||
| 2026-02-11 | 13F | Dorsey & Whitney Trust CO LLC | 3.998 | -0,79 | 257 | 5,76 | ||||
| 2026-02-13 | 13F | American Century Companies Inc | 3.461.774 | 35,68 | 222.834 | 44,48 | ||||
| 2025-09-29 | NP | Calamos Global Dynamic Income Fund | 0 | -100,00 | 0 | -100,00 | ||||
| 2025-09-29 | NP | CALAMOS INVESTMENT TRUST/IL - Calamos International Small Cap Growth Fund Class C | 0 | -100,00 | 0 | -100,00 | ||||
| 2026-02-13 | 13F | Colony Group, LLC | 0 | -100,00 | 0 | |||||
| 2026-02-13 | 13F | Lord, Abbett & Co. Llc | 445.804 | 29 | ||||||
| 2026-02-10 | 13F | Natixis Advisors, L.p. | 63.016 | -45,97 | 4 | -42,86 | ||||
| 2026-02-11 | 13F | RWC Asset Management LLP | 327.381 | 57,08 | 21.074 | 67,27 | ||||
| 2026-02-10 | 13F | Connor, Clark & Lunn Investment Management Ltd. | 204.789 | -65,67 | 13.182 | -63,45 | ||||
| 2026-02-12 | 13F | Barometer Capital Management Inc. | 0 | -100,00 | 0 | |||||
| 2026-02-02 | 13F | Qrg Capital Management, Inc. | 6.725 | 11,60 | 433 | 18,68 | ||||
| 2026-02-12 | 13F | Federation des caisses Desjardins du Quebec | 1.672 | 1,33 | 108 | 8,08 | ||||
| 2026-02-17 | 13F | Aureus Asset Management, LLC | 24.500 | 172,22 | 1.577 | 189,89 | ||||
| 2025-11-06 | 13F | Aspect Partners, LLC | 0 | -100,00 | 0 | |||||
| 2026-02-11 | 13F | Cerity Partners LLC | 5.925 | 11,02 | 381 | 18,32 | ||||
| 2026-02-13 | 13F | Ubs Oconnor Llc | 0 | -100,00 | 0 | |||||
| 2025-10-30 | 13F | Twin Peaks Wealth Advisors, LLC | 0 | -100,00 | 0 | |||||
| 2025-09-24 | NP | TNVAX - 1290 GAMCO Small/Mid Cap Value Fund Class A | 2.000 | 0,00 | 115 | 26,37 | ||||
| 2026-02-06 | 13F | Bare Financial Services, Inc | 15 | 0,00 | 1 | |||||
| 2026-02-19 | 13F | CI Private Wealth, LLC | 51.335 | -8,47 | 3.304 | -2,54 | ||||
| 2026-02-24 | 13F | Bell Investment Advisors, Inc | 26 | 0,00 | 2 | 0,00 | ||||
| 2026-02-13 | 13F | Centiva Capital, LP | 5.228 | 337 | ||||||
| 2026-02-17 | 13F | Royal Bank Of Canada | 375.639 | -5,39 | 24.180 | 0,75 | ||||
| 2026-02-17 | 13F | Public Employees Retirement System Of Ohio | 114.373 | -4,61 | 7.362 | 1,57 | ||||
| 2025-09-25 | NP | DFA INVESTMENT DIMENSIONS GROUP INC - Emerging Markets Social Core Equity Portfolio Shares | 16.322 | 0,00 | 940 | 25,37 | ||||
| 2026-02-17 | 13F | Balyasny Asset Management Llc | 0 | -100,00 | 0 | |||||
| 2026-01-07 | 13F | Harbour Capital Advisors, LLC | 33.390 | -3,61 | 2.185 | 9,25 | ||||
| 2026-02-13 | 13F | Umb Bank N A/mo | 492 | 0,00 | 32 | 6,90 | ||||
| 2026-02-17 | 13F | Tower Research Capital LLC (TRC) | 164 | -90,39 | 11 | -90,29 |