Grundlæggende statistik
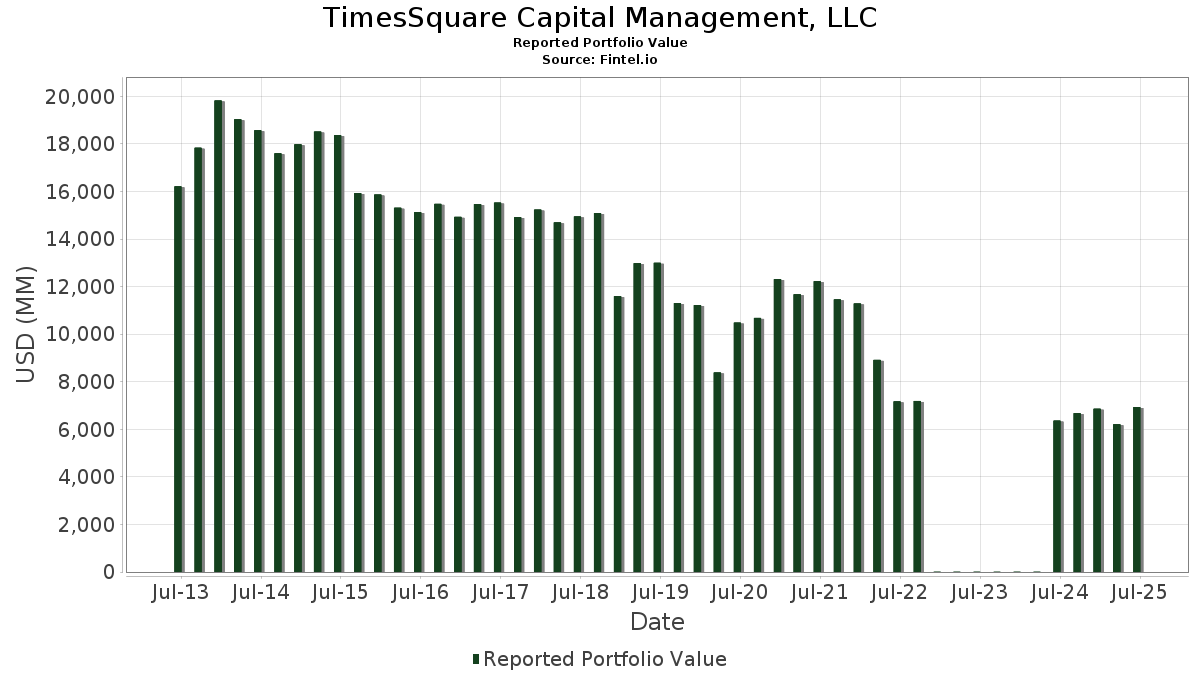
| Porteføljeværdi | $ 6.992.740.314 |
| Nuværende stillinger | 156 |
Seneste beholdninger, ydeevne, AUM (fra 13F, 13D)
TimesSquare Capital Management, LLC har afsløret 156 samlede besiddelser i deres seneste SEC-arkivering. Den seneste porteføljeværdi er beregnet til at være $ 6.992.740.314 USD. Faktiske aktiver under forvaltning (AUM) er denne værdi plus kontanter (som ikke er oplyst). TimesSquare Capital Management, LLCs største beholdninger er EMCOR Group, Inc. (US:EME) , Cencora, Inc. (US:COR) , JFrog Ltd. (US:FROG) , Monolithic Power Systems, Inc. (US:MPWR) , and Veeva Systems Inc. (US:VEEV) . TimesSquare Capital Management, LLCs nye stillinger omfatter NRG Energy, Inc. (US:NRG) , Netskope, Inc. (US:NTSK) , Norwegian Cruise Line Holdings Ltd. (US:NCLH) , James Hardie Industries plc (US:JHX) , and Piper Sandler Companies (US:PIPR) . TimesSquare Capital Management, LLCs topbrancher er "Furniture And Fixtures" (sic 25) , "Motion Pictures and Film" (sic 78) , and "Amusement And Recreation Services" (sic 79) .
Top øger dette kvartal
Vi bruger ændringen i porteføljeallokeringen, fordi dette er den mest meningsfulde metrik. Ændringer kan skyldes handler eller ændringer i aktiekurser.
| Sikkerhed | Aktier (MM) |
Værdi (MM$) |
Portefølje % | ΔPortefølje % |
|---|---|---|---|---|
| KRMN / Karman Holdings Inc. | 1,55 | 111,69 | 1,5972 | 1,3538 |
| NRG / NRG Energy, Inc. | 0,47 | 76,42 | 1,0928 | 1,0928 |
| FLUT / Flutter Entertainment plc | 0,38 | 96,24 | 1,3762 | 0,9801 |
| NTSK / Netskope, Inc. | 2,72 | 61,83 | 0,8843 | 0,8843 |
| CRS / Carpenter Technology Corporation | 0,31 | 75,37 | 1,0779 | 0,8363 |
| NCLH / Norwegian Cruise Line Holdings Ltd. | 1,97 | 48,55 | 0,6942 | 0,6942 |
| SITM / SiTime Corporation | 0,13 | 39,68 | 0,5675 | 0,4946 |
| JHX / James Hardie Industries plc | 1,60 | 30,77 | 0,4400 | 0,4400 |
| PIPR / Piper Sandler Companies | 0,08 | 28,75 | 0,4112 | 0,4112 |
| LSCC / Lattice Semiconductor Corporation | 1,43 | 104,55 | 1,4951 | 0,3738 |
Top falder i dette kvartal
Vi bruger ændringen i porteføljeallokeringen, fordi dette er den mest meningsfulde metrik. Ændringer kan skyldes handler eller ændringer i aktiekurser.
| Sikkerhed | Aktier (MM) |
Værdi (MM$) |
Portefølje % | ΔPortefølje % |
|---|---|---|---|---|
| IT / Gartner, Inc. | 0,08 | 20,77 | 0,2971 | -0,9962 |
| HXL / Hexcel Corporation | 0,34 | 21,05 | 0,3010 | -0,6444 |
| RNR / RenaissanceRe Holdings Ltd. | 0,00 | 0,98 | 0,0140 | -0,6166 |
| VRNA / Verona Pharma plc - Depositary Receipt (Common Stock) | 0,06 | 6,77 | 0,0968 | -0,5764 |
| SAIA / Saia, Inc. | 0,00 | 0,75 | 0,0107 | -0,4686 |
| FIX / Comfort Systems USA, Inc. | 0,00 | 1,36 | 0,0194 | -0,4577 |
| OS / OneStream, Inc. | 2,55 | 46,91 | 0,6709 | -0,4173 |
| INSM / Insmed Incorporated | 0,43 | 61,22 | 0,8754 | -0,3922 |
| HUBS / HubSpot, Inc. | 0,23 | 107,78 | 1,5413 | -0,3818 |
| BJ / BJ's Wholesale Club Holdings, Inc. | 1,08 | 101,12 | 1,4460 | -0,3749 |
13D/G-arkivering
Dette er en liste over 13D- og 13G-arkiveringer lavet i det sidste år (hvis nogen). Klik på linkikonet for at se den fulde transaktionshistorik. Grønne rækker angiver nye positioner. Røde rækker angiver lukkede positioner.
| Fil dato | Form | Sikkerhed | Forrige Aktier |
Nuværende Aktier |
Δandele % | % Ejerskab |
% ΔEjerskab | |
|---|---|---|---|---|---|---|---|---|
| 2025-02-03 | MVBF / MVB Financial Corp. | 550.735 | 924.053 | 67,79 | 7,14 | 65,28 |
13F og Fondsarkivering
Denne formular blev indsendt den 2025-11-07 for rapporteringsperioden 2025-09-30. Klik på linkikonet for at se den fulde transaktionshistorik.
Opgrader for at låse op for premium-data og eksportere til Excel ![]() .
.
| Sikkerhed | Type | Gennemsnitlig aktiekurs | Aktier (MM) |
Δ Aktier (%) |
Værdi ($MM) |
Δ Aktier (%) |
Portefølje (%) |
ΔPortefølje (%) |
|
|---|---|---|---|---|---|---|---|---|---|
| EME / EMCOR Group, Inc. | 0,26 | -5,79 | 171,63 | 14,40 | 2,4544 | 0,2911 | |||
| COR / Cencora, Inc. | 0,44 | -4,78 | 138,64 | -0,76 | 1,9826 | -0,0318 | |||
| FROG / JFrog Ltd. | 2,90 | -14,86 | 137,07 | -8,16 | 1,9601 | -0,1920 | |||
| MPWR / Monolithic Power Systems, Inc. | 0,14 | -4,66 | 129,82 | 20,01 | 1,8565 | 0,2966 | |||
| VEEV / Veeva Systems Inc. | 0,43 | -4,36 | 129,01 | -1,06 | 1,8448 | -0,0353 | |||
| IDXX / IDEXX Laboratories, Inc. | 0,19 | -4,14 | 123,27 | 14,19 | 1,7628 | 0,2061 | |||
| CYBR / CyberArk Software Ltd. | 0,25 | -17,44 | 121,84 | -1,97 | 1,7423 | -0,0497 | |||
| LNG / Cheniere Energy, Inc. | 0,49 | -4,36 | 115,21 | -7,72 | 1,6476 | -0,1527 | |||
| KRMN / Karman Holdings Inc. | 1,55 | 361,68 | 111,69 | 561,80 | 1,5972 | 1,3538 | |||
| HUBS / HubSpot, Inc. | 0,23 | -3,84 | 107,78 | -19,18 | 1,5413 | -0,3818 | |||
| ORLY / O'Reilly Automotive, Inc. | 0,99 | -4,86 | 107,07 | 13,80 | 1,5312 | 0,1745 | |||
| IBKR / Interactive Brokers Group, Inc. | 1,55 | -2,82 | 106,34 | 20,67 | 1,5207 | 0,2500 | |||
| LSCC / Lattice Semiconductor Corporation | 1,43 | -10,17 | 104,55 | 34,45 | 1,4951 | 0,3738 | |||
| RRX / Regal Rexnord Corporation | 0,72 | -15,58 | 103,15 | -16,47 | 1,4751 | -0,3055 | |||
| BJ / BJ's Wholesale Club Holdings, Inc. | 1,08 | -7,41 | 101,12 | -19,93 | 1,4460 | -0,3749 | |||
| TPG / TPG Inc. | 1,71 | -8,77 | 98,04 | -0,08 | 1,4020 | -0,0127 | |||
| HOOD / Robinhood Markets, Inc. | 0,68 | -33,93 | 97,56 | 1,04 | 1,3951 | 0,0028 | |||
| VRSK / Verisk Analytics, Inc. | 0,38 | 0,36 | 96,27 | -18,97 | 1,3767 | -0,3365 | |||
| FLUT / Flutter Entertainment plc | 0,38 | 294,08 | 96,24 | 250,29 | 1,3762 | 0,9801 | |||
| DASH / DoorDash, Inc. | 0,35 | -4,23 | 95,22 | 5,67 | 1,3617 | 0,0623 | |||
| CW / Curtiss-Wright Corporation | 0,17 | -3,67 | 94,23 | 7,05 | 1,3475 | 0,0783 | |||
| ARGX / argenx SE - Depositary Receipt (Common Stock) | 0,13 | -4,53 | 94,06 | 27,75 | 1,3451 | 0,2834 | |||
| TTAN / ServiceTitan, Inc. | 0,91 | 6,50 | 91,32 | 0,19 | 1,3060 | -0,0084 | |||
| AXON / Axon Enterprise, Inc. | 0,12 | -4,20 | 88,49 | -16,97 | 1,2654 | -0,2712 | |||
| STVN / Stevanato Group S.p.A. | 3,27 | -1,74 | 84,14 | 3,57 | 1,2033 | 0,0318 | |||
| ROST / Ross Stores, Inc. | 0,53 | 2,38 | 81,41 | 22,28 | 1,1643 | 0,2042 | |||
| CTAS / Cintas Corporation | 0,39 | -4,64 | 79,82 | -12,17 | 1,1415 | -0,1690 | |||
| ESAB / ESAB Corporation | 0,70 | -6,80 | 77,80 | -13,61 | 1,1126 | -0,1860 | |||
| NRG / NRG Energy, Inc. | 0,47 | 76,42 | 1,0928 | 1,0928 | |||||
| CRS / Carpenter Technology Corporation | 0,31 | 406,37 | 75,37 | 349,88 | 1,0779 | 0,8363 | |||
| TSCO / Tractor Supply Company | 1,28 | -5,71 | 72,97 | 1,62 | 1,0435 | 0,0081 | |||
| LOAR / Loar Holdings Inc. | 0,91 | 16,78 | 72,57 | 8,42 | 1,0378 | 0,0726 | |||
| WH / Wyndham Hotels & Resorts, Inc. | 0,89 | 2,43 | 70,74 | 0,78 | 1,0116 | -0,0005 | |||
| APP / AppLovin Corporation | 0,10 | -62,26 | 70,42 | -22,53 | 1,0071 | -0,3037 | |||
| PFGC / Performance Food Group Company | 0,66 | -4,02 | 68,91 | 14,16 | 0,9855 | 0,1151 | |||
| PINS / Pinterest, Inc. | 2,13 | -3,84 | 68,43 | -13,73 | 0,9787 | -0,1652 | |||
| CSGP / CoStar Group, Inc. | 0,81 | -0,45 | 68,05 | 4,46 | 0,9731 | 0,0338 | |||
| DT / Dynatrace, Inc. | 1,32 | -4,54 | 63,99 | -16,23 | 0,9151 | -0,1864 | |||
| NTSK / Netskope, Inc. | 2,72 | 61,83 | 0,8843 | 0,8843 | |||||
| INSM / Insmed Incorporated | 0,43 | -51,33 | 61,22 | -30,36 | 0,8754 | -0,3922 | |||
| MLM / Martin Marietta Materials, Inc. | 0,10 | -10,93 | 60,32 | 2,27 | 0,8626 | 0,0121 | |||
| TRMB / Trimble Inc. | 0,72 | -4,36 | 59,20 | 2,77 | 0,8465 | 0,0160 | |||
| ALL / The Allstate Corporation | 0,27 | -23,53 | 58,48 | -18,46 | 0,8363 | -0,1979 | |||
| CWST / Casella Waste Systems, Inc. | 0,61 | 21,58 | 57,80 | -0,02 | 0,8266 | -0,0070 | |||
| ESTC / Elastic N.V. | 0,67 | 5,54 | 56,79 | 5,74 | 0,8122 | 0,0377 | |||
| TYL / Tyler Technologies, Inc. | 0,10 | -4,34 | 54,30 | -15,58 | 0,7765 | -0,1510 | |||
| GFL / GFL Environmental Inc. | 1,09 | 5,72 | 51,55 | -0,73 | 0,7372 | -0,0116 | |||
| APH / Amphenol Corporation | 0,41 | -4,97 | 50,64 | 19,09 | 0,7241 | 0,1110 | |||
| IOT / Samsara Inc. | 1,36 | -5,16 | 50,57 | -11,19 | 0,7232 | -0,0979 | |||
| BSY / Bentley Systems, Incorporated | 0,98 | -7,37 | 50,52 | -11,65 | 0,7225 | -0,1020 | |||
| MRVL / Marvell Technology, Inc. | 0,60 | -3,85 | 50,46 | 4,44 | 0,7216 | 0,0249 | |||
| EVR / Evercore Inc. | 0,15 | 41,14 | 50,15 | 76,31 | 0,7172 | 0,3071 | |||
| FICO / Fair Isaac Corporation | 0,03 | 41,34 | 49,63 | 15,71 | 0,7097 | 0,0913 | |||
| ADUS / Addus HomeCare Corporation | 0,42 | 6,17 | 49,36 | 8,75 | 0,7059 | 0,0514 | |||
| VCTR / Victory Capital Holdings, Inc. | 0,76 | -2,41 | 49,19 | -0,74 | 0,7034 | -0,0112 | |||
| NCLH / Norwegian Cruise Line Holdings Ltd. | 1,97 | 48,55 | 0,6942 | 0,6942 | |||||
| RGEN / Repligen Corporation | 0,36 | 50,74 | 48,41 | 62,00 | 0,6922 | 0,2614 | |||
| TTWO / Take-Two Interactive Software, Inc. | 0,19 | -4,21 | 48,38 | 1,91 | 0,6919 | 0,0073 | |||
| JBTM / JBT Marel Corporation | 0,34 | -0,87 | 47,11 | 15,77 | 0,6737 | 0,0869 | |||
| OS / OneStream, Inc. | 2,55 | -4,54 | 46,91 | -37,84 | 0,6709 | -0,4173 | |||
| AME / AMETEK, Inc. | 0,25 | -4,57 | 46,63 | -0,86 | 0,6669 | -0,0114 | |||
| WCN / Waste Connections, Inc. | 0,26 | -14,86 | 46,11 | -19,84 | 0,6594 | -0,1701 | |||
| EHC / Encompass Health Corporation | 0,36 | 7,19 | 46,06 | 11,03 | 0,6587 | 0,0605 | |||
| BRO / Brown & Brown, Inc. | 0,49 | 8,90 | 45,92 | -7,87 | 0,6566 | -0,0620 | |||
| WK / Workiva Inc. | 0,51 | 11,73 | 44,20 | 40,51 | 0,6321 | 0,1785 | |||
| NICE / NICE Ltd. - Depositary Receipt (Common Stock) | 0,29 | -5,02 | 42,63 | -18,59 | 0,6096 | -0,1454 | |||
| HLNE / Hamilton Lane Incorporated | 0,31 | 5,67 | 42,21 | 0,22 | 0,6036 | -0,0037 | |||
| SITM / SiTime Corporation | 0,13 | 455,23 | 39,68 | 685,16 | 0,5675 | 0,4946 | |||
| TRGP / Targa Resources Corp. | 0,23 | -25,68 | 39,27 | -28,47 | 0,5616 | -0,2300 | |||
| ITT / ITT Inc. | 0,21 | -5,95 | 36,74 | 7,20 | 0,5253 | 0,0312 | |||
| CRDO / Credo Technology Group Holding Ltd | 0,25 | -29,09 | 36,45 | 11,51 | 0,5212 | 0,0499 | |||
| FND / Floor & Decor Holdings, Inc. | 0,49 | -4,17 | 35,92 | -7,02 | 0,5137 | -0,0434 | |||
| SAFT / Safety Insurance Group, Inc. | 0,50 | -9,48 | 35,36 | -19,40 | 0,5057 | -0,1270 | |||
| POOL / Pool Corporation | 0,11 | -40,48 | 33,62 | -36,69 | 0,4808 | -0,2849 | |||
| CSL / Carlisle Companies Incorporated | 0,10 | -17,99 | 33,25 | -27,75 | 0,4755 | -0,1881 | |||
| VVV / Valvoline Inc. | 0,92 | 3,16 | 33,13 | -2,18 | 0,4737 | -0,0146 | |||
| MYRG / MYR Group Inc. | 0,16 | 1,40 | 32,55 | 16,25 | 0,4654 | 0,0617 | |||
| KTOS / Kratos Defense & Security Solutions, Inc. | 0,35 | -49,53 | 31,84 | -0,72 | 0,4554 | -0,0071 | |||
| JHX / James Hardie Industries plc | 1,60 | 30,77 | 0,4400 | 0,4400 | |||||
| CHEF / The Chefs' Warehouse, Inc. | 0,52 | 19,00 | 30,60 | 8,78 | 0,4376 | 0,0320 | |||
| EFX / Equifax Inc. | 0,12 | -4,42 | 30,47 | -5,46 | 0,4357 | -0,0290 | |||
| PRSU / Pursuit Attractions and Hospitality, Inc. | 0,84 | 90,90 | 30,38 | 139,58 | 0,4344 | 0,2516 | |||
| PR / Permian Resources Corporation | 2,36 | -28,22 | 30,20 | -32,54 | 0,4319 | -0,2136 | |||
| MTSI / MACOM Technology Solutions Holdings, Inc. | 0,24 | 31,27 | 29,52 | 14,05 | 0,4221 | 0,0489 | |||
| WSO / Watsco, Inc. | 0,07 | -3,92 | 29,08 | -12,04 | 0,4158 | -0,0609 | |||
| BOOT / Boot Barn Holdings, Inc. | 0,17 | 0,94 | 28,98 | 10,06 | 0,4145 | 0,0347 | |||
| PIPR / Piper Sandler Companies | 0,08 | 28,75 | 0,4112 | 0,4112 | |||||
| PSN / Parsons Corporation | 0,35 | 9,87 | 28,62 | 26,93 | 0,4092 | 0,0842 | |||
| QTWO / Q2 Holdings, Inc. | 0,39 | 5,98 | 27,88 | -18,03 | 0,3987 | -0,0917 | |||
| WRBY / Warby Parker Inc. | 1,01 | -8,43 | 27,82 | 15,16 | 0,3978 | 0,0495 | |||
| ONTO / Onto Innovation Inc. | 0,21 | 79,38 | 27,70 | 129,66 | 0,3961 | 0,2222 | |||
| RBC / RBC Bearings Incorporated | 0,07 | 0,23 | 27,58 | 1,67 | 0,3944 | 0,0032 | |||
| VERX / Vertex, Inc. | 1,09 | 2,19 | 27,05 | -28,30 | 0,3869 | -0,1572 | |||
| ROAD / Construction Partners, Inc. | 0,21 | -16,43 | 26,42 | -0,13 | 0,3778 | -0,0037 | |||
| VCEL / Vericel Corporation | 0,84 | 12,57 | 26,34 | -16,74 | 0,3766 | -0,0795 | |||
| BRZE / Braze, Inc. | 0,91 | 80,83 | 25,75 | 83,03 | 0,3683 | 0,1654 | |||
| SLNO / Soleno Therapeutics, Inc. | 0,38 | 52,63 | 25,52 | 23,16 | 0,3650 | 0,0662 | |||
| SNOW / Snowflake Inc. | 0,11 | 25,38 | 0,3629 | 0,3629 | |||||
| AIT / Applied Industrial Technologies, Inc. | 0,10 | 11,96 | 25,26 | 25,74 | 0,3613 | 0,0716 | |||
| CWAN / Clearwater Analytics Holdings, Inc. | 1,38 | 1,31 | 24,84 | -16,75 | 0,3552 | -0,0750 | |||
| NAMS / NewAmsterdam Pharma Company N.V. | 0,84 | -4,03 | 23,81 | 50,71 | 0,3406 | 0,1127 | |||
| PAY / Paymentus Holdings, Inc. | 0,77 | -0,90 | 23,70 | -7,40 | 0,3390 | -0,0301 | |||
| MIR / Mirion Technologies, Inc. | 1,01 | 23,57 | 0,3371 | 0,3371 | |||||
| PJT / PJT Partners Inc. | 0,13 | -5,73 | 23,45 | 1,54 | 0,3353 | 0,0023 | |||
| EE / Excelerate Energy, Inc. | 0,92 | 29,00 | 23,28 | 10,83 | 0,3329 | 0,0300 | |||
| GRDN / Guardian Pharmacy Services, Inc. | 0,86 | 5,64 | 22,56 | 30,03 | 0,3227 | 0,0725 | |||
| XENE / Xenon Pharmaceuticals Inc. | 0,56 | -2,53 | 22,36 | 25,03 | 0,3197 | 0,0619 | |||
| OLLI / Ollie's Bargain Outlet Holdings, Inc. | 0,17 | -3,57 | 22,16 | -6,05 | 0,3169 | -0,0232 | |||
| MIRM / Mirum Pharmaceuticals, Inc. | 0,30 | 22,04 | 0,3152 | 0,3152 | |||||
| GTLS / Chart Industries, Inc. | 0,11 | -18,09 | 21,97 | -0,43 | 0,3142 | -0,0040 | |||
| AMPL / Amplitude, Inc. | 2,04 | 21,92 | 0,3135 | 0,3135 | |||||
| ACVA / ACV Auctions Inc. | 2,21 | -5,98 | 21,89 | -42,56 | 0,3130 | -0,2364 | |||
| BFAM / Bright Horizons Family Solutions Inc. | 0,20 | 16,79 | 21,77 | 2,60 | 0,3113 | 0,0054 | |||
| NSA / National Storage Affiliates Trust | 0,71 | -6,17 | 21,58 | -11,36 | 0,3085 | -0,0425 | |||
| HXL / Hexcel Corporation | 0,34 | -71,08 | 21,05 | -67,90 | 0,3010 | -0,6444 | |||
| KRYS / Krystal Biotech, Inc. | 0,12 | 3,77 | 20,92 | 33,27 | 0,2992 | 0,0728 | |||
| INTA / Intapp, Inc. | 0,51 | -0,58 | 20,87 | -21,22 | 0,2985 | -0,0836 | |||
| IT / Gartner, Inc. | 0,08 | -64,39 | 20,77 | -76,84 | 0,2971 | -0,9962 | |||
| CGON / CG Oncology, Inc. | 0,50 | -1,69 | 20,28 | 52,30 | 0,2900 | 0,0980 | |||
| PCTY / Paylocity Holding Corporation | 0,13 | -37,78 | 19,98 | -45,31 | 0,2858 | -0,2411 | |||
| GLBE / Global-E Online Ltd. | 0,55 | -0,08 | 19,69 | 6,53 | 0,2815 | 0,0151 | |||
| LGN / Legence Corp. | 0,63 | 19,52 | 0,2792 | 0,2792 | |||||
| CRWD / CrowdStrike Holdings, Inc. | 0,04 | -49,26 | 19,45 | -51,15 | 0,2781 | -0,2959 | |||
| ERJ / Embraer S.A. - Depositary Receipt (Common Stock) | 0,31 | -25,53 | 18,53 | -20,90 | 0,2650 | -0,0728 | |||
| PAR / PAR Technology Corporation | 0,46 | -0,99 | 18,22 | -43,51 | 0,2606 | -0,2045 | |||
| UNF / UniFirst Corporation | 0,11 | 18,18 | 0,2599 | 0,2599 | |||||
| MTDR / Matador Resources Company | 0,39 | 1,18 | 17,67 | -4,73 | 0,2527 | -0,0148 | |||
| WSC / WillScot Holdings Corporation | 0,82 | 0,10 | 17,24 | -22,88 | 0,2465 | -0,0758 | |||
| TTEK / Tetra Tech, Inc. | 0,50 | -52,76 | 16,52 | -56,15 | 0,2363 | -0,3070 | |||
| IWO / iShares Trust - iShares Russell 2000 Growth ETF | 0,05 | -39,88 | 16,35 | -32,69 | 0,2339 | -0,1165 | |||
| UEC / Uranium Energy Corp. | 1,22 | 16,23 | 0,2321 | 0,2321 | |||||
| TARS / Tarsus Pharmaceuticals, Inc. | 0,27 | 15,90 | 0,2273 | 0,2273 | |||||
| MRUS / Merus N.V. | 0,17 | -31,60 | 15,63 | 22,44 | 0,2235 | 0,0394 | |||
| BE / Bloom Energy Corporation | 0,18 | 14,81 | 0,2117 | 0,2117 | |||||
| NVMI / Nova Ltd. | 0,04 | -17,79 | 12,65 | -4,51 | 0,1809 | -0,0101 | |||
| IRON / Disc Medicine, Inc. | 0,18 | 12,04 | 0,1721 | 0,1721 | |||||
| IRTC / iRhythm Technologies, Inc. | 0,07 | -6,06 | 11,58 | 4,94 | 0,1656 | 0,0065 | |||
| CLBT / Cellebrite DI Ltd. | 0,61 | 11,22 | 0,1604 | 0,1604 | |||||
| ABVX / ABIVAX Société Anonyme - Depositary Receipt (Common Stock) | 0,13 | 10,87 | 0,1554 | 0,1554 | |||||
| INR / Infinity Natural Resources, Inc. | 0,82 | -6,63 | 10,81 | -33,15 | 0,1547 | -0,0786 | |||
| WHD / Cactus, Inc. | 0,26 | -1,16 | 10,25 | -10,77 | 0,1466 | -0,0191 | |||
| CBLL / CeriBell, Inc. | 0,82 | 2,60 | 9,39 | -37,06 | 0,1343 | -0,0809 | |||
| ASGN / ASGN Incorporated | 0,20 | -5,51 | 9,28 | -10,40 | 0,1327 | -0,0166 | |||
| NIQ / NIQ Global Intelligence plc | 0,59 | 9,25 | 0,1323 | 0,1323 | |||||
| STRL / Sterling Infrastructure, Inc. | 0,02 | 8,02 | 0,1146 | 0,1146 | |||||
| VRNA / Verona Pharma plc - Depositary Receipt (Common Stock) | 0,06 | -87,15 | 6,77 | -85,50 | 0,0968 | -0,5764 | |||
| SI / Shoulder Innovations, Inc. | 0,38 | 4,80 | 0,0686 | 0,0686 | |||||
| ARCO / Arcos Dorados Holdings Inc. | 0,66 | -24,83 | 4,43 | -35,69 | 0,0634 | -0,0360 | |||
| WING / Wingstop Inc. | 0,01 | 2,32 | 0,0332 | 0,0332 | |||||
| CLH / Clean Harbors, Inc. | 0,01 | 0,00 | 1,57 | 0,45 | 0,0225 | -0,0001 | |||
| FIX / Comfort Systems USA, Inc. | 0,00 | -97,33 | 1,36 | -95,90 | 0,0194 | -0,4577 | |||
| WBS / Webster Financial Corporation | 0,02 | 0,27 | 1,35 | 9,08 | 0,0193 | 0,0015 | |||
| RNR / RenaissanceRe Holdings Ltd. | 0,00 | -97,86 | 0,98 | -97,77 | 0,0140 | -0,6166 | |||
| SAIA / Saia, Inc. | 0,00 | -97,93 | 0,75 | -97,74 | 0,0107 | -0,4686 | |||
| VIA / Via Transportation, Inc. | 0,01 | 0,72 | 0,0102 | 0,0102 | |||||
| WCC / WESCO International, Inc. | 0,00 | 33,33 | 0,01 | 60,00 | 0,0001 | 0,0000 | |||
| ALAB / Astera Labs, Inc. | 0,00 | -100,00 | 0,00 | 0,0000 | |||||
| FRPT / Freshpet, Inc. | 0,00 | -100,00 | 0,00 | 0,0000 | |||||
| XYZ / Block, Inc. | 0,00 | -100,00 | 0,00 | 0,0000 | |||||
| EXPO / Exponent, Inc. | 0,00 | -100,00 | 0,00 | 0,0000 | |||||
| MGY / Magnolia Oil & Gas Corporation | 0,00 | -100,00 | 0,00 | 0,0000 | |||||
| JAMES HARDIE INDS PLC / SPONSORED ADR (47030M106) | 0,00 | -100,00 | 0,00 | 0,0000 | |||||
| MVBF / MVB Financial Corp. | 0,00 | -100,00 | 0,00 | 0,0000 | |||||
| AZEK / The AZEK Company Inc. | 0,00 | -100,00 | 0,00 | 0,0000 | |||||
| INSP / Inspire Medical Systems, Inc. | 0,00 | -100,00 | 0,00 | 0,0000 | |||||
| RPM / RPM International Inc. | 0,00 | -100,00 | 0,00 | 0,0000 | |||||
| FTAI / FTAI Aviation Ltd. | 0,00 | -100,00 | 0,00 | 0,0000 |