Grundlæggende statistik
| Institutionelle ejere | 428 total, 384 long only, 5 short only, 39 long/short - change of 2,66% MRQ |
| Gennemsnitlig porteføljeallokering | 0.6525 % - change of 15,44% MRQ |
| Institutionelle aktier (lange) | 206.254.003 (ex 13D/G) - change of 1,29MM shares 1,49% MRQ |
| Institutionel værdi (lang) | $ 7.839.106 USD ($1000) |
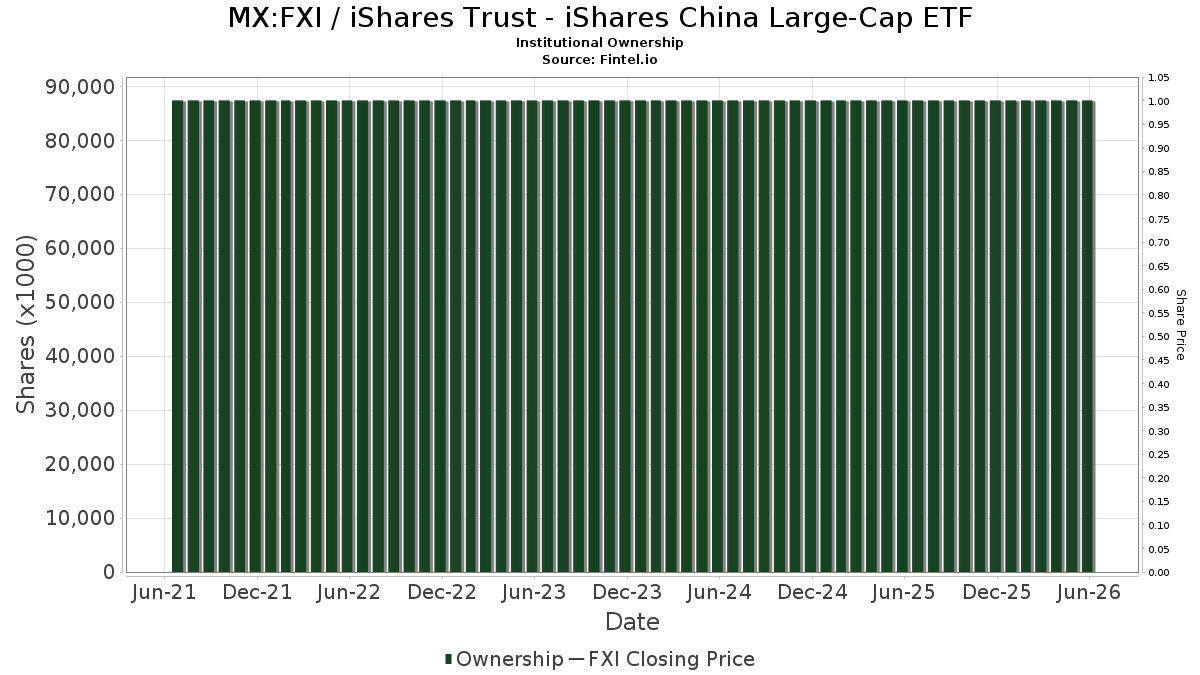
Institutionelt ejerskab og aktionærer
iShares Trust - iShares China Large-Cap ETF (MX:FXI) har 428 institutionelle ejere og aktionærer, der har indsendt 13D/G- eller 13F-formularer til Securities Exchange Commission (SEC). Disse institutioner har i alt 206,288,372 aktier. Største aktionærer omfatter Morgan Stanley, Goldman Sachs Group Inc, Barclays Plc, UBS Group AG, Goldman Sachs Group Inc, YINN - Direxion Daily FTSE China Bull 3X Shares, Citadel Advisors Llc, Susquehanna International Group, Llp, Rafferty Asset Management, LLC, and Citadel Advisors Llc .
iShares Trust - iShares China Large-Cap ETF (BMV:FXI) institutionel ejerskabsstruktur viser aktuelle positioner i virksomheden efter institutioner og fonde, samt seneste ændringer i positionsstørrelse. Større aktionærer kan omfatte individuelle investorer, investeringsforeninger, hedgefonde eller institutioner. Skema 13D angiver, at investoren besidder (eller besidder) mere end 5 % af virksomheden og har til hensigt (eller har til hensigt at) aktivt at forfølge en ændring i forretningsstrategi. Skema 13G indikerer en passiv investering på over 5%.
Fondens stemningsscore
Fund Sentiment Score (fka Ownership Accumulation Score) finder de aktier, der bliver mest købt af fonde. Det er resultatet af en sofistikeret, multi-faktor kvantitativ model, der identificerer virksomheder med de højeste niveauer af institutionel akkumulering. Scoringsmodellen bruger en kombination af den samlede stigning i oplyste ejere, ændringerne i porteføljeallokeringer i disse ejere og andre målinger. Tallet går fra 0 til 100, hvor højere tal indikerer et højere niveau af akkumulering for sine jævnaldrende, og 50 er gennemsnittet.
Opdateringsfrekvens: Dagligt
Se Ownership Explorer, som giver en liste over højest rangerende virksomheder.
AI+ Ask Fintel’s AI assistant about iShares Trust - iShares China Large-Cap ETF.
Select a question to share a public post with an AI-crafted answer.
Thinking of good questions…
13F og NPORT arkivering
Detaljer om 13F-arkivering er gratis. Detaljer om NP-ansøgninger kræver et premium-medlemskab. Grønne rækker angiver nye positioner. Røde rækker angiver lukkede positioner. Klik på linket ikon for at se den fulde transaktionshistorik.
Opgrader
for at låse premium-data op og eksportere til Excel ![]() .
.
| Fil dato | Kilde | Investor | Type | Gennemsnitlig pris (Øst) |
Aktier | Δ Aktier (%) |
Rapporteret Værdi ($1000) |
Δ Værdi (%) |
Port Alloc (%) |
|
|---|---|---|---|---|---|---|---|---|---|---|
| 2025-11-13 | 13F | Renaissance Technologies Llc | 295.000 | 150,85 | 12.136 | 180,80 | ||||
| 2025-11-14 | 13F | Ratan Capital Management LP | 15.000 | 0,00 | 617 | -88,81 | ||||
| 2025-08-28 | NP | RQEAX - RESQ Dynamic Allocation Fund RESQ Dynamic Allocation Class A Shares | 77.400 | 0,00 | 2.845 | 2,56 | ||||
| 2025-08-14 | 13F | Soros Fund Management Llc | 0 | -100,00 | 0 | -100,00 | ||||
| 2025-11-14 | 13F | Old Mission Capital Llc | Put | 167.700 | -47,30 | 37 | -87,41 | |||
| 2025-08-14 | 13F | Shay Capital LLC | Call | 0 | -100,00 | 0 | ||||
| 2026-01-22 | 13F | HHM Wealth Advisors, LLC | 2.700 | 0,00 | 103 | -7,21 | ||||
| 2025-11-10 | 13F | Bleakley Financial Group, LLC | 11.336 | 12,45 | 466 | 25,95 | ||||
| 2025-11-03 | 13F | Golden State Wealth Management, LLC | 1.825 | 0,00 | 75 | 11,94 | ||||
| 2025-11-10 | 13F | Waratah Capital Advisors Ltd. | Call | 0 | -100,00 | 0 | -100,00 | |||
| 2026-01-16 | 13F | Pictet North America Advisors SA | 36.825 | 32,58 | 1.410 | 23,47 | ||||
| 2026-01-12 | 13F | AllSquare Wealth Management LLC | 2.315 | 0,00 | 95 | 11,76 | ||||
| 2025-08-14 | 13F | Soros Fund Management Llc | Put | 0 | -100,00 | 0 | -100,00 | |||
| 2025-10-21 | 13F | Strait & Sound Wealth Management LLC | 34.947 | 3,35 | 1.438 | 15,61 | ||||
| 2025-08-13 | 13F | Cary Street Partners Financial Llc | 0 | -100,00 | 0 | -100,00 | ||||
| 2025-10-28 | 13F | Gould Asset Management Llc /ca/ | 9.234 | 0,00 | 380 | 11,80 | ||||
| 2025-08-07 | 13F | Marathon Trading Investment Management LLC | 0 | -100,00 | 0 | -100,00 | ||||
| 2025-11-12 | 13F | Cambridge Investment Research Advisors, Inc. | 34.904 | 4,44 | 1 | 0,00 | ||||
| 2025-11-07 | 13F | Rothschild Investment Llc | 637 | 0,31 | 26 | 13,04 | ||||
| 2025-11-10 | 13F | Adviser Investments LLC | 27.950 | 0,00 | 1.150 | 11,88 | ||||
| 2025-11-10 | 13F | Mivtachim The Workers Social Insurance Fund Ltd. (Under Special Management) | 937.000 | 0,00 | 38.548 | 113.276,47 | ||||
| 2025-11-14 | 13F | Federation des caisses Desjardins du Quebec | 423.796 | 14,86 | 17.435 | 28,54 | ||||
| 2025-08-05 | 13F | Allstate Corp | 0 | -100,00 | 0 | -100,00 | ||||
| 2025-08-13 | 13F | Centiva Capital, LP | Call | 0 | -100,00 | 0 | -100,00 | |||
| 2025-10-01 | 13F | Caldwell Trust Co | 0 | -100,00 | 0 | -100,00 | ||||
| 2025-11-14 | 13F | Qube Research & Technologies Ltd | Call | 5.500.000 | 226.270 | |||||
| 2025-11-14 | 13F | Qube Research & Technologies Ltd | Put | 200.000 | 8.228 | |||||
| 2025-08-12 | 13F | Proequities, Inc. | 0 | 0 | ||||||
| 2026-01-14 | 13F | Redhawk Wealth Advisors, Inc. | 16.272 | -91,93 | 623 | -92,49 | ||||
| 2025-11-14 | 13F | Qube Research & Technologies Ltd | 3.186.944 | -43,84 | 131.111 | -37,15 | ||||
| 2025-11-24 | 13F | CIBC Private Wealth Group, LLC | 5.482 | 14,88 | 226 | 28,57 | ||||
| 2025-11-04 | 13F | Centric Wealth Management | 6.320 | -0,22 | 251 | 5,04 | ||||
| 2025-11-14 | 13F | Old Mission Capital Llc | Call | 103.700 | -24,36 | 158 | 12,95 | |||
| 2025-11-14 | 13F | Old Mission Capital Llc | 3.329.302 | 136.967 | ||||||
| 2025-10-21 | 13F | Global Retirement Partners, LLC | 76.969 | -0,16 | 3.167 | 11,75 | ||||
| 2025-11-20 | 13F/A | BRYN MAWR TRUST Co | 4.724 | 7,29 | 194 | 20,50 | ||||
| 2025-11-13 | 13F | Hsbc Holdings Plc | 17.441 | -2,24 | 722 | 10,75 | ||||
| 2025-11-14 | 13F | Squarepoint Ops LLC | Put | 5.098.300 | 8,53 | 209.744 | 21,46 | |||
| 2025-10-22 | 13F | Washington Growth Strategies Llc | 47.961 | 0,00 | 1.973 | 197.200,00 | ||||
| 2025-11-14 | 13F | Dauntless Investment Group, LLC | Call | 75.700 | 3.114 | |||||
| 2025-11-14 | 13F | Susquehanna International Group, Llp | Call | 14.261.400 | 45,47 | 586.714 | 62,80 | |||
| 2025-10-31 | 13F | Y-Intercept (Hong Kong) Ltd | 108.881 | 4.479 | ||||||
| 2025-11-14 | 13F | Susquehanna International Group, Llp | Put | 8.138.600 | -2,00 | 334.822 | 9,68 | |||
| 2025-11-14 | 13F | Squarepoint Ops LLC | Call | 5.295.100 | 60,39 | 217.840 | 79,51 | |||
| 2025-11-14 | 13F | Susquehanna International Group, Llp | 675.143 | -72,28 | 27.775 | -68,97 | ||||
| 2025-08-05 | 13F | Simplex Trading, Llc | 0 | -100,00 | 0 | -100,00 | ||||
| 2025-11-14 | 13F | Sig Brokerage, Lp | Put | 0 | -100,00 | 0 | -100,00 | |||
| 2025-11-14 | 13F | National Bank Of Canada /fi/ | 107.563 | -17,52 | 4.425 | -7,68 | ||||
| 2025-11-13 | 13F | BTG Pactual Asset Management US LLC | 5.667 | 233 | ||||||
| 2025-11-14 | 13F | Whitebox Advisors Llc | Put | 0 | -100,00 | 0 | -100,00 | |||
| 2025-08-29 | NP | CGHIX - Timber Point Global Allocations Fund Institutional Class Shares | 15.000 | -40,00 | 551 | -38,50 | ||||
| 2025-08-13 | 13F | EverSource Wealth Advisors, LLC | 0 | -100,00 | 0 | -100,00 | ||||
| 2025-11-04 | 13F | Morling Financial Advisors, LLC | 60 | 0,00 | 2 | 0,00 | ||||
| 2025-11-13 | 13F | Van Eck Associates Corp | 139 | -40,09 | 0 | |||||
| 2026-01-20 | 13F | Nvwm, Llc | 120 | 0,00 | 5 | 0,00 | ||||
| 2025-10-30 | 13F | Millstone Evans Group, LLC | 1.564 | 0,00 | 64 | 12,28 | ||||
| 2025-11-12 | 13F | American Wealth Advisors, LLC | 1.632 | 67 | ||||||
| 2025-11-12 | 13F | Battery Global Advisors, LLC | 214 | 0,00 | 9 | 14,29 | ||||
| 2025-11-04 | 13F | IMC-Chicago, LLC | 0 | -100,00 | 0 | -100,00 | ||||
| 2025-11-12 | 13F | Ci Investments Inc. | 6.796.567 | -31,26 | 280 | -23,14 | ||||
| 2025-08-14 | 13F | Macquarie Group Ltd | 0 | -100,00 | 0 | -100,00 | ||||
| 2025-11-13 | 13F | Banque Cantonale Vaudoise | 1.078 | 0 | ||||||
| 2025-11-14 | 13F | Royal Bank Of Canada | Put | 2.875.200 | 69,11 | 118.286 | 89,26 | |||
| 2025-11-04 | 13F | Strengthening Families & Communities, LLC | 150 | 6 | ||||||
| 2025-11-14 | 13F | Royal Bank Of Canada | 985.305 | -17,84 | 40.535 | -8,05 | ||||
| 2025-11-14 | 13F | Royal Bank Of Canada | Call | 1.500.200 | -11,76 | 61.718 | -1,25 | |||
| 2025-11-14 | 13F | Squarepoint Ops LLC | 262.163 | 163,02 | 10.785 | 194,43 | ||||
| 2025-11-05 | 13F | Envestnet Asset Management Inc | 52.708 | 11,42 | 2.168 | 24,74 | ||||
| 2025-11-12 | 13F | Principal Securities, Inc. | 1.037 | 0,00 | 43 | 10,53 | ||||
| 2026-01-14 | 13F | ORG Partners LLC | 6.000 | 230 | ||||||
| 2025-11-14 | 13F | BlueCrest Capital Management Ltd | 27.000 | 1.111 | ||||||
| 2025-11-14 | 13F | BLKBRD Asset Management, LP | 655.935 | 135,60 | 26.985 | 163,68 | ||||
| 2025-11-20 | 13F | Asset Dedication, LLC | 1.350 | 0,00 | 56 | 12,24 | ||||
| 2025-10-14 | 13F | BigSur Wealth Management LLC | 14.575 | 0,00 | 600 | 11,96 | ||||
| 2025-11-14 | 13F | Walleye Capital LLC | 18.000 | 35,34 | 741 | 51,64 | ||||
| 2025-11-13 | 13F | Nearwater Capital Markets, Ltd | 940.000 | -45,98 | 38.672 | -39,54 | ||||
| 2025-11-14 | 13F | LMR Partners LLP | Call | 0 | -100,00 | 0 | -100,00 | |||
| 2025-11-14 | 13F | SIH Partners, LLLP | 380.075 | -70,54 | 15.636 | -67,03 | ||||
| 2025-11-14 | 13F | Evelyn Partners Investment Management (Europe) Ltd | 3.460 | 0,00 | 142 | 11,81 | ||||
| 2025-11-14 | 13F | Tower Research Capital LLC (TRC) | 464 | -90,80 | 19 | -89,73 | ||||
| 2025-11-04 | 13F | Jones Financial Companies Lllp | 18.389 | 66,79 | 742 | 82,96 | ||||
| 2025-10-08 | 13F | Hedges Asset Management LLC | 11.400 | 0,00 | 469 | 11,69 | ||||
| 2025-11-14 | 13F | LMR Partners LLP | Put | 0 | -100,00 | 0 | -100,00 | |||
| 2025-11-17 | 13F | Great West Life Assurance Co /can/ | 118.709 | -2,66 | 5 | 0,00 | ||||
| 2025-11-10 | 13F | Journey Advisory Group, LLC | 239.086 | 336,34 | 9.836 | 388,33 | ||||
| 2025-11-14 | 13F | Creative Planning | Call | 300 | 1 | |||||
| 2025-11-14 | 13F | Marex Group plc | Put | 600.000 | 17,76 | 24.684 | 31,80 | |||
| 2025-11-12 | 13F | Barclays Plc | Call | 24.248.500 | 23,76 | 997.583 | 138.453,19 | |||
| 2025-11-14 | 13F | Sig Brokerage, Lp | Call | 49.500 | 230,00 | 2.036 | 269,51 | |||
| 2025-11-14 | 13F | Sig Brokerage, Lp | 90.293 | 48,50 | 3.715 | 66,17 | ||||
| 2025-11-14 | 13F | Marex Group plc | 466.665 | 40,50 | 19.199 | 57,24 | ||||
| 2025-10-24 | 13F | Mirae Asset Securities (usa) Inc. | 503.135 | 150,96 | 20.699 | 180,88 | ||||
| 2025-11-12 | 13F | Barclays Plc | Put | 9.136.200 | 20,21 | 375.863 | 134.617,92 | |||
| 2025-11-12 | 13F | Legacy Capital Group California, Inc. | 15.275 | 5,24 | 628 | 17,82 | ||||
| 2025-10-21 | 13F | Dupont Capital Management Corp | 276.193 | -41,31 | 11.363 | -34,32 | ||||
| 2025-10-22 | 13F | West Paces Advisors Inc. | 0 | -100,00 | 0 | -100,00 | ||||
| 2026-01-21 | 13F | Flagship Harbor Advisors, Llc | 483 | 19 | ||||||
| 2025-11-12 | 13F | Laurel Wealth Advisors LLC | 0 | -100,00 | 0 | |||||
| 2025-11-14 | 13F | Equitable Holdings, Inc. | 211.982 | -9,42 | 8.721 | 1,36 | ||||
| 2025-07-25 | 13F | Atria Wealth Solutions, Inc. | 25.571 | 28,17 | 939 | 31,33 | ||||
| 2025-08-12 | 13F | Telligent Fund, LP | 0 | -100,00 | 0 | |||||
| 2025-11-14 | 13F | Ancora Advisors, LLC | 100 | 0,00 | 4 | 33,33 | ||||
| 2025-11-14 | 13F | Capstone Investment Advisors, Llc | Put | 3.800.100 | 65,24 | 156.336 | 84,93 | |||
| 2025-11-14 | 13F | Capstone Investment Advisors, Llc | Call | 3.893.600 | 234,53 | 160.183 | 274,40 | |||
| 2025-10-24 | 13F | Bay Colony Advisory Group, Inc d/b/a Bay Colony Advisors | 13.998 | 576 | ||||||
| 2025-08-13 | 13F | Mirabella Financial Services Llp | 0 | -100,00 | 0 | -100,00 | ||||
| 2025-11-13 | 13F | Clear Street Markets Llc | 0 | -100,00 | 0 | -100,00 | ||||
| 2025-10-31 | 13F | Emerald Investment Partners, Llc | 600 | 0,00 | 25 | 9,09 | ||||
| 2025-09-29 | NP | CADVX - Calamos Dividend Growth Fund Class A | 0 | -100,00 | 0 | -100,00 | ||||
| 2025-11-14 | 13F | Capstone Investment Advisors, Llc | 0 | -100,00 | 0 | -100,00 | ||||
| 2025-11-14 | 13F | Wolverine Trading, Llc | 53.563 | -72,85 | 2.195 | -69,77 | ||||
| 2025-11-14 | 13F | Wolverine Trading, Llc | Call | 689.800 | 0,77 | 28.268 | 12,19 | |||
| 2025-11-14 | 13F | Wolverine Trading, Llc | Put | 443.000 | -0,96 | 18.154 | 10,26 | |||
| 2025-11-14 | 13F | Bank Of America Corp /de/ | Call | 8.356.700 | -13,19 | 343.795 | -2,85 | |||
| 2025-08-13 | 13F | Edgestream Partners, L.P. | 0 | -100,00 | 0 | -100,00 | ||||
| 2025-11-14 | 13F | Nbc Securities, Inc. | Call | 2 | 0 | |||||
| 2025-10-08 | 13F/A | New York State Common Retirement Fund | 0 | -100,00 | 0 | -100,00 | ||||
| 2025-11-13 | 13F | Loomis Sayles & Co L P | 99.150 | 4.079 | ||||||
| 2025-11-07 | 13F | Calton & Associates, Inc. | 19.566 | 10,79 | 805 | 23,88 | ||||
| 2026-01-06 | 13F | Chemistry Wealth Management LLC | 5.706 | 0,00 | 218 | -6,84 | ||||
| 2025-11-14 | 13F | Select Equity Group, L.P. | Call | 397.200 | -56,59 | 16.341 | -51,42 | |||
| 2025-11-12 | 13F | Robertson Stephens Wealth Management, LLC | 122.960 | -16,30 | 5.059 | -6,33 | ||||
| 2025-10-28 | 13F | Csenge Advisory Group | 0 | -100,00 | 0 | -100,00 | ||||
| 2025-08-14 | 13F | Alphadyne Asset Management, LLC | Call | 0 | -100,00 | 0 | -100,00 | |||
| 2025-11-14 | 13F | Banco Bilbao Vizcaya Argentaria, S.a. | 343.700 | -32,44 | 14.115 | -24,30 | ||||
| 2026-01-23 | 13F | Westside Investment Management, Inc. | 500 | 0,00 | 19 | -5,00 | ||||
| 2025-11-06 | 13F | Prospera Financial Services Inc | 80.087 | 8,14 | 3.295 | 21,01 | ||||
| 2025-08-11 | 13F | Greenland Capital Management LP | Call | 0 | -100,00 | 0 | ||||
| 2025-08-14 | 13F | Bluefin Capital Management, Llc | 6.300 | 232 | ||||||
| 2025-11-14 | 13F | Creative Planning | 26.457 | 121,60 | 1.088 | 148,40 | ||||
| 2025-11-14 | 13F | Capitolis Liquid Global Markets LLC | 698.000 | 0,00 | 28.716 | 11,91 | ||||
| 2025-08-14 | 13F | Rokos Capital Management LLP | Call | 0 | -100,00 | 0 | -100,00 | |||
| 2025-10-24 | 13F | Mirae Asset Securities (usa) Inc. | Put | 500.000 | 150,00 | 20.570 | 179,79 | |||
| 2025-11-13 | 13F | Private Advisor Group, LLC | 4.989 | -42,95 | 205 | -36,14 | ||||
| 2025-11-14 | 13F | Goldman Sachs Group Inc | 2.219.049 | -89,28 | 91.292 | -88,01 | ||||
| 2025-07-30 | NP | FSAMX - Strategic Advisers Emerging Markets Fund This fund is a listed as child fund of Fmr Llc and if that institution has disclosed ownership in this security, then these positions will not be double counted when calculating total shares and total value | 575.894 | 0,00 | 20.156 | -0,65 | ||||
| 2025-11-03 | 13F | Truist Financial Corp | 37.571 | 29,09 | 1.546 | 44,53 | ||||
| 2025-11-13 | 13F | Franklin Resources Inc | 426 | 0,00 | 18 | 13,33 | ||||
| 2025-11-13 | 13F | Family Management Corp | 1.768 | 0,00 | 73 | 12,50 | ||||
| 2025-08-14 | 13F | J. Goldman & Co LP | Put | 0 | -100,00 | 0 | -100,00 | |||
| 2025-11-14 | 13F | Mml Investors Services, Llc | 21.811 | -9,44 | 897 | |||||
| 2025-11-10 | 13F | DecisionPoint Financial, LLC | 10 | 0,00 | 0 | |||||
| 2025-11-07 | 13F | Pnc Financial Services Group, Inc. | 1.717 | 4,06 | 71 | 16,67 | ||||
| 2025-11-14 | 13F | Flow Traders U.s. Llc | 398.432 | 16 | ||||||
| 2025-11-14 | 13F | Rinkey Investments | 8.071 | 0,00 | 332 | 12,16 | ||||
| 2025-10-31 | 13F | Cullen/frost Bankers, Inc. | 1.232 | -52,36 | 51 | -47,37 | ||||
| 2025-11-12 | 13F | Barclays Plc | 775.439 | -83,83 | 31.902 | 18.025,57 | ||||
| 2025-11-14 | 13F | Boyer & Corporon Wealth Management, LLC | 91.201 | -9,63 | 3.752 | 1,16 | ||||
| 2025-11-17 | 13F | GWM Advisors LLC | 3.102 | 8,08 | 128 | 20,95 | ||||
| 2025-11-13 | 13F | Baird Financial Group, Inc. | 0 | -100,00 | 0 | -100,00 | ||||
| 2025-11-14 | 13F | Evercore Wealth Management, LLC | 7.000 | 288 | ||||||
| 2026-01-16 | 13F | Mirabaud & Cie SA | Call | 0 | -100,00 | 0 | ||||
| 2025-10-22 | 13F | Cerity Partners LLC | 16.705 | -1,93 | 687 | 9,74 | ||||
| 2025-11-03 | 13F | Belpointe Asset Management LLC | 39.383 | 22,06 | 1.620 | 36,59 | ||||
| 2026-01-06 | 13F | Tucker Asset Management Llc | 70 | 0,00 | 3 | 0,00 | ||||
| 2025-11-14 | 13F | Soros Capital Management Llc | 0 | -100,00 | 0 | -100,00 | ||||
| 2026-01-15 | 13F | Polianta Ltd | 209.100 | 16,56 | 8 | 14,29 | ||||
| 2025-10-30 | 13F/A | CapWealth Advisors, LLC | 121.031 | -4,85 | 4.979 | 6,50 | ||||
| 2025-11-03 | 13F | EPG Wealth Management LLC | 211 | 90,09 | 9 | 100,00 | ||||
| 2026-01-15 | 13F | Savior LLC | 28.672 | 11,84 | 1.098 | 4,08 | ||||
| 2025-10-20 | 13F | Calamos Advisors LLC | 0 | -100,00 | 0 | -100,00 | ||||
| 2025-11-12 | 13F | Rahlfs Capital, Llc | 9.030 | 0,00 | 371 | 12,08 | ||||
| 2025-11-14 | 13F | Delphi Financial Group, Inc. | 356.550 | 52,69 | 14.668 | 70,90 | ||||
| 2025-11-13 | 13F | Wells Fargo & Company/mn | Call | 2.808.300 | 373,65 | 115.533 | 430,09 | |||
| 2025-10-17 | 13F | Farmers & Merchants Investments Inc | 400 | 16 | ||||||
| 2025-11-07 | 13F | Turn8 Private Wealth Inc. | 69.695 | 2,29 | 2.867 | 11,47 | ||||
| 2025-11-12 | 13F | Brinker Capital Investments, LLC | 0 | -100,00 | 0 | -100,00 | ||||
| 2025-11-14 | 13F | Centiva Capital, LP | Put | 400.000 | 100,00 | 16.456 | 123,83 | |||
| 2025-10-20 | 13F | Quest 10 Wealth Builders, Inc. | 26 | 0,00 | 1 | |||||
| 2025-11-14 | 13F | Ieq Capital, Llc | 49.165 | 2,94 | 2.023 | 15,21 | ||||
| 2025-08-08 | 13F | Avantax Advisory Services, Inc. | 5.860 | -82,92 | 215 | -82,51 | ||||
| 2026-01-20 | 13F | Ntv Asset Management Llc | 167.967 | 1,72 | 6.431 | -5,33 | ||||
| 2025-11-14 | 13F | Two Sigma Investments, Lp | 937.109 | -48,51 | 38.553 | -42,37 | ||||
| 2025-11-14 | 13F | Turim 21 Investimentos Ltda. | 62 | 10 | ||||||
| 2026-01-09 | 13F | SG Americas Securities, LLC | 1.015.746 | 110,72 | 39 | 100,00 | ||||
| 2026-01-13 | 13F/A | Sanctuary Advisors, LLC | 20.921 | -1,48 | 861 | 10,26 | ||||
| 2025-08-14 | 13F | DRW Securities, LLC | Put | 0 | -100,00 | 0 | -100,00 | |||
| 2025-11-12 | 13F | Itau Unibanco Holding S.A. | 97.610 | 69,76 | 4.016 | 90,01 | ||||
| 2025-11-14 | 13F | Centiva Capital, LP | 55.258 | 23,33 | 2.273 | 38,01 | ||||
| 2025-08-05 | 13F | Carrhae Capital LLP | Put | 0 | -100,00 | 0 | -100,00 | |||
| 2025-08-13 | 13F | Berbice Capital Management LLC | 0 | -100,00 | 0 | -100,00 | ||||
| 2025-11-07 | 13F | Texas Yale Capital Corp. | 12.475 | 0,00 | 513 | 12,01 | ||||
| 2025-11-07 | 13F | Credit Industriel Et Commercial | 4.919 | -89,35 | 202 | -88,10 | ||||
| 2025-09-26 | NP | BLACKROCK GLOBAL ALLOCATION FUND, INC. - BLACKROCK GLOBAL ALLOCATION FUND, INC. Investor A This fund is a listed as child fund of BlackRock, Inc. and if that institution has disclosed ownership in this security, then these positions will not be double counted when calculating total shares and total value | 1.309.659 | 177,31 | 49.034 | 206,65 | ||||
| 2025-08-12 | 13F | Stelac Advisory Services LLC | 0 | -100,00 | 0 | |||||
| 2025-08-28 | NP | SYMIX - AlphaCentric Symmetry Strategy Fund Class I | 3.675 | -2,52 | 135 | 0,00 | ||||
| 2025-11-03 | 13F | Private Wealth Asset Management, LLC | 26.550 | 6,20 | 1.092 | 18,82 | ||||
| 2025-12-16 | 13F | Garde Capital, Inc. | 0 | -100,00 | 0 | |||||
| 2025-10-31 | 13F | Investment House Llc | 0 | -100,00 | 0 | -100,00 | ||||
| 2025-11-07 | 13F | Credit Industriel Et Commercial | Put | 630.800 | 0,00 | 25.951 | 11,92 | |||
| 2025-08-14 | 13F | Barometer Capital Management Inc. | 0 | -100,00 | 0 | -100,00 | ||||
| 2026-01-14 | 13F | Spire Wealth Management | 3.045 | -10,76 | 117 | -17,14 | ||||
| 2026-01-07 | 13F | Baldwin Brothers Inc/ma | 6.100 | 8,93 | 234 | 1,30 | ||||
| 2025-11-10 | 13F | Optiver Holding B.V. | 0 | -100,00 | 0 | -100,00 | ||||
| 2025-11-07 | 13F | Burke & Herbert Bank & Trust Co | 8.590 | 0,00 | 353 | 12,06 | ||||
| 2025-11-14 | 13F | Jain Global LLC | 64.945 | -93,98 | 2.672 | -93,27 | ||||
| 2025-11-14 | 13F | Brevan Howard Capital Management LP | Call | 4.000.000 | 164.560 | |||||
| 2025-11-14 | 13F | Colony Group, LLC | 28.191 | 1.160 | ||||||
| 2025-11-14 | 13F | Millennium Management Llc | Put | 6.785.000 | -44,11 | 279.135 | -37,45 | |||
| 2025-10-30 | 13F | Traub Capital Management LLC | 0 | -100,00 | 0 | -100,00 | ||||
| 2025-11-14 | 13F | Horizon Investments, LLC | Call | 2.000.000 | 82 | |||||
| 2025-10-31 | 13F | Fortis Capital Advisors, LLC | 39.383 | 22,06 | 1.620 | 36,59 | ||||
| 2025-11-13 | 13F | Eisler Capital Management Ltd. | Put | 1.100.000 | 120,00 | 45.441 | 147,30 | |||
| 2025-11-13 | 13F | Eisler Capital Management Ltd. | 5.766 | 20,05 | 238 | 35,23 | ||||
| 2025-11-14 | 13F | Sona Asset Management (us) Llc | Call | 500.000 | 20.570 | |||||
| 2025-11-12 | 13F | Us Bancorp \de\ | 6.017 | 22,70 | 248 | 37,22 | ||||
| 2025-11-12 | 13F | Harbour Investments, Inc. | 308 | 0,00 | 13 | 9,09 | ||||
| 2025-11-12 | 13F | Fox Run Management, L.l.c. | 0 | -100,00 | 0 | -100,00 | ||||
| 2025-11-06 | 13F | Abc Arbitrage Sa | 407.107 | 16.748 | ||||||
| 2025-11-13 | 13F | Eisler Capital Management Ltd. | Call | 500.000 | 20.655 | |||||
| 2025-11-14 | 13F | Jain Global LLC | Call | 4.445.000 | 122,25 | 182.867 | 148,73 | |||
| 2025-11-14 | 13F | Hrt Financial Lp | 55.477 | -45,46 | 2 | -33,33 | ||||
| 2026-01-14 | 13F | Kraft, Davis & Associates, LLC | 26.987 | -1,49 | 1.086 | -4,23 | ||||
| 2025-11-10 | 13F | Everstar Asset Management, LLC | 16.654 | 11,00 | 685 | 24,32 | ||||
| 2025-11-12 | 13F | Creekmur Asset Management LLC | 20 | 1 | ||||||
| 2025-08-14 | 13F | Prelude Capital Management, Llc | 0 | -100,00 | 0 | -100,00 | ||||
| 2025-11-12 | 13F | CMT Capital Markets Trading GmbH | 31.322 | 1 | ||||||
| 2025-08-05 | 13F | Carolinas Wealth Consulting Llc | 0 | -100,00 | 0 | -100,00 | ||||
| 2026-01-08 | 13F | Aurora Investment Managers, LLC. | 18.910 | 0,00 | 1 | |||||
| 2025-11-14 | 13F | Point72 Asset Management, L.P. | 10.000 | -96,49 | 411 | -96,08 | ||||
| 2025-11-14 | 13F | Jain Global LLC | Put | 8.795.400 | 106,95 | 361.843 | 131,61 | |||
| 2025-11-14 | 13F | Point72 Asset Management, L.P. | Call | 75.000 | 50,00 | 3.086 | 67,85 | |||
| 2025-11-14 | 13F | Verition Fund Management LLC | 120.000 | 4.937 | ||||||
| 2025-11-13 | 13F | Deutsche Bank Ag\ | 90.680 | -1,86 | 3.731 | 9,84 | ||||
| 2025-11-14 | 13F | Verition Fund Management LLC | Call | 500.000 | 20.570 | |||||
| 2025-11-14 | 13F | Toroso Investments, LLC | 0 | -100,00 | 0 | -100,00 | ||||
| 2025-12-15 | 13F/A | Hudson Bay Capital Management LP | Put | 1.000.000 | 41.140 | |||||
| 2025-11-13 | 13F | Tocqueville Asset Management L.p. | 71.215 | 2,84 | 2.930 | 15,09 | ||||
| 2025-12-02 | 13F | Allworth Financial LP | 934 | 6,74 | 38 | 18,75 | ||||
| 2026-01-09 | 13F | First Heartland Consultants, Inc. | 0 | -100,00 | 0 | |||||
| 2026-01-15 | 13F | Brookstone Capital Management | 6.709 | -33,31 | 257 | -38,01 | ||||
| 2025-11-14 | 13F | ExodusPoint Capital Management, LP | 100.000 | 0,00 | 4.114 | 137.033,33 | ||||
| 2025-10-09 | 13F | Bay Harbor Wealth Management, LLC | 30 | 0,00 | 1 | 0,00 | ||||
| 2025-11-06 | 13F | Fielder Capital Group LLC | 7.918 | 0,00 | 326 | 11,68 | ||||
| 2025-07-30 | 13F | Gimbal Financial | 0 | -100,00 | 0 | -100,00 | ||||
| 2026-01-15 | 13F | J. Safra Sarasin Holding AG | 7.200 | 276 | ||||||
| 2025-11-13 | 13F | Total Investment Management Inc | 0 | -100,00 | 0 | -100,00 | ||||
| 2025-08-14 | 13F | Militia Capital Partners, LP | 0 | -100,00 | 0 | -100,00 | ||||
| 2025-11-14 | 13F | Seneschal Advisors, LLC | 165 | 7 | ||||||
| 2025-11-13 | 13F | Bank Of Montreal /can/ | 8.595.294 | 0,94 | 353.610 | 12,96 | ||||
| 2025-11-13 | 13F | Bank Of Montreal /can/ | Call | 10.701.800 | 2.255,67 | 440.272 | 2.536,36 | |||
| 2025-11-19 | 13F | Sunbelt Securities, Inc. | 259 | -27,45 | 11 | 0,00 | ||||
| 2025-11-14 | 13F | Elequin Capital Lp | 0 | -100,00 | 0 | |||||
| 2026-01-12 | 13F | Salem Investment Counselors Inc | 0 | -100,00 | 0 | |||||
| 2025-08-11 | 13F | Beaumont Capital Management, LLC | 0 | -100,00 | 0 | |||||
| 2026-01-15 | 13F | Fortitude Family Office, LLC | 40 | 0,00 | 2 | 0,00 | ||||
| 2025-12-02 | 13F | IFP Advisors, Inc | 22.952 | -38,16 | 944 | -30,79 | ||||
| 2026-01-15 | 13F | SILVER OAK SECURITIES, Inc | 7.181 | 1,04 | 278 | -5,14 | ||||
| 2025-10-15 | 13F | Pensionmark Financial Group, Llc | 7.432 | 0,00 | 306 | 11,72 | ||||
| 2025-10-28 | 13F | Wolverine Asset Management Llc | Call | 0 | -100,00 | 0 | -100,00 | |||
| 2025-11-14 | 13F | Kestra Advisory Services, LLC | 8.687 | -14,57 | 357 | -4,29 | ||||
| 2025-10-28 | 13F | Wolverine Asset Management Llc | Put | 0 | -100,00 | 0 | -100,00 | |||
| 2025-11-13 | 13F | Bnp Paribas Arbitrage, Sa | Call | 25.404 | 21,18 | 104.512 | 35,62 | |||
| 2025-11-13 | 13F | Bnp Paribas Arbitrage, Sa | 3.391.136 | -40,86 | 139.511 | -33,82 | ||||
| 2025-11-13 | 13F | Bnp Paribas Arbitrage, Sa | Put | 41.963 | 190,18 | 172.636 | 224,76 | |||
| 2025-11-14 | 13F | Wexford Capital Lp | 38.324 | 1.577 | ||||||
| 2026-01-22 | 13F/A | Cresset Asset Management, LLC | 13.810 | 0,00 | 568 | 12,03 | ||||
| 2025-11-13 | 13F | Pacific Center for Financial Services | 1.341 | 0,00 | 55 | 12,24 | ||||
| 2026-01-23 | 13F | ABLE Financial Group, LLC | 5.296 | -44,56 | 203 | -48,60 | ||||
| 2025-08-12 | 13F | Belmont Capital, LLC | 50 | 0,00 | 2 | 0,00 | ||||
| 2025-08-14 | 13F | Graham Capital Management, L.P. | Call | 0 | -100,00 | 0 | -100,00 | |||
| 2025-11-12 | 13F | Clal Insurance Enterprises Holdings Ltd | 4.430.000 | 48,66 | 182 | 66,97 | ||||
| 2025-11-14 | 13F | Boothbay Fund Management, Llc | Put | 200.000 | 10.680 | |||||
| 2025-08-28 | NP | BlackRock Funds V - BlackRock Strategic Income Opportunities Portfolio Investor A Shares | 26.615 | 41,38 | 978 | 100,00 | ||||
| 2025-08-13 | 13F | Beacon Pointe Advisors, LLC | 0 | -100,00 | 0 | -100,00 | ||||
| 2025-07-29 | NP | BLUIX - BLUEPRINT GROWTH FUND Institutional Class | 75.177 | -19,68 | 2.631 | -20,20 | ||||
| 2026-01-21 | 13F | Prime Capital Investment Advisors, LLC | 16.724 | 0,75 | 640 | -6,16 | ||||
| 2026-01-20 | 13F | Thurston, Springer, Miller, Herd & Titak, Inc. | 200 | 8 | ||||||
| 2025-09-29 | NP | Calamos Strategic Total Return Fund | 0 | -100,00 | 0 | -100,00 | ||||
| 2025-11-13 | 13F | Schroder Investment Management Group | 216.500 | 8.872 | ||||||
| 2025-11-14 | 13F | Balyasny Asset Management Llc | 0 | -100,00 | 0 | -100,00 | ||||
| 2025-10-14 | 13F | Berkshire Money Management, Inc. | 0 | -100,00 | 0 | -100,00 | ||||
| 2025-10-30 | 13F | Migdal Insurance & Financial Holdings Ltd. | 7.500 | 50,00 | 0 | |||||
| 2025-11-06 | 13F | Costello Asset Management, INC | 0 | 0 | ||||||
| 2025-11-13 | 13F | Bokf, Na | 393 | 0,00 | 16 | 14,29 | ||||
| 2025-10-22 | 13F | Viewpoint Capital Management LLC | 75.123 | 0,00 | 3.091 | 11,92 | ||||
| 2025-11-14 | 13F | Rokos Capital Management LLP | Put | 0 | -100,00 | 0 | -100,00 | |||
| 2025-10-15 | 13F | Private Trust Co Na | 678 | -88,07 | 28 | -87,02 | ||||
| 2025-11-13 | 13F | Powell Investment Advisors, LLC | 1.958 | 0,00 | 81 | 12,68 | ||||
| 2025-11-05 | 13F | Bessemer Group Inc | 2.104 | 31,25 | 0 | |||||
| 2025-08-26 | NP | TBFG - The Brinsmere Fund - Growth ETF | 338.294 | 12.436 | ||||||
| 2025-08-11 | 13F | Waratah Capital Advisors Ltd. | 0 | -100,00 | 0 | -100,00 | ||||
| 2025-11-14 | 13F | Bank Of Nova Scotia | 313.732 | -91,88 | 12.907 | -90,92 | ||||
| 2025-11-03 | 13F | Innealta Capital, Llc | 43.304 | -16,05 | 1.782 | -6,07 | ||||
| 2025-11-12 | 13F | LPL Financial LLC | 850.331 | 3,74 | 34.983 | 16,10 | ||||
| 2026-01-07 | 13F | Harbor Investment Advisory, Llc | 4.990 | 20,24 | 191 | 12,35 | ||||
| 2025-11-03 | 13F | Bank of New York Mellon Corp | 29.339 | 176,99 | 1.207 | 210,03 | ||||
| 2025-11-14 | 13F | Gts Securities Llc | 745.968 | 8.350,02 | 30.689 | 9.371,91 | ||||
| 2025-08-14 | 13F | Brevan Howard Capital Management LP | 0 | -100,00 | 0 | -100,00 | ||||
| 2025-11-14 | 13F | Jane Street Group, Llc | 8.330.241 | 114.405,03 | 342.706 | 128.254,31 | ||||
| 2025-11-13 | 13F | Quantitative Investment Management, LLC | 10.820 | 0 | ||||||
| 2025-08-14 | 13F | Point72 Hong Kong Ltd | Call | 0 | -100,00 | 0 | -100,00 | |||
| 2025-11-13 | 13F | Highlander Partners, L.P. | 6.000 | 0,00 | 247 | 11,82 | ||||
| 2025-08-26 | NP | EQ ADVISORS TRUST - EQ/International Core Managed Volatility Portfolio Class IB | 160.610 | -2,67 | 5.904 | -0,15 | ||||
| 2025-11-13 | 13F | IPG Investment Advisors LLC | 7.819 | -12,33 | 322 | -1,83 | ||||
| 2026-01-16 | 13F | FNY Investment Advisers, LLC | 0 | -100,00 | 0 | |||||
| 2025-11-10 | 13F | Wharton Business Group, LLC | 31.703 | -18,61 | 1.304 | 130.300,00 | ||||
| 2025-11-10 | 13F | Sava Infond d.o.o. | 19.900 | 15,70 | 819 | 29,43 | ||||
| 2025-11-06 | 13F | CAPROCK Group, Inc. | 36.647 | 0,00 | 1.426 | 8,53 | ||||
| 2025-11-07 | 13F | GenTrust, LLC | 80.036 | 3.293 | ||||||
| 2025-11-13 | 13F | Himension Fund | 78.975 | 5,14 | 2.489 | -9,89 | ||||
| 2025-11-13 | 13F | Absolute Gestao de Investimentos Ltda. | 0 | -100,00 | 0 | -100,00 | ||||
| 2025-11-05 | 13F | MONECO Advisors, LLC | 20.317 | -0,41 | 836 | 11,48 | ||||
| 2025-11-07 | 13F | Founders Financial Alliance, LLC | 53 | 2 | ||||||
| 2026-01-23 | 13F | Bellevue Asset Management, Llc | 225 | 0,90 | 9 | -11,11 | ||||
| 2026-01-09 | 13F | Congress Asset Management Co /ma | 11.914 | 0,00 | 456 | -6,94 | ||||
| 2025-10-22 | 13F | Cordatus Wealth Management LLC | 12.280 | 124,09 | 505 | |||||
| 2025-08-07 | 13F | Runnymede Capital Advisors, Inc. | 0 | -100,00 | 0 | -100,00 | ||||
| 2025-11-12 | 13F | BlackDiamond Wealth Management Inc. | 8.164 | 1,15 | 336 | 12,79 | ||||
| 2025-11-14 | 13F | Evelyn Partners Investment Management LLP | 1.375 | 0,00 | 57 | 12,00 | ||||
| 2026-01-07 | 13F | Aventura Private Wealth, LLC | 2 | 0,00 | 0 | |||||
| 2026-01-21 | 13F | Finley Financial, LLC | 18.900 | 24,75 | 724 | 16,05 | ||||
| 2025-11-06 | 13F | CIBC World Markets Inc. | 445.135 | -0,41 | 18.313 | 11,45 | ||||
| 2025-11-12 | 13F | Headlands Technologies LLC | 0 | -100,00 | 0 | |||||
| 2025-11-14 | 13F | Lido Advisors, LLC | 26.017 | 99,29 | 1.070 | 123,38 | ||||
| 2025-10-30 | 13F | Spear Holdings RSC Ltd | 6.461.482 | 25,69 | 265.825 | 40,67 | ||||
| 2026-01-21 | 13F | Westfuller Advisors, LLC | 25 | 0,00 | 1 | -100,00 | ||||
| 2025-11-24 | 13F | Cherry Tree Wealth Management, LLC | 2.645 | 0,00 | 109 | 11,34 | ||||
| 2025-11-03 | 13F | Flagship Private Wealth, LLC | 7.206 | 296 | ||||||
| 2026-01-23 | 13F | Capital Investment Counsel, Inc | 30.019 | -0,45 | 1.149 | -7,34 | ||||
| 2025-11-14 | 13F | Integrated Wealth Concepts LLC | 57.014 | -23,02 | 2.346 | -13,85 | ||||
| 2025-11-12 | 13F | Group One Trading, L.p. | 378.383 | 15.567 | ||||||
| 2026-01-05 | 13F | Park Avenue Securities Llc | 55.397 | 2,00 | 2 | 0,00 | ||||
| 2025-11-14 | 13F | Cetera Investment Advisers | Call | 400 | 1 | |||||
| 2025-08-27 | NP | XNAV - FundX Aggressive ETF | 0 | -100,00 | 0 | -100,00 | ||||
| 2025-11-14 | 13F | Cetera Investment Advisers | 49.671 | 6,57 | 2.043 | 19,26 | ||||
| 2025-08-13 | 13F | HAP Trading, LLC | Put | 25.200 | 26,00 | 37 | 24,14 | |||
| 2025-11-13 | 13F | Parallel Advisors, LLC | 7.658 | 1,46 | 315 | 13,72 | ||||
| 2025-08-13 | 13F | HAP Trading, LLC | Call | 46.300 | -42,98 | 227 | -20,70 | |||
| 2025-11-07 | 13F | Prospect Financial Services LLC | 0 | -100,00 | 0 | -100,00 | ||||
| 2025-11-12 | 13F | Rafferty Asset Management, LLC | 13.320.497 | 2,99 | 548.005 | 15,26 | ||||
| 2025-11-10 | 13F | Stevens Capital Management Lp | 9.100 | 0 | ||||||
| 2025-08-04 | 13F | Bordeaux Wealth Advisors LLC | 46.931 | -1,25 | 1.725 | 1,29 | ||||
| 2025-11-14 | 13F | Peak6 Llc | Call | 1.378.300 | 49,22 | 56.703 | 66,99 | |||
| 2025-11-10 | 13F | Pekin Hardy Strauss, Inc. | 11.000 | 453 | ||||||
| 2025-11-14 | 13F | Peak6 Llc | Put | 568.100 | -34,01 | 23.372 | -26,15 | |||
| 2026-01-15 | 13F | Westend Capital Management LLC | 25 | 0,00 | 1 | -100,00 | ||||
| 2026-01-22 | 13F | Fiduciary Alliance LLC | 99.617 | 6,55 | 3.814 | -0,83 | ||||
| 2025-11-05 | 13F | Koesten, Hirschmann & Crabtree, INC. | 0 | -100,00 | 0 | |||||
| 2025-10-22 | 13F | SeaBridge Investment Advisors LLC | 88.484 | -11,92 | 3.640 | -1,41 | ||||
| 2025-11-12 | 13F | Insigneo Advisory Services, Llc | 90.372 | 19,22 | 3.718 | 33,42 | ||||
| 2025-11-04 | 13F | Peregrine Asset Advisers, Inc. | 5.000 | 206 | ||||||
| 2025-11-14 | 13F | Verition Fund Management LLC | Put | 0 | -100,00 | 0 | -100,00 | |||
| 2025-11-14 | 13F | Ashford Capital Management Inc | 116.112 | 6,85 | 4.777 | 19,58 | ||||
| 2026-01-20 | 13F | Signaturefd, Llc | 15.079 | 0,00 | 577 | -6,94 | ||||
| 2026-01-20 | 13F | Savvy Advisors, Inc. | 8.784 | 4,10 | 336 | -3,17 | ||||
| 2025-11-13 | 13F | Wells Fargo & Company/mn | Put | 4.423.300 | 214,85 | 181.975 | 252,36 | |||
| 2025-11-07 | 13F | Vanguard Group Inc | 24.377 | 1.003 | ||||||
| 2025-11-12 | 13F | MKP Capital Management, L.L.C. | 2.924.346 | 120.308 | ||||||
| 2025-08-08 | 13F | Calamos Advisors LLC | Put | 0 | -100,00 | 0 | -100,00 | |||
| 2025-11-12 | 13F | London & Capital Asset Management Ltd | 94.889 | 3.904 | ||||||
| 2026-01-12 | 13F | Contravisory Investment Management, Inc. | 15.536 | 0,78 | 595 | -6,31 | ||||
| 2025-11-14 | 13F | Arrowpoint Investment Partners (Singapore) Pte. Ltd. | 2.200 | 91 | ||||||
| 2025-08-13 | 13F | Bridgewater Associates, LP | 0 | -100,00 | 0 | -100,00 | ||||
| 2025-12-29 | 13F | Swiss Life Asset Management Ltd | Put | 0 | -100,00 | 0 | ||||
| 2025-11-14 | 13F | Capula Management Ltd | 51.215 | -7,71 | 2.107 | 3,29 | ||||
| 2025-11-14 | 13F | Capula Management Ltd | Call | 600.000 | 20,00 | 24.684 | 34,30 | |||
| 2025-11-13 | 13F | Fmr Llc | 586.205 | 0,36 | 24.116 | 12,32 | ||||
| 2026-01-23 | 13F | Farther Finance Advisors, LLC | 4.544 | -15,68 | 174 | -21,72 | ||||
| 2025-10-21 | 13F | Optimum Investment Advisors | 7.011 | -17,62 | 288 | -7,69 | ||||
| 2025-11-07 | 13F | Essex Financial Services, Inc. | 6.040 | 248 | ||||||
| 2025-10-08 | 13F | Nipun Capital, L.P. | 538.450 | -0,99 | 17.112 | -14,41 | ||||
| 2025-11-12 | 13F | Stifel Financial Corp | 108.614 | -0,09 | 4.468 | 11,81 | ||||
| 2026-01-05 | 13F | GAMMA Investing LLC | 13.995 | 0,00 | 536 | -6,96 | ||||
| 2025-11-12 | 13F | MKP Capital Management, L.L.C. | Call | 1.560.000 | 64.178 | |||||
| 2026-01-05 | 13F | Commons Capital, Llc | 0 | -100,00 | 0 | -100,00 | ||||
| 2025-11-12 | 13F | MKP Capital Management, L.L.C. | Put | 509.200 | 20.948 | |||||
| 2025-11-21 | 13F/A | CIBC Bancorp USA Inc. | 217.526 | 8.949 | ||||||
| 2025-08-26 | NP | TBFC - The Brinsmere Fund - Conservative ETF | 217.530 | 7.996 | ||||||
| 2025-11-13 | 13F | Banco BTG Pactual S.A. | 49.056 | -14,55 | 2.018 | -4,36 | ||||
| 2025-11-14 | 13F | D. E. Shaw & Co., Inc. | 0 | -100,00 | 0 | -100,00 | ||||
| 2025-11-12 | 13F | Rovida Investment Management Ltd | 125.000 | 0,00 | 5.142 | 11,95 | ||||
| 2026-01-08 | 13F | Wealth Enhancement Advisory Services, Llc | 76.193 | 89,06 | 3.041 | 84,35 | ||||
| 2025-11-06 | 13F | Wedbush Securities Inc | 8.832 | 8,81 | 0 | |||||
| 2025-10-30 | 13F | Parkside Financial Bank & Trust | 77 | 0,00 | 3 | 50,00 | ||||
| 2026-01-20 | 13F | SOA Wealth Advisors, LLC. | 369 | 0,00 | 14 | -6,67 | ||||
| 2025-11-04 | 13F | Chung Wu Investment Group, LLC | 1.000 | 0,00 | 41 | 13,89 | ||||
| 2025-11-14 | 13F | New Vernon Capital Holdings II LLC | 216.499 | 30,71 | 8.907 | 46,29 | ||||
| 2025-11-14 | 13F | Morgan Dempsey Capital Management Llc | 304 | 0,00 | 13 | 9,09 | ||||
| 2025-11-04 | 13F | Silphium Asset Management Ltd | 160.500 | 0,00 | 6.603 | 11,92 | ||||
| 2026-01-16 | 13F | Crewe Advisors LLC | 1.440 | -15,04 | 55 | -20,29 | ||||
| 2025-08-08 | 13F | Larson Financial Group LLC | 0 | -100,00 | 0 | -100,00 | ||||
| 2025-11-13 | 13F | Causeway Capital Management Llc | 71.000 | 2.921 | ||||||
| 2025-10-30 | 13F | IronBridge Private Wealth, LLC | 77.184 | 3.175 | ||||||
| 2025-11-14 | 13F | Graham Capital Management, L.P. | 201.000 | 101,00 | 8.269 | 124,95 | ||||
| 2025-11-14 | 13F | Capula Management Ltd | Put | 0 | -100,00 | 0 | -100,00 | |||
| 2026-01-23 | 13F | Eagle Strategies LLC | 60.017 | 1,98 | 2.298 | -5,08 | ||||
| 2025-11-14 | 13F | Mariner, LLC | 6.432 | 7,85 | 265 | 20,55 | ||||
| 2025-11-14 | 13F | Millennium Management Llc | Call | 9.628.000 | -16,29 | 396.096 | -6,31 | |||
| 2025-11-14 | 13F | Silvercrest Asset Management Group Llc | 1.227.000 | 0,00 | 50.479 | 11,91 | ||||
| 2025-11-14 | 13F | Rockefeller Capital Management L.P. | 77.346 | 3,03 | 3.182 | 15,33 | ||||
| 2025-10-21 | 13F | PayPay Securities Corp | 48 | 433,33 | 2 | |||||
| 2025-08-13 | 13F | Pinkerton Retirement Specialists, LLC | 0 | -100,00 | 0 | |||||
| 2025-08-06 | 13F | Cloud Capital Management, LLC | 0 | -100,00 | 0 | |||||
| 2025-08-14 | 13F | Banque Transatlantique SA | 0 | -100,00 | 0 | -100,00 | ||||
| 2025-08-11 | 13F | Hexagon Capital Partners LLC | 0 | -100,00 | 0 | |||||
| 2025-10-15 | 13F | Vontobel Holding Ltd. | 19.254 | 84,30 | 792 | 106,25 | ||||
| 2025-08-14 | 13F | Owl Creek Asset Management, L.P. | Put | 0 | -100,00 | 0 | ||||
| 2025-11-06 | 13F | Gateway Wealth Partners, LLC | 24.799 | 4,65 | 1.020 | 17,11 | ||||
| 2025-11-10 | 13F | New Millennium Group LLC | 0 | -100,00 | 0 | |||||
| 2025-11-14 | 13F | Volterra Technologies LP | Put | 316.500 | -17,69 | 13.021 | -7,88 | |||
| 2025-11-14 | 13F | Atom Investors LP | 8.233 | -65,41 | 339 | -61,33 | ||||
| 2025-11-14 | 13F | Citadel Advisors Llc | 175.285 | 7.211 | ||||||
| 2025-11-14 | 13F | Alphadyne Asset Management, LLC | Put | 0 | -100,00 | 0 | -100,00 | |||
| 2025-10-16 | 13F | Trium Capital LLP | 0 | -100,00 | 0 | -100,00 | ||||
| 2025-11-04 | 13F | Allianz Asset Management GmbH | 312.550 | -36,67 | 12.858 | -29,12 | ||||
| 2025-11-14 | 13F | Volterra Technologies LP | Call | 255.200 | -19,42 | 10.499 | -9,82 | |||
| 2025-10-27 | 13F | Janney Capital Management LLC | 10.972 | 15,18 | 0 | |||||
| 2025-11-10 | 13F | Citigroup Inc | 4.929.793 | -18,55 | 202.812 | -8,85 | ||||
| 2025-11-14 | 13F | Lazard Asset Management Llc | 117.085 | 0,00 | 4.817 | 120.300,00 | ||||
| 2025-10-03 | 13F | Breakwater Investment Management | 708 | 0,00 | 29 | 11,54 | ||||
| 2025-11-10 | 13F | Citigroup Inc | Put | 5.065.000 | 12,84 | 208.374 | 26,29 | |||
| 2025-11-10 | 13F | Citigroup Inc | Call | 5.152.800 | 93,86 | 211.986 | 116,96 | |||
| 2025-08-14 | 13F | Toronto Dominion Bank | Call | 0 | -100,00 | 0 | -100,00 | |||
| 2025-11-14 | 13F | IHT Wealth Management, LLC | 15.329 | 0,18 | 631 | 12,10 | ||||
| 2025-11-14 | 13F | Granby Capital Management, LLC | 80.000 | 0,00 | 3.291 | 11,94 | ||||
| 2025-11-14 | 13F | Millennium Management Llc | 797.850 | -36,39 | 32.824 | -28,81 | ||||
| 2025-11-12 | 13F | Aptus Capital Advisors, LLC | 425 | 0,00 | 17 | 13,33 | ||||
| 2025-11-10 | 13F | Vestmark Advisory Solutions, Inc. | 125.474 | -49,02 | 5.162 | -42,95 | ||||
| 2025-10-15 | 13F | Cwm, Llc | 195 | -34,12 | 0 | |||||
| 2025-11-05 | 13F | Savant Capital, LLC | 5.749 | -2,16 | 237 | 9,26 | ||||
| 2025-11-12 | 13F | Comprehensive Financial Planning, Inc./PA | 142 | 0,00 | 6 | 0,00 | ||||
| 2025-11-14 | 13F | Snowden Capital Advisors LLC | 29.747 | -26,54 | 1.224 | -17,81 | ||||
| 2025-11-14 | 13F | Alphadyne Asset Management, LLC | 0 | -100,00 | 0 | -100,00 | ||||
| 2025-11-14 | 13F | Citadel Advisors Llc | Call | 13.230.800 | 43,48 | 544.315 | 60,57 | |||
| 2026-01-14 | 13F | First City Capital Management, Inc. | 6.365 | 18,64 | 244 | 10,45 | ||||
| 2025-11-14 | 13F | Citadel Advisors Llc | Put | 15.784.000 | 72,53 | 649.354 | 93,09 | |||
| 2025-08-07 | 13F | David R. Rahn & Associates Inc. | 0 | -100,00 | 0 | |||||
| 2025-11-14 | 13F | DRW Securities, LLC | 837.266 | 34.453 | ||||||
| 2025-11-13 | 13F | Wells Fargo & Company/mn | 4.143.761 | -2,09 | 170.474 | 9,57 | ||||
| 2025-11-14 | 13F | XTX Topco Ltd | 33.551 | 1.380 | ||||||
| 2025-11-07 | 13F | Murphy & Mullick Capital Management Corp | 1.450 | 0,00 | 59 | 9,43 | ||||
| 2025-11-13 | 13F | Jones Road Capital Management, L.p. | Call | 150.000 | 6.171 | |||||
| 2025-11-14 | 13F | Walleye Trading LLC | Put | 1.503.500 | -1,53 | 61.854 | 10,20 | |||
| 2025-11-14 | 13F | Walleye Trading LLC | Call | 572.500 | -2,98 | 23.553 | 8,57 | |||
| 2025-10-27 | 13F | Exencial Wealth Advisors, Llc | 10.724 | 0,00 | 441 | 11,93 | ||||
| 2026-01-23 | 13F | Steigerwald, Gordon & Koch Inc. | 117 | 0,86 | 4 | 0,00 | ||||
| 2025-11-13 | 13F | VSM Wealth Advisory, LLC | 222 | 0,00 | 9 | 12,50 | ||||
| 2025-11-14 | 13F | Concentric Capital Strategies, LP | 0 | -100,00 | 0 | -100,00 | ||||
| 2025-08-14 | 13F | Apollo Management Holdings, L.P. | Call | 0 | -100,00 | 0 | ||||
| 2025-08-27 | NP | HCEMX - The Emerging Markets Portfolio HC Strategic Shares | 5.407 | -41,86 | 199 | -40,54 | ||||
| 2025-09-02 | 13F/A | FSC Wealth Advisors, LLC | 0 | -100,00 | 0 | -100,00 | ||||
| 2025-11-13 | 13F | UBS Group AG | Put | 7.821.100 | 51,80 | 321.760 | 69,89 | |||
| 2025-11-13 | 13F | Capital Fund Management S.a. | Put | 2.379.000 | -21,03 | 97.872 | -11,62 | |||
| 2026-01-22 | 13F | Willis Johnson & Associates, Inc. | 12.382 | 1,09 | 474 | -5,77 | ||||
| 2025-11-13 | 13F | Capital Fund Management S.a. | Call | 3.673.700 | -18,46 | 151.136 | -8,74 | |||
| 2025-11-13 | 13F | UBS Group AG | 23.264.603 | -4,94 | 957.106 | 6,39 | ||||
| 2025-11-12 | 13F | Capital Markets Trading UK LLP | 19.027 | 123,74 | 1 | |||||
| 2025-11-13 | 13F | UBS Group AG | Call | 7.253.600 | 14,58 | 298.413 | 28,23 | |||
| 2025-08-12 | 13F | Elo Mutual Pension Insurance Co | 0 | -100,00 | 0 | -100,00 | ||||
| 2025-11-04 | 13F | Carrera Capital Advisors | 239.557 | 2,76 | 9.855 | 15,01 | ||||
| 2025-08-22 | NP | BEARX - Federated Prudent Bear Fund Class A Shares This fund is a listed as child fund of Federated Hermes, Inc. and if that institution has disclosed ownership in this security, then these positions will not be double counted when calculating total shares and total value | Short | -2.000 | -0,00 | -74 | 2,82 | |||
| 2025-11-04 | 13F | High Note Wealth, LLC | 94.887 | 6,80 | 3.904 | 19,54 | ||||
| 2025-10-15 | 13F | Chesapeake Asset Management Llc | 0 | -100,00 | 0 | -100,00 | ||||
| 2025-11-06 | 13F | RFG Advisory, LLC | 0 | -100,00 | 0 | -100,00 | ||||
| 2025-11-13 | 13F | Quadrature Capital Ltd | 145.262 | -71,48 | 5.977 | -68,08 | ||||
| 2025-11-03 | 13F | Fidelis Capital Partners, LLC | 5.272 | 217 | ||||||
| 2025-11-17 | 13F | Silicon Valley Capital Partners | 200 | 8 | ||||||
| 2025-11-13 | 13F | Css Llc/il | Call | 33.700 | 1.386 | |||||
| 2026-01-21 | 13F | Register Financial Advisors LLC | 100 | 0,00 | 4 | -25,00 | ||||
| 2025-11-13 | 13F | Css Llc/il | Put | 5.000 | 206 | |||||
| 2025-11-14 | 13F | City Of London Investment Management Co Ltd | 993.861 | 78,54 | 40.887 | 99,81 | ||||
| 2025-10-31 | 13F | BCJ Capital Management, LLC | 215.913 | 8.883 | ||||||
| 2025-08-11 | 13F | Perennial Investment Advisors, LLC | 0 | -100,00 | 0 | -100,00 | ||||
| 2025-08-28 | NP | BlackRock Series Fund, Inc. - BlackRock Global Allocation Portfolio This fund is a listed as child fund of BlackRock, Inc. and if that institution has disclosed ownership in this security, then these positions will not be double counted when calculating total shares and total value | 4.351 | 2,23 | 160 | 4,61 | ||||
| 2025-11-12 | 13F | SPX Equities Gestao de Recursos Ltda | 25.370 | 0,00 | 1.044 | 11,91 | ||||
| 2025-11-14 | 13F/A | Skopos Labs, Inc. | 0 | -100,00 | 0 | |||||
| 2025-11-14 | 13F | Credit Agricole S A | 24.312 | 583,50 | 1.000 | 687,40 | ||||
| 2025-10-22 | 13F | Commonwealth Equity Services, Llc | 45.242 | -0,90 | 2 | 0,00 | ||||
| 2025-11-03 | 13F | Cypress Capital Group | 62.260 | 4,05 | 2.561 | 16,46 | ||||
| 2025-11-10 | 13F | MAI Capital Management | 8.833 | -6,11 | 363 | 5,22 | ||||
| 2025-08-26 | NP | EQ ADVISORS TRUST - EQ/All Asset Growth Allocation Portfolio Class IB | 67.185 | 0,00 | 2.470 | 2,58 | ||||
| 2025-11-14 | 13F | Nomura Holdings Inc | Call | 7.252.500 | 163,69 | 298.368 | 195,11 | |||
| 2025-11-14 | 13F | Nomura Holdings Inc | Put | 3.739.700 | 119,98 | 153.851 | 146,19 | |||
| 2025-11-12 | 13F | BlackRock, Inc. | 6.151.016 | 43,09 | 253.053 | 60,14 | ||||
| 2025-11-14 | 13F | Morgan Stanley | 30.503.443 | 10,70 | 1.254.912 | 23,90 | ||||
| 2025-11-14 | 13F | Northwestern Mutual Wealth Management Co | 11.093 | -20,22 | 456 | -10,76 | ||||
| 2026-01-22 | 13F | Financial Consulate, Inc | 0 | -100,00 | 0 | |||||
| 2026-01-23 | 13F | Diversify Advisory Services, LLC | 8.598 | -1,97 | 338 | -3,44 | ||||
| 2025-11-12 | 13F | BlackRock, Inc. | Call | 9.078.100 | -1,99 | 373.473 | 9,69 | |||
| 2025-11-07 | 13F | NewEdge Wealth, LLC | 18.641 | 741 | ||||||
| 2025-11-14 | 13F | Aqr Capital Management Llc | 8.002 | 0,00 | 329 | 11,90 | ||||
| 2025-12-29 | 13F | Cape Investment Advisory, Inc. | 0 | -100,00 | 0 | |||||
| 2025-10-28 | 13F | Curat Global, LLC | 670 | 0,00 | 28 | 12,50 | ||||
| 2025-10-31 | 13F | Ping Capital Management, Inc. | 70.000 | 0,00 | 2.880 | 11,89 | ||||
| 2025-11-13 | 13F | Appaloosa Lp | 1.110.000 | 11,00 | 45.665 | 24,22 | ||||
| 2025-08-11 | 13F | One Capital Management, LLC | 0 | -100,00 | 0 | -100,00 | ||||
| 2025-11-14 | 13F | Nbc Securities, Inc. | 700 | 0,00 | 29 | |||||
| 2025-11-14 | 13F | Two Sigma Advisers, Lp | 313.400 | 447,90 | 12.893 | 513,37 | ||||
| 2025-11-14 | 13F | VestGen Advisors, LLC | 60.337 | 35,18 | 2.482 | 51,34 | ||||
| 2025-11-14 | 13F | Toronto Dominion Bank | Put | 12.700 | 522 | |||||
| 2025-11-18 | 13F | Advisory Services Network, LLC | 33.969 | 0,00 | 1.397 | 9,91 | ||||
| 2025-11-03 | 13F | AE Wealth Management LLC | 3.137 | -35,81 | 129 | -27,93 | ||||
| 2025-11-14 | 13F | Schonfeld Strategic Advisors LLC | 124.819 | -46,86 | 5.135 | -40,52 | ||||
| 2025-11-06 | 13F | Johnson Investment Counsel Inc | 6.600 | 0,00 | 272 | 11,98 | ||||
| 2025-11-14 | 13F | Schonfeld Strategic Advisors LLC | Put | 991.600 | -42,52 | 40.794 | -35,67 | |||
| 2025-11-14 | 13F | Two Sigma Securities, Llc | 187.586 | 666,47 | 7.717 | 758,40 | ||||
| 2025-11-14 | 13F | Rokos Capital Management LLP | 1.054.967 | 0,00 | 43.407 | 11,94 | ||||
| 2025-11-14 | 13F | Schonfeld Strategic Advisors LLC | Call | 991.600 | -40,80 | 40.794 | -33,75 | |||
| 2025-11-03 | 13F | TD Waterhouse Canada Inc. | 18.005 | -68,98 | 745 | -65,18 | ||||
| 2025-11-12 | 13F | IFG Advisory, LLC | 20.627 | 22,86 | 849 | 37,44 | ||||
| 2025-11-10 | 13F | Hillsdale Investment Management Inc. | 260 | 0,00 | 11 | 11,11 | ||||
| 2025-11-04 | 13F | Penserra Capital Management LLC | 563.205 | 1,33 | 23 | 15,00 | ||||
| 2025-11-14 | 13F | Peak6 Llc | 0 | -100,00 | 0 | -100,00 | ||||
| 2025-10-31 | 13F | Baker Avenue Asset Management, LP | 162.037 | -1,32 | 6.666 | 10,44 | ||||
| 2025-08-28 | NP | BlackRock Variable Series Funds, Inc. - BlackRock Global Allocation V.I. Fund Class I This fund is a listed as child fund of BlackRock, Inc. and if that institution has disclosed ownership in this security, then these positions will not be double counted when calculating total shares and total value | 122.101 | 2,20 | 4.488 | 4,81 | ||||
| 2025-11-12 | 13F | Steward Partners Investment Advisory, Llc | 224 | 17,28 | 9 | 28,57 | ||||
| 2025-11-14 | 13F | Advisor Group Holdings, Inc. | 102.004 | -72,23 | 4.071 | -69,26 | ||||
| 2026-01-22 | 13F | Bfsg, Llc | 158.940 | 35,77 | 6.086 | 26,35 | ||||
| 2025-10-27 | 13F | Janney Montgomery Scott LLC | 6.912 | -0,04 | 0 | |||||
| 2025-11-14 | 13F | Bank Of America Corp /de/ | Put | 8.138.900 | -11,42 | 334.834 | -0,86 | |||
| 2025-11-14 | 13F | Bank Of America Corp /de/ | 12.536.146 | 5,51 | 515.737 | 18,08 | ||||
| 2025-08-06 | NP | LINCOLN VARIABLE INSURANCE PRODUCTS TRUST - LVIP BlackRock Global Allocation Fund Standard Class | 55.503 | 2,25 | 2.040 | 4,88 | ||||
| 2025-11-14 | 13F | Goldman Sachs Group Inc | Call | 16.916.200 | 62,03 | 695.932 | 81,34 | |||
| 2025-11-05 | 13F | Waterloo Capital, L.P. | 171.779 | 72,22 | 7.067 | 92,74 | ||||
| 2025-11-13 | 13F | Ckw Financial Group | 300 | 0,00 | 0 | |||||
| 2025-08-14 | 13F | Coppell Advisory Solutions LLC | 0 | -100,00 | 0 | |||||
| 2025-08-13 | 13F | Townsquare Capital Llc | 0 | -100,00 | 0 | -100,00 | ||||
| 2025-11-13 | 13F | Jefferies Financial Group Inc. | 9.138 | 3,54 | 376 | 15,74 | ||||
| 2025-11-14 | 13F | Parallax Volatility Advisers, L.P. | 201.262 | 8.280 | ||||||
| 2025-08-12 | 13F | Trexquant Investment LP | 0 | -100,00 | 0 | -100,00 | ||||
| 2025-11-14 | 13F | Soros Fund Management Llc | Call | 3.225.000 | 115,00 | 132.676 | 140,62 | |||
| 2025-11-14 | 13F | Parallax Volatility Advisers, L.P. | Put | 859.700 | -48,50 | 35.368 | -42,36 | |||
| 2025-11-14 | 13F | Parallax Volatility Advisers, L.P. | Call | 366.000 | -80,13 | 15.057 | -77,76 | |||
| 2025-11-03 | 13F | Kapitalo Investimentos Ltda | 77.718 | 0,00 | 3.197 | 11,94 | ||||
| 2025-11-14 | 13F | StoneX Group Inc. | 50.928 | 30,19 | 2.095 | 45,79 | ||||
| 2025-11-07 | 13F | Syon Capital Llc | 6.595 | 271 | ||||||
| 2025-11-14 | 13F | Caption Management, LLC | Call | 0 | -100,00 | 0 | -100,00 | |||
| 2025-11-14 | 13F | Caption Management, LLC | 0 | -100,00 | 0 | -100,00 | ||||
| 2026-01-21 | 13F | Capital Investment Advisory Services, LLC | 2.108 | 0,05 | 81 | -6,98 | ||||
| 2025-10-31 | 13F | Whittier Trust Co Of Nevada Inc | 300 | 0,00 | 12 | 9,09 | ||||
| 2025-11-07 | 13F | Gsa Capital Partners Llp | 12.671 | 111,64 | 1 | |||||
| 2025-10-21 | 13F | Financiere des Professionnels - Fonds d,investissement inc. | 267.500 | 105,77 | 11.005 | 130,31 | ||||
| 2025-09-26 | NP | SPEDX - Alger Dynamic Opportunities Fund Class A | Short | -32.369 | -68,09 | -1.212 | -64,74 | |||
| 2025-11-13 | 13F | Jump Financial, LLC | 0 | -100,00 | 0 | -100,00 | ||||
| 2025-11-14 | 13F | Scotia Capital Inc. | 561.307 | 3,60 | 23.092 | 15,95 | ||||
| 2025-11-14 | 13F | Goldman Sachs Group Inc | Put | 25.845.800 | -34,19 | 1.063.296 | -26,35 | |||
| 2025-11-07 | 13F | Glaxis Capital Management, LLC | 176.250 | 39,22 | 7.251 | 55,81 | ||||
| 2025-11-14 | 13F | Raymond James Financial Inc | 306.351 | 13,62 | 12.603 | 27,16 | ||||
| 2025-08-14 | 13F | Blackstone Group Inc | 0 | -100,00 | 0 | -100,00 | ||||
| 2025-11-14 | 13F | Kite Lake Capital Management (uk) Llp | 0 | -100,00 | 0 | -100,00 | ||||
| 2025-09-29 | NP | HF - DGA Absolute Return ETF | 4.964 | 186 | ||||||
| 2025-11-14 | 13F | Ameriprise Financial Inc | 38.193 | -11,16 | 1.570 | -0,63 | ||||
| 2025-10-29 | 13F | SOL Capital Management CO | 12.600 | 0,00 | 1 | |||||
| 2025-11-14 | 13F | Ausdal Financial Partners, Inc. | 0 | -100,00 | 0 | -100,00 | ||||
| 2025-11-14 | 13F | Allie Family Office LLC | 13.710 | 131,59 | 564 | 159,91 | ||||
| 2025-11-14 | 13F | Summit Trail Advisors, Llc | 10.015 | 0,00 | 412 | 11,96 | ||||
| 2025-08-14 | 13F | Black Maple Capital Management LP | 0 | -100,00 | 0 | -100,00 | ||||
| 2025-11-12 | 13F | Rovida Advisors Inc. | 0 | -100,00 | 0 | -100,00 | ||||
| 2025-09-29 | NP | YINN - Direxion Daily FTSE China Bull 3X Shares | 16.420.608 | 11,04 | 614.788 | 22,78 | ||||
| 2025-11-12 | 13F | Sumitomo Mitsui Financial Group, Inc. | 12.637 | 41,70 | 520 | 58,72 | ||||
| 2025-10-27 | 13F | Farmers & Merchants Trust Co of Chambersburg PA | 62 | 0,00 | 0 | |||||
| 2025-11-13 | 13F | Brown Brothers Harriman & Co | 22.000 | 905 | ||||||
| 2025-12-03 | 13F/A | Value Aligned Research Advisors, LLC | Put | 90.000 | 0,00 | 3.703 | 11,91 | |||
| 2025-11-14 | 13F | Moore Capital Management, Lp | Call | 1.200.000 | 49.368 | |||||
| 2025-10-31 | 13F | Whittier Trust Co | 60 | 0,00 | 2 | 0,00 | ||||
| 2026-01-05 | 13F | Union Bancaire Privee, UBP SA | 1.900 | 55 | ||||||
| 2025-11-19 | 13F | GM Advisory Group, Inc. | 0 | -100,00 | 0 | -100,00 | ||||
| 2025-11-14 | 13F | Balyasny Asset Management Llc | Put | 312.600 | 207,07 | 12.860 | 243,67 | |||
| 2025-09-24 | NP | Managed Account Series - BlackRock GA Dynamic Equity Fund Class K | 144.698 | 77,13 | 5.417 | 95,91 | ||||
| 2025-11-13 | 13F | Marshall Wace, Llp | Call | 100 | -99,04 | 4 | -98,95 | |||
| 2025-11-13 | 13F | Marshall Wace, Llp | 269.777 | -53,46 | 11.099 | -47,91 | ||||
| 2025-11-13 | 13F | Marshall Wace, Llp | Put | 93.900 | -92,58 | 3.863 | -91,70 | |||
| 2026-01-23 | 13F | Assetmark, Inc | 3.012 | -0,26 | 115 | -7,26 | ||||
| 2025-08-28 | NP | ICCIX - Dynamic International Opportunity Fund Class I | 51.261 | -50,41 | 1.884 | -49,14 | ||||
| 2025-11-14 | 13F | Balyasny Asset Management Llc | Call | 451.700 | 12,90 | 18.583 | 26,35 | |||
| 2026-01-14 | 13F | Fluent Financial, LLC | 0 | -100,00 | 0 | |||||
| 2026-01-14 | 13F | Clarius Group, LLC | 0 | -100,00 | 0 | |||||
| 2025-10-24 | 13F | Yoffe Investment Management, LLC | 13.186 | 0,00 | 542 | 11,98 | ||||
| 2025-12-09 | 13F/A | Tudor Investment Corp Et Al | Put | 9.370.900 | 218,19 | 385.519 | 256,10 | |||
| 2025-08-14 | 13F | Dark Forest Capital Management Lp | Call | 0 | -100,00 | 0 | ||||
| 2025-12-09 | 13F/A | Tudor Investment Corp Et Al | Call | 9.332.200 | 359,58 | 383.927 | 414,34 | |||
| 2025-11-12 | 13F | Banco Santander, S.A. | 27.445 | 10,91 | 1.129 | 24,20 | ||||
| 2025-11-14 | 13F | CI Private Wealth, LLC | 7.343 | -2,75 | 301 | 8,70 | ||||
| 2025-12-09 | 13F/A | Tudor Investment Corp Et Al | 748.508 | 141,81 | 30.794 | 170,64 | ||||
| 2025-11-14 | 13F | NorthRock Partners, LLC | 0 | -100,00 | 0 | -100,00 | ||||
| 2026-01-16 | 13F | Ronald Blue Trust, Inc. | 0 | -100,00 | 0 | |||||
| 2025-11-14 | 13F | Mount Yale Investment Advisors, LLC | 0 | -100,00 | 0 | -100,00 | ||||
| 2025-11-14 | 13F | Verity Asset Management, Inc. | 16.484 | 2,49 | 678 | 14,72 | ||||
| 2026-01-14 | 13F | Wolff Wiese Magana Llc | 50 | 0,00 | 2 | -50,00 | ||||
| 2025-10-28 | 13F | Nwam Llc | 5.376 | -4,51 | 214 | 0,47 | ||||
| 2026-01-23 | 13F | Prism Advisors, Inc. | 17.567 | 0,00 | 673 | -6,93 | ||||
| 2025-11-12 | 13F | HAP Trading, LLC | Put | 12.300 | 6 | |||||
| 2025-11-14 | 13F | Cardiff Park Advisors, Llc | 349 | 0,00 | 14 | 16,67 | ||||
| 2025-11-12 | 13F | HAP Trading, LLC | 72.879 | 2.998 | ||||||
| 2025-11-12 | 13F | HAP Trading, LLC | Call | 47.900 | 332 | |||||
| 2025-08-01 | 13F | SYM FINANCIAL Corp | 0 | -100,00 | 0 | |||||
| 2025-08-14 | 13F | Oasis Management Co Ltd. | Call | 0 | -100,00 | 0 | -100,00 | |||
| 2025-10-29 | 13F | ADAPT Investment Managers SA | Put | 8.000.200 | 219,98 | 329.128 | 258,11 | |||
| 2025-11-07 | 13F | HighTower Advisors, LLC | 165.645 | 13,77 | 6.815 | 27,32 | ||||
| 2025-11-14 | 13F | Toronto Dominion Bank | 6.651 | 6.357,28 | 274 | 9.000,00 | ||||
| 2025-10-29 | 13F | ADAPT Investment Managers SA | Call | 2.500.000 | 150,00 | 102.850 | 179,79 | |||
| 2025-11-13 | 13F | Resurgent Financial Advisors LLC | 8.236 | 339 | ||||||
| 2026-01-06 | 13F | Afg Fiduciary Services Limited Partnership | 11.681 | -15,64 | 465 | -18,71 | ||||
| 2025-11-13 | 13F | Advisor Resource Council | 0 | -100,00 | 0 | -100,00 | ||||
| 2026-01-22 | 13F | Upper Left Wealth Management, LLC | 8.052 | 29,25 | 308 | 20,31 | ||||
| 2025-11-12 | 13F | Solstein Capital, LLC | 20.036 | 155,79 | 824 | 187,11 | ||||
| 2025-11-14 | 13F | Evoke Wealth, Llc | 5.100 | 210 | ||||||
| 2026-01-15 | 13F | Allspring Global Investments Holdings, LLC | 28.430 | 13,46 | 1.089 | 5,63 | ||||
| 2025-11-14 | 13F | Point72 Europe (London) LLP | 152.593 | -49,50 | 6.278 | -43,49 | ||||
| 2025-11-14 | 13F | Comerica Bank | 12.606 | 107,68 | 519 | 132,29 | ||||
| 2025-11-17 | 13F | Front Row Advisors LLC | 180 | 0,00 | 7 | 16,67 | ||||
| 2026-01-13 | 13F | Matrix Trust Co | 0 | -100,00 | 0 | |||||
| 2025-11-12 | 13F | Blair William & Co/il | 4.114 | 1,43 | 169 | 13,42 | ||||
| 2025-11-13 | 13F | Pinnacle Wealth Planning Services, Inc. | 6.011 | 0,00 | 247 | 12,27 | ||||
| 2025-11-05 | 13F | SBI Securities Co., Ltd. | 19.768 | 0,60 | 813 | 12,60 | ||||
| 2025-11-14 | 13F | Horizon Investments, LLC | 35 | 94,44 | 1 | |||||
| 2025-08-13 | 13F | Natixis | Call | 0 | -100,00 | 0 | -100,00 | |||
| 2025-11-14 | 13F | Zurcher Kantonalbank (Zurich Cantonalbank) | 20.494 | 0,51 | 841 | 12,13 | ||||
| 2025-08-13 | 13F | Natixis | Put | 0 | -100,00 | 0 | -100,00 | |||
| 2025-11-14 | 13F | Jane Street Group, Llc | Put | 6.504.600 | -64,44 | 267.599 | -60,20 | |||
| 2025-11-14 | 13F | XY Capital Ltd | 144.895 | 5.961 | ||||||
| 2025-11-06 | 13F | Oppenheimer & Co Inc | 38.113 | -0,81 | 1.568 | 10,98 | ||||
| 2025-11-14 | 13F | Jane Street Group, Llc | Call | 12.754.200 | 96,13 | 524.708 | 119,50 | |||
| 2025-11-14 | 13F | Brevan Howard Capital Management LP | Put | 0 | -100,00 | 0 | -100,00 | |||
| 2026-01-23 | 13F | U.S. Capital Wealth Advisors, LLC | 16.109 | 617 | ||||||
| 2025-12-05 | 13F | Saranac Partners Ltd | 24.420 | -6,78 | 1.005 | 4,37 | ||||
| 2026-01-12 | 13F | Byrne Asset Management LLC | 17.847 | 683 | -11,07 | |||||
| 2026-01-13 | 13F | Moulton Wealth Management, Inc | 39.788 | -28,72 | 1.584 | -31,01 | ||||
| 2025-11-14 | 13F | Paloma Partners Management Co | 0 | -100,00 | 0 | |||||
| 2025-11-10 | 13F | Mount Lucas Management LP | 23.638 | -5,76 | 972 | 5,42 | ||||
| 2025-11-14 | 13F | Pacitti Group Inc. | 9.166 | -1,08 | 377 | 10,88 | ||||
| 2025-11-10 | 13F | Kovitz Investment Group Partners, LLC | 26.736 | 156,19 | 1.100 | 186,95 | ||||
| 2025-11-13 | 13F | Ally Financial Inc. | 0 | -100,00 | 0 | -100,00 | ||||
| 2025-10-07 | 13F | 1620 Investment Advisors, Inc. | 115 | 0,00 | 5 | 0,00 | ||||
| 2025-11-14 | 13F | Natixis | 3.000.693 | -39,70 | 123.449 | -32,51 | ||||
| 2025-07-25 | 13F | Apollon Wealth Management, LLC | 0 | -100,00 | 0 | -100,00 | ||||
| 2025-11-14 | 13F | Wealthspire Advisors, LLC | 3.184 | 131 | ||||||
| 2025-11-12 | 13F | Allianz Se | 410.734 | 4,68 | 16.898 | 17,15 | ||||
| 2025-11-26 | 13F/A | Jpmorgan Chase & Co | 4.266.142 | 276,12 | 175.509 | 320,95 | ||||
| 2025-11-20 | 13F | Maven Securities LTD | 22.900 | 942 | ||||||
| 2026-01-16 | 13F | Forte Asset Management Llc | 25.592 | -3,72 | 980 | -10,43 | ||||
| 2025-08-27 | NP | Jnl Series Trust - Jnl/blackrock Global Allocation Fund (a) | 78.441 | 2,18 | 2.883 | 4,80 | ||||
| 2025-11-13 | 13F | O'shaughnessy Asset Management, Llc | 1.309 | 0,00 | 54 | 10,42 | ||||
| 2025-11-17 | 13F/A | Keystone Financial Group | 5.080 | 208 | ||||||
| 2025-11-10 | 13F | Atomi Financial Group, Inc. | 13.809 | 4,13 | 568 | 16,63 |