Grundlæggende statistik
| Institutionelle ejere | 702 total, 660 long only, 2 short only, 40 long/short - change of -16,63% MRQ |
| Del pris | 179,60 |
| Gennemsnitlig porteføljeallokering | 0.1887 % - change of -56,12% MRQ |
| Institutionelle aktier (lange) | 77.090.331 (ex 13D/G) - change of -5,07MM shares -6,17% MRQ |
| Institutionel værdi (lang) | $ 8.297.263 USD ($1000) |
Institutionelt ejerskab og aktionærer
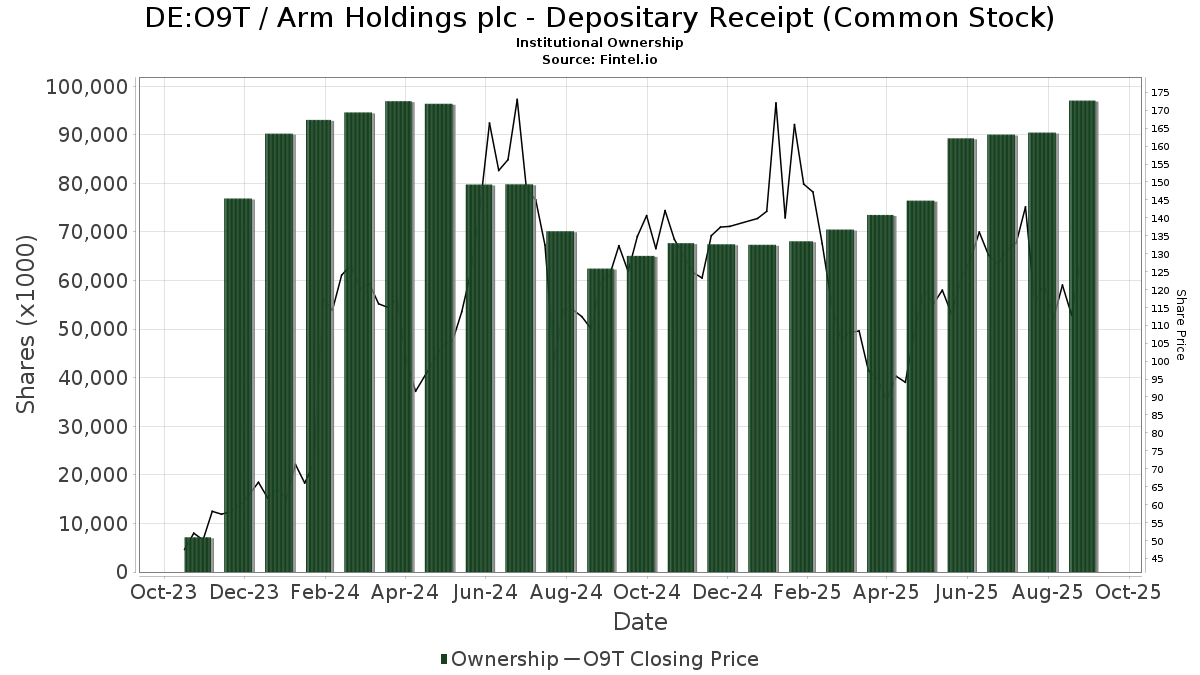
Arm Holdings plc - Depositary Receipt (Common Stock) (DE:O9T) har 702 institutionelle ejere og aktionærer, der har indsendt 13D/G- eller 13F-formularer til Securities Exchange Commission (SEC). Disse institutioner har i alt 77,090,331 aktier. Største aktionærer omfatter Susquehanna International Group, Llp, Jane Street Group, Llc, Susquehanna International Group, Llp, Jane Street Group, Llc, Barclays Plc, Goldman Sachs Group Inc, Morgan Stanley, Citadel Advisors Llc, Citadel Advisors Llc, and Peak6 Llc .
Arm Holdings plc - Depositary Receipt (Common Stock) (DB:O9T) institutionel ejerskabsstruktur viser aktuelle positioner i virksomheden efter institutioner og fonde, samt seneste ændringer i positionsstørrelse. Større aktionærer kan omfatte individuelle investorer, investeringsforeninger, hedgefonde eller institutioner. Skema 13D angiver, at investoren besidder (eller besidder) mere end 5 % af virksomheden og har til hensigt (eller har til hensigt at) aktivt at forfølge en ændring i forretningsstrategi. Skema 13G indikerer en passiv investering på over 5%.
The share price as of April 30, 2026 is 179,60 / share. Previously, on May 5, 2025, the share price was 108,60 / share. This represents an increase of 65,38% over that period.
Fondens stemningsscore
Fund Sentiment Score (fka Ownership Accumulation Score) finder de aktier, der bliver mest købt af fonde. Det er resultatet af en sofistikeret, multi-faktor kvantitativ model, der identificerer virksomheder med de højeste niveauer af institutionel akkumulering. Scoringsmodellen bruger en kombination af den samlede stigning i oplyste ejere, ændringerne i porteføljeallokeringer i disse ejere og andre målinger. Tallet går fra 0 til 100, hvor højere tal indikerer et højere niveau af akkumulering for sine jævnaldrende, og 50 er gennemsnittet.
Opdateringsfrekvens: Dagligt
Se Ownership Explorer, som giver en liste over højest rangerende virksomheder.
AI+ Ask Fintel’s AI assistant about Arm Holdings plc - Depositary Receipt (Common Stock).
Select a question to share a public post with an AI-crafted answer.
Thinking of good questions…
13F og NPORT arkivering
Detaljer om 13F-arkivering er gratis. Detaljer om NP-ansøgninger kræver et premium-medlemskab. Grønne rækker angiver nye positioner. Røde rækker angiver lukkede positioner. Klik på linket ikon for at se den fulde transaktionshistorik.
Opgrader
for at låse premium-data op og eksportere til Excel ![]() .
.
| Fil dato | Kilde | Investor | Type | Gennemsnitlig pris (Øst) |
Aktier | Δ Aktier (%) |
Rapporteret Værdi ($1000) |
Δ Værdi (%) |
Port Alloc (%) |
|
|---|---|---|---|---|---|---|---|---|---|---|
| 2026-02-17 | 13F | Credit Agricole S A | 71.951 | 1,18 | 7.865 | -21,84 | ||||
| 2026-04-17 | 13F | Forefront Wealth Partners, LLC | 1.403 | 212 | ||||||
| 2026-02-17 | 13F | Credit Agricole S A | Put | 445.000 | 229,63 | 48.643 | 154,66 | |||
| 2026-04-27 | 13F | Mosley Wealth Management | 30 | 4 | ||||||
| 2026-04-30 | 13F | Sumitomo Mitsui Trust Holdings, Inc. | 90.773 | 146,27 | 13.732 | 240,83 | ||||
| 2026-02-19 | 13F | CI Private Wealth, LLC | 7.119 | -22,68 | 778 | -40,25 | ||||
| 2026-02-17 | 13F | Capital Fund Management S.a. | Put | 954.600 | 3,69 | 104.347 | -19,89 | |||
| 2026-02-17 | 13F | Gladstone Capital Management LLP | 1.000 | 0,00 | 109 | -22,70 | ||||
| 2026-02-17 | 13F | Capital Fund Management S.a. | Call | 465.200 | 25,05 | 50.851 | -3,39 | |||
| 2025-11-13 | 13F | Eisler Capital Management Ltd. | 6.399 | 46,20 | 896 | 26,59 | ||||
| 2025-11-13 | 13F | Eisler Capital Management Ltd. | Put | 31.300 | 0,00 | 4.382 | -13,42 | |||
| 2026-04-13 | 13F | JCIC Asset Management Inc. | 157 | 0,00 | 24 | 35,29 | ||||
| 2026-02-13 | 13F | Headlands Technologies LLC | 8.734 | 955 | ||||||
| 2026-02-13 | 13F | Baird Financial Group, Inc. | 4.125 | 4,48 | 451 | -19,35 | ||||
| 2026-02-11 | 13F | Jpmorgan Chase & Co | 979.737 | -12,07 | 107.095 | -32,07 | ||||
| 2026-01-14 | 13F | Nepsis, Inc. | 0 | -100,00 | 0 | |||||
| 2026-01-15 | 13F | Royal Fund Management, LLC | 14.850 | -65,51 | 1.623 | -73,36 | ||||
| 2026-02-17 | 13F | Ancora Advisors, LLC | 726 | 1,26 | 79 | -21,78 | ||||
| 2026-04-14 | 13F | Tran Capital Management, L.p. | 272.907 | 44,02 | 41.285 | 99,32 | ||||
| 2026-01-15 | 13F | Krs Capital Management, Llc | 0 | -100,00 | 0 | -100,00 | ||||
| 2026-04-24 | 13F | Profund Advisors Llc | 15.405 | -16,01 | 2.330 | 16,27 | ||||
| 2026-04-13 | 13F | Defender Capital, LLC. | 98.940 | -1,98 | 14.968 | 35,64 | ||||
| 2026-02-13 | 13F | Broadleaf Partners, LLC | 39.809 | -44,18 | 4.352 | -56,88 | ||||
| 2026-02-13 | 13F | Stifel Financial Corp | 61.941 | 23,49 | 6.771 | -4,61 | ||||
| 2026-02-17 | 13F | Cresset Asset Management, LLC | 6.427 | -45,84 | 703 | -58,16 | ||||
| 2026-01-30 | 13F | Mizuho Securities Co. Ltd. | 0 | -100,00 | 0 | |||||
| 2026-02-17 | 13F | Jones Financial Companies Lllp | 63.333 | 9,26 | 6.923 | -14,47 | ||||
| 2026-04-15 | 13F | Spirit Of America Management Corp/ny | 1.300 | 0,00 | 197 | 38,03 | ||||
| 2026-02-17 | 13F | Silvercrest Asset Management Group Llc | 0 | -100,00 | 0 | -100,00 | ||||
| 2025-11-14 | 13F | Main Management ETF Advisors, LLC | 0 | -100,00 | 0 | |||||
| 2026-02-17 | 13F | Susquehanna International Group, Llp | 1.880.816 | 750,84 | 205.592 | 557,34 | ||||
| 2026-02-17 | 13F | Susquehanna International Group, Llp | Put | 8.119.300 | 18,45 | 887.521 | -8,49 | |||
| 2026-01-29 | 13F | Renaissance Capital LLC | 69.843 | -32,90 | 7.635 | -48,16 | ||||
| 2026-02-20 | 13F | Sunbelt Securities, Inc. | 4.495 | 0,00 | 491 | -22,68 | ||||
| 2026-04-10 | 13F | IAM Advisory, LLC | 0 | -100,00 | 0 | |||||
| 2026-02-17 | 13F | Susquehanna International Group, Llp | Call | 6.743.800 | 9,88 | 737.165 | -15,11 | |||
| 2026-02-13 | 13F | Bridgefront Capital, LLC | 10.125 | 1.107 | ||||||
| 2026-04-15 | 13F | Gf Fund Management Co. Ltd. | 28.352 | -2,85 | 4.289 | 34,49 | ||||
| 2025-11-06 | 13F | CloudAlpha Capital Management Limited/Hong Kong | Call | 0 | -100,00 | 0 | ||||
| 2026-05-01 | 13F | Midwest Trust Co | 29.541 | 4.469 | ||||||
| 2026-02-13 | 13F | Pathstone Holdings, LLC | 2.422 | 28,49 | 265 | -0,75 | ||||
| 2026-04-24 | 13F | Slow Capital, Inc. | 45.741 | 71,80 | 6.920 | 137,77 | ||||
| 2025-11-06 | 13F | CloudAlpha Capital Management Limited/Hong Kong | 0 | -100,00 | 0 | |||||
| 2026-02-17 | 13F | Two Sigma Advisers, Lp | 712.100 | 361,20 | 77.840 | 256,31 | ||||
| 2026-02-13 | 13F | Healthcare Of Ontario Pension Plan Trust Fund | 317.369 | 0,99 | 34.692 | -21,98 | ||||
| 2026-04-20 | 13F | Ritholtz Wealth Management | 0 | -100,00 | 0 | |||||
| 2026-02-13 | 13F | American Century Companies Inc | 544.498 | -4,52 | 59.520 | -26,24 | ||||
| 2026-04-14 | 13F | Banque Pictet & Cie Sa | 1.380 | 209 | ||||||
| 2026-02-06 | 13F | Vestmark Advisory Solutions, Inc. | 14.534 | 327,72 | 1.589 | 230,83 | ||||
| 2026-01-30 | 13F | Laurel Wealth Advisors LLC | 90 | 10 | ||||||
| 2026-02-13 | 13F | Cladis Investment Advisory, LLC | 2.000 | -33,33 | 219 | -48,58 | ||||
| 2026-03-09 | 13F | EMC Capital Management | 3.250 | -16,67 | 0 | |||||
| 2026-04-21 | 13F | Huntleigh Advisors, Inc. | 4.570 | 13,12 | 691 | 56,69 | ||||
| 2026-02-19 | 13F | Mcguire Capital Advisors Inc | 273 | 30 | ||||||
| 2026-02-13 | 13F | Schroder Investment Management Group | 1.891.310 | 10,97 | 206.739 | -14,26 | ||||
| 2026-02-10 | 13F | Axq Capital, Lp | 3.309 | 362 | ||||||
| 2026-04-23 | 13F | Oppenheimer & Co Inc | 42.639 | 6.450 | ||||||
| 2026-02-10 | 13F | Godfrey Financial Associates, Inc. | 15 | 2 | ||||||
| 2026-02-11 | 13F | Fox Run Management, L.l.c. | 6.377 | 202,08 | 697 | 133,89 | ||||
| 2026-03-12 | 13F | Nalls Sherbakoff Group, Llc | 0 | -100,00 | 0 | |||||
| 2026-04-27 | 13F | Quantum Private Wealth, LLC | 10.975 | -8,35 | 1.660 | 26,91 | ||||
| 2026-01-21 | 13F | TigerOak Management, L.L.C. | 0 | -100,00 | 0 | |||||
| 2026-02-17 | 13F | Point72 Asset Management, L.P. | Call | 411.800 | 749,07 | 45.014 | 555,97 | |||
| 2026-04-07 | 13F | CoreCap Advisors, LLC | 741 | -0,94 | 112 | 38,27 | ||||
| 2026-02-11 | 13F | Buckingham Strategic Partners | 2.775 | 303 | ||||||
| 2026-02-17 | 13F | Point72 Asset Management, L.P. | Put | 283.100 | 474,24 | 30.946 | 343,66 | |||
| 2026-02-13 | 13F | Taproot Management LP | 9.836 | 1.075 | ||||||
| 2026-04-14 | 13F | Nova Wealth Management, Inc. | 200 | 0,00 | 30 | 42,86 | ||||
| 2026-01-26 | 13F | AE Wealth Management LLC | 2.246 | 246 | ||||||
| 2026-02-06 | 13F | Midwest Professional Planners, LTD. | 14.733 | 6,41 | 1.610 | -17,77 | ||||
| 2025-11-12 | 13F | FineMark National Bank & Trust | 0 | -100,00 | 0 | -100,00 | ||||
| 2026-03-04 | 13F | SHP Wealth Management | 630 | 69 | ||||||
| 2026-04-16 | 13F | SG Americas Securities, LLC | 971.067 | 265,60 | 147 | 403,45 | ||||
| 2026-04-23 | 13F | Oppenheimer Asset Management Inc. | 11.539 | 1.746 | ||||||
| 2026-04-07 | 13F | Park Avenue Securities Llc | 2.707 | 0 | ||||||
| 2026-04-29 | 13F | Skopos Labs, Inc. | 8.120 | 150,15 | 1.228 | 243,02 | ||||
| 2026-02-11 | 13F | Krane Funds Advisors LLC | 4.451 | -10,80 | 487 | -41,38 | ||||
| 2026-02-13 | 13F | Greenline Wealth Management LLC | 512 | 56 | ||||||
| 2026-04-30 | 13F | Kestra Advisory Services, LLC | 16.840 | 19,07 | 2.548 | 64,85 | ||||
| 2026-02-13 | 13F | Integrated Wealth Concepts LLC | 6.546 | -52,26 | 716 | -63,14 | ||||
| 2026-02-13 | 13F | Corps Capital Advisors, LLC | 9.580 | 36,86 | 1.047 | 5,76 | ||||
| 2025-11-14 | 13F/A | Elliott Investment Management L.P. | 0 | -100,00 | 0 | |||||
| 2026-04-16 | 13F | Toth Financial Advisory Corp | 10 | 0,00 | 2 | 0,00 | ||||
| 2026-02-13 | 13F | NLB Skladi, upravljanje premozenja, d.o.o. | 10.910 | 1.193 | ||||||
| 2026-02-17 | 13F | Creative Planning | 61.224 | 4,02 | 6.694 | -19,61 | ||||
| 2026-02-17 | 13F | Manchester Global Management (UK) Ltd | 0 | -100,00 | 0 | -100,00 | ||||
| 2026-04-21 | 13F | Wesbanco Bank Inc | 2.112 | 320 | ||||||
| 2026-02-12 | 13F | Leigh Baldwin & Co., Llc | 0 | -100,00 | 0 | |||||
| 2026-04-16 | 13F | Robocap Asset Management Ltd | 28.579 | 176,39 | 4.323 | 282,57 | ||||
| 2026-02-13 | 13F/A | Alberta Investment Management Corp | 0 | -100,00 | 0 | |||||
| 2026-02-10 | 13F | Envestnet Asset Management Inc | 47.987 | -43,62 | 5.245 | -56,44 | ||||
| 2026-02-17 | 13F | IHT Wealth Management, LLC | 4.025 | 23,01 | 443 | -4,73 | ||||
| 2026-02-12 | 13F | Long Corridor Asset Management Ltd | 0 | -100,00 | 0 | -100,00 | ||||
| 2026-02-04 | 13F | GGM Financials LLC | 150 | 16 | ||||||
| 2026-02-17 | 13F/A | United Capital Management of KS, Inc. | 104.361 | 3,47 | 11.408 | -20,07 | ||||
| 2026-02-13 | 13F | Bridgewater Associates, LP | 326.320 | 35.670 | ||||||
| 2026-02-10 | 13F | Lido Advisors, LLC | 12.647 | 345,79 | 1.462 | 264,34 | ||||
| 2026-04-24 | 13F | Financial Life Planners | 991 | 150 | ||||||
| 2026-02-13 | 13F | Wilmar Advisors LLC | 3.000 | 328 | ||||||
| 2026-02-10 | 13F | Lido Advisors, LLC | Call | 100 | 0,00 | 11 | -28,57 | |||
| 2026-01-27 | 13F | ZEGA Investments, LLC | 0 | -100,00 | 0 | -100,00 | ||||
| 2026-02-17 | 13F | Alliancebernstein L.p. | 25.128 | -60,02 | 2.747 | -69,12 | ||||
| 2026-02-02 | 13F | Advisors Preferred, LLC | 4.101 | 471 | ||||||
| 2025-11-12 | 13F | Claro Advisors LLC | 0 | -100,00 | 0 | -100,00 | ||||
| 2026-02-12 | 13F | Intesa Sanpaolo Wealth Management | 480 | 52 | ||||||
| 2026-04-10 | 13F | Henry James International Management Inc. | 2.500 | 3,14 | 378 | 43,18 | ||||
| 2026-02-11 | 13F | Group One Trading, L.p. | 44.562 | 33,04 | 4.871 | 2,79 | ||||
| 2026-02-10 | 13F | Sustainable Growth Advisers, LP | 2.668.130 | -7,41 | 291.653 | -28,47 | ||||
| 2026-04-10 | 13F | Armstrong Advisory Group, Inc | 339 | 0,00 | 51 | 37,84 | ||||
| 2026-04-07 | 13F | Comprehensive Financial Planning, Inc./PA | 700 | 0,00 | 106 | 38,16 | ||||
| 2026-02-04 | 13F | Nwam Llc | 1.817 | -8,42 | 207 | -37,95 | ||||
| 2025-11-14 | 13F | Fortress Investment Group LLC | 0 | -100,00 | 0 | -100,00 | ||||
| 2026-04-22 | 13F | Patriot Financial Group Insurance Agency, LLC | 3.354 | 507 | ||||||
| 2025-11-07 | 13F | Atticus Wealth Management, Llc | 0 | -100,00 | 0 | -100,00 | ||||
| 2026-01-26 | 13F | Key Capital Management, INC | 3 | 0 | ||||||
| 2026-01-06 | 13F | Ransom Advisory, Ltd | 670 | 0,00 | 73 | -22,34 | ||||
| 2026-04-28 | 13F | Whittier Trust Co | 58.793 | 8.747 | ||||||
| 2026-02-13 | 13F | SRS Capital Advisors, Inc. | 382 | 13,02 | 42 | -12,77 | ||||
| 2026-04-03 | 13F | Investors Research Corp | 30 | 0,00 | 5 | 33,33 | ||||
| 2026-04-28 | 13F | ORG Wealth Partners, LLC | 188 | 0,00 | 28 | 40,00 | ||||
| 2026-02-13 | 13F | Pine Valley Investments Ltd Liability Co | 10.960 | 30,04 | 1.198 | 0,50 | ||||
| 2026-02-18 | 13F | Caitlin John, LLC | 10 | 0,00 | 1 | 0,00 | ||||
| 2026-01-30 | 13F | Rachor Investment Advisory Services, LLC | 56 | 6 | ||||||
| 2026-02-12 | 13F | Renaissance Technologies Llc | 473.600 | -4,40 | 51.769 | -26,14 | ||||
| 2026-02-13 | 13F | Rhumbline Advisers | 553 | 2,98 | 60 | -20,00 | ||||
| 2026-04-01 | 13F | Bangor Savings Bank | 0 | -100,00 | 0 | |||||
| 2026-02-12 | 13F | APG Asset Management N.V. | 68.753 | -9,42 | 6.399 | -29,98 | ||||
| 2025-11-13 | 13F | Bulltick Wealth Management, LLC | 0 | -100,00 | 0 | -100,00 | ||||
| 2026-04-28 | 13F | Northstar Group, Inc. | 2.695 | -5,27 | 408 | 31,29 | ||||
| 2026-02-17 | 13F/A | Kovack Advisors, Inc. | 5.780 | 60,47 | 632 | 23,97 | ||||
| 2026-04-27 | 13F | Y-Intercept (Hong Kong) Ltd | 32.648 | -60,56 | 4.939 | -45,42 | ||||
| 2026-01-07 | 13F | Aventura Private Wealth, LLC | 1.161 | -0,60 | 127 | -23,64 | ||||
| 2026-02-13 | 13F | Walleye Capital LLC | 33.070 | -5,90 | 3.615 | -27,31 | ||||
| 2026-02-13 | 13F | Walleye Capital LLC | Call | 21.600 | -75,97 | 2.361 | -81,44 | |||
| 2026-03-03 | 13F/A | Ovata Capital Management Ltd | 0 | -100,00 | 0 | -100,00 | ||||
| 2026-02-10 | 13F | Td Asset Management Inc | 123.764 | -11,62 | 13.529 | -31,73 | ||||
| 2026-02-17 | 13F | Limestone Investment Advisors LP | Put | 1.300 | 142 | |||||
| 2026-02-12 | 13F | Rossby Financial, LCC | 10 | 0,00 | 1 | 0,00 | ||||
| 2026-04-17 | 13F | Baker Chad R | 24.250 | 0,00 | 3.669 | 36,46 | ||||
| 2026-02-06 | 13F | Lazard Freres Gestion S.A.S. | 13.000 | -23,53 | 1 | -50,00 | ||||
| 2026-02-13 | 13F | Centiva Capital, LP | Put | 688.300 | 46,07 | 75.238 | 12,85 | |||
| 2026-02-13 | 13F | Walleye Capital LLC | Put | 55.400 | -26,43 | 6.056 | -43,17 | |||
| 2026-02-13 | 13F | Centiva Capital, LP | Call | 211.700 | 2.685,53 | 23.141 | 2.052,56 | |||
| 2026-02-13 | 13F | Centiva Capital, LP | 10.802 | -90,20 | 1.181 | -92,43 | ||||
| 2025-11-12 | 13F | Warm Springs Advisors Inc. | 0 | -100,00 | 0 | -100,00 | ||||
| 2025-11-06 | 13F | Blume Capital Management, Inc. | 0 | -100,00 | 0 | |||||
| 2026-02-10 | 13F/A | Northwestern Mutual Wealth Management Co | 72.331 | 17,83 | 7.907 | -8,97 | ||||
| 2026-02-11 | 13F | Ing Groep Nv | 0 | -100,00 | 0 | -100,00 | ||||
| 2026-04-15 | 13F | Purus Wealth Management, LLC | 1.910 | 0,00 | 289 | 38,46 | ||||
| 2026-02-17 | 13F | Price T Rowe Associates Inc /md/ | 477.040 | -8,86 | 52 | -29,73 | ||||
| 2026-04-13 | 13F | Wolff Wiese Magana Llc | 284 | 43 | ||||||
| 2025-11-07 | 13F | Wulff, Hansen & Co. | 0 | -100,00 | 0 | -100,00 | ||||
| 2026-04-20 | 13F | Inscription Capital, LLC | 0 | -100,00 | 0 | |||||
| 2026-02-13 | 13F | Morgan Stanley | 3.783.006 | 1,21 | 413.521 | -21,81 | ||||
| 2026-02-13 | 13F | Public Sector Pension Investment Board | Put | 0 | -100,00 | 0 | -100,00 | |||
| 2026-02-17 | 13F | Altshuler Shaham Ltd | 153.103 | 166.316,30 | 16.736 | 128.630,77 | ||||
| 2026-02-13 | 13F | Victory Capital Management Inc | 62.268 | 5,01 | 6.807 | -18,87 | ||||
| 2026-02-17 | 13F | SageView Advisory Group, LLC | 532 | 58 | ||||||
| 2025-11-14 | 13F | PineBridge Investments, L.P. | 27.937 | -36,06 | 3.953 | -44,07 | ||||
| 2026-02-11 | 13F | Capital International Ltd /ca/ | 26.804 | 5,22 | 2.930 | -18,73 | ||||
| 2026-02-17 | 13F | Limestone Investment Advisors LP | 850 | 93 | ||||||
| 2026-02-17 | 13F | Fmr Llc | 1.730.574 | 15,60 | 189.169 | -10,69 | ||||
| 2026-02-17 | 13F | Nvidia Corp | 0 | -100,00 | 0 | -100,00 | ||||
| 2026-02-06 | 13F | Pnc Financial Services Group, Inc. | 11.742 | 11,72 | 1.284 | -13,72 | ||||
| 2026-04-22 | 13F | Fearless Solutions, LLC dba Best Invest | 3.016 | -20,96 | 456 | 9,35 | ||||
| 2026-04-17 | 13F | Paragon Capital Management Inc | 10.609 | 40,44 | 1.605 | 94,42 | ||||
| 2026-04-29 | 13F | Greenwood Capital Associates Llc | 13.759 | 2.081 | ||||||
| 2026-01-20 | 13F | SOA Wealth Advisors, LLC. | 505 | 0,00 | 55 | -22,54 | ||||
| 2026-02-17 | 13F | GAM Holding AG | 0 | -100,00 | 0 | -100,00 | ||||
| 2026-03-12 | 13F/A | Peak6 Llc | Put | 3.038.000 | 34,57 | 332.084 | 3,96 | |||
| 2026-03-12 | 13F/A | Peak6 Llc | Call | 2.098.600 | 35,64 | 229.398 | 4,79 | |||
| 2026-04-24 | 13F | ProShare Advisors LLC | 177.885 | -17,60 | 26.910 | 14,04 | ||||
| 2026-02-17 | 13F | Blair William & Co/il | 12.996 | -6,31 | 1.421 | -27,62 | ||||
| 2026-04-28 | 13F | Oversea-Chinese Banking CORP Ltd | 46.349 | 72,49 | 6.680 | 124,99 | ||||
| 2026-03-12 | 13F/A | Peak6 Llc | 301.275 | 38,79 | 32.932 | 7,23 | ||||
| 2025-11-14 | 13F | Bank Of Nova Scotia | 0 | -100,00 | 0 | -100,00 | ||||
| 2025-11-04 | 13F | Transcend Wealth Collective, Llc | 0 | -100,00 | 0 | -100,00 | ||||
| 2026-04-27 | 13F | Td Private Client Wealth Llc | 19 | 375,00 | 3 | |||||
| 2026-02-17 | 13F | Defiance ETFs, LLC | 354.147 | 39.261 | ||||||
| 2026-02-09 | 13F | Avalon Trust Co | 200 | 0,00 | 22 | -25,00 | ||||
| 2026-02-13 | 13F | Sofos Investments, Inc. | 26.539 | 8,62 | 2.901 | -16,11 | ||||
| 2026-02-02 | 13F | Cornerstone Planning Group LLC | 134 | -0,74 | 15 | -36,36 | ||||
| 2025-11-14 | 13F | Point72 Italy, S.r.l. | 0 | -100,00 | 0 | |||||
| 2026-04-24 | 13F | Root Financial Partners, LLC | 56 | -94,70 | 8 | -93,04 | ||||
| 2025-11-13 | 13F | GeoWealth Management, LLC | 0 | -100,00 | 0 | |||||
| 2026-04-07 | 13F | Farther Finance Advisors, LLC | 15.243 | -13,41 | 2.364 | 22,82 | ||||
| 2026-04-30 | 13F | Hsbc Holdings Plc | 24.790 | -73,34 | 3.734 | -63,68 | ||||
| 2025-11-10 | 13F | Greenland Capital Management LP | Put | 0 | -100,00 | 0 | -100,00 | |||
| 2026-04-30 | 13F | Hsbc Holdings Plc | Call | 600 | 0,00 | 90 | 34,85 | |||
| 2026-04-30 | 13F | Hsbc Holdings Plc | Put | 19.000 | -80,81 | 2.834 | -74,13 | |||
| 2026-04-29 | 13F | Bluefin Capital Management, Llc | Call | 44.600 | 6 | |||||
| 2026-02-13 | 13F | Lansdowne Partners (uk) Llp | 472.076 | 687,12 | 51.603 | 508,16 | ||||
| 2025-11-14 | 13F | AXA Investment Managers S.A. | 89.548 | 12.670 | ||||||
| 2026-02-13 | 13F | Motiv8 Investments LLC | 346 | 0 | ||||||
| 2026-02-17 | 13F | Cantor Fitzgerald, L. P. | 85.432 | 11,01 | 9.339 | -14,24 | ||||
| 2026-01-15 | 13F | Royal Fund Management, LLC | Put | 0 | -100,00 | 0 | -100,00 | |||
| 2026-02-17 | 13F | Quantessence Capital LLC | 0 | -100,00 | 0 | |||||
| 2026-04-17 | 13F | HHM Wealth Advisors, LLC | 2.490 | 0,00 | 377 | 38,24 | ||||
| 2026-02-12 | 13F | Longitude (Cayman) Ltd. | Call | 60.000 | 6.559 | |||||
| 2026-02-17 | 13F | Schonfeld Strategic Advisors LLC | 0 | -100,00 | 0 | -100,00 | ||||
| 2026-02-12 | 13F | Longitude (Cayman) Ltd. | 50.000 | 23,46 | 5.466 | 9,39 | ||||
| 2026-02-17 | 13F | FIL Ltd | 4.619 | 505 | ||||||
| 2026-02-10 | 13F | Hazlett, Burt & Watson, Inc. | 0 | -100,00 | 0 | |||||
| 2026-02-17 | 13F | Russell Investments Group, Ltd. | 7.772 | -66,90 | 850 | -74,44 | ||||
| 2026-02-11 | 13F | Manchester Capital Management LLC | 0 | -100,00 | 0 | -100,00 | ||||
| 2026-02-18 | 13F | Guardian Capital Lp | 19.906 | -1,38 | 2.176 | -23,82 | ||||
| 2026-02-03 | 13F | Generali Asset Management SPA SGR | 0 | -100,00 | 0 | |||||
| 2026-02-10 | 13F | COFG Advisors, LLC | 9.457 | 1.034 | ||||||
| 2026-01-15 | 13F | Royal Fund Management, LLC | Call | 0 | -100,00 | 0 | -100,00 | |||
| 2026-02-13 | 13F | Van Eck Associates Corp | 50.381 | 30,56 | 6 | 0,00 | ||||
| 2025-11-14 | 13F | 1832 Asset Management L.P. | 0 | -100,00 | 0 | -100,00 | ||||
| 2026-04-23 | 13F | Game Plan Financial Advisors, LLC | 2.415 | 365 | ||||||
| 2026-02-17 | 13F | Shelton Capital Management | 14.889 | 0,00 | 1.628 | -22,74 | ||||
| 2026-02-12 | 13F | New York State Common Retirement Fund | 40.087 | 4.382 | ||||||
| 2026-02-10 | 13F | Bnp Paribas Arbitrage, Sa | 585.505 | -33,18 | 64.002 | -48,38 | ||||
| 2026-05-01 | 13F | Fifth Third Bancorp | 1.780 | 0,00 | 269 | 38,66 | ||||
| 2026-02-10 | 13F | Bnp Paribas Arbitrage, Sa | Put | 1.829 | 282,64 | 19.993 | 195,61 | |||
| 2026-02-12 | 13F | Hollencrest Capital Management | 0 | -100,00 | 0 | |||||
| 2026-02-10 | 13F | Bnp Paribas Arbitrage, Sa | Call | 2.239 | -9,61 | 24.475 | -30,17 | |||
| 2026-02-03 | 13F | Washington Trust Advisors, Inc. | 0 | -100,00 | 0 | -100,00 | ||||
| 2026-02-17 | 13F | Schonfeld Strategic Advisors LLC | Put | 0 | -100,00 | 0 | -100,00 | |||
| 2026-04-23 | 13F | Sawyer & Company, Inc | 70 | 0,00 | 11 | 42,86 | ||||
| 2026-02-06 | 13F | Americana Partners, LLC | 4.011 | -45,44 | 438 | -57,88 | ||||
| 2026-01-21 | 13F | Newbridge Financial Services Group, Inc. | 90.145 | 54,00 | 9.854 | 18,97 | ||||
| 2026-02-09 | 13F | Atlantic Trust, LLC | 35 | 0,00 | 4 | -25,00 | ||||
| 2026-02-17 | 13F | Optiver Holding B.V. | 115.585 | 12.635 | ||||||
| 2026-02-13 | 13F | Wbi Investments, Inc. | 5.222 | 70,32 | 571 | 31,64 | ||||
| 2025-11-14 | 13F | Driehaus Capital Management Llc | 0 | -100,00 | 0 | -100,00 | ||||
| 2026-01-13 | 13F | Stephens Consulting, LLC | 4 | 0,00 | 0 | |||||
| 2026-02-13 | 13F | Alerus Financial Na | 20.274 | 29,65 | 2.216 | 0,18 | ||||
| 2026-02-17 | 13F | Cape Investment Advisory, Inc. | 28 | 3 | ||||||
| 2026-02-17 | 13F | Nwi Management Lp | 206.730 | -8,12 | 23 | -29,03 | ||||
| 2026-02-12 | 13F | Cibc World Markets Corp | 6.721 | -29,48 | 735 | -52,37 | ||||
| 2026-01-30 | 13F | Jennison Associates Llc | 2.253 | -32,85 | 246 | -48,10 | ||||
| 2026-02-17 | 13F | Nissay Asset Management Corp /japan/ /adv | 59.929 | 13,52 | 6.551 | -12,30 | ||||
| 2026-02-17 | 13F | High Falls Advisors, Inc | 5.400 | 0,00 | 590 | -22,77 | ||||
| 2026-02-13 | 13F | Verition Fund Management LLC | Put | 6.600 | 0,00 | 721 | -22,72 | |||
| 2026-02-13 | 13F | Verition Fund Management LLC | 8.068 | -50,80 | 882 | -62,03 | ||||
| 2026-02-17 | 13F | Equitable Holdings, Inc. | 19.105 | 4,47 | 2.088 | -19,29 | ||||
| 2026-02-12 | 13F | Ankerstar Wealth, LLC | 181 | 20 | ||||||
| 2026-02-11 | 13F | Convergence Financial, LLC | 6.967 | -7,70 | 762 | -28,68 | ||||
| 2026-02-17 | 13F | Mark Asset Management Lp | 283.817 | -4,80 | 31.024 | -26,45 | ||||
| 2025-12-29 | 13F/A | Triumph Capital Management | 0 | -100,00 | 0 | -100,00 | ||||
| 2026-01-12 | 13F | Seacrest Wealth Management, Llc | 0 | -100,00 | 0 | |||||
| 2026-02-13 | 13F | First Trust Advisors Lp | 950.013 | 46,09 | 103.846 | 12,86 | ||||
| 2026-05-01 | 13F/A | Lodestone Wealth Management LLC | 2 | -97,37 | 0 | -100,00 | ||||
| 2026-04-29 | 13F | WealthPlan Investment Management, LLC | 5.968 | 903 | ||||||
| 2026-02-09 | 13F | Hartland & Co., LLC | 1.430 | -5,05 | 156 | -26,76 | ||||
| 2026-02-11 | 13F | LPL Financial LLC | 267.730 | -9,87 | 29.266 | -30,37 | ||||
| 2026-02-11 | 13F | LPL Financial LLC | Put | 7.000 | 133,33 | 765 | 80,42 | |||
| 2026-04-28 | 13F | Westfuller Advisors, LLC | 18 | 0,00 | 3 | 100,00 | ||||
| 2026-01-22 | 13F | Venturi Wealth Management, LLC | 0 | -100,00 | 0 | -100,00 | ||||
| 2026-02-13 | 13F | Pin Oak Investment Advisors Inc | 10 | 0,00 | 0 | -100,00 | ||||
| 2026-04-13 | 13F | Creative Financial Designs Inc /adv | 1.077 | 0,00 | 163 | 38,46 | ||||
| 2026-02-11 | 13F | Investors Towarzystwo Funduszy Inwestycyjnych Spolka Akcyjna | 15.155 | 1.657 | ||||||
| 2026-04-30 | 13F | Cambridge Investment Research Advisors, Inc. | 57.401 | 12,10 | 9 | 60,00 | ||||
| 2026-01-07 | 13F | Gilbert & Cook, Inc. | 4.855 | -0,25 | 531 | -22,97 | ||||
| 2026-04-24 | 13F | Sumitomo Mitsui DS Asset Management Company, Ltd | 15.082 | 5,56 | 2.282 | 46,12 | ||||
| 2026-02-13 | 13F | Brown Advisory Inc | 0 | -100,00 | 0 | -100,00 | ||||
| 2026-02-12 | 13F | Penserra Capital Management LLC | 354.147 | 30,73 | 39 | 0,00 | ||||
| 2026-04-27 | 13F | La Banque Postale Asset Management SA | 159.007 | 44,74 | 24.055 | 100,32 | ||||
| 2026-02-11 | 13F | Deutsche Bank Ag\ | 245.094 | 538,81 | 26.791 | 393,57 | ||||
| 2026-02-12 | 13F | Wealthspire Advisors, LLC | 0 | -100,00 | 0 | |||||
| 2026-02-11 | 13F | Gordian Capital Singapore Pte Ltd | 37 | 0,00 | 4 | -20,00 | ||||
| 2026-02-11 | 13F | Strategic Advocates LLC | 82 | 110,26 | 9 | 80,00 | ||||
| 2026-02-13 | 13F | Arkadios Wealth Advisors | 2.698 | -0,07 | 295 | -23,04 | ||||
| 2026-04-24 | 13F | Medallion Wealth Advisors, LLC | 135 | 0,00 | 20 | 42,86 | ||||
| 2026-05-01 | 13F | Strategic Investment Solutions, Inc. /IL | 627 | 0,00 | 95 | 38,24 | ||||
| 2026-01-27 | 13F | Asset Management One Co., Ltd. | 1.076 | -68,28 | 119 | -75,37 | ||||
| 2026-02-02 | 13F | JDM Financial Group LLC | 34 | 0,00 | 4 | -25,00 | ||||
| 2026-02-12 | 13F | Marsico Capital Management Llc | 0 | -100,00 | 0 | -100,00 | ||||
| 2026-04-24 | 13F | Keybank National Association/oh | 2.000 | -18,37 | 303 | 13,11 | ||||
| 2026-02-13 | 13F | Walleye Trading LLC | Put | 2.668.800 | 1,79 | 291.727 | -21,36 | |||
| 2026-01-20 | 13F | Family Legacy Financial Solutions, LLC | 0 | -100,00 | 0 | -100,00 | ||||
| 2026-02-13 | 13F | Walleye Trading LLC | Call | 2.029.600 | -14,20 | 221.856 | -33,71 | |||
| 2026-04-16 | 13F | Brookstone Capital Management | 1.436 | 217 | ||||||
| 2026-02-06 | 13F | Abn Amro Investment Solutions | 0 | -100,00 | 0 | |||||
| 2026-02-17 | 13F | Caption Management, LLC | Put | 10.000 | 0,00 | 1.093 | -22,70 | |||
| 2026-02-17 | 13F | Fwl Investment Management, Llc | 125 | 0,00 | 14 | -23,53 | ||||
| 2026-02-10 | 13F | CIBC World Markets Inc. | 181.976 | 17,52 | 19.892 | -9,21 | ||||
| 2026-02-13 | 13F | Walleye Trading LLC | 1.316.179 | 332,92 | 143.872 | 234,46 | ||||
| 2026-02-17 | 13F | Caption Management, LLC | 9.250 | 12,12 | 1.011 | -13,37 | ||||
| 2026-02-06 | 13F/A | Rathbone Brothers plc | 500.043 | 4.638,85 | 54.660 | 3.561,02 | ||||
| 2026-04-13 | 13F | CGC Financial Services, LLC | 100 | 0,00 | 15 | 50,00 | ||||
| 2026-04-15 | 13F | Bayforest Capital Ltd | 78 | 12 | ||||||
| 2026-02-11 | 13F | Franklin Resources Inc | 1.461.410 | 0,72 | 159.747 | -20,05 | ||||
| 2026-02-13 | 13F | Change Path, LLC | 1.830 | 4,99 | 200 | -18,70 | ||||
| 2026-04-28 | 13F | Schaper Benz & Wise Investment Counsel Inc/wi | 37.603 | 15,26 | 5.689 | 59,51 | ||||
| 2026-04-29 | 13F | Dsm Capital Partners Llc | 2.730 | 5,16 | 413 | 45,58 | ||||
| 2026-02-04 | 13F | Sentry Investment Management Llc | 0 | -100,00 | 0 | |||||
| 2026-04-29 | 13F | Credit Industriel Et Commercial | 1.358 | -70,50 | 205 | -59,24 | ||||
| 2026-02-17 | 13F | WFA of San Diego, LLC | 0 | -100,00 | 0 | |||||
| 2026-04-29 | 13F | Credit Industriel Et Commercial | Put | 15.000 | 0,00 | 2.269 | 38,44 | |||
| 2026-04-02 | 13F | Aspect Partners, LLC | 29 | 7,41 | 4 | 100,00 | ||||
| 2026-04-17 | 13F | Cidel Asset Management Inc | 2.019 | 305 | ||||||
| 2026-02-05 | 13F | Western Wealth Management, LLC | 0 | -100,00 | 0 | |||||
| 2026-04-08 | 13F | RDA Financial Network | 1.383 | 209 | ||||||
| 2025-11-14 | 13F | Jericho Capital Asset Management L.P. | 0 | -100,00 | 0 | -100,00 | ||||
| 2026-04-30 | 13F | Millstone Evans Group, LLC | 100 | 0,00 | 15 | 50,00 | ||||
| 2026-02-13 | 13F | Wilkerson Advisory Group LLC | 150 | 16 | ||||||
| 2026-02-17 | 13F | Canada Pension Plan Investment Board | 10 | -99,90 | 1 | -99,93 | ||||
| 2026-04-23 | 13F | SJS Investment Consulting Inc. | 25 | 4,17 | 4 | 50,00 | ||||
| 2026-04-29 | 13F | Rocky Mountain Advisers, Llc | 131 | 0,00 | 20 | 35,71 | ||||
| 2026-04-13 | 13F | Loring Wolcott & Coolidge Fiduciary Advisors Llp/ma | 375 | 0,00 | 56 | 27,91 | ||||
| 2026-02-10 | 13F | CIBC Asset Management Inc | 25.220 | 13,32 | 2.757 | -12,45 | ||||
| 2026-02-09 | 13F | Koesten, Hirschmann & Crabtree, INC. | 0 | -100,00 | 0 | |||||
| 2026-04-22 | 13F | Union Bancaire Privee, UBP SA | 3.345 | 0,00 | 458 | 23,78 | ||||
| 2026-02-06 | 13F | Envestnet Portfolio Solutions, Inc. | 0 | -100,00 | 0 | -100,00 | ||||
| 2026-02-06 | 13F | Cullen/frost Bankers, Inc. | 5 | 0,00 | 1 | |||||
| 2026-02-04 | 13F | Fourth Dimension Wealth, LLC | 400 | 0,00 | 44 | -23,21 | ||||
| 2026-02-13 | 13F | Capula Management Ltd | 6.170 | -10,19 | 674 | -30,66 | ||||
| 2026-02-10 | 13F | Close Asset Management Ltd | 171 | 0,00 | 0 | |||||
| 2026-05-01 | 13F | Concord Wealth Partners | 0 | -100,00 | 0 | |||||
| 2026-02-06 | 13F | Bare Financial Services, Inc | 6 | 1 | ||||||
| 2026-02-13 | 13F | Sei Investments Co | 271.175 | 12,11 | 29.642 | -13,39 | ||||
| 2026-02-12 | 13F | Brinker Capital Investments, LLC | 32.515 | -20,16 | 3.554 | -38,31 | ||||
| 2026-04-28 | 13F | Flagship Harbor Advisors, Llc | 0 | -100,00 | 0 | |||||
| 2026-02-09 | 13F | Green Square Capital Advisors Llc | 8.650 | -3,03 | 946 | -34,47 | ||||
| 2026-04-24 | 13F | Essex Financial Services, Inc. | 2.845 | -4,24 | 430 | 32,72 | ||||
| 2026-04-08 | 13F | Wealth Enhancement Trust Services, Inc. | 71 | 11 | ||||||
| 2026-02-17 | 13F | Schonfeld Strategic Advisors LLC | Call | 0 | -100,00 | 0 | -100,00 | |||
| 2026-02-13 | 13F | Citigroup Inc | Put | 87.200 | -14,68 | 9.532 | -34,09 | |||
| 2026-02-13 | 13F | Citigroup Inc | 707.517 | 36,24 | 77.339 | 5,25 | ||||
| 2026-02-13 | 13F | Citigroup Inc | Call | 60.800 | 0,00 | 6.646 | -22,74 | |||
| 2026-04-30 | 13F | Private Trust Co Na | 0 | -100,00 | 0 | |||||
| 2026-02-12 | 13F | BlackRock, Inc. | 1.308.027 | 18,43 | 142.980 | -8,51 | ||||
| 2026-05-01 | 13F | Kaizen Financial Strategies | 2.750 | -3,51 | 446 | 43,41 | ||||
| 2026-02-13 | 13F | Kcm Investment Advisors Llc | 5.374 | 5,39 | 587 | -18,59 | ||||
| 2026-02-09 | 13F | Huntington National Bank | 2 | 0 | ||||||
| 2026-02-11 | 13F | Simplex Trading, Llc | 153.416 | 467,45 | 16.770 | 558.866,67 | ||||
| 2026-02-11 | 13F | Dorsey & Whitney Trust CO LLC | 8.775 | 0,00 | 959 | -22,72 | ||||
| 2026-02-13 | 13F | Quarry LP | 153 | 17 | ||||||
| 2026-02-17 | 13F | XTX Topco Ltd | 0 | -100,00 | 0 | |||||
| 2026-02-13 | 13F | MAI Capital Management | 892 | -5,01 | 98 | -26,52 | ||||
| 2026-02-09 | 13F | Harbour Investments, Inc. | 1.688 | 7,24 | 185 | -17,12 | ||||
| 2026-02-13 | 13F | MAI Capital Management | Call | 33 | -23,81 | |||||
| 2026-04-20 | 13F | Dock Street Asset Management Inc | 214.885 | -0,62 | 32.508 | 37,53 | ||||
| 2026-02-17 | 13F | Raymond James Financial Inc | 207.017 | -30,89 | 22.629 | -46,61 | ||||
| 2026-04-30 | 13F | Cherry Creek Investment Advisors, Inc. | 3.376 | -22,34 | 511 | 7,37 | ||||
| 2026-02-17 | 13F | Blackstone Group Inc | 16.784 | 1.835 | ||||||
| 2026-02-06 | 13F | Lloyd Advisory Services, LLC. | 8 | 1 | ||||||
| 2026-05-01 | 13F | Pittenger & Anderson Inc | 180 | 0,00 | 27 | 42,11 | ||||
| 2026-04-27 | 13F | Tensor Edge Capital, LLC | Call | 0 | -100,00 | 0 | ||||
| 2026-02-17 | 13F | State Of Wisconsin Investment Board | 0 | -100,00 | 0 | -100,00 | ||||
| 2025-11-14 | 13F | Mangrove Partners | 0 | -100,00 | 0 | |||||
| 2026-02-19 | 13F | Atomi Financial Group, Inc. | 0 | -100,00 | 0 | -100,00 | ||||
| 2026-04-27 | 13F | Truist Financial Corp | 1.592 | 241 | ||||||
| 2026-02-13 | 13F | Resources Investment Advisors, LLC. | 1.955 | -58,65 | 214 | -68,11 | ||||
| 2026-04-27 | 13F | Tensor Edge Capital, LLC | 289.461 | 43.790 | ||||||
| 2026-02-11 | 13F | Capital International Inc /ca/ | 23.041 | 33,02 | 2.519 | 2,78 | ||||
| 2026-02-12 | 13F | SWAN Capital LLC | 100 | 0,00 | 11 | -28,57 | ||||
| 2025-11-14 | 13F | Mercer Global Advisors Inc /adv | Call | 0 | -100,00 | 0 | -100,00 | |||
| 2026-04-27 | 13F | PFG Investments, LLC | 11.586 | -7,62 | 1.753 | 27,88 | ||||
| 2026-02-12 | 13F/A | Pinebridge Investments Llc | 25.199 | 2.755 | ||||||
| 2026-02-13 | 13F | ROI Financial Advisors, LLC | 5.095 | -0,14 | 557 | -22,88 | ||||
| 2026-02-17 | 13F | Liontrust Investment Partners LLP | 144.929 | -2,57 | 15.842 | -24,73 | ||||
| 2025-11-14 | 13F | Hidden Lake Asset Management LP | 0 | -100,00 | 0 | -100,00 | ||||
| 2026-02-06 | 13F | Tortoise Investment Management, LLC | 0 | -100,00 | 0 | -100,00 | ||||
| 2026-02-12 | 13F | Federation des caisses Desjardins du Quebec | 10.291 | 0,33 | 1.125 | -22,54 | ||||
| 2026-04-13 | 13F | Jackson Square Capital, Llc | 28.218 | -3,73 | 4.269 | 33,21 | ||||
| 2026-02-17 | 13F | Engineers Gate Manager LP | 12.393 | 1.355 | ||||||
| 2026-04-07 | 13F | Retirement Wealth Solutions LLC | 12 | 140,00 | 2 | |||||
| 2026-04-14 | 13F | Meadowbrook Wealth Management, LLC | 2.815 | 426 | ||||||
| 2026-02-17 | 13F | SIH Partners, LLLP | 17.020 | -14,90 | 1.860 | -34,25 | ||||
| 2026-02-06 | 13F | Global Retirement Partners, LLC | 922 | 4,18 | 101 | -20,00 | ||||
| 2026-02-12 | 13F | Marex Group plc | 58.615 | -6,27 | 6.407 | -27,57 | ||||
| 2026-01-26 | 13F | Asset Dedication, LLC | 1.700 | 0,00 | 186 | -22,92 | ||||
| 2026-02-13 | 13F | Flow Traders U.s. Llc | 1.872 | 0 | ||||||
| 2026-04-15 | 13F | Valley National Advisers Inc | 870 | 275,00 | 0 | |||||
| 2026-02-12 | 13F | NZS Capital, LLC | 411.748 | -8,08 | 45.008 | -28,99 | ||||
| 2025-11-07 | 13F | Icapital Wealth Llc | 0 | -100,00 | 0 | -100,00 | ||||
| 2026-02-04 | 13F | Atlantic Union Bankshares Corp | 695 | 0,00 | 76 | -23,47 | ||||
| 2026-02-13 | 13F | Silvant Capital Management LLC | 99.136 | 0,15 | 10.837 | -22,63 | ||||
| 2026-01-28 | 13F | Geneos Wealth Management Inc. | 6.152 | 19,41 | 672 | -7,69 | ||||
| 2026-02-17 | 13F | Wiley Bros.-aintree Capital, Llc | 31.357 | 147,18 | 3.429 | 91,08 | ||||
| 2026-01-05 | 13F | Chesapeake Asset Management Llc | 7 | 1 | ||||||
| 2026-04-17 | 13F | Signal Advisors Wealth, LLC | 2.155 | -18,53 | 326 | 12,80 | ||||
| 2026-02-12 | 13F | Cloud Capital Management, LLC | 0 | -100,00 | 0 | |||||
| 2025-11-14 | 13F | Wolverine Trading, Llc | 5.349 | 748 | ||||||
| 2025-11-14 | 13F | Wolverine Trading, Llc | Call | 1.457.300 | 203.731 | |||||
| 2025-11-14 | 13F | Wolverine Trading, Llc | Put | 616.600 | 86.201 | |||||
| 2026-04-27 | 13F | Fideuram - Intesa Sanpaolo Private Banking S.p.a. | 45.270 | 95,97 | 6.848 | 171,21 | ||||
| 2026-02-17 | 13F | Agf Management Ltd | 10.600 | 341,67 | 1.159 | 241,59 | ||||
| 2025-11-04 | 13F | Victrix Investment Advisors | 0 | -100,00 | 0 | |||||
| 2026-02-17 | 13F | Banco Bilbao Vizcaya Argentaria, S.a. | 0 | -100,00 | 0 | |||||
| 2026-02-13 | 13F | Clear Street Group Inc. | 122.733 | 5,50 | 13.416 | -18,50 | ||||
| 2026-04-29 | 13F | R Squared Ltd | 0 | -100,00 | 0 | |||||
| 2026-04-13 | 13F | E Fund Management Co., Ltd. | 56.444 | 322,26 | 8.539 | 295,09 | ||||
| 2026-02-06 | 13F | GPS Wealth Strategies Group, LLC | 310 | -96,39 | 34 | -97,28 | ||||
| 2026-02-11 | 13F | Capital Analysts, Inc. | 52 | -20,00 | 0 | |||||
| 2026-02-17 | 13F | Main Street Financial Solutions, LLC | 0 | -100,00 | 0 | |||||
| 2026-02-10 | 13F | Acadian Asset Management Llc | 62.329 | 187,08 | 7 | 100,00 | ||||
| 2026-02-09 | 13F | Berkshire Capital Holdings Inc | 10 | 0,00 | 1 | 0,00 | ||||
| 2026-03-27 | 13F | Prosperity Wealth Management, Inc. | 7.831 | 856 | ||||||
| 2026-04-29 | 13F | CVA Family Office, LLC | 6 | -70,00 | 1 | -100,00 | ||||
| 2026-02-02 | 13F | Horizon Investments, LLC | 16.767 | 59,99 | 1.833 | 23,62 | ||||
| 2026-02-24 | 13F | DGS Capital Management, LLC | 0 | -100,00 | 0 | |||||
| 2026-04-28 | 13F | Steigerwald, Gordon & Koch Inc. | 100 | 0,00 | 15 | 50,00 | ||||
| 2026-02-17 | 13F | Sig Brokerage, Lp | Put | 10.000 | 1.093 | |||||
| 2026-02-17 | 13F | Sig Brokerage, Lp | Call | 471.600 | 0,00 | 51.551 | -22,74 | |||
| 2026-01-21 | 13F | Prime Capital Investment Advisors, LLC | 3.635 | 1,17 | 397 | -21,85 | ||||
| 2026-04-23 | 13F | iA Global Asset Management Inc. | 16.769 | -2,45 | 3 | 100,00 | ||||
| 2026-02-18 | 13F | Vident Advisory, LLC | 157.119 | 16,01 | 17.175 | -10,38 | ||||
| 2026-02-17 | 13F | Fairscale Capital, LLC | 257 | 0,00 | 28 | -22,22 | ||||
| 2026-02-11 | 13F | Capital Group Investment Management Pte. Ltd. | 5.478 | 0,00 | 599 | -22,84 | ||||
| 2025-11-14 | 13F | Victory Financial Group, Llc | 0 | -100,00 | 0 | -100,00 | ||||
| 2026-04-30 | 13F | Nuveen, LLC | 303.909 | -77,72 | 45.975 | -69,17 | ||||
| 2026-02-06 | 13F | Copia Wealth Management | 4 | 0 | ||||||
| 2026-02-10 | 13F | Viawealth, Llc | 0 | -100,00 | 0 | -100,00 | ||||
| 2026-04-06 | 13F | Versant Capital Management, Inc | 51 | 0,00 | 8 | 40,00 | ||||
| 2025-11-14 | 13F | Eqis Capital Management, Inc. | 0 | -100,00 | 0 | -100,00 | ||||
| 2025-11-14 | 13F | KP Management LLC | 0 | -100,00 | 0 | |||||
| 2026-01-29 | 13F | Concurrent Investment Advisors, LLC | 4.200 | -37,23 | 459 | -51,48 | ||||
| 2026-02-11 | 13F | Capital Research Global Investors | 1.805.110 | 5,06 | 197.332 | -18,83 | ||||
| 2025-11-14 | 13F | KP Management LLC | Call | 0 | -100,00 | 0 | ||||
| 2026-04-28 | 13F | Hoey Investments, Inc | 6.585 | -1,50 | 996 | 36,44 | ||||
| 2026-04-30 | 13F | Peterson Wealth Services | 10 | 0,00 | 2 | 0,00 | ||||
| 2026-02-02 | 13F | Mutual Advisors, LLC | 0 | -100,00 | 0 | |||||
| 2026-02-02 | 13F | Ascent Wealth Partners, LLC | 11.718 | 1,39 | 1.281 | -21,71 | ||||
| 2026-02-12 | 13F | Alphabet Inc. | 1.960.784 | 0,00 | 214.333 | -22,74 | ||||
| 2026-02-17 | 13F | Toronto Dominion Bank | 2.397 | -69,46 | 262 | -76,47 | ||||
| 2026-02-06 | 13F | EverSource Wealth Advisors, LLC | 3.851 | -59,50 | 421 | -68,77 | ||||
| 2026-02-17 | 13F | Captrust Financial Advisors | 10.149 | -14,02 | 1.109 | -33,59 | ||||
| 2025-11-13 | 13F | RiverPark Advisors, LLC | 0 | -100,00 | 0 | |||||
| 2026-04-17 | 13F | Bell Investment Advisors, Inc | 5 | -16,67 | 1 | |||||
| 2026-02-13 | 13F | Smartleaf Asset Management LLC | 2 | 100,00 | 0 | |||||
| 2026-04-28 | 13F | Stratos Wealth Partners, LTD. | 10.024 | -13,44 | 1.516 | 19,84 | ||||
| 2026-04-23 | 13F | PayPay Securities Corp | 45 | -37,50 | 7 | 0,00 | ||||
| 2025-11-13 | 13F | Riggs Asset Managment Co. Inc. | 0 | -100,00 | 0 | |||||
| 2026-04-28 | 13F | BW Gestao de Investimentos Ltda. | 14.980 | 2.266 | ||||||
| 2026-02-17 | 13F | LMR Partners LLP | 3.748 | -69,92 | 410 | -76,79 | ||||
| 2026-02-10 | 13F | Smith Group Asset Management, LLC | 8.520 | 0,00 | 931 | -22,74 | ||||
| 2026-02-17 | 13F | LMR Partners LLP | Call | 1.600 | -97,99 | 175 | -98,46 | |||
| 2026-04-17 | 13F | RFG Advisory, LLC | 6.166 | -12,29 | 933 | 21,35 | ||||
| 2026-02-17 | 13F | LMR Partners LLP | Put | 84.300 | -12,10 | 9.215 | -32,09 | |||
| 2026-01-20 | 13F | Sovran Advisors, LLC | 0 | -100,00 | 0 | |||||
| 2026-02-11 | 13F | Empowered Funds, LLC | 5.547 | 25,19 | 606 | -3,19 | ||||
| 2026-04-13 | 13F | Trust Co | 13 | 0,00 | 2 | 0,00 | ||||
| 2026-02-12 | 13F | Gerber Kawasaki Wealth & Investment Management | 1.905 | -37,27 | 208 | -51,52 | ||||
| 2026-04-30 | 13F | LRI Investments, LLC | 96 | 15 | ||||||
| 2026-04-22 | 13F | Pictet Asset Management Holding SA | 3.715 | 562 | ||||||
| 2026-02-13 | 13F | Centerpoint Advisors, LLC | 100 | 0,00 | 0 | |||||
| 2026-02-13 | 13F | Avanda Investment Management Pte. Ltd. | 0 | -100,00 | 0 | |||||
| 2026-02-03 | 13F | Legacy Wealth Managment, LLC/ID | 100 | 0,00 | 11 | -28,57 | ||||
| 2026-02-17 | 13F | Crawford Fund Management, LLC | Put | 7.800 | -38,10 | 853 | -52,19 | |||
| 2026-02-13 | 13F | Venture Visionary Partners LLC | 19.035 | -46,88 | 2.081 | -58,97 | ||||
| 2026-02-17 | 13F | Royal Bank Of Canada | Put | 212.200 | 54,66 | 23.196 | 19,49 | |||
| 2026-02-17 | 13F | Royal Bank Of Canada | Call | 27.700 | 0,00 | 3.028 | -22,74 | |||
| 2026-04-28 | 13F | UNICOM Systems, Inc. | 89.000 | 0,00 | 13.464 | 38,39 | ||||
| 2026-02-13 | 13F | Arrowstreet Capital, Limited Partnership | 72.508 | 7.926 | ||||||
| 2026-02-13 | 13F | Quinn Opportunity Partners LLC | 163.987 | 210,13 | 17.925 | 139,61 | ||||
| 2026-01-26 | 13F | Reyes Financial Architecture, Inc. | 136 | 28,30 | 15 | 0,00 | ||||
| 2026-01-23 | 13F | U.S. Capital Wealth Advisors, LLC | 0 | -100,00 | 0 | |||||
| 2026-04-29 | 13F | Schmidt P J Investment Management Inc | 1.587 | 240 | ||||||
| 2026-02-09 | 13F | Keating Financial Advisory Services, Inc. | 247 | 27 | ||||||
| 2025-11-10 | 13F | Dakota Wealth Management | 0 | -100,00 | 0 | -100,00 | ||||
| 2026-02-13 | 13F | National Bank Of Canada /fi/ | 65.604 | 89,82 | 7.171 | 46,68 | ||||
| 2026-02-09 | 13F | Annis Gardner Whiting Capital Advisors, LLC | 3.210 | 0,00 | 351 | -22,91 | ||||
| 2026-04-30 | 13F | Simplicity Wealth,LLC | 3.642 | -17,21 | 551 | 14,58 | ||||
| 2026-02-09 | 13F | Texas Capital Bank Wealth Management Services Inc | 27.500 | 3.006 | ||||||
| 2025-11-13 | 13F | Dymon Asia Capital (singapore) Pte. Ltd. | Put | 0 | -100,00 | 0 | -100,00 | |||
| 2026-02-12 | 13F | Front Row Advisors LLC | 160 | 0,00 | 17 | -22,73 | ||||
| 2025-11-13 | 13F | Dymon Asia Capital (singapore) Pte. Ltd. | Call | 0 | -100,00 | 0 | -100,00 | |||
| 2025-11-14 | 13F | MUFG Securities EMEA plc | Put | 0 | -100,00 | 0 | -100,00 | |||
| 2026-04-17 | 13F | AdvisorNet Financial, Inc | 1.681 | 6,19 | 254 | 46,82 | ||||
| 2026-04-08 | 13F | Accel Wealth Management | 2.581 | -25,01 | 390 | 3,72 | ||||
| 2026-02-10 | 13F | 360 Financial, Inc. | 1.669 | 0,00 | 236 | 0,00 | ||||
| 2026-04-09 | 13F | Zevenbergen Capital Investments Llc | 57.100 | 2,53 | 8.638 | 41,91 | ||||
| 2026-02-13 | 13F | Ubs Asset Management Americas Inc | 217.689 | 23.796 | ||||||
| 2026-02-17 | 13F | Ardsley Advisory Partners Lp | Call | 85.000 | 325,00 | 9.291 | 228,42 | |||
| 2026-02-13 | 13F | Evelyn Partners Investment Management LLP | 900 | 98 | ||||||
| 2026-02-09 | 13F | Jefferies Financial Group Inc. | Put | 10.000 | 1.093 | |||||
| 2026-02-09 | 13F | Jefferies Financial Group Inc. | 3.200 | 350 | ||||||
| 2026-02-10 | 13F | Bnp Paribas | 13.425 | 36,27 | 1.468 | 5,31 | ||||
| 2026-02-12 | 13F | Commonwealth Equity Services, Llc | 26.786 | -34,98 | 2.928 | 58.440,00 | ||||
| 2026-04-29 | 13F | KERR FINANCIAL PLANNING Corp | 2.425 | -9,35 | 481 | 59,27 | ||||
| 2026-02-17 | 13F | Royal Bank Of Canada | 280.625 | -37,06 | 30.676 | -51,37 | ||||
| 2026-04-15 | 13F | Covea Finance | 29.918 | 4.526 | ||||||
| 2026-02-17 | 13F | J. Goldman & Co LP | 52.500 | 5.739 | ||||||
| 2026-04-28 | 13F | Integrated Advisors Network LLC | 1.951 | -27,28 | 295 | 0,68 | ||||
| 2026-03-03 | 13F | Employees Provident Fund Board | 1.100.000 | 120.241 | ||||||
| 2026-02-03 | 13F | Morse Asset Management, Inc | 174 | -65,82 | 19 | -73,61 | ||||
| 2026-02-17 | 13F | Prelude Capital Management, Llc | 7.772 | 85,05 | 850 | 42,93 | ||||
| 2026-04-28 | 13F | FUKOKU MUTUAL LIFE INSURANCE Co | 10.000 | 0,00 | 1.513 | 38,33 | ||||
| 2026-01-23 | 13F | Blue Fin Capital, Inc. | 22.733 | -31,33 | 2.485 | -46,96 | ||||
| 2026-02-13 | 13F | Gts Securities Llc | 7.327 | 11,12 | 801 | -14,16 | ||||
| 2026-02-17 | 13F | Fountainhead AM, LLC | 0 | -100,00 | 0 | |||||
| 2026-02-11 | 13F | Ameritas Investment Partners, Inc. | 5.002 | 9,81 | 547 | -15,22 | ||||
| 2026-04-16 | 13F | Diversified Trust Co | 1.528 | 231 | ||||||
| 2026-04-28 | 13F | Whittier Trust Co Of Nevada Inc | 24.126 | 3.589 | ||||||
| 2026-01-27 | 13F | Zurcher Kantonalbank (Zurich Cantonalbank) | 24.188 | 34,71 | 2.644 | 4,06 | ||||
| 2026-02-04 | 13F | Meridian Wealth Management, LLC | 3.342 | 30,04 | 365 | 0,55 | ||||
| 2026-01-13 | 13F | Stonehage Fleming Financial Services Holdings Ltd | 2.341 | 0,00 | 256 | -22,96 | ||||
| 2026-02-17 | 13F | DV Trading LLC | 61 | 7 | ||||||
| 2025-11-13 | 13F | IPG Investment Advisors LLC | 0 | -100,00 | 0 | |||||
| 2026-02-26 | 13F | Anchor Investment Management, LLC | 0 | -100,00 | 0 | |||||
| 2026-04-30 | 13F | Manning & Napier Advisors Llc | 11 | 1.000,00 | 2 | |||||
| 2026-02-17 | 13F | Summit Trail Advisors, Llc | 2.101 | -60,56 | 230 | -69,59 | ||||
| 2026-02-18 | 13F | Beacon Pointe Advisors, LLC | 2.930 | -22,24 | 320 | -39,96 | ||||
| 2026-01-16 | 13F | Empirical Financial Services, LLC d.b.a. Empirical Wealth Management | 3.096 | 18,03 | 338 | -8,89 | ||||
| 2026-04-22 | 13F | Atlantic Edge Private Wealth Management, LLC | 1.250 | 0,00 | 189 | 38,97 | ||||
| 2026-02-17 | 13F | Wellington Management Group Llp | Call | 0 | -100,00 | 0 | -100,00 | |||
| 2025-11-14 | 13F | Point72 (DIFC) Ltd | 0 | -100,00 | 0 | -100,00 | ||||
| 2025-11-14 | 13F | ExodusPoint Capital Management, LP | 0 | -100,00 | 0 | -100,00 | ||||
| 2026-02-17 | 13F | Two Sigma Securities, Llc | 3.650 | 120,41 | 399 | 70,09 | ||||
| 2026-04-15 | 13F | Sage Capital Management, LLC | 2.231 | 0,00 | 338 | 38,68 | ||||
| 2026-02-17 | 13F | Signature Equity Partners, LLC | 367 | 40 | ||||||
| 2026-02-12 | 13F | Great Valley Advisor Group, Inc. | 0 | -100,00 | 0 | |||||
| 2026-02-10 | 13F | Telligent Fund, LP | 0 | -100,00 | 0 | -100,00 | ||||
| 2026-04-16 | 13F | Fortem Financial Group, Llc | 7.843 | -13,37 | 1.186 | 19,92 | ||||
| 2026-02-11 | 13F | Meiji Yasuda Life Insurance Co | 7.679 | 0,00 | 839 | -22,74 | ||||
| 2026-02-11 | 13F | Cerity Partners LLC | 13.525 | -1,48 | 1.479 | -24,05 | ||||
| 2026-02-13 | 13F | State Street Corp | 284.200 | -39,96 | 31.066 | -53,61 | ||||
| 2026-02-17 | 13F | Edmond De Rothschild Holding S.a. | 6.116 | 41,41 | 669 | 9,33 | ||||
| 2026-02-12 | 13F | Colonial Trust Advisors | 67 | 0,00 | 7 | -22,22 | ||||
| 2026-02-17 | 13F | Perennial Investment Advisors, LLC | 0 | -100,00 | 0 | -100,00 | ||||
| 2026-04-16 | 13F | Stanley-Laman Group, Ltd. | 47.189 | 8,69 | 7.139 | 50,43 | ||||
| 2026-02-12 | 13F | DRW Securities, LLC | Put | 21.700 | -14,57 | 2.372 | -33,91 | |||
| 2026-04-22 | 13F | Stone House Investment Management, LLC | 44 | 7 | ||||||
| 2026-02-12 | 13F | DRW Securities, LLC | 21.700 | 1.219,95 | 2.372 | 922,41 | ||||
| 2026-02-04 | 13F | Ameritas Advisory Services, LLC | 0 | -100,00 | 0 | -100,00 | ||||
| 2026-02-12 | 13F | Jane Street Group, Llc | 62.361 | -63,45 | 6.817 | -71,77 | ||||
| 2026-02-12 | 13F | Jane Street Group, Llc | Put | 7.034.500 | 4,88 | 768.941 | -18,97 | |||
| 2026-02-12 | 13F | Jane Street Group, Llc | Call | 5.699.500 | 3,33 | 623.012 | -20,17 | |||
| 2026-05-01 | 13F | Rakuten Securities, Inc. | 10.667 | -36,93 | 1.614 | -12,72 | ||||
| 2026-04-28 | 13F | Argonautica Private Wealth Management, Inc | 4.229 | 13,29 | 640 | 56,62 | ||||
| 2026-05-01 | 13F | Global Assets Advisory, LLC | 400 | 61 | ||||||
| 2025-11-14 | 13F | Squarepoint Ops LLC | 0 | -100,00 | 0 | -100,00 | ||||
| 2026-02-13 | 13F | Squarepoint Ops LLC | Call | 101.300 | -89,30 | 11.073 | -91,74 | |||
| 2026-02-17 | 13F | Cim Investment Mangement Inc | 8.669 | 0,00 | 948 | -22,76 | ||||
| 2026-02-13 | 13F | Squarepoint Ops LLC | Put | 196.200 | 188,53 | 21.447 | 122,91 | |||
| 2026-04-23 | 13F | TFC Financial Management | 316 | 48 | ||||||
| 2026-04-27 | 13F | Tanglewood Legacy Advisors, LLC | 50 | 0,00 | 8 | 40,00 | ||||
| 2026-04-30 | 13F | Mitsubishi UFJ Morgan Stanley Securities Co., Ltd. | 6.057 | -30,70 | 916 | -4,08 | ||||
| 2026-02-13 | 13F | Siren, L.L.C. | 21.500 | 2.350 | ||||||
| 2025-11-12 | 13F | Botty Investors LLC | 0 | -100,00 | 0 | -100,00 | ||||
| 2026-04-28 | 13F | SBI Okasan Asset Management Co.Ltd. | 5.400 | -14,65 | 740 | 5,72 | ||||
| 2026-02-09 | 13F | Leavell Investment Management, Inc. | 3.695 | -43,97 | 404 | -56,81 | ||||
| 2026-02-17 | 13F | Northern Trust Corp | 5.846 | 37,13 | 639 | 5,97 | ||||
| 2026-04-10 | 13F | Perigon Wealth Management, LLC | 5.741 | 37,64 | 868 | 90,77 | ||||
| 2026-02-17 | 13F | Gilder Gagnon Howe & Co Llc | 366.729 | 5,36 | 40.087 | -18,60 | ||||
| 2026-02-12 | 13F | Hudock, Inc. | 2.081 | 0,00 | 227 | -22,79 | ||||
| 2025-11-10 | 13F | Adviser Investments LLC | 0 | -100,00 | 0 | |||||
| 2025-11-04 | 13F | Guerra Advisors Inc | 102 | 14 | ||||||
| 2026-02-13 | 13F | Vontobel Holding Ltd. | Call | 5.000 | 66,67 | 547 | 28,77 | |||
| 2026-02-13 | 13F | Vontobel Holding Ltd. | 25.627 | -45,26 | 2.801 | -57,71 | ||||
| 2026-02-13 | 13F | Marshall Wace, Llp | 1.128.252 | 123.329 | ||||||
| 2026-02-17 | 13F | VestGen Advisors, LLC | 25.202 | 487,60 | 2.755 | 354,46 | ||||
| 2025-11-17 | 13F | WJ Wealth Management, LLC | 1.550 | 0,00 | 219 | -12,40 | ||||
| 2026-04-21 | 13F | Pinnacle Associates Ltd | 38.087 | 15,83 | 5.762 | 60,29 | ||||
| 2026-01-23 | 13F | Diversify Advisory Services, LLC | 65.455 | -5,83 | 6.924 | -40,95 | ||||
| 2026-02-13 | 13F | Charles Schwab Investment Management Inc | 20.228 | -23,55 | 2.211 | -40,93 | ||||
| 2026-02-17 | 13F | Aquatic Capital Management LLC | 29.349 | 3.208 | ||||||
| 2026-04-28 | 13F | SBI Securities Co., Ltd. | 94.085 | -13,27 | 14.233 | 20,03 | ||||
| 2026-04-23 | 13F | Forum Financial Management, LP | 1.678 | 254 | ||||||
| 2026-02-17 | 13F | Polar Asset Management Partners Inc. | 0 | -100,00 | 0 | -100,00 | ||||
| 2026-02-17 | 13F | Cetera Investment Advisers | 46.399 | 3,65 | 5.072 | -19,94 | ||||
| 2026-04-21 | 13F | Nemes Rush Group LLC | 44 | 0,00 | 7 | 50,00 | ||||
| 2026-02-19 | 13F | Invesco Ltd. | 2.426.850 | 36,95 | 265.279 | 5,80 | ||||
| 2026-02-10 | 13F | Goldman Sachs Group Inc | Put | 2.098.700 | -17,44 | 229.409 | -36,21 | |||
| 2026-04-20 | 13F | Tower View Investment Management & Research LLC | 17.695 | -12,19 | 2.677 | 21,53 | ||||
| 2026-02-10 | 13F | Goldman Sachs Group Inc | Call | 2.367.000 | -2,03 | 258.737 | -24,31 | |||
| 2026-02-10 | 13F | Goldman Sachs Group Inc | 3.873.957 | 13,62 | 423.462 | -12,22 | ||||
| 2026-02-13 | 13F | Fiduciary Trust Co | 7.498 | -12,50 | 820 | -32,43 | ||||
| 2026-04-29 | 13F | Harbour Capital Advisors, LLC | 8.231 | 2,72 | 1.618 | 75,95 | ||||
| 2026-01-14 | 13F | ORG Partners LLC | 30 | -91,45 | 3 | -93,88 | ||||
| 2025-11-05 | 13F | State Of Michigan Retirement System | 0 | -100,00 | 0 | |||||
| 2026-04-28 | 13F | Nbt Bank N A /ny | 15 | -86,24 | 2 | 100,00 | ||||
| 2026-02-18 | 13F | EP Wealth Advisors, Inc. | 2.317 | 253 | ||||||
| 2026-01-28 | 13F | B. Metzler seel. Sohn & Co. AG | 5.225 | -69,63 | 571 | -76,54 | ||||
| 2026-02-17 | 13F | Advisory Services Network, LLC | 18.355 | 2,22 | 2.006 | -21,02 | ||||
| 2026-02-17 | 13F | Ardsley Advisory Partners Lp | 0 | -100,00 | 0 | |||||
| 2026-02-20 | 13F | Kovitz Investment Group Partners, LLC | 0 | -100,00 | 0 | -100,00 | ||||
| 2026-03-16 | 13F/A | Rockefeller Capital Management L.P. | 26.745 | 0,65 | 2.923 | -22,24 | ||||
| 2026-04-16 | 13F | Balboa Wealth Partners | 2.925 | 0,58 | 442 | 39,43 | ||||
| 2026-04-22 | 13F | Apollon Wealth Management, LLC | 1.422 | 215 | ||||||
| 2026-04-23 | 13F | Cornerstone Wealth Management, LLC | 4.119 | -15,37 | 623 | 17,11 | ||||
| 2026-04-21 | 13F | Wealth Effects Llc | 1.725 | 261 | ||||||
| 2026-04-21 | 13F | Robeco Institutional Asset Management B.V. | 570.263 | -0,15 | 86.269 | 38,18 | ||||
| 2026-02-05 | 13F | Kapstone Financial Advisors LLC | 0 | -100,00 | 0 | -100,00 | ||||
| 2026-01-30 | 13F | Caldwell Securities, Inc | 10 | 0,00 | 1 | 0,00 | ||||
| 2025-11-10 | 13F | Prakash Investment Advisors Llc | 0 | -100,00 | 0 | -100,00 | ||||
| 2026-04-27 | 13F | Independent Solutions Wealth Management, LLC | 15.036 | 13,35 | 2.275 | 56,94 | ||||
| 2026-02-11 | 13F | O'shaughnessy Asset Management, Llc | 1.884 | 1,07 | 206 | -22,05 | ||||
| 2026-04-24 | 13F | National Asset Management, Inc. | 5.122 | -9,35 | 701 | 13,61 | ||||
| 2026-02-02 | 13F | Elite Wealth Management, Inc. | 0 | -100,00 | 0 | -100,00 | ||||
| 2026-02-13 | 13F | Dymon Asia Capital (singapore) Pte. Ltd. | 106.000 | 11.587 | ||||||
| 2026-02-17 | 13F | Millennium Management Llc | Call | 353.800 | 157,12 | 38.674 | 98,64 | |||
| 2025-11-14 | 13F | Sig Brokerage, Lp | 0 | -100,00 | 0 | -100,00 | ||||
| 2026-04-20 | 13F | TFB Advisors LLC | 3.763 | 5,55 | 569 | 46,27 | ||||
| 2026-02-17 | 13F | Millennium Management Llc | Put | 585.900 | 133,99 | 64.045 | 80,77 | |||
| 2026-02-17 | 13F | Millennium Management Llc | 143.691 | 16,25 | 15.707 | -10,19 | ||||
| 2026-02-17 | 13F | Rakuten Investment Management, Inc. | 20.466 | 154,05 | 2.262 | 71,81 | ||||
| 2026-04-06 | 13F | GAMMA Investing LLC | 342 | 185,00 | 52 | 292,31 | ||||
| 2026-04-08 | 13F | Mirador Capital Partners LP | 2.755 | 4,36 | 417 | 44,44 | ||||
| 2026-01-21 | 13F | Crews Bank & Trust | 35 | 0,00 | 4 | -25,00 | ||||
| 2026-02-06 | 13F | Mizuho Markets Cayman LP | 15.966 | -3,55 | 1.745 | -25,49 | ||||
| 2026-04-10 | 13F | Abound Wealth Management | 194 | 0,00 | 29 | 38,10 | ||||
| 2026-02-17 | 13F | Two Sigma Investments, Lp | 1.259.155 | 501,28 | 137.638 | 364,54 | ||||
| 2026-02-17 | 13F | Adams Wealth Management | 22.405 | 17,72 | 2.449 | -9,03 | ||||
| 2026-04-02 | 13F | Hilltop National Bank | 67 | 0,00 | 10 | 42,86 | ||||
| 2026-02-06 | 13F | Kingdom Financial Group LLC. | 53 | 6 | ||||||
| 2026-02-17 | 13F | Two Sigma Investments, Lp | Put | 75.000 | 3.650,00 | 8.198 | 2.807,09 | |||
| 2026-02-17 | 13F | Two Sigma Investments, Lp | Call | 77.400 | 8.461 | |||||
| 2026-02-17 | 13F | Tudor Investment Corp Et Al | 0 | -100,00 | 0 | -100,00 | ||||
| 2026-04-28 | 13F | Bfsg, Llc | 700 | 0,00 | 106 | 38,16 | ||||
| 2026-04-21 | 13F | Wedbush Securities Inc | 2.307 | -43,26 | 0 | |||||
| 2025-11-14 | 13F | Castle Hook Partners LP | 0 | -100,00 | 0 | -100,00 | ||||
| 2026-04-28 | 13F | Robertson Stephens Wealth Management, LLC | 3.060 | -66,65 | 463 | -53,89 | ||||
| 2026-02-06 | 13F | Empirical Asset Management, LLC | 9.000 | -2,17 | 984 | -24,44 | ||||
| 2026-04-24 | 13F | UMA Financial Services, Inc. | 36 | 0,00 | 5 | 66,67 | ||||
| 2026-04-28 | 13F | Belpointe Asset Management LLC | 5.299 | 117,17 | 802 | 201,13 | ||||
| 2026-05-01 | 13F | Hantz Financial Services, Inc. | 3.602 | 105,13 | 1 | |||||
| 2026-02-11 | 13F | First Command Advisory Services, Inc. | 36 | 4 | ||||||
| 2026-04-23 | 13F | Asset Planning,Inc | 100 | 0,00 | 15 | 50,00 | ||||
| 2026-02-17 | 13F | Duquesne Family Office LLC | 0 | -100,00 | 0 | -100,00 | ||||
| 2026-04-23 | 13F | Harbor Investment Advisory, Llc | 150 | 0,00 | 23 | 37,50 | ||||
| 2026-04-29 | 13F | Cary Street Partner Investment Advisory Llc | 23 | 3 | ||||||
| 2026-02-17 | 13F | Dimension Capital Management Llc | 0 | -100,00 | 0 | -100,00 | ||||
| 2026-04-22 | 13F | Barnes Dennig Private Wealth Management LLC | 39 | 0,00 | 6 | 25,00 | ||||
| 2026-02-11 | 13F | Capital International Sarl | 45.440 | 7,21 | 4.967 | -17,16 | ||||
| 2026-04-10 | 13F | First Bank & Trust | 0 | -100,00 | 0 | |||||
| 2025-11-04 | 13F | State of Wyoming | 0 | -100,00 | 0 | -100,00 | ||||
| 2025-11-12 | 13F | HAP Trading, LLC | Put | 39.900 | 524 | |||||
| 2025-11-12 | 13F | HAP Trading, LLC | Call | 50.500 | 859 | |||||
| 2025-11-12 | 13F | HAP Trading, LLC | 12.630 | 1.787 | ||||||
| 2026-04-22 | 13F | Janney Montgomery Scott LLC | 49.057 | 47,86 | 7 | 133,33 | ||||
| 2026-02-06 | 13F | Meiji Yasuda Asset Management Co Ltd. | 16.741 | -7,57 | 1.830 | -28,61 | ||||
| 2026-02-11 | 13F | Parallel Advisors, LLC | 2.049 | 18,51 | 224 | -8,20 | ||||
| 2026-02-13 | 13F | Oakum Bay Capital LLC | 200 | 22 | ||||||
| 2026-02-18 | 13F | CacheTech Inc. | 25.665 | 24,32 | 2.805 | -3,97 | ||||
| 2026-02-13 | 13F | JustInvest LLC | 3.185 | 2,54 | 348 | -20,73 | ||||
| 2026-02-13 | 13F | Centaurus Financial, Inc. | 10.058 | 14,95 | 1 | 0,00 | ||||
| 2026-04-21 | 13F | Crown Wealth Group, LLC | 2.604 | 0,00 | 394 | 38,38 | ||||
| 2026-04-17 | 13F | Murphy & Mullick Capital Management Corp | 876 | -18,21 | 133 | 12,82 | ||||
| 2026-04-27 | 13F | Mount Yale Investment Advisors, LLC | 13.443 | 8,29 | 2.034 | 49,93 | ||||
| 2026-04-27 | 13F | Leonteq Securities AG | 9.371 | -72,28 | 1.418 | -61,64 | ||||
| 2026-02-13 | 13F | B & T Capital Management DBA Alpha Capital Management | 6.885 | 18,85 | 753 | -8,18 | ||||
| 2026-02-17 | 13F | Public Employees Retirement System Of Ohio | 106.783 | 17,63 | 11.672 | -9,12 | ||||
| 2025-11-07 | 13F | Rothschild Investment Llc | 0 | -100,00 | 0 | |||||
| 2025-11-14 | 13F | Prudential Plc | 0 | -100,00 | 0 | -100,00 | ||||
| 2026-04-20 | 13F | Godsey & Gibb Associates | 250 | 0,00 | 38 | 37,04 | ||||
| 2026-04-14 | 13F | Focus Financial Network, Inc. | 4.646 | 15,83 | 703 | 60,27 | ||||
| 2026-02-09 | 13F | Coldstream Capital Management Inc | 3.065 | 20,43 | 335 | -7,22 | ||||
| 2026-01-23 | 13F | Assetmark, Inc | 65.478 | -3,27 | 7.157 | -25,27 | ||||
| 2026-02-17 | 13F | Voloridge Investment Management, Llc | 343.576 | 37.556 | ||||||
| 2026-02-06 | 13F | New Millennium Group LLC | 74 | 0,00 | 8 | -20,00 | ||||
| 2026-04-27 | 13F | Nixon Peabody Trust Co | 47.107 | 7.126 | ||||||
| 2026-02-17 | 13F | Mercer Global Advisors Inc /adv | 3.948 | -84,43 | 432 | -86,30 | ||||
| 2026-02-12 | 13F | Voya Investment Management Llc | 259.232 | 28,05 | 28.337 | -1,07 | ||||
| 2026-02-17 | 13F | NCP Inc. | 36 | -99,94 | 4 | -99,96 | ||||
| 2026-04-15 | 13F | Merit Financial Group, LLC | 1.438 | -35,40 | 217 | -10,70 | ||||
| 2026-02-13 | 13F | Caitong International Asset Management Co., Ltd | 0 | -100,00 | 0 | |||||
| 2025-11-07 | 13F | Glaxis Capital Management, LLC | 0 | -100,00 | 0 | |||||
| 2025-11-12 | 13F | Accent Capital Management, LLC | 0 | -100,00 | 0 | -100,00 | ||||
| 2026-04-15 | 13F | Exchange Traded Concepts, Llc | 39.095 | -52,48 | 5.914 | -34,24 | ||||
| 2026-01-09 | 13F | Capital CS Group, LLC | 0 | -100,00 | 0 | -100,00 | ||||
| 2026-04-29 | 13F | Rye Brook Capital LLC | 0 | -100,00 | 0 | |||||
| 2026-04-14 | 13F | Tradewinds Capital Management, LLC | 20 | 0,00 | 3 | 50,00 | ||||
| 2026-02-11 | 13F | Twin Tree Management, LP | Call | 40.400 | -57,87 | 4.416 | -67,45 | |||
| 2026-02-12 | 13F | Steward Partners Investment Advisory, Llc | 9.816 | -4,65 | 1.073 | -26,37 | ||||
| 2026-02-11 | 13F | Twin Tree Management, LP | Put | 334.900 | -58,25 | 36.608 | -67,74 | |||
| 2026-02-13 | 13F | Heritage Wealth Advisors | 40 | 0,00 | 4 | -20,00 | ||||
| 2026-04-27 | 13F | Prasad Wealth Partners, LLC | 6.999 | -0,67 | 1.059 | 37,40 | ||||
| 2026-02-11 | 13F | Twin Tree Management, LP | 141.079 | 27,22 | 15.421 | -1,71 | ||||
| 2026-02-17 | 13F | Gladstone Institutional Advisory LLC | 3.325 | -9,10 | 363 | -29,79 | ||||
| 2026-04-08 | 13F | Parisi Gray Wealth Management | 2.409 | 5,47 | 364 | 46,18 | ||||
| 2026-01-26 | 13F | Cwm, Llc | 130.460 | 5,19 | 14 | -17,65 | ||||
| 2026-02-12 | 13F | Principal Securities, Inc. | 0 | -100,00 | 0 | |||||
| 2026-04-24 | 13F | Key FInancial Inc | 100 | 15 | ||||||
| 2026-02-06 | 13F | Larson Financial Group LLC | 2.246 | 189,81 | 246 | 124,77 | ||||
| 2026-02-13 | 13F | Natixis | 118.941 | 74,60 | 13.001 | 34,89 | ||||
| 2026-02-13 | 13F | Macquarie Group Ltd | 156 | 0,00 | 17 | -22,73 | ||||
| 2026-02-13 | 13F | Colony Group, LLC | 109.245 | 11,14 | 14.934 | 7,38 | ||||
| 2026-04-24 | 13F | USS Investment Management Ltd | 30.229 | 6,64 | 4.570 | 47,43 | ||||
| 2026-04-08 | 13F | E Fund Management (Hong Kong) Co., Ltd. | 4.315 | 37,11 | 653 | 94,05 | ||||
| 2025-11-13 | 13F | GQG Partners LLC | 0 | -100,00 | 0 | |||||
| 2026-02-05 | 13F | Phoenix Holdings Ltd. | 0 | -100,00 | 0 | -100,00 | ||||
| 2026-02-17 | 13F | Capstone Investment Advisors, Llc | 71.582 | 646,73 | 7.825 | 476,99 | ||||
| 2026-02-17 | 13F | Capstone Investment Advisors, Llc | Put | 2.700 | -22,86 | 295 | -40,40 | |||
| 2026-02-10 | 13F | Thoroughbred Financial Services, Llc | 8.824 | -4,60 | 1 | -100,00 | ||||
| 2026-04-29 | 13F | WPG Advisers, LLC | 154 | 0,00 | 23 | 43,75 | ||||
| 2026-01-27 | 13F | TD Waterhouse Canada Inc. | 1.550 | -35,23 | 169 | -52,92 | ||||
| 2026-02-12 | 13F | Bank of Jackson Hole Trust | 0 | -100,00 | 0 | |||||
| 2026-04-13 | 13F | IFP Advisors, Inc | 3.375 | 211,06 | 511 | 332,20 | ||||
| 2026-02-05 | 13F | STF Management LP | 846 | -53,18 | 92 | -63,92 | ||||
| 2026-02-05 | 13F | Allworth Financial LP | 2.233 | -8,67 | 244 | -29,28 | ||||
| 2026-04-28 | 13F | Cordoba Advisory Partners LLC | 1.682 | 254 | ||||||
| 2026-02-13 | 13F | Hurley Capital, LLC | 26 | 0,00 | 3 | -33,33 | ||||
| 2026-02-17 | 13F | Ardmore Road Asset Management LP | 10.000 | 1.093 | ||||||
| 2026-02-12 | 13F | CMT Capital Markets Trading GmbH | 0 | -100,00 | 0 | |||||
| 2026-04-14 | 13F | Westend Capital Management LLC | 53.699 | 8.124 | ||||||
| 2026-04-28 | 13F | Golden State Wealth Management, LLC | 4.810 | 10,07 | 728 | 52,41 | ||||
| 2026-02-11 | 13F | Modus Advisors, LLC | 27.497 | 24,93 | 3.006 | -3,50 | ||||
| 2026-05-01 | 13F | Compass Financial Services Inc | 0 | -100,00 | 0 | |||||
| 2026-04-29 | 13F | WealthPLAN Partners, LLC | 0 | -100,00 | 0 | |||||
| 2026-04-29 | 13F | Addison Capital Co | 1.977 | 0,00 | 299 | 38,43 | ||||
| 2026-01-30 | 13F | Us Bancorp \de\ | 6.078 | -6,28 | 664 | -27,59 | ||||
| 2026-01-16 | 13F | First Community Trust Na | 0 | -100,00 | 0 | |||||
| 2025-11-14 | 13F | Boothbay Fund Management, Llc | Call | 0 | -100,00 | 0 | -100,00 | |||
| 2026-02-12 | 13F | Scotia Capital Inc. | 14.306 | 17,08 | 1.564 | -9,55 | ||||
| 2025-11-14 | 13F | Boothbay Fund Management, Llc | 0 | -100,00 | 0 | -100,00 | ||||
| 2026-02-05 | 13F | Pacific Heights Asset Management Llc | 275.000 | 48,65 | 30.060 | 14,84 | ||||
| 2026-02-17 | 13F | Bank Of America Corp /de/ | 2.345.553 | 30,09 | 256.392 | 0,51 | ||||
| 2026-01-08 | 13F | Adirondack Trust Co | 0 | -100,00 | 0 | |||||
| 2026-02-12 | 13F | Grey Fox Wealth Advisors, LLC | 0 | -100,00 | 0 | |||||
| 2026-02-09 | 13F | Schwarz Dygos Wheeler Investment Advisors Llc | 5.159 | 0,39 | 564 | -22,56 | ||||
| 2025-11-13 | 13F | Hudson Bay Capital Management LP | 0 | -100,00 | 0 | |||||
| 2026-04-14 | 13F | Prospera Financial Services Inc | 19.510 | 630,99 | 2.951 | 914,09 | ||||
| 2026-02-11 | 13F | BI Asset Management Fondsmaeglerselskab A/S | 0 | -100,00 | 0 | |||||
| 2026-02-10 | 13F | Nomura Asset Management Co Ltd | 23.978 | 1,97 | 2.621 | -21,20 | ||||
| 2026-02-17 | 13F | Lagoda Investment Management, L.P. | 28.435 | -26,47 | 3.108 | -43,19 | ||||
| 2026-02-02 | 13F | Lattice Capital Management, LLC | 2.000 | 0,00 | 219 | -22,70 | ||||
| 2026-04-27 | 13F | Tsfg, Llc | 286 | -62,91 | 0 | |||||
| 2026-02-06 | 13F | Berbice Capital Management LLC | 0 | -100,00 | 0 | |||||
| 2026-02-17 | 13F | Nomura Holdings Inc | 213.095 | 137,05 | 23.293 | 83,14 | ||||
| 2026-02-17 | 13F | Wellington Management Group Llp | 2.149.159 | 41,75 | 234.925 | 9,51 | ||||
| 2026-02-12 | 13F | Advisors Asset Management, Inc. | 3.773 | -16,29 | 412 | -35,32 | ||||
| 2026-02-13 | 13F | Palisade Asset Management, LLC | 0 | -100,00 | 0 | |||||
| 2026-02-12 | 13F | Haven Private, LLC | 8.682 | 5,11 | 949 | -18,75 | ||||
| 2026-02-11 | 13F | IMA Wealth, Inc. | 5 | 1 | ||||||
| 2025-11-13 | 13F | Hudson Bay Capital Management LP | Put | 0 | -100,00 | 0 | ||||
| 2026-02-11 | 13F | Primecap Management Co/ca/ | 233.880 | -0,62 | 25.565 | -23,22 | ||||
| 2026-01-29 | 13F | Schnieders Capital Management, Llc. | 0 | -100,00 | 0 | |||||
| 2026-02-10 | 13F | Heritage Trust Co | 2.045 | 5,52 | 224 | -18,61 | ||||
| 2026-04-21 | 13F | Laurel Oak Wealth Management, Llc | 1.421 | 215 | ||||||
| 2026-02-17 | 13F | Tudor Investment Corp Et Al | Put | 234.200 | -51,68 | 25.600 | -62,67 | |||
| 2026-04-20 | 13F | Ronald Blue Trust, Inc. | 3.257 | 73,43 | 493 | 140,00 | ||||
| 2026-02-17 | 13F | Tudor Investment Corp Et Al | Call | 193.100 | -63,78 | 21.108 | -72,02 | |||
| 2026-02-09 | 13F | AIA Group Ltd | 0 | -100,00 | 0 | |||||
| 2026-01-20 | 13F | American National Bank | 0 | -100,00 | 0 | |||||
| 2026-02-12 | 13F | Ensign Peak Advisors, Inc | 0 | -100,00 | 0 | |||||
| 2026-02-10 | 13F | SCS Capital Management LLC | 8.788 | 0,00 | 961 | -22,77 | ||||
| 2026-04-29 | 13F | Strategic Blueprint, LLC | 4.496 | -4,34 | 680 | 32,55 | ||||
| 2026-04-09 | 13F | Veracity Capital LLC | 2.034 | -54,38 | 308 | -36,96 | ||||
| 2026-02-26 | 13F | Oak Grove Capital LLC | 6.500 | -41,96 | 711 | -55,18 | ||||
| 2026-02-03 | 13F | Strengthening Families & Communities, LLC | 52 | 6 | ||||||
| 2026-02-13 | 13F | Wells Fargo & Company/mn | Call | 60.000 | 71,43 | 6.559 | 32,43 | |||
| 2026-02-13 | 13F | Wells Fargo & Company/mn | 365.046 | 5,12 | 39.903 | -18,79 | ||||
| 2026-02-13 | 13F | BNP Paribas Asset Management Holding S.A. | 100.143 | 2.919,99 | 17 | |||||
| 2026-02-13 | 13F | Wells Fargo & Company/mn | Put | 90.000 | 9.838 | |||||
| 2026-02-12 | 13F | Federated Hermes, Inc. | 24.292 | 2.655 | ||||||
| 2026-02-11 | 13F | Harvest Fund Management Co., Ltd | 42.330 | 66,03 | 5 | 33,33 | ||||
| 2026-04-22 | 13F | Gunderson Capital Management Inc. | 45.029 | 6.812 | ||||||
| 2026-02-03 | 13F | Mitsubishi UFJ Kokusai Asset Management Co., Ltd. | 21.522 | -20,21 | 2.469 | -35,30 | ||||
| 2026-01-27 | 13F | Bosman Wealth Management, LLC | 0 | -100,00 | 0 | |||||
| 2026-02-06 | 13F | HighTower Advisors, LLC | 22.755 | -25,46 | 2.487 | -42,42 | ||||
| 2026-02-17 | 13F | Guggenheim Capital Llc | 50.349 | 11,89 | 5.504 | -13,56 | ||||
| 2026-02-17 | 13F | Strive Financial Group ,LLC | 12 | 1 | ||||||
| 2026-02-10 | 13F | Daiwa Securities Group Inc. | 14.177 | 14,36 | 2 | 0,00 | ||||
| 2026-04-14 | 13F | Nbc Securities, Inc. | 320 | 60,00 | 48 | 128,57 | ||||
| 2026-04-29 | 13F | Cary Street Partners Financial Llc | 1.335 | 202 | ||||||
| 2026-04-09 | 13F | Sanders Morris Harris Llc | 0 | -100,00 | 0 | |||||
| 2026-02-04 | 13F | Pacer Advisors, Inc. | 0 | -100,00 | 0 | |||||
| 2026-02-09 | 13F | Geode Capital Management, Llc | 115.743 | -2,11 | 12.652 | -24,38 | ||||
| 2026-02-09 | 13F | Legal & General Group Plc | 173.515 | -15,35 | 18.967 | -34,61 | ||||
| 2026-02-17 | 13F | Stony Point Capital LLC | 0 | -100,00 | 0 | |||||
| 2026-02-11 | 13F | Capital World Investors | 1.165.776 | -75,57 | 127.431 | -81,13 | ||||
| 2026-02-03 | 13F | Anfield Capital Management, LLC | 20 | 0,00 | 2 | 0,00 | ||||
| 2026-04-08 | 13F | Gainplan LLC | 3.500 | 529 | ||||||
| 2026-02-05 | 13F | Atria Investments Llc | 0 | -100,00 | 0 | |||||
| 2026-02-09 | 13F | Fisher Asset Management, LLC | 2.732 | 299 | ||||||
| 2026-02-17 | 13F | Wealth Watch Advisors, INC | 3 | 0,00 | 0 | |||||
| 2026-02-10 | 13F | Mawer Investment Management Ltd. | 0 | -100,00 | 0 | |||||
| 2026-04-30 | 13F | Whipplewood Advisors, LLC | 0 | -100,00 | 0 | |||||
| 2026-02-14 | 13F | Bank of Marin | 4.685 | 512 | ||||||
| 2026-04-28 | 13F | China Universal Asset Management Co., Ltd. | 3.928 | 0,33 | 594 | 39,11 | ||||
| 2026-02-13 | 13F | Toroso Investments, LLC | 211.838 | 3,92 | 23.156 | -19,71 | ||||
| 2026-04-14 | 13F | Covenant Asset Management, LLC | 2.800 | -91,59 | 424 | -88,38 | ||||
| 2026-04-07 | 13F | Eastern Bank | 0 | -100,00 | 0 | |||||
| 2026-04-30 | 13F | Clear Street Markets Llc | 0 | -100,00 | 0 | |||||
| 2026-02-13 | 13F | Toroso Investments, LLC | Call | 3.600 | 111,76 | 394 | 63,75 | |||
| 2026-02-20 | 13F/A | Capital Markets Trading UK LLP | 5.212 | 9,66 | 1 | |||||
| 2026-04-10 | 13F | Franklin Street Advisors Inc /nc | 0 | -100,00 | 0 | |||||
| 2026-04-27 | 13F | Qrg Capital Management, Inc. | 7.261 | 37,34 | 1.098 | 90,29 | ||||
| 2026-05-01 | 13F | Diversify Wealth Management, Llc | 67.852 | 13.685 | ||||||
| 2026-04-21 | 13F | Financial Consulate, Inc | 320 | 0,00 | 48 | 41,18 | ||||
| 2025-11-21 | 13F/A | CIBC Bancorp USA Inc. | 5.001 | 708 | ||||||
| 2026-01-30 | 13F | Catalytic Wealth RIA, LLC | 0 | -100,00 | 0 | |||||
| 2026-01-14 | 13F | Congress Park Capital LLC | 0 | -100,00 | 0 | |||||
| 2026-02-03 | 13F | Robeco Schweiz AG | 662.665 | -1,89 | 72.436 | -24,20 | ||||
| 2026-03-05 | 13F/A | Banco Santander, S.A. | 0 | -100,00 | 0 | |||||
| 2026-04-17 | 13F | Willner & Heller, Llc | 12.413 | 10,26 | 1.878 | 52,60 | ||||
| 2026-02-11 | 13F | MCF Advisors LLC | 684 | 1,94 | 75 | -21,28 | ||||
| 2026-04-20 | 13F | Strong Retirement Solutions LLC | 2.155 | -18,53 | 326 | 12,80 | ||||
| 2026-02-12 | 13F | Sumitomo Mitsui Financial Group, Inc. | 0 | -100,00 | 0 | |||||
| 2026-03-06 | 13F | Union Savings Bank | 0 | -100,00 | 0 | |||||
| 2026-01-21 | 13F | Y.D. More Investments Ltd | 0 | -100,00 | 0 | |||||
| 2026-02-17 | 13F | Family Management Corp | 0 | -100,00 | 0 | |||||
| 2026-04-23 | 13F | Farmers & Merchants Investments Inc | 100 | 0,00 | 15 | 50,00 | ||||
| 2026-02-12 | 13F | Bank Of Montreal /can/ | 118.374 | 222,62 | 12.939 | 149,26 | ||||
| 2026-02-13 | 13F | Barclays Plc | Call | 1.439.900 | 1,02 | 157.395 | -21,95 | |||
| 2026-02-13 | 13F | Barclays Plc | 967.603 | 46,52 | 105.769 | 13,19 | ||||
| 2026-02-13 | 13F | Barclays Plc | Put | 3.879.400 | 32,92 | 424.057 | 2,69 | |||
| 2026-04-20 | 13F | Hilton Head Capital Partners, LLC | 6.984 | 0,56 | 1.057 | 39,13 | ||||
| 2026-04-10 | 13F | Intellectus Partners, LLC | 3.631 | 549 | ||||||
| 2026-02-09 | 13F | Delta Asset Management Llc/tn | 100 | -50,00 | 11 | -64,29 | ||||
| 2026-04-23 | 13F | Chicago Capital, LLC | 28.427 | 66,73 | 4.300 | 130,81 | ||||
| 2026-02-06 | 13F | Gsa Capital Partners Llp | 0 | -100,00 | 0 | |||||
| 2026-02-17 | 13F | Man Group plc | 125.226 | -23,36 | 13.688 | -40,79 | ||||
| 2026-01-27 | 13F | WealthCollab, LLC | 66 | -33,33 | 7 | -50,00 | ||||
| 2026-04-21 | 13F | Vise Technologies, Inc. | 2.450 | 0,00 | 268 | 0,00 | ||||
| 2026-04-24 | 13F | Syntax Research, Inc. | 200 | 30 | ||||||
| 2026-02-03 | 13F | NewEdge Wealth, LLC | 10.408 | 0,00 | 1.138 | -31,79 | ||||
| 2026-04-22 | 13F | Sterling Capital Management LLC | 375 | 1.400,00 | 57 | 2.700,00 | ||||
| 2026-04-30 | 13F | Nisa Investment Advisors, Llc | 27 | 4 | ||||||
| 2026-02-17 | 13F | Brevan Howard Capital Management LP | 0 | -100,00 | 0 | -100,00 | ||||
| 2026-02-17 | 13F | Citadel Advisors Llc | Call | 3.552.000 | -23,38 | 388.269 | -40,80 | |||
| 2025-11-14 | 13F | Axa S.a. | 0 | -100,00 | 0 | |||||
| 2026-02-10 | 13F | Eurizon Capital SGR S.p.A. | 117.654 | 12.861 | ||||||
| 2026-02-17 | 13F | Citadel Advisors Llc | Put | 3.781.600 | 6,49 | 413.367 | -17,73 | |||
| 2026-02-17 | 13F | Citadel Advisors Llc | 506.715 | 617,37 | 55.389 | 454,22 | ||||
| 2026-05-01 | 13F | CenterStar Asset Management, LLC | 0 | -100,00 | 0 | |||||
| 2026-02-17 | 13F | D. E. Shaw & Co., Inc. | 128.215 | 536,30 | 14.015 | 391,58 | ||||
| 2026-02-17 | 13F/A | RBF Capital, LLC | 20.000 | 2.186 | ||||||
| 2026-02-17 | 13F | D. E. Shaw & Co., Inc. | Put | 1.219.100 | 21,41 | 133.260 | -6,20 | |||
| 2026-04-17 | 13F | United Advisor Group, LLC | 4.143 | 41,25 | 627 | 95,63 | ||||
| 2026-02-17 | 13F | D. E. Shaw & Co., Inc. | Call | 588.700 | -11,94 | 64.351 | -31,97 | |||
| 2026-02-17 | 13F | Nwi Management Lp | Call | 0 | -100,00 | 0 | -100,00 | |||
| 2026-02-17 | 13F | Coatue Management Llc | 2.300.000 | 1,78 | 251.413 | -21,37 | ||||
| 2026-01-21 | 13F | Leo Wealth, LLC | 0 | -100,00 | 0 | |||||
| 2026-01-30 | 13F | Sigma Planning Corp | 2.161 | -2,92 | 236 | -24,84 | ||||
| 2026-04-20 | 13F | TrueMark Investments, LLC | 7.592 | 1,43 | 1.149 | 40,34 | ||||
| 2026-04-24 | 13F | Private Advisor Group, LLC | 8.286 | -5,18 | 1.253 | 31,20 | ||||
| 2026-02-17 | 13F | Lazard Asset Management Llc | 7.380 | -14,51 | 807 | -33,99 | ||||
| 2026-04-09 | 13F | Tompkins Financial Corp | 60 | 0,00 | 9 | 50,00 | ||||
| 2026-05-01 | 13F | International Assets Investment Management, Llc | 3.572 | -48,52 | 554 | -27,04 | ||||
| 2026-01-20 | 13F | Westwood Wealth Management | 0 | -100,00 | 0 | |||||
| 2026-02-12 | 13F | Groupe la Francaise | 25.752 | -79,41 | 2.812 | -84,12 | ||||
| 2026-04-08 | 13F | Wealth Enhancement Advisory Services, Llc | 3.997 | -58,35 | 596 | -46,21 | ||||
| 2026-02-13 | 13F | Mariner, LLC | 24.610 | -3,01 | 2.690 | -25,05 | ||||
| 2026-02-10 | 13F | Fideuram Asset Management (Ireland) dac | 14.567 | 1.971 | ||||||
| 2026-04-27 | 13F | Sound Income Strategies, LLC | 459 | 2.600,00 | 71 | 7.000,00 | ||||
| 2025-11-12 | 13F | Perennial Investment Advisors, LLC | Call | 0 | -100,00 | 0 | -100,00 | |||
| 2026-01-28 | 13F | N.E.W. Advisory Services LLC | 185 | 0,00 | 20 | -23,08 | ||||
| 2026-02-17 | 13F | Altimeter Capital Management, LP | 0 | -100,00 | 0 | -100,00 | ||||
| 2026-04-13 | 13F | Gill Capital Partners, Llc | 11 | 2 | ||||||
| 2026-01-07 | 13F | Sagespring Wealth Partners, Llc | 2.254 | 0,71 | 246 | -22,15 | ||||
| 2026-04-20 | 13F | Kestra Private Wealth Services, Llc | 5.534 | 12,55 | 837 | 55,87 | ||||
| 2026-04-21 | 13F | PharVision Advisers, LLC | 0 | -100,00 | 0 | |||||
| 2026-01-12 | 13F | Cordant, Inc. | 0 | -100,00 | 0 | |||||
| 2026-02-13 | 13F | Kilter Group LLC | 0 | -100,00 | 0 | |||||
| 2026-04-28 | 13F | Kingswood Wealth Advisors, Llc | 0 | -100,00 | 0 | |||||
| 2026-02-13 | 13F | Aft, Forsyth & Sober, LLC | 0 | -100,00 | 0 | |||||
| 2026-04-07 | 13F | Crescent Sterling, Ltd. | 1.448 | 219 | ||||||
| 2026-04-27 | 13F | Reynders McVeigh Capital Management, LLC | 114.099 | -0,26 | 17 | 41,67 | ||||
| 2026-02-17 | 13F | Capital Fund Management S.a. | 454.683 | 1.028,25 | 49.701 | 771,64 | ||||
| 2026-01-29 | 13F | Calamos Advisors LLC | 0 | -100,00 | 0 | |||||
| 2026-01-14 | 13F | Hennion & Walsh Asset Management, Inc. | 3.022 | 25,71 | 330 | -2,94 | ||||
| 2026-02-09 | 13F | Wellington Shields Capital Management, LLC | 0 | -100,00 | 0 | |||||
| 2026-02-17 | 13F | Parallax Volatility Advisers, L.P. | Call | 756.900 | 5,90 | 82.737 | -18,18 | |||
| 2026-02-17 | 13F | Parallax Volatility Advisers, L.P. | 210.570 | 72,68 | 23.017 | 33,41 | ||||
| 2026-02-02 | 13F | Avidian Wealth Solutions, LLC | 0 | -100,00 | 0 | |||||
| 2026-02-04 | 13F | Independent Advisor Alliance | 3.073 | -0,87 | 336 | -23,52 | ||||
| 2026-02-17 | 13F | Parallax Volatility Advisers, L.P. | Put | 483.300 | 34,47 | 52.830 | 3,89 | |||
| 2026-04-13 | 13F | Global X Japan Co., Ltd. | 7.832 | 2,50 | 1.185 | 41,80 | ||||
| 2026-04-23 | 13F | J.w. Cole Advisors, Inc. | 7.341 | 172,39 | 1.111 | 312,64 | ||||
| 2026-02-17 | 13F | Ameriprise Financial Inc | 436.799 | 111,66 | 47.789 | 63,67 | ||||
| 2026-04-28 | 13F | Handelsbanken Fonder AB | 81.489 | 1,33 | 12 | 50,00 | ||||
| 2025-11-07 | 13F | Beacon Capital Management, LLC | 0 | -100,00 | 0 | |||||
| 2025-11-14 | 13F | Public Investment Fund | Call | 0 | -100,00 | 0 | -100,00 | |||
| 2026-02-12 | 13F | Circle Wealth Management, LLC | 0 | -100,00 | 0 | |||||
| 2026-02-13 | 13F | Iyo Bank, Ltd. | 6.514 | 0,00 | 712 | -22,69 | ||||
| 2025-11-21 | 13F | Watts Gwilliam & Co., LLC | 8.069 | 0,00 | 1.142 | -3,47 | ||||
| 2026-01-12 | 13F | Rialto Wealth Management, LLC | 1.000 | 0,00 | 109 | -22,70 | ||||
| 2026-01-29 | 13F | UBS Group AG | Put | 478.300 | 108,77 | 52.283 | 61,29 | |||
| 2026-01-29 | 13F | UBS Group AG | Call | 396.476 | -17,49 | 43.339 | -36,25 | |||
| 2026-02-06 | 13F | Partners Group Holding AG | 7.300 | 798 | ||||||
| 2026-01-09 | 13F | Capital CS Group, LLC | Put | 22.500 | 247 | |||||
| 2026-02-04 | 13F | Pandora Wealth, Inc. | 500 | 0,00 | 55 | -22,86 | ||||
| 2026-02-05 | 13F | Elyxium Wealth, LLC | 50 | 5 | ||||||
| 2026-04-30 | 13F | Costello Asset Management, INC | 3.257 | 1,05 | 493 | 39,77 | ||||
| 2025-11-12 | 13F | Park Square Financial Group, LLC | 0 | -100,00 | 0 | |||||
| 2026-02-11 | 13F | Telemark Asset Management, LLC | 50.000 | 0,00 | 5.466 | -22,75 | ||||
| 2026-02-11 | 13F | Allianz Asset Management GmbH | 37.330 | -23,21 | 4.081 | -40,68 | ||||
| 2026-02-13 | 13F | Itau Unibanco Holding S.A. | 34.650 | 45.492,11 | 3.788 | 37.770,00 | ||||
| 2026-02-17 | 13F | Quantinno Capital Management LP | 4.735 | 8,35 | 518 | -16,34 | ||||
| 2026-02-12 | 13F | Intrinsic Edge Capital Management LLC | 0 | -100,00 | 0 | |||||
| 2025-11-13 | 13F | Oribel Capital Management, LP | 0 | -100,00 | 0 | -100,00 | ||||
| 2026-02-04 | 13F | HighPoint Advisor Group LLC | 5.795 | 31,70 | 633 | 1,77 | ||||
| 2026-02-17 | 13F | Susquehanna Portfolio Strategies, LLC | 11.604 | -93,73 | 1.268 | -95,16 | ||||
| 2026-01-26 | 13F | Mirae Asset Global Investments Co., Ltd. | 417.775 | 13,54 | 45.667 | -12,29 | ||||
| 2026-02-13 | 13F | Kirtland Hills Capital Management, Llc | 0 | -100,00 | 0 | |||||
| 2026-02-17 | 13F | Woodline Partners LP | 61.806 | 6.756 | ||||||
| 2026-04-15 | 13F | Activest Wealth Management | 440 | 201,37 | 67 | 312,50 | ||||
| 2026-02-17 | 13F | Trexquant Investment LP | 43.869 | 4.795 | ||||||
| 2026-02-09 | 13F | Kingsview Wealth Management, LLC | 0 | -100,00 | 0 | |||||
| 2026-02-17 | 13F | Qube Research & Technologies Ltd | 47.925 | 5.239 | ||||||
| 2026-04-27 | 13F | HB Wealth Management, LLC | 1.422 | 215 | ||||||
| 2026-04-13 | 13F | Mather Group, Llc. | 163 | 25 | ||||||
| 2026-02-05 | 13F | Plante Moran Financial Advisors, LLC | 458 | 0,00 | 50 | -21,87 | ||||
| 2026-02-12 | 13F | CIBC Private Wealth Group, LLC | 1.322 | -2,07 | 145 | -24,61 | ||||
| 2026-02-17 | 13F | Jump Financial, LLC | 382.808 | 186,32 | 41.845 | 121,20 | ||||
| 2026-02-13 | 13F | Rafferty Asset Management, LLC | 484.608 | 8,36 | 52.972 | -16,29 | ||||
| 2025-11-13 | 13F/A | Cynosure Management, Llc | 3.156 | 0,00 | 447 | -12,55 | ||||
| 2026-02-12 | 13F | Loomis Sayles & Co L P | 829.918 | -2,39 | 90.718 | -24,59 | ||||
| 2026-02-17 | 13F | Snowden Capital Advisors LLC | 16.938 | 8,47 | 1.851 | -16,21 | ||||
| 2026-02-10 | 13F | Catalyst Capital Advisors LLC | 51 | -26,09 | 6 | -44,44 | ||||
| 2026-02-13 | 13F | Blueshift Asset Management, LLC | 8.175 | 894 | ||||||
| 2026-02-17 | 13F | NEOS Investment Management LLC | 55.503 | 34,25 | 6.067 | 3,73 | ||||
| 2025-11-14 | 13F | Capitolis Liquid Global Markets LLC | 0 | -100,00 | 0 | |||||
| 2026-01-29 | 13F | D.a. Davidson & Co. | 2.151 | -4,57 | 235 | -26,10 | ||||
| 2026-02-17 | 13F | Voleon Capital Management Lp | 31.687 | 612,87 | 3.464 | 451,43 | ||||
| 2026-02-18 | 13F | Mackenzie Financial Corp | 18.804 | 2.081 | ||||||
| 2025-11-12 | 13F | Erste Asset Management GmbH | 0 | -100,00 | 0 | -100,00 | ||||
| 2026-01-28 | 13F | Tufton Capital Management | 4.049 | -13,39 | 0 | |||||
| 2026-02-17 | 13F | Tower Research Capital LLC (TRC) | 14.005 | 155,24 | 1.531 | 97,16 | ||||
| 2026-02-05 | 13F | Bank Julius Baer & Co. Ltd, Zurich | 28.867 | -95,85 | 3.155 | -96,79 | ||||
| 2026-02-17 | 13F | CastleKnight Management LP | 0 | -100,00 | 0 | |||||
| 2026-02-05 | 13F | Bessemer Group Inc | 110 | 0,00 | 0 | |||||
| 2026-01-29 | 13F | UBS Group AG | 1.677.194 | -18,69 | 183.334 | -37,18 | ||||
| 2026-02-10 | 13F | Moors & Cabot, Inc. | 2.067 | 0,83 | 226 | -22,41 | ||||
| 2026-04-15 | 13F | FNY Investment Advisers, LLC | 2.855 | 0 | ||||||
| 2026-01-21 | 13F | Rheos Capital Works Inc. | 179.600 | 20,05 | 20 | -9,52 | ||||
| 2026-02-12 | 13F | ICICI Prudential Asset Management Co Ltd | 2.220 | 5,87 | 243 | -18,24 | ||||
| 2026-02-17 | 13F | Balyasny Asset Management Llc | Put | 246.200 | 150,97 | 26.912 | 93,89 | |||
| 2026-02-26 | 13F/A | Banque Transatlantique SA | 208.038 | -8,65 | 22.843 | -29,20 | ||||
| 2026-04-29 | 13F | Swedbank AB | 421.000 | 15,66 | 63.689 | 60,07 | ||||
| 2026-04-21 | 13F | SmartHarvest Portfolios, LLC | 1.419 | 215 | ||||||
| 2026-02-17 | 13F | Balyasny Asset Management Llc | 47.274 | 275,52 | 5.168 | 190,12 | ||||
| 2026-04-22 | 13F | Spire Wealth Management | 1.200 | 0,00 | 182 | 38,17 | ||||
| 2026-02-13 | 13F | Vega Investment Solutions | 11.200 | 100,00 | 1.224 | 35,25 | ||||
| 2026-02-17 | 13F | Balyasny Asset Management Llc | Call | 214.500 | 16,83 | 23.447 | -9,74 | |||
| 2025-11-12 | 13F | Commerce Bank | 0 | -100,00 | 0 | |||||
| 2026-04-06 | 13F | IFS Advisors, LLC | 15 | 0,00 | 2 | 100,00 | ||||
| 2026-01-30 | 13F | Archer Investment Corp | 30 | -25,00 | 3 | -40,00 | ||||
| 2026-04-28 | 13F | Bogart Wealth, LLC | 658 | 1.216,00 | 100 | 1.880,00 | ||||
| 2026-04-13 | 13F | Hm Payson & Co | 79 | 12 | ||||||
| 2026-04-21 | 13F | bLong Financial, LLC | 1.710 | 259 | ||||||
| 2026-02-13 | 13F | Aft, Forsyth & Company, Inc. | 15.348 | -0,49 | 1.678 | -23,14 | ||||
| 2026-02-17 | 13F | MIRAE ASSET GLOBAL ETFS HOLDINGS Ltd. | 205.433 | 21,88 | 22.457 | -5,84 | ||||
| 2026-05-01 | 13F | 180 Wealth Advisors, Llc | 20.525 | 5,40 | 3.105 | 45,91 | ||||
| 2026-04-17 | 13F | Brown, Lisle/cummings, Inc. | 916 | -2,66 | 139 | 35,29 | ||||
| 2026-04-20 | 13F | Banque Cantonale Vaudoise | 9.254 | 24,94 | 1.400 | 72,84 | ||||
| 2026-04-28 | 13F | Stephens Inc /ar/ | 7.158 | 8,39 | 1.083 | 50,07 | ||||
| 2026-02-13 | 13F | Marathon Trading Investment Management LLC | 18.000 | 50,77 | 1.968 | 16,46 | ||||
| 2026-02-11 | 13F | LPL Financial LLC | Call | 0 | -100,00 | 0 | -100,00 | |||
| 2026-02-17 | 13F | Artisan Partners Limited Partnership | 1.243.137 | 44,45 | 135.887 | 11,59 | ||||
| 2025-11-12 | 13F | NewSquare Capital LLC | 0 | -100,00 | 0 | |||||
| 2025-11-07 | 13F | Prospect Hill Management, LLC | 0 | -100,00 | 0 | |||||
| 2026-02-17 | 13F | TCG Advisory Services, LLC | 1.060 | 116 | ||||||
| 2026-04-07 | 13F | Signaturefd, Llc | 30 | 50,00 | 5 | 100,00 | ||||
| 2026-02-17 | 13F | TCG Advisory Services, LLC | Call | 4.800 | 525 | |||||
| 2026-04-20 | 13F | Louisiana State Employees Retirement System | 9.200 | -1,08 | 1.392 | 36,91 | ||||
| 2026-02-10 | 13F | Quantbot Technologies LP | 0 | -100,00 | 0 | |||||
| 2026-04-28 | 13F | Golden State Equity Partners | 534 | 81 | ||||||
| 2026-02-23 | 13F | Virtu Financial LLC | 44.829 | 5 | ||||||
| 2025-11-14 | 13F | Cubist Systematic Strategies, LLC | Call | 316.800 | -2,76 | 44.824 | -14,94 | |||
| 2026-02-09 | 13F | Westover Capital Advisors, LLC | 0 | -100,00 | 0 | |||||
| 2025-11-14 | 13F | Cubist Systematic Strategies, LLC | Put | 401.800 | 23,03 | 56.851 | 7,62 | |||
| 2026-02-17 | 13F | Norinchukin Bank, The | 4.621 | 20,50 | 505 | -6,83 | ||||
| 2026-02-17 | 13F | Hyperion Asset Management Ltd | 1.836.185 | 27,99 | 200.713 | -1,12 | ||||
| 2026-01-27 | 13F | BankPlus Trust Department | 25 | 0,00 | 3 | -33,33 | ||||
| 2026-04-17 | 13F | PKO Investment Management Joint-Stock Co | 5.000 | -80,00 | 756 | -72,33 | ||||
| 2026-02-03 | 13F | Crossmark Global Holdings, Inc. | 5.673 | 2,20 | 620 | -21,02 | ||||
| 2025-12-16 | 13F | Garde Capital, Inc. | 0 | -100,00 | 0 | |||||
| 2026-02-17 | 13F | EFG International AG | 3.987 | 436 | ||||||
| 2026-04-28 | 13F | Fortis Capital Advisors, LLC | 5.299 | 117,17 | 802 | 201,13 | ||||
| 2026-02-17 | 13F | Symmetry Peak Management Llc | Call | 0 | -100,00 | 0 | ||||
| 2026-02-17 | 13F | Mubadala Investment Co PJSC | 1.376.960 | -8,32 | 150.515 | -29,17 | ||||
| 2026-02-13 | 13F | Neuberger Berman Group LLC | 132.307 | -13,66 | 14.462 | -33,30 | ||||
| 2026-02-17 | 13F | Ameriflex Group, Inc. | 0 | -100,00 | 0 | |||||
| 2026-01-09 | 13F | Dynamic Advisor Solutions LLC | 0 | -100,00 | 0 | |||||
| 2026-02-13 | 13F | Mml Investors Services, Llc | 7.547 | -22,36 | 825 | -40,07 | ||||
| 2026-02-10 | 13F | Baker Avenue Asset Management, LP | 3.232 | 353 | ||||||
| 2026-02-09 | 13F | Integrity Alliance, Llc. | 5.383 | 11,70 | 588 | -13,66 | ||||
| 2026-03-13 | 13F | Fund Advisors of America Inc/FL | 6.068 | 663 | ||||||
| 2026-02-05 | 13F | Tucker Asset Management Llc | 76 | 8 | ||||||
| 2026-04-29 | 13F | Navalign, LLC | 0 | -100,00 | 0 | |||||
| 2026-02-18 | 13F | GWM Advisors LLC | 24.122 | -19,38 | 2.637 | -37,73 | ||||
| 2026-01-22 | 13F | Bear Mountain Capital, Inc. | 75 | -3,85 | 8 | -46,15 | ||||
| 2026-02-17 | 13F | Advisor Group Holdings, Inc. | 97.789 | -9,06 | 10.689 | -28,33 | ||||
| 2026-02-10 | 13F | Measured Wealth Private Client Group, LLC | 21 | 2 | ||||||
| 2026-02-17 | 13F | DZ BANK AG Deutsche Zentral Genossenschafts Bank, Frankfurt am Main | 0 | -100,00 | 0 | |||||
| 2026-01-23 | 13F | Baillie Gifford & Co | 612.528 | -4,42 | 66.955 | -26,16 | ||||
| 2026-04-16 | 13F | Everstar Asset Management, LLC | 0 | -100,00 | 0 | |||||
| 2026-04-28 | 13F | Southern Michigan Bank & Trust | 40 | 6 | ||||||
| 2026-04-15 | 13F | Zullo Investment Group, Inc. | 1.978 | 0,15 | 299 | 39,07 | ||||
| 2026-01-28 | 13F | Mystic Asset Management, Inc. | 1.885 | 0,00 | 206 | -22,56 | ||||
| 2026-02-10 | 13F | Bank of New York Mellon Corp | 72.454 | 9,31 | 7.920 | -15,56 | ||||
| 2025-11-04 | 13F | Mission Wealth Management, Lp | 0 | -100,00 | 0 | -100,00 | ||||
| 2026-04-20 | 13F | Haven Capital Group, Inc. | 17.246 | 0,00 | 2.609 | 38,36 | ||||
| 2026-01-29 | 13F | Quest 10 Wealth Builders, Inc. | 18 | 2 | ||||||
| 2025-11-14 | 13F | Newbrook Capital Advisors LP | 0 | -100,00 | 0 | |||||
| 2026-04-13 | 13F | Lake Street Financial Llc | 5.410 | -8,10 | 818 | 27,22 | ||||
| 2025-11-14 | 13F | Next Century Growth Investors Llc | 0 | -100,00 | 0 |