Grundlæggende statistik
| Institutionelle aktier (lange) | 298.606.835 - 88,20% (ex 13D/G) - change of -43,03MM shares -12,54% MRQ |
| Institutionel værdi (lang) | $ 47.357.756 USD ($1000) |
Institutionelt ejerskab og aktionærer
Vistra Corp. (US:VST) har 1575 institutionelle ejere og aktionærer, der har indsendt 13D/G- eller 13F-formularer til Securities Exchange Commission (SEC). Disse institutioner har i alt 298,608,667 aktier. Største aktionærer omfatter Vanguard Group Inc, BlackRock, Inc., Fmr Llc, State Street Corp, Jpmorgan Chase & Co, Geode Capital Management, Llc, Morgan Stanley, Massachusetts Financial Services Co /ma/, Jane Street Group, Llc, and Lone Pine Capital Llc .
Vistra Corp. (NYSE:VST) institutionel ejerskabsstruktur viser aktuelle positioner i virksomheden efter institutioner og fonde, samt seneste ændringer i positionsstørrelse. Større aktionærer kan omfatte individuelle investorer, investeringsforeninger, hedgefonde eller institutioner. Skema 13D angiver, at investoren besidder (eller besidder) mere end 5 % af virksomheden og har til hensigt (eller har til hensigt at) aktivt at forfølge en ændring i forretningsstrategi. Skema 13G indikerer en passiv investering på over 5%.
The share price as of March 24, 2026 is 152,72 / share. Previously, on March 25, 2025, the share price was 131,81 / share. This represents an increase of 15,86% over that period.

Fondens stemningsscore
Fund Sentiment Score (fka Ownership Accumulation Score) finder de aktier, der bliver mest købt af fonde. Det er resultatet af en sofistikeret, multi-faktor kvantitativ model, der identificerer virksomheder med de højeste niveauer af institutionel akkumulering. Scoringsmodellen bruger en kombination af den samlede stigning i oplyste ejere, ændringerne i porteføljeallokeringer i disse ejere og andre målinger. Tallet går fra 0 til 100, hvor højere tal indikerer et højere niveau af akkumulering for sine jævnaldrende, og 50 er gennemsnittet.
Opdateringsfrekvens: Dagligt
Se Ownership Explorer, som giver en liste over højest rangerende virksomheder.
AI+ Ask Fintel’s AI assistant about Vistra Corp..
Select a question to share a public post with an AI-crafted answer.
Thinking of good questions…
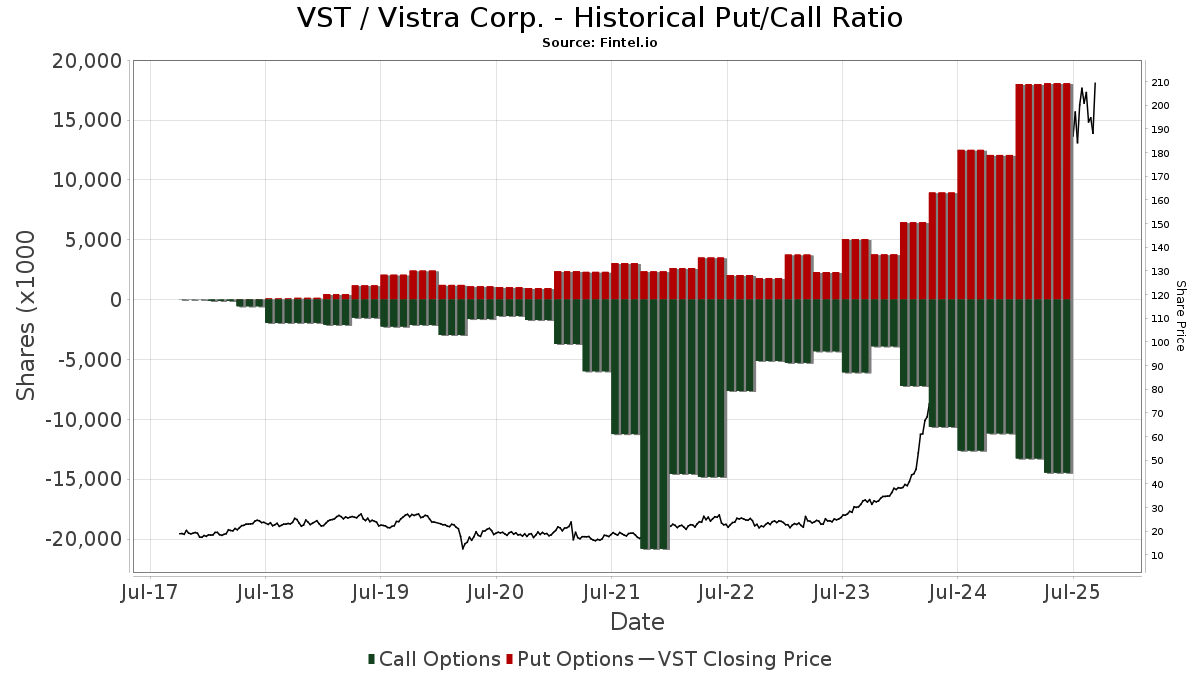
Institutionel Put/Call-forhold
Ud over at indberette standardaktie- og gældsudstedelser skal institutter med mere end 100 mill. aktiver under forvaltning også oplyse deres put- og call-optionsbeholdninger. Da salgsoptioner generelt indikerer negativ stemning, og købsoptioner indikerer positiv stemning, kan vi få en fornemmelse af den overordnede institutionelle stemning ved at plotte forholdet mellem put og kald. Diagrammet til højre viser det historiske put/call-forhold for dette instrument.
Brug af Put/Call Ratio som en indikator for investorernes stemning overvinder en af de vigtigste mangler ved at bruge totalt institutionelt ejerskab, som er, at en betydelig mængde af aktiver under forvaltning investeres passivt for at spore indekser. Passivt forvaltede fonde køber typisk ikke optioner, så indikatoren for put/call-forholdet følger mere nøje følelsen af aktivt forvaltede fonde.
13D/G-arkivering
Vi præsenterer 13D/G ansøgninger separat fra 13F ansøgninger på grund af den forskellige behandling af SEC. 13D/G-ansøgninger kan indgives af grupper af investorer (med én ledende), hvorimod 13F-ansøgninger ikke kan. Dette resulterer i situationer, hvor en investor kan indsende en 13D/G, der rapporterer én værdi for de samlede aktier (der repræsenterer alle de aktier, der ejes af investorgruppen), men derefter indsender en 13F, der rapporterer en anden værdi for de samlede aktier (der udelukkende repræsenterer deres egne) ejendomsret). Det betyder, at aktieejerskab af 13D/G-arkiver og 13F-arkiveringer ofte ikke er direkte sammenlignelige, så vi præsenterer dem separat.
Bemærk: Fra den 16. maj 2021 viser vi ikke længere ejere, der ikke har indsendt en 13D/G inden for det seneste år. Tidligere viste vi den fulde historie af 13D/G-arkiver. Generelt skal enheder, der er forpligtet til at indgive 13D/G-ansøgninger, indgive mindst årligt, før de indsender en afsluttende ansøgning. Dog forlader fonde nogle gange positioner uden at indsende en afsluttende ansøgning (dvs. de afvikler), så visning af den fulde historie resulterede nogle gange i forvirring om det nuværende ejerskab. For at undgå forvirring viser vi nu kun 'aktuelle' ejere - det vil sige - ejere, der har anmeldt inden for det seneste år.
Upgrade to unlock premium data.
| Fil dato | Form | Investor | Forrige Aktier |
Seneste Aktier |
Δ Aktier (Procent) |
Ejendomsret (Procent) |
Δ Ejerskab (Procent) |
|
|---|---|---|---|---|---|---|---|---|
| 2025-08-05 | Qatar Investment Authority | 22,890,145 | 18,675,188 | -18.41 | 5.50 | 7.84 | ||
| 2025-05-12 | FMR LLC | 22,872,039 | 17,269,703 | -24.49 | 5.10 | -23.39 |
13F og NPORT arkivering
Detaljer om 13F-arkivering er gratis. Detaljer om NP-ansøgninger kræver et premium-medlemskab. Grønne rækker angiver nye positioner. Røde rækker angiver lukkede positioner. Klik på linket ikon for at se den fulde transaktionshistorik.
Opgrader
for at låse premium-data op og eksportere til Excel ![]() .
.
Important Note
In an effort to reduce load times for our mobile users, we are testing some ways to deliver lighter pages.
In this first test, we will deliver only the most recent 750 transactions (out of 2035 for this stock). If you are interested in loading *all* the transactions for this company, click the "load all" button below. This is just a test and if you don't like it, please let us know by submitting some gentle feedback via the link at the bottom of this page.
Load All| Fil dato | Kilde | Investor | Type | Gennemsnitlig pris (Øst) |
Aktier | Δ Aktier (%) |
Rapporteret Værdi ($1000) |
Δ Værdi (%) |
Port Alloc (%) |
|
|---|---|---|---|---|---|---|---|---|---|---|
| 2026-01-23 | 13F | Halbert Hargrove Global Advisors, Llc | 0 | -100,00 | 0 | |||||
| 2026-01-30 | 13F | Torren Management, LLC | 1.593 | 257 | ||||||
| 2026-01-29 | 13F | Vanguard Group Inc | 41.588.784 | 0,95 | 6.709.519 | -16,88 | ||||
| 2026-02-11 | 13F | Manchester Capital Management LLC | 339 | 55 | ||||||
| 2026-02-10 | 13F | Holderness Investments Co | 2.117 | -26,06 | 342 | -39,11 | ||||
| 2026-01-30 | 13F | Bogart Wealth, LLC | 15 | -50,00 | 2 | -60,00 | ||||
| 2025-09-29 | NP | LGDX - Intech S&P Large Cap Diversified Alpha ETF | 2.759 | 97,49 | 575 | 217,68 | ||||
| 2026-02-11 | 13F | MidWestOne Financial Group, Inc. | 6.398 | 75,43 | 1.032 | 44,54 | ||||
| 2026-02-11 | 13F | Group One Trading, L.p. | Put | 230.300 | -9,76 | 37.154 | -25,69 | |||
| 2026-02-13 | 13F | Rhumbline Advisers | 605.189 | -0,63 | 97.635 | -18,18 | ||||
| 2026-02-11 | 13F | Group One Trading, L.p. | 4.589 | -57,95 | 740 | -65,39 | ||||
| 2025-09-29 | NP | PWS - Pacer WealthShield ETF | 1.380 | 17,25 | 288 | 45,69 | ||||
| 2026-02-03 | 13F | Mitsubishi UFJ Kokusai Asset Management Co., Ltd. | 691.412 | 5,39 | 114.242 | -11,12 | ||||
| 2026-01-23 | 13F | Avion Wealth | 121 | 42,35 | 0 | |||||
| 2026-01-08 | 13F | Signet Financial Management, Llc | 43.090 | -0,14 | 6.952 | -17,78 | ||||
| 2026-02-17 | 13F/A | Northwest & Ethical Investments L.P. | 4.058 | -9,82 | 660 | -25,96 | ||||
| 2025-09-26 | NP | FSLVX - Fidelity Stock Selector Large Cap Value Fund This fund is a listed as child fund of Fmr Llc and if that institution has disclosed ownership in this security, then these positions will not be double counted when calculating total shares and total value | 18.687 | 35,41 | 3.897 | 117,90 | ||||
| 2026-02-06 | 13F | Principle Wealth Partners Llc | 14.462 | 0,51 | 2.333 | -17,24 | ||||
| 2026-02-17 | 13F | Sagewood Asset Management LP | 3.315 | 535 | ||||||
| 2025-11-12 | 13F | HAP Trading, LLC | Call | 23.600 | 704 | |||||
| 2026-02-13 | 13F | Treasurer of the State of North Carolina | 141.757 | -6,81 | 23 | -24,14 | ||||
| 2026-02-17 | 13F | Oxford Asset Management Llp | 1.241 | 200 | ||||||
| 2025-09-26 | NP | PASIX - PACE Alternative Strategies Investments Class A | Short | -681 | 22,26 | -142 | 97,22 | |||
| 2025-10-29 | 13F | HHM Wealth Advisors, LLC | 0 | -100,00 | 0 | |||||
| 2026-02-11 | 13F | OneAscent Financial Services LLC | 1.513 | 244 | ||||||
| 2026-02-10 | 13F | Sivia Capital Partners, LLC | 1.320 | -4,69 | 213 | -21,40 | ||||
| 2026-02-11 | 13F | Clearbridge Investments, LLC | 1.682.219 | -12,45 | 271.392 | -27,91 | ||||
| 2025-10-30 | 13F | Traub Capital Management LLC | 0 | -100,00 | 0 | |||||
| 2026-02-06 | 13F | Creative Financial Designs Inc /adv | 1.472 | 51,44 | 238 | 24,74 | ||||
| 2026-02-17 | 13F | Clearline Capital LP | 243.445 | 139,11 | 39.275 | 96,89 | ||||
| 2026-01-05 | 13F | GAMMA Investing LLC | 6.836 | -7,17 | 1.103 | -23,58 | ||||
| 2026-01-27 | 13F | Financial Management Professionals, Inc. | 18 | -52,63 | 3 | -71,43 | ||||
| 2025-11-17 | 13F | IMS Capital Management | 8.001 | -0,62 | 1.568 | 0,45 | ||||
| 2026-02-13 | 13F | Korea Investment CORP | 506.960 | 4,90 | 81.788 | -13,62 | ||||
| 2026-02-24 | 13F | MidFirst Bank | 828 | 16 | ||||||
| 2026-02-05 | 13F | High Note Wealth, LLC | 23 | 1.050,00 | 4 | |||||
| 2026-01-21 | 13F | Stone House Investment Management, LLC | 114 | -6,56 | 18 | -21,74 | ||||
| 2026-02-05 | 13F | Mason & Associates Inc | 4.152 | -0,95 | 670 | -18,51 | ||||
| 2026-02-17 | 13F | LMR Partners LLP | Call | 75.000 | 36,36 | 12.100 | 12,29 | |||
| 2026-02-17 | 13F | LMR Partners LLP | 59.934 | 9.669 | ||||||
| 2026-02-09 | 13F | Smithfield Trust Co | 9.656 | 0,00 | 2 | 0,00 | ||||
| 2026-01-16 | 13F | Perigon Wealth Management, LLC | 1.498 | -0,20 | 242 | -18,03 | ||||
| 2026-02-17 | 13F | Steamboat Capital Partners, LLC | 18.068 | -0,35 | 2.915 | -17,96 | ||||
| 2026-02-12 | 13F | Fuller & Thaler Asset Management, Inc. | 3.430 | 0,00 | 553 | -17,71 | ||||
| 2026-02-17 | 13F | Holocene Advisors, LP | 0 | -100,00 | 0 | -100,00 | ||||
| 2026-02-17 | 13F | Per Stirling Capital Management, LLC. | 0 | -100,00 | 0 | |||||
| 2026-01-20 | 13F | Steel Peak Wealth Management LLC | 0 | -100,00 | 0 | |||||
| 2026-02-17 | 13F | Janus Henderson Group Plc | 2.958.740 | 2,27 | 477.337 | -15,78 | ||||
| 2026-01-30 | 13F | Vivid Wealth Management, LLC | 15.680 | 9,78 | 2.530 | -9,61 | ||||
| 2026-02-12 | 13F | MetLife Investment Management, LLC | 92.985 | -2,50 | 15.001 | -19,72 | ||||
| 2026-01-27 | 13F | BankPlus Trust Department | 53 | 0,00 | 9 | -20,00 | ||||
| 2026-02-17 | 13F | Bank Of America Corp /de/ | Put | 0 | -100,00 | 0 | ||||
| 2025-09-29 | NP | CFSLX - Column Small Cap Fund | 2.346 | -32,55 | 444 | -20,61 | ||||
| 2025-09-29 | NP | PBP - Invesco S&P 500 BuyWrite ETF This fund is a listed as child fund of Invesco Ltd. and if that institution has disclosed ownership in this security, then these positions will not be double counted when calculating total shares and total value | 1.812 | 76,61 | 378 | 183,46 | ||||
| 2026-01-27 | 13F | Wealth Enhancement Trust Services, Inc. | 272 | 44 | ||||||
| 2026-02-09 | 13F | Severin Investments, LLC | 4.247 | 85,78 | 685 | 53,24 | ||||
| 2026-01-21 | 13F | Flagship Harbor Advisors, Llc | 124 | -96,60 | 20 | -97,20 | ||||
| 2026-01-23 | 13F | U.S. Capital Wealth Advisors, LLC | 23.557 | -5,79 | 3.800 | -22,42 | ||||
| 2026-02-13 | 13F | Change Path, LLC | 7.074 | 5,96 | 1.141 | -12,77 | ||||
| 2026-02-13 | 13F | Boston Partners | 15.286 | -2,83 | 2.466 | -19,99 | ||||
| 2026-02-13 | 13F | Icon Wealth Advisors, LLC | 0 | -100,00 | 0 | |||||
| 2026-02-17 | 13F/A | RBF Capital, LLC | 10.000 | 0,00 | 1.613 | -17,66 | ||||
| 2026-01-26 | 13F | Old Point Trust & Financial Services N A | 100 | 0,00 | 16 | -15,79 | ||||
| 2026-02-02 | 13F | Oppenheimer Asset Management Inc. | 7.955 | -38,85 | 1.283 | -49,65 | ||||
| 2026-02-13 | 13F | Tairen Capital Ltd | 0 | -100,00 | 0 | |||||
| 2025-11-06 | 13F | CloudAlpha Capital Management Limited/Hong Kong | 0 | -100,00 | 0 | -100,00 | ||||
| 2026-02-17 | 13F | Graham Capital Management, L.P. | 0 | -100,00 | 0 | |||||
| 2026-01-28 | 13F | CAPROCK Group, Inc. | 1.498 | -44,17 | 242 | -52,47 | ||||
| 2026-02-05 | 13F | Conning Inc. | 1.678 | -16,85 | 271 | -31,65 | ||||
| 2026-01-28 | 13F | Salomon & Ludwin, LLC | 215 | 74,80 | 35 | 45,83 | ||||
| 2026-01-13 | 13F | Avaii Wealth Management, Llc | 1.729 | -23,12 | 279 | -36,82 | ||||
| 2025-11-06 | 13F | CloudAlpha Capital Management Limited/Hong Kong | Call | 0 | -100,00 | 0 | -100,00 | |||
| 2026-02-11 | 13F | Strategy Asset Managers Llc | 0 | -100,00 | 0 | |||||
| 2026-02-11 | 13F | Rise Advisors, LLC | 0 | -100,00 | 0 | |||||
| 2026-02-13 | 13F | Quarry LP | 673 | -74,27 | 109 | -78,91 | ||||
| 2026-01-13 | 13F | Stableford Capital Ii Llc | 4.641 | -2,81 | 749 | -20,00 | ||||
| 2026-02-13 | 13F | Police & Firemen's Retirement System of New Jersey | 51.996 | -4,54 | 8.389 | -21,39 | ||||
| 2026-01-12 | 13F | DAVENPORT & Co LLC | 34.799 | -2,44 | 5.614 | -19,66 | ||||
| 2025-10-08 | 13F | Peak Financial Advisors Llc | 0 | -100,00 | 0 | |||||
| 2026-01-22 | 13F | Red Tortoise LLC | 149 | 0,00 | 24 | -17,24 | ||||
| 2026-01-20 | 13F | Thurston, Springer, Miller, Herd & Titak, Inc. | 1.898 | 361,80 | 306 | 282,50 | ||||
| 2026-01-21 | 13F | Hudson Capital Management LLC | 33.105 | 0,49 | 5.341 | -17,26 | ||||
| 2026-02-17 | 13F | DZ BANK AG Deutsche Zentral Genossenschafts Bank, Frankfurt am Main | 0 | -100,00 | 0 | |||||
| 2026-02-10 | 13F | Rothschild Investment Llc | 2.409 | 2,90 | 389 | -15,28 | ||||
| 2026-01-05 | 13F | Park Avenue Securities Llc | 15.818 | -6,64 | 3 | -33,33 | ||||
| 2026-02-12 | 13F | Strive Asset Management, LLC | 0 | -100,00 | 0 | |||||
| 2026-02-13 | 13F | GM Advisory Group, Inc. | 3.262 | 6,95 | 526 | -11,89 | ||||
| 2026-01-23 | 13F | Forefront Wealth Management Inc. | 0 | -100,00 | 0 | |||||
| 2026-02-09 | 13F | Mediolanum International Funds Ltd | 75.249 | 22,87 | 12.237 | 0,94 | ||||
| 2026-02-12 | 13F | Ci Investments Inc. | 160.174 | 16,77 | 25.841 | 99.284,62 | ||||
| 2026-02-13 | 13F | RH Tailwind Management, LLC | Put | 90.000 | 14.520 | |||||
| 2026-02-13 | 13F | RH Tailwind Management, LLC | 24.000 | 3.872 | ||||||
| 2026-01-28 | 13F | Campbell Capital Management Inc | 57.247 | 0,23 | 9.236 | -17,47 | ||||
| 2026-02-09 | 13F | Key FInancial Inc | 0 | -100,00 | 0 | |||||
| 2025-11-13 | 13F | Wolf Hill Capital Management, LP | 0 | -100,00 | 0 | |||||
| 2026-02-13 | 13F | Charles Schwab Investment Management Inc | 2.028.796 | 2,18 | 327.306 | -15,86 | ||||
| 2025-11-14 | 13F | Strategic Wealth Partners, Ltd. | 8.123 | -6,10 | 1.591 | -5,07 | ||||
| 2025-11-14 | 13F | ICONIQ Capital, LLC | 0 | -100,00 | 0 | |||||
| 2026-02-10 | 13F | Westpac Banking Corp | 1.777 | -69,75 | 287 | -75,15 | ||||
| 2026-02-17 | 13F | Sherbrooke Park Advisers Llc | 2.129 | 343 | ||||||
| 2025-09-26 | NP | ALMRX - Alger MidCap Growth Institutional Fund Class I | 6.270 | 1.308 | ||||||
| 2026-02-11 | 13F | Capital Wealth Planning, LLC | 20.131 | 3.248 | ||||||
| 2026-01-21 | 13F | Future Financial Wealth Managment LLC | 0 | -100,00 | 0 | |||||
| 2026-02-13 | 13F | Integrated Wealth Concepts LLC | 0 | -100,00 | 0 | |||||
| 2026-01-13 | 13F | Parsons Capital Management Inc/ri | 0 | -100,00 | 0 | |||||
| 2026-02-17 | 13F | State Of Wisconsin Investment Board | 182.705 | -7,51 | 29.476 | -23,84 | ||||
| 2025-09-26 | NP | SUNAMERICA SERIES TRUST - SA JPMorgan Diversified Balanced Portfolio Class 1 | 955 | 199 | ||||||
| 2026-02-06 | 13F | CFO4Life Group, LLC | 1.775 | 0,28 | 286 | -17,34 | ||||
| 2026-02-17 | 13F | CWM Advisors, LLC | 964 | 155 | ||||||
| 2026-01-29 | 13F | Riggs Asset Managment Co. Inc. | 17.272 | 3,14 | 2.786 | -15,06 | ||||
| 2026-02-17 | 13F | Schonfeld Strategic Advisors LLC | Put | 0 | -100,00 | 0 | ||||
| 2026-01-22 | 13F | Apollon Financial, LLC | 2.445 | 10,88 | 395 | -8,80 | ||||
| 2026-02-13 | 13F | SRS Capital Advisors, Inc. | 693 | 112 | ||||||
| 2025-09-26 | NP | FZROX - Fidelity ZERO Total Market Index Fund This fund is a listed as child fund of Fmr Llc and if that institution has disclosed ownership in this security, then these positions will not be double counted when calculating total shares and total value | 159.128 | 2,34 | 33.185 | 64,64 | ||||
| 2026-02-12 | 13F | Index Technologies Group LLC | 4.548 | 734 | ||||||
| 2026-02-09 | 13F | Onefund, Llc | 109 | 240,62 | 18 | 183,33 | ||||
| 2026-02-17 | 13F | GeoWealth Management, LLC | 1.656 | -23,23 | 267 | -36,73 | ||||
| 2026-01-20 | 13F | Nvwm, Llc | 2.548 | 63.600,00 | 411 | |||||
| 2026-01-20 | 13F | Moseley Investment Management Inc | 3.161 | 45,27 | 510 | 19,72 | ||||
| 2026-01-28 | 13F | Quaker Wealth Management, LLC | 309 | 3.333,33 | 50 | 4.800,00 | ||||
| 2026-01-28 | 13F | Diversified Enterprises, LLC | 1.331 | 29,22 | 215 | 6,47 | ||||
| 2026-02-17 | 13F | Caisse De Depot Et Placement Du Quebec | 636.718 | 0,72 | 102.722 | -17,06 | ||||
| 2026-01-07 | 13F | Massmutual Trust Co Fsb/adv | 1.498 | -0,86 | 242 | -18,58 | ||||
| 2025-09-29 | NP | PKW - Invesco BuyBack Achievers ETF This fund is a listed as child fund of Invesco Ltd. and if that institution has disclosed ownership in this security, then these positions will not be double counted when calculating total shares and total value | 237.058 | 40,91 | 49.436 | 126,69 | ||||
| 2026-01-12 | 13F | Lee Johnson Capital Management, Llc | 3.803 | -9,26 | 614 | -25,33 | ||||
| 2026-03-12 | 13F | Nalls Sherbakoff Group, Llc | 1.747 | 282 | ||||||
| 2026-02-17 | 13F | Point72 Asset Management, L.P. | Call | 305.900 | 8.167,57 | 49.351 | 6.716,30 | |||
| 2026-02-17 | 13F | Point72 Asset Management, L.P. | 1.044.367 | 276,37 | 168.488 | 209,92 | ||||
| 2026-02-17 | 13F | Point72 Asset Management, L.P. | Put | 127.300 | 2.057,63 | 20.537 | 1.678,10 | |||
| 2026-02-02 | 13F | Horizon Investments, LLC | 11.739 | -64,44 | 1.894 | -70,73 | ||||
| 2025-09-29 | NP | CATH - Global X S&P 500 Catholic Values ETF This fund is a listed as child fund of Mirae Asset Global Investments Co., Ltd. and if that institution has disclosed ownership in this security, then these positions will not be double counted when calculating total shares and total value | 6.254 | 0,81 | 1.304 | 62,19 | ||||
| 2025-11-05 | 13F | Anthracite Investment Company, Inc. | 0 | -100,00 | 0 | |||||
| 2025-11-12 | 13F | Buckingham Strategic Partners | 0 | -100,00 | 0 | -100,00 | ||||
| 2026-02-17 | 13F | Aqr Capital Management Llc | 133.943 | -27,81 | 21.609 | -39,76 | ||||
| 2026-02-17 | 13F | Balyasny Asset Management Llc | 131.955 | 9.567,03 | 21.288 | 7.873,03 | ||||
| 2026-02-09 | 13F | Integrity Alliance, Llc. | 6.612 | 6,05 | 1.067 | -12,69 | ||||
| 2026-02-17 | 13F | Balyasny Asset Management Llc | Put | 19.600 | -67,76 | 3.162 | -73,45 | |||
| 2026-02-17 | 13F | Balyasny Asset Management Llc | Call | 42.400 | -43,24 | 6.840 | -53,26 | |||
| 2026-01-15 | 13F | Bourgeon Capital Management Llc | 84.698 | 123,84 | 13.664 | 84,32 | ||||
| 2026-02-11 | 13F | Fjarde Ap-fonden /fourth Swedish National Pension Fund | 56.800 | 9.164 | ||||||
| 2026-01-30 | 13F | Ares Financial Consulting, LLC | 37 | 6 | ||||||
| 2025-09-26 | NP | FLCSX - Fidelity Large Cap Stock Fund This fund is a listed as child fund of Fmr Llc and if that institution has disclosed ownership in this security, then these positions will not be double counted when calculating total shares and total value | 38.782 | -3,77 | 8.088 | 54,80 | ||||
| 2026-02-11 | 13F | Prestige Wealth Management Group LLC | 15 | 0,00 | 2 | 0,00 | ||||
| 2026-02-17 | 13F | Citadel Advisors Llc | Call | 1.003.700 | -35,74 | 161.927 | -47,08 | |||
| 2026-02-17 | 13F | Citadel Advisors Llc | 1.069.835 | 30,01 | 172.596 | 7,05 | ||||
| 2026-02-17 | 13F | Citadel Advisors Llc | Put | 2.142.900 | -17,28 | 345.714 | -31,88 | |||
| 2026-02-13 | 13F | Blueshift Asset Management, LLC | 0 | -100,00 | 0 | |||||
| 2026-01-29 | 13F | Concurrent Investment Advisors, LLC | 24.902 | 745,57 | 4.017 | 597,40 | ||||
| 2025-09-26 | NP | RTSSX - Tax-Managed U.S. Mid & Small Cap Fund Class S | 29.295 | 0,00 | 6.109 | 60,89 | ||||
| 2026-02-13 | 13F | Sei Investments Co | 215.820 | -20,73 | 34.819 | -34,73 | ||||
| 2026-01-15 | 13F | Royal Fund Management, LLC | Put | 1 | 2 | |||||
| 2026-01-15 | 13F | Royal Fund Management, LLC | 47.712 | 7.697 | ||||||
| 2026-02-11 | 13F | Doheny Asset Management /ca | 45.652 | 9,75 | 7 | -12,50 | ||||
| 2025-11-12 | 13F | Proficio Capital Partners LLC | 0 | -100,00 | 0 | |||||
| 2026-02-13 | 13F | Panagora Asset Management Inc | 12.900 | -67,37 | 2.081 | -73,13 | ||||
| 2025-11-07 | 13F | Sierra Ocean, Llc | 0 | -100,00 | 0 | |||||
| 2025-09-25 | NP | GAOAX - JPMorgan Global Allocation Fund Class A | 5.803 | 1.210 | ||||||
| 2026-02-12 | 13F | Polen Capital Management Llc | 0 | -100,00 | 0 | |||||
| 2026-02-13 | 13F | Public Sector Pension Investment Board | 0 | -100,00 | 0 | |||||
| 2026-01-12 | 13F | Avanza Fonder AB | 673 | 109 | ||||||
| 2026-01-15 | 13F | Polianta Ltd | 8.100 | 1 | ||||||
| 2026-02-04 | 13F | Dogwood Wealth Management LLC | 102 | 251,72 | 16 | 220,00 | ||||
| 2026-02-04 | 13F | Bensler, LLC | 87.353 | 1,58 | 14.093 | -16,35 | ||||
| 2026-02-12 | 13F | Loomis Sayles & Co L P | 5.554 | -0,09 | 896 | -17,72 | ||||
| 2026-02-13 | 13F | Diametric Capital, LP | 0 | -100,00 | 0 | -100,00 | ||||
| 2025-09-29 | NP | CVTRX - Calamos Growth & Income Fund Class A | 100.390 | 0,00 | 20.935 | 60,88 | ||||
| 2026-02-19 | 13F | Atomi Financial Group, Inc. | 3.094 | -1,28 | 499 | -18,73 | ||||
| 2026-02-13 | 13F | Centaurus Financial, Inc. | 9.495 | -19,95 | 2 | -50,00 | ||||
| 2026-01-29 | 13F | Quest 10 Wealth Builders, Inc. | 48 | 0,00 | 8 | -22,22 | ||||
| 2026-02-12 | 13F | SWAN Capital LLC | 20 | 0,00 | 3 | 0,00 | ||||
| 2026-02-13 | 13F | First Trust Advisors Lp | 612.944 | 9,89 | 98.886 | -9,51 | ||||
| 2026-02-17 | 13F | Voloridge Investment Management, Llc | 9.099 | 1.468 | ||||||
| 2025-09-25 | NP | JPME - JPMorgan Diversified Return U.S. Mid Cap Equity ETF | 8.098 | -35,18 | 1.689 | 4,26 | ||||
| 2026-02-17 | 13F | XTX Topco Ltd | 55.517 | 8.957 | ||||||
| 2026-02-17 | 13F | LMR Partners LLP | Put | 0 | -100,00 | 0 | ||||
| 2025-09-26 | NP | UTPIX - Utilities Ultrasector Profund Investor Class | 3.023 | 37,04 | 630 | 121,05 | ||||
| 2025-09-25 | NP | Wells Fargo Income Opportunities Fund | 11.360 | 0,00 | 2.369 | 60,94 | ||||
| 2026-01-26 | 13F | Whittier Trust Co | 973 | 5,42 | 165 | -11,83 | ||||
| 2026-01-15 | 13F | Burns Matteson Capital Management, LLC | 2.196 | 0,00 | 354 | -17,67 | ||||
| 2026-02-13 | 13F | Adams Diversified Equity Fund, Inc. | 37.400 | 0,00 | 6.034 | -17,66 | ||||
| 2026-01-13 | 13F | Dakota Wealth Management | 0 | -100,00 | 0 | |||||
| 2026-02-09 | 13F | Knights of Columbus Asset Advisors LLC | 32.785 | -19,03 | 5.289 | -33,32 | ||||
| 2025-11-04 | 13F | Transcend Wealth Collective, Llc | 0 | -100,00 | 0 | -100,00 | ||||
| 2026-02-05 | 13F | Beese Fulmer Investment Management, Inc. | 2.212 | 357 | ||||||
| 2026-02-13 | 13F | Partners Capital Investment Group, Llp | 2.450 | 0,00 | 395 | -17,71 | ||||
| 2026-01-28 | 13F | United Asset Strategies, Inc. | 10.511 | 1,34 | 1.696 | -16,58 | ||||
| 2025-09-29 | NP | CFSSX - Column Small Cap Select Fund | 13.817 | -30,56 | 2.613 | -18,25 | ||||
| 2026-02-18 | 13F | Hanlon Investment Management, Inc. | 4.793 | -40,59 | 773 | -51,08 | ||||
| 2026-01-15 | 13F | Pinnacle Wealth Management, LLC | 9.066 | -1,03 | 1.463 | -18,51 | ||||
| 2026-02-20 | 13F | Kovitz Investment Group Partners, LLC | 10.809 | -45,89 | 1.744 | -55,46 | ||||
| 2026-02-05 | 13F | Stephens Inc /ar/ | 4.995 | 3,78 | 806 | -14,54 | ||||
| 2025-10-24 | 13F | Opal Wealth Advisors, LLC | 0 | -100,00 | 0 | |||||
| 2025-09-26 | NP | LRGF - iShares Edge MSCI Multifactor USA ETF | 59.787 | -10,23 | 12.468 | 44,41 | ||||
| 2025-09-25 | NP | VT - Vanguard Total World Stock Index Fund ETF Shares | 230.646 | 4,01 | 48.099 | 67,33 | ||||
| 2026-02-13 | 13F | Delos Wealth Advisors, LLC | 854 | 0,00 | 138 | -17,96 | ||||
| 2026-02-06 | 13F | EverSource Wealth Advisors, LLC | 4.410 | -8,24 | 711 | -24,44 | ||||
| 2026-01-21 | 13F | Ethos Capital Management, Inc. | 7.061 | 1.139 | ||||||
| 2026-01-15 | 13F | Nisa Investment Advisors, Llc | 44.518 | -6,00 | 7.182 | -22,59 | ||||
| 2026-02-10 | 13F | Daiwa Securities Group Inc. | 67.918 | 14,23 | 11 | -9,09 | ||||
| 2026-02-11 | 13F | Capital World Investors | 3.561.018 | 574.499 | ||||||
| 2026-02-11 | 13F | Loup Funds, LLC | 29.215 | 4.713 | ||||||
| 2026-02-17 | 13F | HighVista Strategies LLC | 5.673 | 915 | ||||||
| 2025-09-25 | NP | MMUFX - MFS Utilities Fund A | 657.650 | 0,00 | 137.146 | 60,87 | ||||
| 2025-11-12 | 13F | Artisan Partners Limited Partnership | Call | 0 | -100,00 | 0 | -100,00 | |||
| 2026-01-21 | 13F | New Wave Wealth Advisors Llc | 2.170 | 350 | ||||||
| 2026-02-18 | 13F | EP Wealth Advisors, Inc. | 8.320 | -9,10 | 1.342 | -24,31 | ||||
| 2025-09-26 | NP | IMCG - iShares Morningstar Mid-Cap Growth ETF | 165.039 | 7,66 | 34.417 | 73,19 | ||||
| 2026-01-26 | 13F | Chicago Capital, LLC | 68.585 | 0,58 | 11.065 | -17,19 | ||||
| 2026-02-13 | 13F | Ripple Effect Asset Management LP | Call | 140.000 | 22.586 | |||||
| 2026-02-13 | 13F | Dynamic Technology Lab Private Ltd | 4.710 | -36,17 | 760 | -47,40 | ||||
| 2026-01-26 | 13F | AE Wealth Management LLC | 27.294 | -68,79 | 4.404 | -74,30 | ||||
| 2026-02-12 | 13F | Founders Financial Alliance, LLC | 2.289 | 4,33 | 369 | -13,99 | ||||
| 2026-02-13 | 13F | NLB Skladi, upravljanje premozenja, d.o.o. | 10.800 | 1.742 | ||||||
| 2026-02-17 | 13F | Aristeia Capital Llc | 4.007 | 89,46 | 646 | 56,04 | ||||
| 2026-03-04 | 13F | Rehmann Capital Advisory Group | 1.621 | -1,04 | 262 | -18,44 | ||||
| 2026-01-06 | 13F | OMC Financial Services LTD | 22.805 | -2,21 | 3.679 | -19,46 | ||||
| 2025-09-26 | NP | TIEIX - TIAA-CREF Equity Index Fund Institutional Class | 301.970 | 0,00 | 62.973 | 60,87 | ||||
| 2026-02-03 | 13F | Gateway Investment Advisers Llc | 6.063 | -63,88 | 978 | -70,26 | ||||
| 2026-02-10 | 13F | Arcadia Investment Management Corp/mi | 1 | 0 | ||||||
| 2026-01-26 | 13F | Merit Financial Group, LLC | 10.093 | 30,42 | 1.628 | 7,39 | ||||
| 2025-09-29 | NP | HIBL - Direxion Daily S&P 500(R) High Beta Bull 3X Shares | 3.351 | 16,80 | 699 | 88,14 | ||||
| 2026-01-12 | 13F | Howard Financial Services, Ltd. | 0 | -100,00 | 0 | |||||
| 2026-01-30 | 13F | American Capital Advisory, LLC | 10 | 25,00 | 2 | 0,00 | ||||
| 2026-02-12 | 13F | Federation des caisses Desjardins du Quebec | 54.860 | -40,97 | 8.851 | -51,39 | ||||
| 2025-09-26 | NP | NUGO - Nuveen Growth Opportunities ETF | 123.115 | 25.674 | ||||||
| 2026-02-17 | 13F | Aquatic Capital Management LLC | 110.665 | 20,66 | 17.854 | -0,64 | ||||
| 2025-09-26 | NP | BKLC - BNY Mellon US Large Cap Core Equity ETF | 22.991 | 26,60 | 4.795 | 103,65 | ||||
| 2025-09-26 | NP | RTDAX - Multifactor U.S. Equity Fund Class A | 347 | -86,12 | 72 | -77,78 | ||||
| 2026-02-10 | 13F | Rational Advisors Llc | 2.377 | 127,25 | 383 | 87,75 | ||||
| 2026-02-05 | 13F | Donoghue Forlines LLC | 8.995 | -48,58 | 1.451 | -57,66 | ||||
| 2026-02-13 | 13F | Acumen Wealth Advisors, LLC | 5 | 1 | ||||||
| 2026-02-18 | 13F | Caitlin John, LLC | 36 | -87,59 | 6 | -89,29 | ||||
| 2026-01-07 | 13F | Hilltop National Bank | 174 | -10,31 | 28 | -26,32 | ||||
| 2026-01-23 | 13F | Valley Brook Capital Group, Inc. | 3.390 | 9,71 | 547 | -9,75 | ||||
| 2026-02-17 | 13F | Ninepoint Partners LP | 7.504 | -9,69 | 1.211 | -25,63 | ||||
| 2026-01-29 | 13F | Sanctuary Advisors, LLC | 100.961 | 5,82 | 16.288 | -12,87 | ||||
| 2025-11-14 | 13F | Thiel Macro LLC | 0 | -100,00 | 0 | -100,00 | ||||
| 2026-01-28 | 13F | Carmel Capital Management L.L.C. | 255.354 | -0,22 | 41.196 | -17,83 | ||||
| 2026-01-21 | 13F | Country Trust Bank | 1.990 | 0,00 | 321 | -17,48 | ||||
| 2025-11-20 | 13F | Wbi Investments, Inc. | 0 | -100,00 | 0 | -100,00 | ||||
| 2026-02-10 | 13F | Impact Partnership Wealth, LLC | 7.811 | 59,57 | 1.260 | 31,52 | ||||
| 2026-01-12 | 13F | Quantum Financial Advisors, LLC | 2.496 | 0,08 | 403 | -17,62 | ||||
| 2026-02-10 | 13F | Verus Capital Partners, Llc | 4.256 | -23,23 | 687 | -36,83 | ||||
| 2026-02-09 | 13F | Wellington Shields Capital Management, LLC | 1.048 | -32,73 | 169 | -44,59 | ||||
| 2026-02-14 | 13F | Rockefeller Capital Management L.P. | 282.720 | 149,57 | 18.297 | -17,56 | ||||
| 2026-02-10 | 13F/A | Northwestern Mutual Wealth Management Co | 62.255 | 19,68 | 10.044 | -1,45 | ||||
| 2026-02-17 | 13F | Angeles Wealth Management, Llc | 0 | -100,00 | 0 | |||||
| 2026-01-09 | 13F | Teamwork Financial Advisors, LLC | 78.855 | 39,91 | 12.722 | 15,21 | ||||
| 2026-02-06 | 13F | Payden & Rygel | 35.400 | 3.118,18 | 6 | |||||
| 2025-11-13 | 13F | Glenmede Investment Management, LP | 17.703 | 38,64 | 3.468 | 40,18 | ||||
| 2026-01-16 | 13F | Kendall Capital Management | 4.910 | -14,24 | 792 | -29,35 | ||||
| 2026-02-03 | 13F | Asset Planning,Inc | 100 | 0,00 | 20 | 0,00 | ||||
| 2026-02-12 | 13F | Intesa Sanpaolo Wealth Management | 88 | 14 | ||||||
| 2026-03-16 | 13F | Osbon Capital Management Llc | 27 | 4 | ||||||
| 2026-02-17 | 13F | Harvey Capital Management Inc | 0 | -100,00 | 0 | |||||
| 2025-11-14 | 13F | Mount Yale Investment Advisors, LLC | 0 | -100,00 | 0 | -100,00 | ||||
| 2026-01-30 | 13F | Turning Point Benefit Group, Inc. | 1.980 | 5,04 | 319 | -15,83 | ||||
| 2026-02-17 | 13F | Advisor Group Holdings, Inc. | 170.128 | -8,02 | 27.452 | -23,23 | ||||
| 2026-01-23 | 13F | Smith, Moore & Co. | 1.251 | -5,16 | 202 | -22,09 | ||||
| 2026-02-05 | 13F | RiverFront Investment Group, LLC | 2.244 | 362 | ||||||
| 2026-02-12 | 13F | Wealthspire Advisors, LLC | 1.709 | 87,80 | 276 | 54,49 | ||||
| 2026-02-17 | 13F | Advanced Portfolio Management, LLC | 8.058 | -42,50 | 1.300 | -57,03 | ||||
| 2026-01-30 | 13F | Interchange Capital Partners, LLC | 3.089 | -0,71 | 498 | -18,23 | ||||
| 2026-02-17 | 13F | Signature Equity Partners, LLC | 879 | 142 | ||||||
| 2026-01-20 | 13F | Toth Financial Advisory Corp | 60 | -98,75 | 10 | -99,04 | ||||
| 2025-11-14 | 13F | Cubist Systematic Strategies, LLC | Put | 147.200 | 76,08 | 28.839 | 78,00 | |||
| 2026-01-26 | 13F | Kirr Marbach & Co Llc /in/ | 167.087 | -0,91 | 26.956 | -18,40 | ||||
| 2026-02-06 | 13F | Jag Capital Management, Llc | 0 | -100,00 | 0 | |||||
| 2025-11-14 | 13F | Cubist Systematic Strategies, LLC | Call | 168.200 | 12,28 | 32.954 | 13,51 | |||
| 2025-11-14 | 13F | Cubist Systematic Strategies, LLC | 1.937 | 379 | ||||||
| 2026-02-11 | 13F | VMS Asset Management Limited | 34.380 | 5.547 | ||||||
| 2025-09-29 | NP | QDPL - Pacer Metaurus US Large Cap Dividend Multiplier 400 ETF | 6.167 | 13,91 | 1.286 | 83,45 | ||||
| 2025-11-14 | 13F | Wolverine Trading, Llc | 50.973 | 169,44 | 10.090 | 173,49 | ||||
| 2025-11-14 | 13F | Wolverine Trading, Llc | Call | 601.700 | -11,21 | 119.100 | -9,89 | |||
| 2025-09-25 | NP | JPUS - JPMorgan Diversified Return U.S. Equity ETF | 8.542 | -31,09 | 1.781 | 10,90 | ||||
| 2026-02-09 | 13F | Beck Bode, LLC | 103.280 | -0,36 | 16.662 | -17,95 | ||||
| 2025-11-14 | 13F | Wolverine Trading, Llc | Put | 580.800 | 13,68 | 114.964 | 15,37 | |||
| 2026-02-13 | 13F | Level Four Advisory Services, Llc | 3.009 | -49,74 | 486 | -58,62 | ||||
| 2025-11-14 | 13F | Binnacle Investments Inc | 25 | 0,00 | 5 | 0,00 | ||||
| 2025-10-16 | 13F | Park Capital Management, LLC / WI | 0 | -100,00 | 0 | -100,00 | ||||
| 2026-01-14 | 13F | Eastern Bank | 1 | 0 | ||||||
| 2026-01-15 | 13F | Trust Co | 3 | 0 | ||||||
| 2026-01-28 | 13F | Kapitalo Investimentos Ltda | 105.000 | 16.940 | ||||||
| 2026-02-17 | 13F | Parkwood LLC | 6.321 | 1 | ||||||
| 2026-01-08 | 13F | NorthCrest Asset Manangement, LLC | 1.265 | 206 | ||||||
| 2025-11-14 | 13F | Credit Capital Investments LLC | 0 | -100,00 | 0 | |||||
| 2025-09-29 | NP | HCMT - Direxion HCM Tactical Enhanced US ETF | 2.525 | 23,17 | 527 | 98,49 | ||||
| 2026-02-10 | 13F | Principia Wealth Advisory, LLC | 12 | -14,29 | 2 | -50,00 | ||||
| 2026-01-26 | 13F | JNBA Financial Advisors | 506 | 1,20 | 82 | -16,49 | ||||
| 2025-11-14 | 13F | Concentric Capital Strategies, LP | 0 | -100,00 | 0 | |||||
| 2026-01-13 | 13F | Norden Group Llc | 1.638 | -9,10 | 264 | -25,21 | ||||
| 2026-01-28 | 13F | Turtle Creek Wealth Advisors, LLC | 0 | -100,00 | 0 | |||||
| 2026-02-04 | 13F | Virginia Retirement Systems Et Al | 150.200 | 8,21 | 24.232 | -10,89 | ||||
| 2026-02-11 | 13F | Picton Mahoney Asset Management | 69.261 | 2,55 | 11.174 | 85.846,15 | ||||
| 2026-02-13 | 13F | Banco Santander, S.A. | 9.321 | 1.504 | ||||||
| 2026-02-17 | 13F | Hampton Road Capital Management LP | 0 | -100,00 | 0 | |||||
| 2026-02-13 | 13F | Brown Advisory Inc | 55.213 | -1,80 | 8.908 | -19,14 | ||||
| 2025-09-26 | NP | FEKFX - Fidelity Equity-Income K6 Fund This fund is a listed as child fund of Fmr Llc and if that institution has disclosed ownership in this security, then these positions will not be double counted when calculating total shares and total value | 11.713 | 10,15 | 2.443 | 77,21 | ||||
| 2026-01-16 | 13F | Tema Etfs Llc | 5.256 | 9,25 | 848 | -10,08 | ||||
| 2026-02-09 | 13F | Prairie Wealth Advisors, Inc. | 0 | -100,00 | 791 | -14,21 | ||||
| 2026-01-27 | 13F | Birch Hill Investment Advisors LLC | 3.210 | 518 | ||||||
| 2026-02-02 | 13F | Ashton Thomas Securities, Llc | 2.120 | 15,53 | 342 | -4,74 | ||||
| 2026-02-12 | 13F | Nuveen, LLC | 2.672.894 | -3,04 | 431.218 | -20,16 | ||||
| 2025-09-26 | NP | TRPWX - TIAA-CREF Mid-Cap Growth Fund Institutional Class | 123.041 | 234,71 | 25.659 | 438,47 | ||||
| 2025-09-29 | NP | PTLC - Pacer Trendpilot US Large Cap ETF | 21.136 | -9,63 | 4.408 | 12,17 | ||||
| 2025-11-14 | 13F | Royal Bank Of Canada | Put | 0 | -100,00 | 0 | -100,00 | |||
| 2026-01-20 | 13F | J2 Capital Management Inc | 2.309 | -5,56 | 373 | -22,34 | ||||
| 2026-02-11 | 13F | Aspetuck Financial Management LLC | 4.430 | 0,00 | 715 | -17,65 | ||||
| 2025-09-26 | NP | INVESCO ACTIVELY MANAGED EXCHANGE-TRADED FUND TRUST - Invesco S&P 500 Equal Weight Income Advantage ETF | 3.667 | -2,00 | 765 | 57,53 | ||||
| 2026-02-04 | 13F | Ameritas Advisory Services, LLC | 7.656 | 7.556,00 | 1.235 | 6.400,00 | ||||
| 2026-02-02 | 13F | Bay Harbor Wealth Management, LLC | 37 | 37,04 | 6 | 0,00 | ||||
| 2025-11-14 | 13F | Yaupon Capital Management LP | Call | 0 | -100,00 | 0 | -100,00 | |||
| 2025-09-29 | NP | KCGIX - Knights of Columbus Large Cap Growth Fund I Shares | 10.670 | -0,36 | 2.225 | 60,30 | ||||
| 2026-01-06 | 13F | Afg Fiduciary Services Limited Partnership | 3.489 | 7,39 | 576 | -11,93 | ||||
| 2026-01-22 | 13F | Personal Cfo Solutions, Llc | 3.197 | -3,47 | 516 | -20,52 | ||||
| 2025-11-10 | 13F | Optiver Holding B.V. | 0 | -100,00 | 0 | |||||
| 2025-10-17 | 13F | Chesapeake Asset Management Llc | 0 | -100,00 | 0 | -100,00 | ||||
| 2026-02-05 | 13F | iA Global Asset Management Inc. | 0 | -100,00 | 0 | |||||
| 2026-01-23 | 13F | Aspect Partners, LLC | 1 | 0 | ||||||
| 2026-02-13 | 13F | American Century Companies Inc | 1.653.163 | -3,39 | 266.705 | -20,45 | ||||
| 2026-01-20 | 13F | Hanson & Doremus Investment Management | 0 | -100,00 | 0 | |||||
| 2026-01-29 | 13F | Farmers & Merchants Trust Co of Long Beach | 10.541 | -0,17 | 1.701 | -17,79 | ||||
| 2025-11-14 | 13F | Wetherby Asset Management Inc | 4.130 | 8,09 | 809 | 9,32 | ||||
| 2026-02-11 | 13F | West Family Investments, Inc. | 2.499 | 0,00 | 403 | -17,59 | ||||
| 2026-02-12 | 13F | Andina Capital Management, LLC | 3.220 | 1,87 | 519 | -16,16 | ||||
| 2026-02-12 | 13F | Summit Financial, LLC | 2.635 | 26,50 | 425 | 4,17 | ||||
| 2026-02-11 | 13F | Jpmorgan Chase & Co | Put | 79.000 | 517,19 | 12.745 | 408,38 | |||
| 2026-02-11 | 13F | Jpmorgan Chase & Co | 10.745.366 | -1,74 | 1.733.550 | -19,08 | ||||
| 2026-02-17 | 13F | BTG Pactual Asset Management US LLC | 39.323 | -0,61 | 6.344 | -18,17 | ||||
| 2025-11-14 | 13F | Texas Permanent School Fund | 0 | -100,00 | 0 | -100,00 | ||||
| 2026-02-13 | 13F | Bridgefront Capital, LLC | 4.933 | 796 | ||||||
| 2026-02-03 | 13F | NewEdge Wealth, LLC | 349.327 | 3,30 | 56.357 | -12,01 | ||||
| 2026-02-10 | 13F | Fideuram Asset Management (Ireland) dac | 19 | 3 | ||||||
| 2026-02-13 | 13F | Forest Avenue Capital Management LP | 1.121.665 | 61,32 | 180.958 | 32,84 | ||||
| 2026-02-17 | 13F | Third Point LLC | 1.005.000 | 7,49 | 162.137 | -11,49 | ||||
| 2026-01-29 | 13F | State Of Michigan Retirement System | 83.400 | -3,14 | 13.455 | -20,24 | ||||
| 2025-09-26 | NP | FLCPX - Fidelity SAI U.S. Large Cap Index Fund This fund is a listed as child fund of Fmr Llc and if that institution has disclosed ownership in this security, then these positions will not be double counted when calculating total shares and total value | 88.834 | -12,89 | 18.525 | 40,13 | ||||
| 2026-02-12 | 13F | Jane Street Group, Llc | Put | 5.720.400 | 48,38 | 922.872 | 22,18 | |||
| 2026-02-12 | 13F | Jane Street Group, Llc | Call | 790.300 | -43,62 | 127.499 | -53,57 | |||
| 2026-02-12 | 13F | Jane Street Group, Llc | 2.735.140 | 120,25 | 441.260 | 81,37 | ||||
| 2026-02-11 | 13F | MCF Advisors LLC | 14 | 7,69 | 2 | 0,00 | ||||
| 2026-02-17 | 13F | DSC Meridian Capital LP | 99.349 | -26,05 | 16.028 | -39,11 | ||||
| 2026-02-03 | 13F | Morse Asset Management, Inc | 23.693 | -4,73 | 3.822 | -21,55 | ||||
| 2026-02-13 | 13F | Rubric Capital Management LP | 2.000.000 | 322.660 | ||||||
| 2025-11-14 | 13F | Ulysses Management LLC | 0 | -100,00 | 0 | |||||
| 2025-09-29 | NP | BMVP - Invesco Dynamic Market ETF This fund is a listed as child fund of Invesco Ltd. and if that institution has disclosed ownership in this security, then these positions will not be double counted when calculating total shares and total value | 0 | -100,00 | 0 | -100,00 | ||||
| 2026-02-13 | 13F | Victory Capital Management Inc | 114.327 | -55,26 | 18.444 | -63,16 | ||||
| 2026-02-18 | 13F | Beacon Pointe Advisors, LLC | Call | 2.000 | -9,09 | 323 | -25,29 | |||
| 2026-02-18 | 13F | Beacon Pointe Advisors, LLC | 4.650 | 22,21 | 750 | 0,67 | ||||
| 2025-09-25 | NP | AMTAX - AB All Market Real Return Portfolio Class A | 1.550 | -46,46 | 323 | -13,87 | ||||
| 2026-01-22 | 13F | City Holding Co | 30 | -18,92 | 5 | -42,86 | ||||
| 2026-01-28 | 13F | Davis Capital Management | 4 | 33,33 | 1 | |||||
| 2026-01-29 | 13F | Pictet Asset Management Holding SA | 1.267.333 | 40,78 | 204.459 | 15,93 | ||||
| 2026-02-06 | 13F | Cullen/frost Bankers, Inc. | 944 | 14,98 | 152 | -5,00 | ||||
| 2026-02-17 | 13F | Sandler Capital Management | 7.463 | 53,09 | 1.204 | 26,07 | ||||
| 2025-09-26 | NP | ETLGX - E*TRADE No Fee Large Cap Index Fund | 213 | 309,62 | 44 | 633,33 | ||||
| 2026-01-07 | 13F | Sagespring Wealth Partners, Llc | 2.783 | 7,66 | 449 | -11,46 | ||||
| 2026-01-21 | 13F | Yousif Capital Management, Llc | 35.051 | -13,70 | 5.496 | -30,92 | ||||
| 2026-02-09 | 13F | Cary Street Partner Investment Advisory Llc | 986 | -18,24 | 159 | -32,63 | ||||
| 2026-02-17 | 13F | Tcw Group Inc | 267.005 | 43.076 | ||||||
| 2026-02-03 | 13F | Anfield Capital Management, LLC | 0 | -100,00 | 0 | |||||
| 2026-02-04 | 13F | Oregon Public Employees Retirement Fund | 36.454 | 0,12 | 5.881 | -17,55 | ||||
| 2026-02-17 | 13F | EFG International AG | 4.921 | 794 | ||||||
| 2026-02-17 | 13F | MIRAE ASSET GLOBAL ETFS HOLDINGS Ltd. | 86.031 | -4,39 | 13.879 | -21,27 | ||||
| 2026-01-15 | 13F | Lodestone Wealth Management LLC | 29 | 5 | ||||||
| 2026-02-02 | 13F | Qrg Capital Management, Inc. | 57.637 | -1,18 | 9.299 | -18,62 | ||||
| 2026-02-14 | 13F | Frec Markets, Inc. | 1.895 | 306 | ||||||
| 2026-01-28 | 13F | Key Client Fiduciary Advisors, LLC | 1.456 | 17,04 | 235 | -3,70 | ||||
| 2026-01-14 | 13F | Goelzer Investment Management, Inc. | 7.098 | 1.145 | ||||||
| 2026-02-19 | 13F | CI Private Wealth, LLC | 907.611 | 584,95 | 18.171 | -30,01 | ||||
| 2026-01-12 | 13F | Brucke Financial, Inc. | 2.040 | 19,58 | 329 | 2,49 | ||||
| 2026-01-21 | 13F | Clayton Financial Group LLC | 18 | 3 | ||||||
| 2026-01-30 | 13F | North Star Investment Management Corp. | 243 | -33,24 | 39 | -45,07 | ||||
| 2026-01-28 | 13F | Cornerstone Advisory, LLC | 3.633 | 586 | ||||||
| 2026-02-17 | 13F | Capital Planning Advisors, LLC | 0 | -100,00 | 0 | |||||
| 2026-02-13 | 13F | Towarzystwo Funduszy Inwestycyjnych Pzu Sa | 0 | -100,00 | 0 | |||||
| 2025-09-25 | NP | ESGG - FlexShares STOXX Global ESG Impact Index Fund | 780 | -6,70 | 163 | 50,00 | ||||
| 2026-02-12 | 13F | JPL Wealth Management, LLC | 0 | -100,00 | 0 | |||||
| 2026-02-04 | 13F | HighPoint Advisor Group LLC | 3.369 | -1,66 | 544 | -19,08 | ||||
| 2026-02-12 | 13F | Advisors Asset Management, Inc. | 36.021 | 12,12 | 5.811 | -7,67 | ||||
| 2025-09-26 | NP | FPWR - First Trust EIP Carbon Impact ETF This fund is a listed as child fund of First Trust Advisors Lp and if that institution has disclosed ownership in this security, then these positions will not be double counted when calculating total shares and total value | 3.408 | 10,01 | 711 | 77,06 | ||||
| 2025-11-07 | 13F | Synovus Financial Corp | 2.968 | 9,12 | 582 | 10,25 | ||||
| 2026-01-12 | 13F | Private Wealth Group, LLC | 2.007 | 0,40 | 324 | -17,39 | ||||
| 2026-01-26 | 13F | PFG Investments, LLC | 1.578 | 255 | ||||||
| 2026-02-10 | 13F | Core Wealth Advisors, Llc | 21 | 3 | ||||||
| 2026-02-17 | 13F | Fwl Investment Management, Llc | 213 | 34 | ||||||
| 2026-01-27 | 13F | WealthCollab, LLC | 78 | 0,00 | 13 | -20,00 | ||||
| 2026-02-17 | 13F | Lighthouse Investment Partners, LLC | Call | 0 | -100,00 | 0 | ||||
| 2026-02-17 | 13F | Modern Wealth Management, LLC | 0 | -100,00 | 0 | |||||
| 2026-01-14 | 13F | ORG Wealth Partners, LLC | 2.628 | 6,83 | 424 | -12,03 | ||||
| 2026-02-03 | 13F | International Assets Investment Management, Llc | 2.798 | 0,04 | 451 | -12,77 | ||||
| 2025-09-26 | NP | TOV - JLens 500 Jewish Advocacy U.S. ETF | 985 | 18,39 | 205 | 91,59 | ||||
| 2026-02-17 | 13F | Harvest Investment Services, LLC | 9.869 | -4,43 | 1.592 | -21,30 | ||||
| 2026-02-12 | 13F | Insigneo Advisory Services, Llc | 5.366 | 16,00 | 866 | -4,53 | ||||
| 2026-01-23 | 13F | Diversify Advisory Services, LLC | 18.670 | 98,68 | 3.110 | 71,44 | ||||
| 2026-02-17 | 13F | Maryland State Retirement & Pension System | 16.664 | 0,00 | 2.688 | -17,65 | ||||
| 2026-02-12 | 13F | BRYN MAWR TRUST Co | 18 | 0,00 | 3 | -33,33 | ||||
| 2026-02-17 | 13F | Avala Global LP | 0 | -100,00 | 0 | -100,00 | ||||
| 2025-11-14 | 13F | PineBridge Investments, L.P. | 29.072 | -26,22 | 5.696 | -25,43 | ||||
| 2026-01-21 | 13F | Cidel Asset Management Inc | 0 | -100,00 | 0 | |||||
| 2025-09-29 | NP | CADVX - Calamos Dividend Growth Fund Class A | 1.015 | 0,00 | 212 | 61,07 | ||||
| 2026-02-17 | 13F | Ardsley Advisory Partners Lp | 5.000 | 807 | ||||||
| 2026-01-29 | 13F | Guardian Asset Advisors, LLC | 2.336 | 2,41 | 377 | -15,47 | ||||
| 2026-02-17 | 13F | Wiley Bros.-aintree Capital, Llc | 27.949 | 63,91 | 4.508 | 34,90 | ||||
| 2025-09-26 | NP | FHOFX - Fidelity Series Large Cap Growth Index Fund This fund is a listed as child fund of Fmr Llc and if that institution has disclosed ownership in this security, then these positions will not be double counted when calculating total shares and total value | 22.877 | 1,22 | 4.771 | 62,85 | ||||
| 2026-02-13 | 13F | Resources Investment Advisors, LLC. | 4.810 | -13,33 | 776 | -28,70 | ||||
| 2026-02-06 | 13F | Cumberland Partners Ltd | 29.025 | -7,93 | 4.683 | -24,19 | ||||
| 2026-02-17 | 13F | Valiant Capital Management, L.P. | 178.927 | -8,22 | 28.866 | -24,42 | ||||
| 2026-01-28 | 13F | Oversea-Chinese Banking CORP Ltd | 1.696 | -22,73 | 274 | -36,51 | ||||
| 2026-02-02 | 13F | Robertson Stephens Wealth Management, LLC | 1.280 | 8,57 | 207 | -10,43 | ||||
| 2026-02-13 | 13F | Financial Network Wealth Advisors LLC | 128 | 100,00 | 21 | 66,67 | ||||
| 2026-02-17 | 13F | Sovereign's Capital Management, LLC | 29.611 | -6,11 | 4.777 | -22,68 | ||||
| 2026-02-13 | 13F | Morgan Stanley | 7.914.694 | -1,73 | 1.276.878 | -19,08 | ||||
| 2026-02-13 | 13F | Ceredex Value Advisors LLC | 0 | -100,00 | 0 | |||||
| 2026-01-26 | 13F | Xcel Wealth Management, LLC | 1.622 | 262 | ||||||
| 2025-11-14 | 13F | Point72 Hong Kong Ltd | 47.550 | 9.316 | ||||||
| 2026-02-24 | 13F | Bell Investment Advisors, Inc | 81 | -3,57 | 13 | -18,75 | ||||
| 2025-10-20 | 13F | Shilanski & Associates, Inc. | 15.888 | 4,21 | 3.113 | 5,35 | ||||
| 2026-02-13 | 13F | Chevy Chase Trust Holdings, Inc. | 161.627 | -0,69 | 26.075 | -18,22 | ||||
| 2026-01-23 | 13F | Patton Fund Management, Inc. | 1.497 | -91,03 | 242 | -92,63 | ||||
| 2026-02-10 | 13F | Quantbot Technologies LP | 28.010 | 1.401,88 | 4.519 | 1.137,81 | ||||
| 2026-02-17 | 13F | Aventail Capital Group, LP | 24.931 | -74,75 | 4.022 | -79,21 | ||||
| 2025-11-13 | 13F | Texas Capital Bancshares Inc/tx | 5 | 1 | ||||||
| 2025-09-25 | NP | HELO - JPMorgan Hedged Equity Laddered Overlay ETF | 79.647 | 38,37 | 16.610 | 122,61 | ||||
| 2026-02-09 | 13F | Emerald Advisers, Llc | 4.132 | -4,29 | 667 | -21,18 | ||||
| 2026-02-13 | 13F | Rafferty Asset Management, LLC | 38.166 | 6,21 | 6.157 | -12,54 | ||||
| 2026-02-10 | 13F | GKV Capital Management Co., Inc. | 1.260 | 1,61 | 203 | -16,12 | ||||
| 2026-02-12 | 13F | IFC & Insurance Marketing, Inc. | 214 | 0 | ||||||
| 2025-10-23 | 13F | StoneCrest Wealth Management, Inc. | 0 | -100,00 | 0 | |||||
| 2026-02-13 | 13F | Ieq Capital, Llc | 0 | -100,00 | 0 | |||||
| 2025-09-26 | NP | ELCV - Eventide High Dividend ETF | 10.106 | 17,12 | 2.108 | 88,46 | ||||
| 2026-02-05 | 13F | Navalign, LLC | 351 | 57 | ||||||
| 2026-02-13 | 13F | Ostrum Asset Management | 384 | -25,15 | 62 | -39,00 | ||||
| 2026-02-02 | 13F | Avidian Wealth Solutions, LLC | 1.709 | 9,69 | 276 | -9,84 | ||||
| 2026-02-11 | 13F | Inceptionr Llc | 7.089 | 17,35 | 1.144 | -3,38 | ||||
| 2025-09-26 | NP | FLVCX - Fidelity Leveraged Company Stock Fund This fund is a listed as child fund of Fmr Llc and if that institution has disclosed ownership in this security, then these positions will not be double counted when calculating total shares and total value | 1.061.900 | -0,99 | 221.449 | 59,28 | ||||
| 2026-02-17 | 13F | Duquesne Family Office LLC | 0 | -100,00 | 0 | |||||
| 2026-02-17 | 13F | Engle Capital Management, L.P. | 110.000 | 29,14 | 17.746 | 6,34 | ||||
| 2025-09-26 | NP | ETTOX - E*TRADE No Fee Total Market Index Fund | 161 | 98,77 | 34 | 230,00 | ||||
| 2026-02-11 | 13F | CenterBook Partners LP | 6.904 | 1.114 | ||||||
| 2026-01-12 | 13F | VisionPoint Advisory Group, LLC | 1.816 | -5,61 | 293 | -22,34 | ||||
| 2026-02-04 | 13F | LRI Investments, LLC | 3.972 | 780,71 | 641 | 627,27 | ||||
| 2026-02-12 | 13F | StoneX Group Inc. | 0 | -100,00 | 0 | |||||
| 2026-02-03 | 13F | SBI Securities Co., Ltd. | 4.913 | -4,25 | 793 | -21,19 | ||||
| 2026-02-13 | 13F | Prudential Financial Inc | 162.822 | -14,20 | 26.268 | -29,35 | ||||
| 2025-09-26 | NP | FBCG - Fidelity Blue Chip Growth ETF This fund is a listed as child fund of Fmr Llc and if that institution has disclosed ownership in this security, then these positions will not be double counted when calculating total shares and total value | 28.142 | 5.869 | ||||||
| 2025-11-13 | 13F | FORA Capital, LLC | 0 | -100,00 | 0 | -100,00 | ||||
| 2026-02-17 | 13F | Value Aligned Research Advisors, LLC | 716.107 | -54,16 | 115.530 | -62,25 | ||||
| 2026-02-12 | 13F | CIBC Private Wealth Group, LLC | 33.889 | -3,58 | 5.467 | -20,61 | ||||
| 2026-02-17 | 13F | Lone Pine Capital Llc | 5.211.885 | 10,91 | 840.833 | -8,67 | ||||
| 2025-09-26 | NP | TISPX - TIAA-CREF S&P 500 Index Fund Institutional Class | 70.931 | -3,37 | 14.792 | 55,45 | ||||
| 2026-02-11 | 13F | Gordian Capital Singapore Pte Ltd | 534 | -56,73 | 38 | -84,23 | ||||
| 2026-02-13 | 13F | State Street Corp | 16.474.869 | 2,69 | 2.657.891 | -15,44 | ||||
| 2026-02-12 | 13F | Great Valley Advisor Group, Inc. | 1.550 | -45,25 | 250 | -54,87 | ||||
| 2025-09-26 | NP | FIUIX - Fidelity Telecom and Utilities Fund This fund is a listed as child fund of Fmr Llc and if that institution has disclosed ownership in this security, then these positions will not be double counted when calculating total shares and total value | 506.021 | 92,02 | 105.526 | 208,91 | ||||
| 2026-02-10 | 13F | Nomura Asset Management Co Ltd | 112.536 | 0,09 | 18.155 | -17,58 | ||||
| 2025-11-13 | 13F | United Super Pty Ltd in its capacity as Trustee for the Construction & Building Unions Superannuation Fund | 0 | -100,00 | 0 | |||||
| 2026-02-03 | 13F | Crossmark Global Holdings, Inc. | 39.387 | 4,99 | 6.354 | -13,55 | ||||
| 2026-02-17 | 13F | Parallax Volatility Advisers, L.P. | Put | 943.200 | 44,73 | 152.166 | 19,18 | |||
| 2026-02-17 | 13F | Nomura Holdings Inc | Call | 44.400 | 398,88 | 7.163 | 310,96 | |||
| 2026-02-17 | 13F | Parallax Volatility Advisers, L.P. | 120.021 | 1.099,49 | 19.363 | 887,86 | ||||
| 2026-02-17 | 13F | Nomura Holdings Inc | Put | 50.000 | 2,04 | 8.066 | -15,98 | |||
| 2026-02-17 | 13F | Woodline Partners LP | 54.716 | 29,98 | 8.827 | 7,03 | ||||
| 2026-02-17 | 13F | Parallax Volatility Advisers, L.P. | Call | 15.800 | -71,53 | 2.549 | -76,56 | |||
| 2026-02-17 | 13F | Nomura Holdings Inc | 93.701 | -2,03 | 15.117 | -19,33 | ||||
| 2026-02-17 | 13F | Tortoise Capital Advisors, L.l.c. | 404.502 | 11,60 | 65.258 | -8,10 | ||||
| 2026-02-17 | 13F | Value Aligned Research Advisors, LLC | Call | 89.300 | 52,65 | 14.407 | 25,70 | |||
| 2026-02-17 | 13F | Value Aligned Research Advisors, LLC | Put | 51.900 | 0,00 | 8.373 | -17,65 | |||
| 2026-01-29 | 13F | J. Team Financial, Inc. | 1.533 | -3,89 | 247 | -20,83 | ||||
| 2026-02-09 | 13F | Clear Investment Research, Llc | 0 | -100,00 | 0 | |||||
| 2026-02-17 | 13F | Quantitative Investment Management, LLC | 35.701 | 6 | ||||||
| 2026-01-27 | 13F | ZEGA Investments, LLC | 3.974 | -10,62 | 641 | -26,41 | ||||
| 2026-02-12 | 13F | Colonial Trust Advisors | 50 | 0,00 | 8 | -11,11 | ||||
| 2025-09-29 | NP | PEVC - Pacer PE/VC ETF | 6 | 0,00 | 1 | |||||
| 2026-01-20 | 13F | Independence Bank of Kentucky | 9 | 1 | ||||||
| 2026-02-06 | 13F | Keystone Financial Group | 3.315 | 17,80 | 535 | -3,09 | ||||
| 2025-09-26 | NP | FNKFX - Fidelity Mid-Cap Stock K6 Fund This fund is a listed as child fund of Fmr Llc and if that institution has disclosed ownership in this security, then these positions will not be double counted when calculating total shares and total value | 17.252 | 0,64 | 3.598 | 61,88 | ||||
| 2026-02-06 | 13F | Envestnet Portfolio Solutions, Inc. | 4.361 | -32,63 | 704 | -44,56 | ||||
| 2026-02-17 | 13F | Bank Of America Corp /de/ | Call | 0 | -100,00 | 0 | ||||
| 2026-02-17 | 13F | Evolve Private Wealth, Llc | 35.417 | 5.714 | ||||||
| 2026-02-06 | 13F | Evoke Wealth, Llc | 0 | -100,00 | 0 | |||||
| 2026-02-03 | 13F | Pilgrim Partners Asia Pte Ltd | 260 | 42 | ||||||
| 2026-01-30 | 13F | Sigma Planning Corp | 5.542 | 0,22 | 1.006 | -7,20 | ||||
| 2026-02-09 | 13F | Frazier Financial Advisors, LLC | 4 | 0,00 | 1 | |||||
| 2026-02-17 | 13F | Sherman Porfolios, Llc | 0 | -100,00 | 0 | |||||
| 2026-02-04 | 13F | Swiss Life Asset Management Ltd | 45.456 | -6,30 | 7.333 | -22,84 | ||||
| 2026-01-27 | 13F | Prakash Investment Advisors Llc | 13.360 | -7,61 | 2.155 | -23,93 | ||||
| 2026-02-13 | 13F | Financial Sense Advisors, Inc. | 2.990 | 3,53 | 482 | -14,69 | ||||
| 2026-02-17 | 13F | Integrated Advisors Network LLC | 3.596 | -80,76 | 580 | -84,16 | ||||
| 2025-09-29 | NP | UTSL - Direxion Daily Utilities Bull 3X Shares | 5.658 | -2,04 | 1.180 | 57,62 | ||||
| 2026-01-21 | 13F | MBL Wealth, LLC | 2.311 | 373 | ||||||
| 2026-01-26 | 13F | Paradigm Financial Partners, Llc | 1.713 | 12,62 | 276 | -7,07 | ||||
| 2026-02-09 | 13F | Quest Partners LLC | 380 | -36,56 | 61 | -47,86 | ||||
| 2026-02-13 | 13F | Ripple Effect Asset Management LP | Put | 0 | -100,00 | 0 | -100,00 | |||
| 2026-01-15 | 13F | Fifth Third Wealth Advisors LLC | 33.313 | 217,42 | 5.374 | 161,38 | ||||
| 2026-01-20 | 13F | Jackson Wealth Management, LLC | 0 | -100,00 | 0 | |||||
| 2026-02-05 | 13F | Northwestern Mutual Investment Management Company, Llc | 10.176 | 0,25 | 1.642 | -17,45 | ||||
| 2026-02-11 | 13F | Empowered Funds, LLC | 55.173 | 138,67 | 8.901 | 96,53 | ||||
| 2026-02-17 | 13F | Limestone Investment Advisors LP | 9.568 | -39,56 | 1.544 | -50,24 | ||||
| 2025-09-25 | NP | AAUTX - Thrivent Large Cap Value Fund Class A | 140.739 | -11,07 | 29.350 | 43,06 | ||||
| 2026-02-10 | 13F | Axq Capital, Lp | 7.708 | -18,75 | 1.244 | -33,10 | ||||
| 2025-11-14 | 13F | Summit Partners Public Asset Management, Llc | Call | 0 | -100,00 | 0 | ||||
| 2026-02-17 | 13F | Keebeck Alpha, LP | 0 | -100,00 | 0 | |||||
| 2026-01-30 | 13F | Jennison Associates Llc | 1.353.285 | -19,73 | 218.326 | -33,90 | ||||
| 2026-02-10 | 13F | Thames Capital Management Llc | 0 | -100,00 | 0 | |||||
| 2026-02-17 | 13F | Freestone Grove Partners LP | 56.984 | 2.479,63 | 9.193 | 2.028,01 | ||||
| 2026-02-17 | 13F | Warren Averett Asset Management, LLC | 1.615 | 30,56 | 261 | 7,44 | ||||
| 2026-02-13 | 13F | Ripple Effect Asset Management LP | 0 | -100,00 | 0 | -100,00 | ||||
| 2026-02-26 | 13F | Anchor Investment Management, LLC | 0 | -100,00 | 0 | |||||
| 2026-01-20 | 13F | Savvy Advisors, Inc. | 1.910 | 7,36 | 308 | -11,49 | ||||
| 2026-02-11 | 13F | Vermillion Wealth Management, Inc. | 431 | 0,00 | 70 | -17,86 | ||||
| 2026-02-25 | 13F | Mariner Investment Group Llc | 5.000 | -66,67 | 807 | -72,57 | ||||
| 2026-02-25 | 13F | Mariner Investment Group Llc | Call | 35.000 | -30,00 | 197 | -46,01 | |||
| 2026-01-23 | 13F | Private Wealth Management Group, LLC | 16 | 0,00 | 3 | -33,33 | ||||
| 2026-02-11 | 13F | Illinois Municipal Retirement Fund | 32.858 | -13,39 | 5.301 | -28,69 | ||||
| 2026-02-12 | 13F | Bank Of Montreal /can/ | Call | 700 | -93,00 | 113 | -94,28 | |||
| 2026-02-13 | 13F | Squarepoint Ops LLC | Put | 242.200 | -28,19 | 39.074 | -40,87 | |||
| 2026-02-12 | 13F | Bank Of Montreal /can/ | Put | 77.500 | 12.503 | |||||
| 2026-02-13 | 13F | Squarepoint Ops LLC | 241.112 | 2.738,28 | 38.899 | 2.237,62 | ||||
| 2026-02-12 | 13F | Bank Of Montreal /can/ | 374.931 | 17,49 | 60.488 | -3,25 | ||||
| 2026-02-10 | 13F | State of Wyoming | 0 | -100,00 | 0 | |||||
| 2026-01-29 | 13F | Wealth Alliance Advisory Group, LLC | 1.992 | -4,78 | 321 | -21,52 | ||||
| 2026-01-26 | 13F | Consolidated Investment Group LLC | 12.000 | 71,43 | 1.936 | 41,14 | ||||
| 2026-02-09 | 13F | Keating Financial Advisory Services, Inc. | 176 | 28 | ||||||
| 2025-09-26 | NP | ESUM - Eventide US Market ETF | 901 | 70,00 | 188 | 175,00 | ||||
| 2026-02-13 | 13F | Squarepoint Ops LLC | Call | 421.600 | 201,14 | 68.017 | 147,98 | |||
| 2026-02-13 | 13F | TFB Advisors LLC | 4.593 | -22,96 | 741 | -39,59 | ||||
| 2025-11-14 | 13F | Temasek Holdings (Private) Ltd | 0 | -100,00 | 0 | -100,00 | ||||
| 2026-01-29 | 13F | Kickstand Ventures, Llc. | 1.326 | 214 | ||||||
| 2026-02-05 | 13F | Pinnacle Associates Ltd | 1.774 | 27,90 | 286 | 5,54 | ||||
| 2026-02-03 | 13F | Winch Advisory Services, LLC | 54 | 0,00 | 9 | -20,00 | ||||
| 2026-02-17 | 13F | Utah Retirement Systems | 55.985 | 0,00 | 9.032 | -17,65 | ||||
| 2025-10-20 | 13F | Cushing Asset Management, Lp | Call | 0 | -100,00 | 0 | -100,00 | |||
| 2026-02-17 | 13F | FIL Ltd | 39.468 | 53,20 | 6.367 | 26,15 | ||||
| 2025-11-14 | 13F | Sachem Head Capital Management LP | 0 | -100,00 | 0 | -100,00 | ||||
| 2026-02-03 | 13F | McIlrath & Eck, LLC | 249 | 0,00 | 40 | -16,67 | ||||
| 2026-01-07 | 13F | Harbor Investment Advisory, Llc | 3.175 | 495,68 | 512 | 392,31 | ||||
| 2025-10-17 | 13F | Retireful, LLC | 0 | -100,00 | 0 | |||||
| 2025-11-13 | 13F | Banque Transatlantique SA | 0 | -100,00 | 0 | |||||
| 2026-02-17 | 13F | NorthRock Partners, LLC | 0 | -100,00 | 0 | |||||
| 2025-11-14 | 13F | National Bank Of Canada /fi/ | Put | 0 | -100,00 | 0 | -100,00 | |||
| 2026-02-13 | 13F | Silvant Capital Management LLC | 67.476 | 1,37 | 10.886 | -16,53 | ||||
| 2026-02-17 | 13F | Adams Wealth Management | 1.811 | 8,38 | 293 | -10,15 | ||||
| 2026-02-17 | 13F | Trexquant Investment LP | 229.380 | 850,84 | 37.006 | 683,01 | ||||
| 2026-02-24 | 13F | Astoria Portfolio Advisors LLC. | 1.198 | 201 | ||||||
| 2026-02-10 | 13F | REAP Financial Group, LLC | 0 | -100,00 | 0 | |||||
| 2026-01-15 | 13F | Gunderson Capital Management Inc. | 37.235 | -1,61 | 6.007 | -18,98 | ||||
| 2026-02-17 | 13F | Cetera Investment Advisers | 225.861 | -5,93 | 36.438 | -22,54 | ||||
| 2026-02-17 | 13F | Cetera Investment Advisers | Call | 200 | -50,00 | 1 | -90,00 | |||
| 2026-01-21 | 13F | Jackson Square Capital, Llc | 7.549 | -19,50 | 1.218 | -33,75 | ||||
| 2026-02-09 | 13F | Allstate Corp | 25.514 | 104,59 | 4.116 | 68,48 | ||||
| 2025-11-14 | 13F | Point72 (DIFC) Ltd | Put | 0 | -100,00 | 0 | -100,00 | |||
| 2026-02-12 | 13F | Hrt Financial Lp | 32.800 | 5 | ||||||
| 2026-02-11 | 13F | Strategic Advocates LLC | 18 | 100,00 | 3 | 100,00 | ||||
| 2026-02-13 | 13F | Advyzon Investment Management, LLC | 0 | -100,00 | 0 | |||||
| 2025-09-25 | NP | HFMCX - THE HARTFORD MIDCAP FUND Class A | 606.329 | 13,84 | 126.444 | 83,14 | ||||
| 2026-02-05 | 13F | LGT Fund Management Co Ltd. | 10.322 | 1.679 | ||||||
| 2026-02-11 | 13F | Dorsey & Whitney Trust CO LLC | 2.040 | -5,38 | 329 | -22,04 | ||||
| 2025-11-04 | 13F | Guerra Advisors Inc | 7 | 1 | ||||||
| 2026-02-17 | 13F | Guggenheim Capital Llc | 41.734 | 0,73 | 6.733 | -17,06 | ||||
| 2025-10-29 | 13F | Sage Mountain Advisors LLC | 0 | -100,00 | 0 | |||||
| 2025-10-20 | 13F | Cushing Asset Management, Lp | Put | 0 | -100,00 | 0 | -100,00 | |||
| 2025-11-21 | 13F | Nebula Research & Development LLC | 0 | -100,00 | 0 | |||||
| 2025-09-25 | NP | AALGX - Thrivent Global Stock Fund Class A | 28.526 | -18,96 | 5.949 | 30,38 | ||||
| 2026-01-15 | 13F | Vaughan Nelson Investment Management, L.p. | 25 | -99,95 | 4 | -99,96 | ||||
| 2026-01-28 | 13F | Confluence Wealth Services, Inc. | 2.900 | 0,00 | 468 | -17,78 | ||||
| 2026-02-12 | 13F | Chilton Capital Management Llc | 2 | 0 | ||||||
| 2026-01-27 | 13F | Brighton Jones Llc | 0 | -100,00 | 0 | |||||
| 2026-01-29 | 13F | Elevated Financial Group LLC | 3.305 | 533 | ||||||
| 2026-02-12 | 13F | Ensign Peak Advisors, Inc | 473.588 | -13,92 | 76.404 | -29,12 | ||||
| 2026-01-22 | 13F | Bnc Wealth Management, Llc | 4.434 | -75,16 | 715 | -79,55 | ||||
| 2026-02-11 | 13F | Zions Bancorporation, National Association /ut/ | 797 | 22,05 | 129 | 0,79 | ||||
| 2025-09-25 | NP | DFVX - Dimensional US Large Cap Vector ETF | 8.855 | -2,87 | 1.847 | 56,31 | ||||
| 2026-02-02 | 13F | Sun Financial Inc | 6.615 | 1.067 | ||||||
| 2026-01-28 | 13F | Milestone Asset Management, Llc | 23.903 | -14,92 | 3.856 | -29,94 | ||||
| 2026-02-05 | 13F | Dana Investment Advisors, Inc. | 2.692 | 22,98 | 434 | 1,40 | ||||
| 2025-10-30 | 13F | Investment Management Corp /va/ /adv | 0 | -100,00 | 0 | |||||
| 2026-02-13 | 13F | Truvestments Capital Llc | 1.410 | 2.900,00 | 227 | 2.422,22 | ||||
| 2025-11-13 | 13F | Formula Growth Ltd | 0 | -100,00 | 0 | |||||
| 2026-02-06 | 13F | Empirical Asset Management, LLC | 0 | -100,00 | 0 | |||||
| 2025-11-14 | 13F | Beaconlight Capital, Llc | 0 | -100,00 | 0 | -100,00 | ||||
| 2026-02-17 | 13F | Quantessence Capital LLC | 0 | -100,00 | 0 | |||||
| 2026-02-10 | 13F | Kentucky Retirement Systems Insurance Trust Fund | 8.903 | 0,00 | 1.436 | -17,66 | ||||
| 2026-01-29 | 13F | Advisors Capital Management, LLC | 5.386 | -2,18 | 869 | -19,48 | ||||
| 2026-02-05 | 13F | Western Wealth Management, LLC | 2.132 | 0,57 | 344 | -17,11 | ||||
| 2026-02-12 | 13F | State Board Of Administration Of Florida Retirement System | 304.204 | -3,95 | 49.077 | -20,91 | ||||
| 2026-02-04 | 13F | Northeast Investment Management | 8.774 | 1.416 | ||||||
| 2026-02-10 | 13F | Thompson Siegel & Walmsley Llc | 2.358 | -92,18 | 0 | -100,00 | ||||
| 2026-02-12 | 13F | Distillate Capital Partners LLC | 130.199 | 21.005 | ||||||
| 2026-02-03 | 13F | Ethic Inc. | 6.300 | 4,18 | 1.016 | -14,19 | ||||
| 2026-02-13 | 13F | SPX Equities Gestao de Recursos Ltda | 0 | -100,00 | 0 | |||||
| 2026-01-30 | 13F | Citizens Financial Group Inc/ri | 14.888 | 1,12 | 2.402 | -16,75 | ||||
| 2026-02-13 | 13F | Great West Life Assurance Co /can/ | 172.301 | -8,91 | 28 | -27,03 | ||||
| 2026-02-17 | 13F | Aperture Investors, LLC | Call | 0 | -100,00 | 0 | ||||
| 2026-01-13 | 13F | Mather Group, Llc. | 1.704 | 83,42 | 275 | 50,55 | ||||
| 2026-01-23 | 13F | Ritholtz Wealth Management | 2.222 | -4,47 | 358 | -21,32 | ||||
| 2026-02-11 | 13F | Hughes Financial Services, LLC | 169 | -2,87 | 27 | -15,62 | ||||
| 2026-02-11 | 13F | OneAscent Investment Solutions LLC | 1.814 | 0,95 | 293 | -17,05 | ||||
| 2026-01-20 | 13F | Cigna Investments Inc /new | 3.270 | -1,06 | 1 | |||||
| 2026-01-14 | 13F | Exchange Traded Concepts, Llc | 89.582 | 4,95 | 14.452 | -13,58 | ||||
| 2026-02-17 | 13F | Aperture Investors, LLC | 0 | -100,00 | 0 | |||||
| 2026-01-21 | 13F | Petra Financial Advisors Inc | 3.203 | -6,07 | 517 | -22,75 | ||||
| 2026-02-17 | 13F | Price T Rowe Associates Inc /md/ | 2.197.728 | -6,58 | 355 | -23,04 | ||||
| 2026-02-13 | 13F | Schroder Investment Management Group | 300.711 | -52,65 | 48.514 | -61,01 | ||||
| 2026-02-17 | 13F | Fmr Llc | 16.995.465 | -14,57 | 2.741.878 | -29,65 | ||||
| 2026-02-12 | 13F | Cloud Capital Management, LLC | 0 | -100,00 | 0 | |||||
| 2026-02-18 | 13F | Mackenzie Financial Corp | 55.745 | 5,97 | 9.047 | -12,22 | ||||
| 2025-11-14 | 13F | Point72 (DIFC) Ltd | Call | 0 | -100,00 | 0 | -100,00 | |||
| 2026-02-09 | 13F | Prospera Financial Services Inc | 14.335 | 10,39 | 2.313 | -9,12 | ||||
| 2026-02-13 | 13F | Caitong International Asset Management Co., Ltd | 0 | -100,00 | 0 | |||||
| 2025-11-03 | 13F | AustralianSuper Pty Ltd | 0 | -100,00 | 0 | |||||
| 2026-01-22 | 13F | Westbourne Investments, Inc. | 20.667 | -2,50 | 3.334 | -16,46 | ||||
| 2026-02-09 | 13F | Mizuho Securities Usa Llc | 23.191 | -0,03 | 4.148 | -5,45 | ||||
| 2026-02-12 | 13F | Elo Mutual Pension Insurance Co | 22.637 | 3.652 | ||||||
| 2025-11-14 | 13F | Wexford Capital Lp | 0 | -100,00 | 0 | -100,00 | ||||
| 2026-02-05 | 13F | Cornerstone Wealth Management, LLC | 0 | -100,00 | 0 | |||||
| 2026-02-11 | 13F | Francis Financial, Inc. | 0 | -100,00 | 0 | |||||
| 2026-02-10 | 13F | FDx Advisors, Inc. | 0 | -100,00 | 0 | |||||
| 2026-02-17 | 13F | Bridgeway Capital Management Inc | 18.000 | -0,77 | 2.904 | -18,29 | ||||
| 2026-02-17 | 13F | Qube Research & Technologies Ltd | 400.636 | 185,65 | 64.635 | 135,22 | ||||
| 2026-01-07 | 13F | IAM Advisory, LLC | 9.930 | -2,14 | 1.602 | -19,47 | ||||
| 2026-02-11 | 13F | Financiere des Professionnels - Fonds d,investissement inc. | 6.425 | 0,00 | 1.037 | -17,65 | ||||
| 2026-02-10 | 13F | Fort Sheridan Advisors Llc | 12.717 | 1,02 | 2.052 | -16,83 | ||||
| 2026-02-17 | 13F | Qube Research & Technologies Ltd | Put | 275.500 | 23,10 | 44.446 | 1,37 | |||
| 2025-09-25 | NP | PTMAX - PGIM QMA LARGE-CAP CORE EQUITY FUND Class A | 2.000 | 417 | ||||||
| 2026-02-17 | 13F | Qube Research & Technologies Ltd | Call | 297.600 | 33,93 | 48.012 | 10,29 | |||
| 2026-01-27 | 13F | Godsey & Gibb Associates | 1 | 0,00 | 0 | |||||
| 2025-09-26 | NP | SPECX - Alger Spectra Fund Class A | 101.699 | 21.208 | ||||||
| 2026-01-21 | 13F | Signature Resources Capital Management, LLC | 21 | 3 | ||||||
| 2026-01-28 | 13F | Teacher Retirement System Of Texas | 60.962 | -68,48 | 9.835 | -74,04 | ||||
| 2026-02-04 | 13F | Independent Advisor Alliance | 19.420 | 0,11 | 3.133 | -17,55 | ||||
| 2025-10-07 | 13F | Nova Wealth Management, Inc. | 0 | -100,00 | 0 | |||||
| 2026-02-13 | 13F | Knollwood Investment Advisory, LLC | 25.983 | 0,00 | 4.192 | -17,66 | ||||
| 2025-09-25 | NP | HFIGX - Hartford Schroders Diversified Growth Fund Class I | 151 | 12,69 | 31 | 82,35 | ||||
| 2026-02-17 | 13F | Merewether Investment Management, LP | 397.322 | 322,58 | 64.100 | 247,99 | ||||
| 2026-02-17 | 13F | Glenmede Trust Co Na | 19.537 | 25,04 | 3.152 | 71,81 | ||||
| 2026-01-20 | 13F | Philip James Wealth Mangement, LLC | 0 | -100,00 | 0 | |||||
| 2026-01-29 | 13F | Inscription Capital, LLC | 1.553 | -2,33 | 250 | -19,61 | ||||
| 2026-02-17 | 13F | Raymond James Financial Inc | 1.375.222 | -10,95 | 222.641 | -26,42 | ||||
| 2025-09-26 | NP | JHMM - John Hancock Multifactor Mid Cap ETF | 148.159 | 0,22 | 30.897 | 61,23 | ||||
| 2025-09-29 | NP | SPXL - Direxion Daily S&P 500(R) Bull 3X Shares | 23.545 | 15,90 | 4.910 | 86,48 | ||||
| 2025-09-29 | NP | SPUU - Direxion Daily S&P 500(R) Bull 2X Shares | 1.062 | 24,36 | 221 | 100,91 | ||||
| 2025-09-29 | NP | XYLD - Global X S&P 500 Covered Call ETF This fund is a listed as child fund of Mirae Asset Global Investments Co., Ltd. and if that institution has disclosed ownership in this security, then these positions will not be double counted when calculating total shares and total value | 19.280 | -13,29 | 4.021 | 39,49 | ||||
| 2026-01-09 | 13F | Marshall Financial Group LLC | 1.510 | -80,73 | 244 | -84,17 | ||||
| 2026-01-07 | 13F | Clark & Stuart, Inc | 0 | -100,00 | 0 | |||||
| 2026-01-14 | 13F | ORG Partners LLC | 771 | -13,47 | 124 | -28,74 | ||||
| 2026-02-18 | 13F | Galaxy Group Investments LLC | 265 | 43 | ||||||
| 2025-09-25 | NP | DXUV - Dimensional US Vector Equity ETF | 3.315 | 6,94 | 691 | 72,32 | ||||
| 2025-09-25 | NP | DGRO - iShares Core Dividend Growth ETF | 137.903 | -21,88 | 28.758 | 25,68 | ||||
| 2026-02-12 | 13F | Voya Investment Management Llc | 551.421 | -7,60 | 88.961 | -23,92 | ||||
| 2026-01-27 | 13F | Purus Wealth Management, LLC | 1.278 | -39,00 | 206 | -49,76 | ||||
| 2026-02-13 | 13F | Cornercap Investment Counsel Inc | 9.865 | -1,32 | 1.592 | -18,74 | ||||
| 2026-01-23 | 13F | State of Alaska, Department of Revenue | 31.998 | -6,72 | 5 | -16,67 | ||||
| 2025-09-26 | NP | AAICX - Alger AI Enablers & Adopters Fund Class C | 878 | 36,55 | 183 | 120,48 | ||||
| 2025-09-29 | NP | Calamos Strategic Total Return Fund | 125.845 | 0,00 | 26.244 | 60,87 | ||||
| 2026-01-21 | 13F | Sunburst Financial Group, LLC | 0 | -100,00 | 0 | -100,00 | ||||
| 2026-01-29 | 13F | Washington Capital Management Inc | 1.300 | 210 | ||||||
| 2026-02-13 | 13F | Cloverfields Capital Group, Lp | 7.502 | 76,10 | 1.210 | 45,08 | ||||
| 2026-02-17 | 13F | Lombard Odier Asset Management (USA) Corp | 3.816 | 616 | ||||||
| 2026-02-06 | 13F | New Millennium Group LLC | 143 | 0,00 | 23 | -17,86 | ||||
| 2026-02-13 | 13F | Seven Mile Advisory | 0 | -100,00 | 0 | |||||
| 2026-01-12 | 13F | Gilman Hill Asset Management, LLC | 1.450 | 0,00 | 234 | -17,96 | ||||
| 2026-02-17 | 13F | Toronto Dominion Bank | Call | 2.800 | 0,00 | 452 | -17,70 | |||
| 2026-01-26 | 13F | Roman Butler Fullerton & Co | 2.111 | -2,40 | 339 | -21,58 | ||||
| 2026-01-29 | 13F | Quent Capital, LLC | 111 | -13,28 | 18 | -32,00 | ||||
| 2026-02-13 | 13F | Night Owl Capital Management, LLC | 0 | -100,00 | 0 | |||||
| 2025-10-31 | 13F | Symphony Financial, Ltd. Co. | 0 | -100,00 | 0 | -100,00 | ||||
| 2025-09-29 | NP | CFMCX - Column Mid Cap Fund | 13.930 | -5,13 | 2.634 | 11,75 | ||||
| 2025-11-13 | 13F/A | Cynosure Management, Llc | 0 | -100,00 | 0 | -100,00 | ||||
| 2026-01-27 | 13F | Asset Management One Co., Ltd. | 139.957 | 0,76 | 22.649 | -16,77 | ||||
| 2026-02-12 | 13F | Rossby Financial, LCC | 1.460 | -40,34 | 236 | -52,33 | ||||
| 2026-02-17 | 13F | Herold Advisors, Inc. | 2.875 | -0,69 | 464 | -18,34 | ||||
| 2026-02-02 | 13F | Fogel Capital Management, Inc. | 8.436 | 6,69 | 1.361 | -12,20 | ||||
| 2026-02-13 | 13F | Journey Strategic Wealth Llc | 2.309 | -4,94 | 373 | -21,68 | ||||
| 2026-02-13 | 13F | Wells Fargo & Company/mn | 1.037.549 | 11,00 | 167.388 | -8,60 | ||||
| 2026-03-04 | 13F | SHP Wealth Management | 460 | 74 | ||||||
| 2026-01-20 | 13F | Whalen Wealth Management Inc. | 0 | -100,00 | 0 | |||||
| 2026-02-13 | 13F | Wells Fargo & Company/mn | Put | 4.000 | 0,00 | 645 | -17,62 | |||
| 2026-02-10 | 13F | Essex Financial Services, Inc. | 1.680 | 60,00 | 271 | 32,20 | ||||
| 2025-09-26 | NP | ACAAX - Alger Capital Appreciation Fund Class A | 240.068 | 73,08 | 50.064 | 178,44 | ||||
| 2026-02-04 | 13F | Pensionmark Financial Group, Llc | 8.057 | 85,82 | 445 | -47,70 | ||||
| 2025-09-29 | NP | XYLG - Global X S&P 500 Covered Call & Growth ETF This fund is a listed as child fund of Mirae Asset Global Investments Co., Ltd. and if that institution has disclosed ownership in this security, then these positions will not be double counted when calculating total shares and total value | 344 | -9,71 | 72 | 44,90 | ||||
| 2026-01-12 | 13F | Rialto Wealth Management, LLC | 21 | -22,22 | 3 | -40,00 | ||||
| 2025-11-06 | 13F | Applied Finance Capital Management, LLC | 0 | -100,00 | 0 | |||||
| 2025-09-26 | NP | ILCG - iShares Morningstar Large-Cap Growth ETF | 32.104 | 5,58 | 6.695 | 69,86 | ||||
| 2026-02-13 | 13F | Cozad Asset Management Inc | 0 | -100,00 | 0 | |||||
| 2026-02-17 | 13F | Creative Planning | 89.886 | 10,87 | 14.501 | -8,71 | ||||
| 2026-02-11 | 13F | GW&K Investment Management, LLC | 221 | 0 | ||||||
| 2025-09-25 | NP | DCOR - Dimensional US Core Equity 1 ETF | 14.152 | 7,79 | 2.951 | 73,49 | ||||
| 2026-02-10 | 13F | Bank of New York Mellon Corp | 2.362.303 | 0,77 | 381.110 | -17,02 | ||||
| 2026-01-13 | 13F | CoreCap Advisors, LLC | 14.314 | 105,45 | 2.309 | 69,16 | ||||
| 2026-02-05 | 13F | North Dakota State Investment Board | 11.621 | 1.875 | ||||||
| 2026-02-05 | 13F | Convergence Investment Partners, LLC | 0 | -100,00 | 0 | |||||
| 2026-02-17 | 13F/A | Kovack Advisors, Inc. | 67.280 | 4,10 | 10.854 | -14,28 | ||||
| 2026-02-13 | 13F | Brookfield Asset Management Inc. | 624 | 101 | ||||||
| 2026-02-13 | 13F | Venture Visionary Partners LLC | 10.994 | 54,28 | 1.774 | 27,01 | ||||
| 2026-01-29 | 13F | Calamos Wealth Management LLC | 4.413 | -13,54 | 712 | -28,83 | ||||
| 2026-01-26 | 13F | Mirae Asset Global Investments Co., Ltd. | 295.359 | 47,11 | 47.650 | 21,14 | ||||
| 2025-09-29 | NP | AIM INVESTMENT FUNDS (INVESCO INVESTMENT FUNDS) - Invesco Oppenheimer Fundamental Alternatives Fund Class R6 | 888 | -73,74 | 185 | -57,76 | ||||
| 2026-01-07 | 13F | Everpar Advisors Llc | 0 | -100,00 | 0 | -100,00 | ||||
| 2025-09-26 | NP | QRFT - QRAFT AI-Enhanced U.S. Large Cap ETF | 78 | -20,41 | 16 | 33,33 | ||||
| 2026-01-28 | 13F | Geneos Wealth Management Inc. | 871 | 68,80 | 141 | 38,61 | ||||
| 2026-02-12 | 13F | Great Lakes Advisors, Llc | 6.768 | -13,66 | 1.092 | -28,93 | ||||
| 2026-01-08 | 13F | Grove Bank & Trust | 48 | -47,83 | 8 | -61,11 | ||||
| 2026-01-16 | 13F | West Branch Capital LLC | 200 | 0,00 | 32 | -17,95 | ||||
| 2026-02-11 | 13F | Franklin Resources Inc | 2.713.329 | -9,07 | 437.741 | -25,12 | ||||
| 2026-02-17 | 13F | Capital Fund Management S.a. | Put | 267.200 | -29,67 | 43.107 | -42,08 | |||
| 2026-02-17 | 13F | Capital Fund Management S.a. | Call | 162.800 | -35,65 | 26.265 | -47,01 | |||
| 2026-02-11 | 13F | Situational Awareness LP | 0 | -100,00 | 0 | |||||
| 2025-09-25 | NP | JMNAX - JPMorgan Research Market Neutral Fund Class A | 0 | -100,00 | 0 | -100,00 | ||||
| 2026-01-29 | 13F | Huntleigh Advisors, Inc. | 0 | -100,00 | 0 | |||||
| 2026-02-04 | 13F | Securian Asset Management, Inc | 8.660 | -43,65 | 1.397 | -53,59 | ||||
| 2026-02-11 | 13F | O'shaughnessy Asset Management, Llc | 28.842 | 3,18 | 4.653 | -15,03 | ||||
| 2025-09-25 | NP | NFRA - FlexShares STOXX Global Broad Infrastructure Index Fund | 134.799 | 19,86 | 28.111 | 92,82 | ||||
| 2026-01-21 | 13F | Palumbo Wealth Management LLC | 1.359 | -4,77 | 219 | -16,73 | ||||
| 2026-02-11 | 13F | SOUTH STATE Corp | 48 | 4,35 | 8 | -22,22 | ||||
| 2026-02-10 | 13F | Advisor Resource Council | 1.527 | 236 | ||||||
| 2026-02-10 | 13F | Thoroughbred Financial Services, Llc | 9.198 | 1,36 | 1 | 0,00 | ||||
| 2026-02-12 | 13F | Fox Hill Wealth Management | 15.790 | 2,88 | 2.547 | -15,27 | ||||
| 2026-02-13 | 13F | Jacobi Capital Management LLC | 1.708 | 0,12 | 276 | -17,66 | ||||
| 2025-09-26 | NP | FNSTX - Fidelity Infrastructure Fund This fund is a listed as child fund of Fmr Llc and if that institution has disclosed ownership in this security, then these positions will not be double counted when calculating total shares and total value | 19.320 | 168,33 | 4.029 | 233,17 | ||||
| 2025-11-14 | 13F | AXA Investment Managers S.A. | 489 | 96 | ||||||
| 2026-02-06 | 13F | Karras Company, Inc. | 6.936 | 1.119 | ||||||
| 2026-01-22 | 13F | Fiduciary Alliance LLC | 14.799 | -7,58 | 2.388 | -23,91 | ||||
| 2026-02-09 | 13F | CBIZ Investment Advisory Services, LLC | 26 | -18,75 | 4 | -33,33 | ||||
| 2026-02-04 | 13F | Empire Life Investments Inc. | 252.338 | 16,82 | 40.710 | -3,81 | ||||
| 2026-01-27 | 13F | MASTERINVEST Kapitalanlage GmbH | 0 | -100,00 | 0 | |||||
| 2026-02-11 | 13F | Two Seas Capital LP | 249.707 | 46,89 | 40.285 | 20,95 | ||||
| 2026-02-17 | 13F | BlueCrest Capital Management Ltd | 637.266 | 102.810 | ||||||
| 2026-02-17 | 13F | Appaloosa Lp | 945.000 | -24,10 | 152.457 | -37,50 | ||||
| 2026-02-10 | 13F | Meitav Dash Investments Ltd | 274.300 | 15.414,71 | 44.253 | 12.689,60 | ||||
| 2026-02-13 | 13F | Verition Fund Management LLC | 14.761 | -52,98 | 2.381 | -61,28 | ||||
| 2026-02-09 | 13F | Westover Capital Advisors, LLC | 40.518 | -8,61 | 6.537 | -24,75 | ||||
| 2026-02-13 | 13F | Capula Management Ltd | Put | 1.400 | 16,67 | 226 | -4,26 | |||
| 2026-02-13 | 13F | Capula Management Ltd | 234 | 38 | ||||||
| 2026-02-12 | 13F | CMT Capital Markets Trading GmbH | Put | 0 | -100,00 | 0 | ||||
| 2026-02-12 | 13F | CMT Capital Markets Trading GmbH | 0 | -100,00 | 0 | |||||
| 2026-02-13 | 13F | Capula Management Ltd | Call | 800 | 33,33 | 129 | 10,26 | |||
| 2026-02-13 | 13F | USS Investment Management Ltd | 54.005 | 0,00 | 8.714 | -17,60 | ||||
| 2026-01-22 | 13F | Bfsg, Llc | 95 | 0,00 | 15 | -16,67 | ||||
| 2026-02-13 | 13F | Allianz Se | 65 | 10 | ||||||
| 2025-10-29 | 13F | Jackson Thornton Asset Management, Llc | 0 | -100,00 | 0 | |||||
| 2026-01-23 | 13F | Bryant Woods Investment Advisors, LLC | 1.450 | 0,00 | 234 | -17,96 | ||||
| 2026-02-03 | 13F | Heartland Bank & Trust Co | 0 | -100,00 | 0 | |||||
| 2026-02-02 | 13F | Millstone Evans Group, LLC | 9 | 0,00 | 1 | 0,00 | ||||
| 2026-02-11 | 13F | Capital Analysts, Inc. | 158 | 0,00 | 0 | |||||
| 2026-01-20 | 13F | Quintet Private Bank (Europe) S.A. | 0 | -100,00 | 0 | |||||
| 2026-02-18 | 13F | GWM Advisors LLC | 285.156 | 140,94 | 46.004 | 98,40 | ||||
| 2026-02-14 | 13F | BluePath Capital Management, LLC | 6.713 | 533,90 | 1.083 | 423,19 | ||||
| 2026-02-13 | 13F | Manufacturers Life Insurance Company, The | 0 | -100,00 | 0 |