Grundlæggende statistik
| Institutionelle aktier (lange) | 665.207.321 - 93,88% (ex 13D/G) - change of -0,30MM shares -0,05% MRQ |
| Institutionel værdi (lang) | $ 12.729.032 USD ($1000) |
Institutionelt ejerskab og aktionærer
QXO, Inc. (US:QXO) har 584 institutionelle ejere og aktionærer, der har indsendt 13D/G- eller 13F-formularer til Securities Exchange Commission (SEC). Disse institutioner har i alt 666,444,171 aktier. Største aktionærer omfatter Orbis Allan Gray Ltd, Morgan Stanley, Vanguard Group Inc, Invesco Ltd., Affinity Partners GP LP, MFN Partners Management, LP, Falcon Edge Capital, LP, BlackRock, Inc., Finepoint Capital LP, and Fred Alger Management, Llc .
QXO, Inc. (NYSE:QXO) institutionel ejerskabsstruktur viser aktuelle positioner i virksomheden efter institutioner og fonde, samt seneste ændringer i positionsstørrelse. Større aktionærer kan omfatte individuelle investorer, investeringsforeninger, hedgefonde eller institutioner. Skema 13D angiver, at investoren besidder (eller besidder) mere end 5 % af virksomheden og har til hensigt (eller har til hensigt at) aktivt at forfølge en ændring i forretningsstrategi. Skema 13G indikerer en passiv investering på over 5%.
The share price as of March 13, 2026 is 20,18 / share. Previously, on March 17, 2025, the share price was 13,00 / share. This represents an increase of 55,23% over that period.

Fondens stemningsscore
Fund Sentiment Score (fka Ownership Accumulation Score) finder de aktier, der bliver mest købt af fonde. Det er resultatet af en sofistikeret, multi-faktor kvantitativ model, der identificerer virksomheder med de højeste niveauer af institutionel akkumulering. Scoringsmodellen bruger en kombination af den samlede stigning i oplyste ejere, ændringerne i porteføljeallokeringer i disse ejere og andre målinger. Tallet går fra 0 til 100, hvor højere tal indikerer et højere niveau af akkumulering for sine jævnaldrende, og 50 er gennemsnittet.
Opdateringsfrekvens: Dagligt
Se Ownership Explorer, som giver en liste over højest rangerende virksomheder.
AI+ Ask Fintel’s AI assistant about QXO, Inc..
Select a question to share a public post with an AI-crafted answer.
Thinking of good questions…
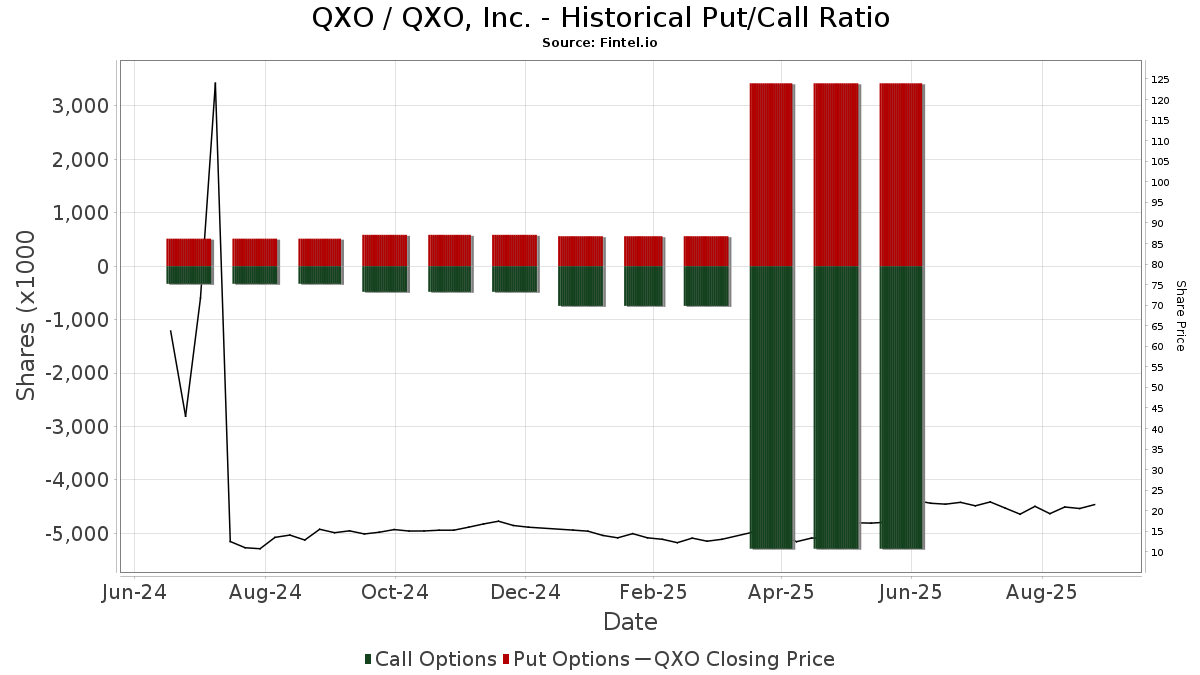
Institutionel Put/Call-forhold
Ud over at indberette standardaktie- og gældsudstedelser skal institutter med mere end 100 mill. aktiver under forvaltning også oplyse deres put- og call-optionsbeholdninger. Da salgsoptioner generelt indikerer negativ stemning, og købsoptioner indikerer positiv stemning, kan vi få en fornemmelse af den overordnede institutionelle stemning ved at plotte forholdet mellem put og kald. Diagrammet til højre viser det historiske put/call-forhold for dette instrument.
Brug af Put/Call Ratio som en indikator for investorernes stemning overvinder en af de vigtigste mangler ved at bruge totalt institutionelt ejerskab, som er, at en betydelig mængde af aktiver under forvaltning investeres passivt for at spore indekser. Passivt forvaltede fonde køber typisk ikke optioner, så indikatoren for put/call-forholdet følger mere nøje følelsen af aktivt forvaltede fonde.
13D/G-arkivering
Vi præsenterer 13D/G ansøgninger separat fra 13F ansøgninger på grund af den forskellige behandling af SEC. 13D/G-ansøgninger kan indgives af grupper af investorer (med én ledende), hvorimod 13F-ansøgninger ikke kan. Dette resulterer i situationer, hvor en investor kan indsende en 13D/G, der rapporterer én værdi for de samlede aktier (der repræsenterer alle de aktier, der ejes af investorgruppen), men derefter indsender en 13F, der rapporterer en anden værdi for de samlede aktier (der udelukkende repræsenterer deres egne) ejendomsret). Det betyder, at aktieejerskab af 13D/G-arkiver og 13F-arkiveringer ofte ikke er direkte sammenlignelige, så vi præsenterer dem separat.
Bemærk: Fra den 16. maj 2021 viser vi ikke længere ejere, der ikke har indsendt en 13D/G inden for det seneste år. Tidligere viste vi den fulde historie af 13D/G-arkiver. Generelt skal enheder, der er forpligtet til at indgive 13D/G-ansøgninger, indgive mindst årligt, før de indsender en afsluttende ansøgning. Dog forlader fonde nogle gange positioner uden at indsende en afsluttende ansøgning (dvs. de afvikler), så visning af den fulde historie resulterede nogle gange i forvirring om det nuværende ejerskab. For at undgå forvirring viser vi nu kun 'aktuelle' ejere - det vil sige - ejere, der har anmeldt inden for det seneste år.
Upgrade to unlock premium data.
| Fil dato | Form | Investor | Forrige Aktier |
Seneste Aktier |
Δ Aktier (Procent) |
Ejendomsret (Procent) |
Δ Ejerskab (Procent) |
|
|---|---|---|---|---|---|---|---|---|
| 2026-02-17 | ORBIS INVESTMENT MANAGEMENT LTD | 85,014,300 | 84,183,637 | -0.98 | 12.50 | -0.79 | ||
| 2026-02-13 | MFN Partners, LP | 42,304,350 | 30,277,326 | -28.43 | 4.50 | -28.57 | ||
| 2026-02-12 | MORGAN STANLEY | 41,575,652 | 57,700,582 | 38.78 | 8.60 | 38.71 | ||
| 2025-10-30 | VANGUARD GROUP INC | 47,192,412 | 55,323,743 | 17.23 | 8.21 | 16.62 | ||
| 2025-08-14 | Affinity Partners GP LP | 32,671,542 | 32,698,176 | 0.08 | 4.90 | -22.22 | ||
| 2025-08-13 | Finepoint Capital LP | 25,750,781 | 21,152,868 | -17.86 | 3.20 | -49.21 | ||
| 2025-08-11 | AustralianSuper Pty Ltd | 20,875,600 | 18,012,103 | -13.72 | 2.70 | -47.06 | ||
| 2025-04-18 | Jacobs Private Equity II, LLC | 394,218,132 | 394,218,132 | 0.00 | 49.00 | -45.47 |
13F og NPORT arkivering
Detaljer om 13F-arkivering er gratis. Detaljer om NP-ansøgninger kræver et premium-medlemskab. Grønne rækker angiver nye positioner. Røde rækker angiver lukkede positioner. Klik på linket ikon for at se den fulde transaktionshistorik.
Opgrader
for at låse premium-data op og eksportere til Excel ![]() .
.
| Fil dato | Kilde | Investor | Type | Gennemsnitlig pris (Øst) |
Aktier | Δ Aktier (%) |
Rapporteret Værdi ($1000) |
Δ Værdi (%) |
Port Alloc (%) |
|
|---|---|---|---|---|---|---|---|---|---|---|
| 2026-02-17 | 13F | Jones Financial Companies Lllp | 30.551 | 27,84 | 589 | 31,18 | ||||
| 2026-02-17 | 13F | Boothbay Fund Management, Llc | 0 | -100,00 | 0 | |||||
| 2026-01-12 | 13F | Tilia Fiduciary Partners, Inc. | 16.617 | -6,86 | 321 | -5,88 | ||||
| 2026-02-11 | 13F | Meeder Asset Management Inc | 333 | 236,36 | 6 | 500,00 | ||||
| 2026-02-13 | 13F | Centiva Capital, LP | 16.155 | 312 | ||||||
| 2026-02-13 | 13F | Neuberger Berman Group LLC | 1.165.044 | 5,09 | 22.474 | 6,36 | ||||
| 2026-02-11 | 13F | LPL Financial LLC | Put | 10.000 | 0,00 | 193 | 1,05 | |||
| 2025-11-04 | 13F | State of Wyoming | 0 | -100,00 | 0 | -100,00 | ||||
| 2025-09-26 | NP | TILVX - TIAA-CREF Large-Cap Value Index Fund Institutional Class | 209.656 | 4.206 | ||||||
| 2026-02-11 | 13F | X-Square Capital, LLC | 71.796 | -4,15 | 1 | 0,00 | ||||
| 2026-02-17 | 13F | Capital Fund Management S.a. | Put | 478.600 | 29,98 | 9.232 | 31,57 | |||
| 2026-02-11 | 13F | LPL Financial LLC | 1.077.983 | 80,55 | 20.794 | 82,72 | ||||
| 2026-02-17 | 13F | Capital Fund Management S.a. | Call | 437.800 | 32,15 | 8.445 | 33,75 | |||
| 2026-02-13 | 13F | Nicholas Investment Partners, LP | 130.897 | 2.525 | ||||||
| 2026-02-17 | 13F | Alphadyne Asset Management, LLC | 2.132 | 41 | ||||||
| 2025-11-10 | 13F | Waratah Capital Advisors Ltd. | 0 | -100,00 | 0 | -100,00 | ||||
| 2026-01-13 | 13F | Adamsbrown Wealth Consultants Llc | 10.623 | 205 | ||||||
| 2026-02-17 | 13F | Alphadyne Asset Management, LLC | Put | 6.200 | 120 | |||||
| 2026-02-17 | 13F | Alphadyne Asset Management, LLC | Call | 5.500 | 106 | |||||
| 2026-01-30 | 13F | Us Bancorp \de\ | 22.526 | 13,65 | 435 | 15,12 | ||||
| 2026-01-21 | 13F | Hartford Financial Management Inc. | 700 | 0,00 | 14 | 0,00 | ||||
| 2026-01-21 | 13F | SJS Investment Consulting Inc. | 1.823 | 0,00 | 35 | 2,94 | ||||
| 2026-01-29 | 13F | IMC-Chicago, LLC | 50.888 | -8,16 | 982 | -7,10 | ||||
| 2025-09-26 | NP | DAACX - Diversified Equity Fund | 2.126 | 43 | ||||||
| 2026-02-12 | 13F | Principal Securities, Inc. | 0 | -100,00 | 0 | |||||
| 2026-02-04 | 13F | Pensionmark Financial Group, Llc | 32.693 | 27 | ||||||
| 2025-09-26 | NP | FIOOX - Fidelity Series Large Cap Value Index Fund This fund is a listed as child fund of Fmr Llc and if that institution has disclosed ownership in this security, then these positions will not be double counted when calculating total shares and total value | 199.626 | 4.004 | ||||||
| 2026-01-27 | 13F | GHP Investment Advisors, Inc. | 1 | 0 | ||||||
| 2026-02-17 | 13F | Caption Management, LLC | Put | 0 | -100,00 | 0 | ||||
| 2026-01-26 | 13F | Private Trust Co Na | 426 | 8 | ||||||
| 2026-02-04 | 13F | Dogwood Wealth Management LLC | 600 | 0,00 | 12 | 0,00 | ||||
| 2026-02-17 | 13F | Sender Co & Partners, Inc. | 0 | -100,00 | 0 | |||||
| 2026-01-08 | 13F | Grove Bank & Trust | 1.098 | 112,79 | 21 | 133,33 | ||||
| 2026-01-28 | 13F | Ttp Investments, Inc. | 0 | -100,00 | 0 | -100,00 | ||||
| 2026-02-04 | 13F | Valeo Financial Advisors, LLC | 14.304 | 0,06 | 276 | 1,10 | ||||
| 2026-02-12 | 13F | BlackRock, Inc. | 23.107.988 | 3,29 | 445.753 | 4,53 | ||||
| 2026-02-17 | 13F | Progeny 3, Inc. | 54.500 | 1.051 | ||||||
| 2026-02-05 | 13F | North Dakota State Investment Board | 21.269 | 410 | ||||||
| 2026-02-17 | 13F/A | Kovack Advisors, Inc. | 127.276 | 1.156,43 | 2.455 | 1.172,02 | ||||
| 2026-02-13 | 13F | Quarry LP | 0 | -100,00 | 0 | |||||
| 2026-02-12 | 13F | Jane Street Group, Llc | Put | 805.900 | 27,33 | 15.546 | 28,87 | |||
| 2025-09-26 | NP | SPECX - Alger Spectra Fund Class A | 1.255.168 | 25.179 | ||||||
| 2026-02-12 | 13F | Jane Street Group, Llc | Call | 286.800 | -3,43 | 5.532 | -2,26 | |||
| 2026-02-13 | 13F | Transamerica Financial Advisors, Inc. | 7 | 0 | ||||||
| 2025-11-14 | 13F | Two Sigma Advisers, Lp | 0 | -100,00 | 0 | |||||
| 2026-02-17 | 13F | Lombard Odier Asset Management (Europe) Ltd | 852.402 | 16.443 | ||||||
| 2026-02-17 | 13F | Lionstone Capital Management LLC | 2.332.662 | 9,97 | 44.997 | 11,30 | ||||
| 2026-02-03 | 13F | Anfield Capital Management, LLC | 106.200 | -11,26 | 2.049 | -10,21 | ||||
| 2026-01-30 | 13F | Levin Capital Strategies, L.p. | 15.750 | -16,00 | 304 | -15,13 | ||||
| 2026-02-12 | 13F | MFN Partners Management, LP | 30.277.326 | -20,85 | 584.050 | -19,89 | ||||
| 2026-02-17 | 13F | Alliancebernstein L.p. | 243.148 | 11,21 | 4.690 | 12,55 | ||||
| 2026-02-17 | 13F | Creative Planning | 79.405 | -89,27 | 1.532 | -89,15 | ||||
| 2026-02-02 | 13F | Triasima Portfolio Management inc. | 25.160 | 9,13 | 485 | 10,48 | ||||
| 2026-02-13 | 13F | Peak6 Llc | Call | 56.600 | -46,90 | 1.092 | -46,28 | |||
| 2026-02-13 | 13F | Peak6 Llc | 70.292 | 1.356 | ||||||
| 2026-02-23 | 13F | Wealth Preservation Advisors, LLC | 9.036 | 174 | ||||||
| 2026-02-03 | 13F | Bokf, Na | 8.264 | 0,00 | 159 | 1,27 | ||||
| 2026-02-06 | 13F | HighTower Advisors, LLC | 431.857 | -59,70 | 8.331 | -59,21 | ||||
| 2026-02-11 | 13F | Fox Run Management, L.l.c. | 0 | -100,00 | 0 | |||||
| 2026-02-12 | 13F | Xponance, Inc. | 31.305 | 2,40 | 604 | 3,61 | ||||
| 2026-02-13 | 13F | Healthcare Of Ontario Pension Plan Trust Fund | 725.000 | -19,44 | 13.985 | -18,47 | ||||
| 2026-02-13 | 13F | Y-Intercept (Hong Kong) Ltd | 750.291 | 14.473 | ||||||
| 2026-01-29 | 13F | Vanguard Group Inc | 54.596.714 | -1,31 | 1.053.171 | -0,12 | ||||
| 2025-09-26 | NP | FLCOX - Fidelity Large Cap Value Index Fund This fund is a listed as child fund of Fmr Llc and if that institution has disclosed ownership in this security, then these positions will not be double counted when calculating total shares and total value | 245.189 | 4.918 | ||||||
| 2026-02-17 | 13F | Northern Trust Corp | 2.674.286 | -2,57 | 51.587 | -1,39 | ||||
| 2025-11-13 | 13F | Eisler Capital Management Ltd. | 0 | -100,00 | 0 | |||||
| 2026-02-12 | 13F | Federation des caisses Desjardins du Quebec | 49.604 | 15,83 | 957 | 17,16 | ||||
| 2026-02-13 | 13F | Alamea Verwaltungs GmbH | 13.960 | 4,51 | 310 | 21,65 | ||||
| 2025-11-13 | 13F | Capital Fund Management S.a. | 0 | -100,00 | 0 | -100,00 | ||||
| 2026-01-23 | 13F | Optima Capital Llc | 85 | 2 | ||||||
| 2026-02-10 | 13F | Goldman Sachs Group Inc | Call | 0 | -100,00 | 0 | -100,00 | |||
| 2026-02-17 | 13F | Massar Capital Management, LP | 120.756 | 57,44 | 2.329 | 59,41 | ||||
| 2025-09-29 | NP | CVSIX - Calamos Market Neutral Income Fund Class A | Short | -1.236.850 | -24.811 | |||||
| 2026-01-20 | 13F | Red Door Wealth Management, LLC | 15.382 | 7,82 | 297 | 9,23 | ||||
| 2026-02-17 | 13F | Susquehanna International Group, Llp | Call | 1.533.600 | 104,84 | 29.583 | 107,31 | |||
| 2026-02-05 | 13F | R.P. Boggs & Co. | 1.128.814 | 0,93 | 21.775 | 2,14 | ||||
| 2026-02-17 | 13F | Quest Investment Management Llc | 32.804 | -6,16 | 633 | -5,11 | ||||
| 2026-02-17 | 13F | Sherbrooke Park Advisers Llc | 0 | -100,00 | 0 | |||||
| 2025-11-14 | 13F | Freestone Grove Partners LP | 0 | -100,00 | 0 | |||||
| 2026-02-17 | 13F | Jump Financial, LLC | 33.338 | 50,59 | 643 | 52,73 | ||||
| 2025-09-25 | NP | TCAAX - Thrivent Moderately Conservative Allocation Fund Class A | 426 | 9 | ||||||
| 2026-02-17 | 13F | Dark Forest Capital Management Lp | 90.580 | 81,48 | 1.747 | 83,70 | ||||
| 2026-01-28 | 13F | Retirement Planning Co of New England, Inc. | 19.868 | -3,17 | 383 | -2,05 | ||||
| 2026-02-03 | 13F | SBI Securities Co., Ltd. | 5.233 | -11,53 | 101 | -10,71 | ||||
| 2026-02-05 | 13F | Amalgamated Bank | 32.529 | 6,19 | 1 | |||||
| 2026-02-13 | 13F | Colony Group, LLC | 527.781 | -1,08 | 10.181 | 0,11 | ||||
| 2026-01-07 | 13F | Hilltop National Bank | 79 | 0,00 | 2 | 0,00 | ||||
| 2026-02-17 | 13F | Twinbeech Capital Lp | 0 | -100,00 | 0 | |||||
| 2026-01-26 | 13F | Cwm, Llc | 75.377 | 61,91 | 1 | |||||
| 2026-02-17 | 13F | Zimmer Partners, LP | 600.000 | -66,85 | 11.574 | -66,45 | ||||
| 2026-02-17 | 13F | Orbis Allan Gray Ltd | 85.484.474 | -1,17 | 1.648.996 | 0,03 | ||||
| 2026-02-10 | 13F | Bnp Paribas Arbitrage, Sa | Put | 1.066 | 2.056 | |||||
| 2026-03-12 | 13F | Vericrest Private Wealth | 23.165 | 447 | ||||||
| 2026-02-10 | 13F | Bnp Paribas Arbitrage, Sa | 985.651 | 958,41 | 19.013 | 971,76 | ||||
| 2026-01-09 | 13F | SG Americas Securities, LLC | 8.887 | -49,21 | 0 | |||||
| 2026-02-17 | 13F | Osterweis Capital Management Inc | 4.245 | 82 | ||||||
| 2025-09-29 | NP | KCXIX - Knights of Columbus U.S. All Cap Index Fund I Shares | 1.441 | 29 | ||||||
| 2026-01-29 | 13F | Pictet Asset Management Holding SA | 1.292.688 | 21,41 | 24.936 | 22,87 | ||||
| 2026-02-13 | 13F | Natixis | 614 | 12 | ||||||
| 2026-02-13 | 13F | Van Eck Associates Corp | 596.857 | 12 | ||||||
| 2026-01-29 | 13F | Comerica Bank | 29.596 | 21,12 | 571 | 22,58 | ||||
| 2026-02-17 | 13F | Quadrature Capital Ltd | 19.363 | -90,41 | 374 | -90,30 | ||||
| 2025-11-14 | 13F | Point72 Europe (London) LLP | 814 | 16 | ||||||
| 2026-01-29 | 13F | Advisors Capital Management, LLC | 685.195 | 0,03 | 13.217 | 1,23 | ||||
| 2026-02-11 | 13F | Group One Trading, L.p. | 486.258 | -44,45 | 9.380 | -43,78 | ||||
| 2026-02-17 | 13F | Susquehanna International Group, Llp | 1.389.143 | -12,29 | 26.797 | -11,23 | ||||
| 2026-02-17 | 13F | Susquehanna International Group, Llp | Put | 1.776.600 | 57,77 | 34.271 | 59,67 | |||
| 2026-01-20 | 13F | Tran Capital Management, L.p. | 14.283 | -60,33 | 276 | -59,91 | ||||
| 2026-01-20 | 13F | Nvwm, Llc | 5.000 | 100,00 | 96 | 104,26 | ||||
| 2026-02-13 | 13F | Atika Capital Management LLC | 420.000 | 8.102 | ||||||
| 2026-02-06 | 13F | Larson Financial Group LLC | 601 | -49,02 | 12 | -50,00 | ||||
| 2026-02-02 | 13F | Cornerstone Planning Group LLC | 0 | -100,00 | 0 | |||||
| 2026-02-10 | 13F | Envestnet Asset Management Inc | 645.021 | 10,74 | 12.442 | 12,08 | ||||
| 2026-02-13 | 13F | Treasurer of the State of North Carolina | 255.952 | -6,81 | 5 | -20,00 | ||||
| 2026-02-13 | 13F | Madrone Advisors, LLC | 5.115.198 | -46,39 | 98.672 | -45,74 | ||||
| 2026-02-17 | 13F | SageView Advisory Group, LLC | 10.094 | 195 | ||||||
| 2026-02-17 | 13F | Gotham Asset Management, LLC | 0 | -100,00 | 0 | |||||
| 2026-01-16 | 13F | Compagnie Lombard Odier SCmA | 4.400 | 0,00 | 85 | 1,20 | ||||
| 2026-02-17 | 13F | Holocene Advisors, LP | 0 | -100,00 | 0 | -100,00 | ||||
| 2026-02-04 | 13F | Settian Capital LP | 256.578 | 0,00 | 4.949 | 1,21 | ||||
| 2025-09-25 | NP | TAAAX - Thrivent Aggressive Allocation Fund Class A | 4.640 | 93 | ||||||
| 2026-02-13 | 13F | Alberta Investment Management Corp | 450.000 | 0,00 | 8.680 | 1,20 | ||||
| 2025-11-14 | 13F | Schonfeld Strategic Advisors LLC | 0 | -100,00 | 0 | |||||
| 2026-02-12 | 13F | CIBC Private Wealth Group, LLC | 52.644 | 21,07 | 1.016 | 22,58 | ||||
| 2025-09-26 | NP | FWWFX - Fidelity Worldwide Fund This fund is a listed as child fund of Fmr Llc and if that institution has disclosed ownership in this security, then these positions will not be double counted when calculating total shares and total value | 94.000 | 1.886 | ||||||
| 2026-02-06 | 13F | EverSource Wealth Advisors, LLC | 77 | 37,50 | 1 | 0,00 | ||||
| 2026-01-29 | 13F | UMA Financial Services, Inc. | 30 | 1 | ||||||
| 2026-01-30 | 13F | American Capital Advisory, LLC | 1.171 | 0,17 | 23 | 0,00 | ||||
| 2026-02-13 | 13F | National Bank Of Canada /fi/ | 229 | -98,25 | 4 | -98,40 | ||||
| 2026-01-23 | 13F | Brown Miller Wealth Management, LLC | 52.489 | 3,84 | 1.013 | 5,09 | ||||
| 2026-01-07 | 13F | Retirement Wealth Solutions LLC | 75 | 56,25 | 1 | |||||
| 2026-02-17 | 13F | Longaeva Partners L.P. | 93.545 | -16,49 | 1.804 | -15,46 | ||||
| 2026-02-13 | 13F | First Trust Advisors Lp | 46.307 | 893 | ||||||
| 2026-02-02 | 13F | Montag A & Associates Inc | 12.000 | -14,50 | 231 | -13,48 | ||||
| 2026-02-11 | 13F | Deutsche Bank Ag\ | 45.018 | 13,09 | 868 | 14,51 | ||||
| 2026-02-13 | 13F | Hudson Bay Capital Management LP | 35.000 | 675 | ||||||
| 2026-02-11 | 13F | Clearbridge Investments, LLC | 479.200 | -1,07 | 9.244 | 0,12 | ||||
| 2026-02-17 | 13F | Algert Global Llc | 315.210 | -9,71 | 6 | 0,00 | ||||
| 2026-02-17 | 13F | Russell Investments Group, Ltd. | 278.679 | 178,31 | 5.376 | 181,71 | ||||
| 2025-11-12 | 13F | CIBC Bancorp USA Inc. | 42.485 | 810 | ||||||
| 2026-02-17 | 13F | Weiss Asset Management LP | 20.444 | 394 | ||||||
| 2026-01-30 | 13F | State of New Jersey Common Pension Fund D | 208.186 | 11,74 | 4.016 | 13,07 | ||||
| 2026-02-13 | 13F | American Century Companies Inc | 1.530.641 | 0,31 | 29.526 | 1,53 | ||||
| 2026-02-13 | 13F | Barrier Capital Management, LLC | 1.596.623 | 8,35 | 30.799 | 9,66 | ||||
| 2026-01-28 | 13F | HB Wealth Management, LLC | 13.034 | 251 | ||||||
| 2026-02-09 | 13F/A | Swedbank AB | 501.000 | 9.664 | ||||||
| 2026-02-17 | 13F | Aquatic Capital Management LLC | 157.706 | 3.042 | ||||||
| 2026-02-17 | 13F | Jain Global LLC | 51.313 | 990 | ||||||
| 2026-02-17 | 13F | Utah Retirement Systems | 32.229 | 0,00 | 622 | 1,14 | ||||
| 2026-02-11 | 13F | Omnitrust Wealth Management, Inc | 10.192 | 197 | ||||||
| 2025-11-21 | 13F | Nebula Research & Development LLC | 0 | -100,00 | 0 | |||||
| 2026-01-15 | 13F | Nisa Investment Advisors, Llc | 16.305 | -59,64 | 315 | -59,22 | ||||
| 2026-02-17 | 13F | First Manhattan Co | 0 | -100,00 | 0 | |||||
| 2026-02-04 | 13F | ELCO Management Co., LLC | 13.825 | -8,29 | 267 | -7,32 | ||||
| 2026-02-17 | 13F | Raymond James Financial Inc | 1.120.778 | 29,02 | 21.620 | 30,58 | ||||
| 2026-02-17 | 13F | Summit Trail Advisors, Llc | 219.999 | 0,64 | 4.244 | 1,85 | ||||
| 2025-11-14 | 13F | Bridgefront Capital, LLC | 0 | -100,00 | 0 | -100,00 | ||||
| 2026-02-09 | 13F | Berkshire Capital Holdings Inc | 10 | 0,00 | 0 | |||||
| 2026-02-17 | 13F | Man Group plc | 678.782 | -20,15 | 13.094 | -19,19 | ||||
| 2025-09-24 | NP | PPSFX - LargeCap Value Fund III R-3 | 10.817 | 217 | ||||||
| 2025-11-14 | 13F | Hbk Investments L P | 0 | -100,00 | 0 | |||||
| 2026-02-17 | 13F | XTX Topco Ltd | 42.477 | 819 | ||||||
| 2025-11-17 | 13F | PharVision Advisers, LLC | 0 | -100,00 | 0 | -100,00 | ||||
| 2026-02-12 | 13F | Counterpoint Mutual Funds LLC | 28.812 | 4,61 | 390 | -10,76 | ||||
| 2026-02-12 | 13F | Brinker Capital Investments, LLC | 101.707 | -3,21 | 1.962 | -2,05 | ||||
| 2026-02-17 | 13F | Archon Partners LLC | 520.000 | 0,00 | 10.031 | 1,20 | ||||
| 2025-11-14 | 13F | Fortress Investment Group LLC | 0 | -100,00 | 0 | -100,00 | ||||
| 2026-02-17 | 13F | Credit Agricole S A | 48.553 | 937 | ||||||
| 2026-02-09 | 13F | Atlantic Trust, LLC | 0 | -100,00 | 0 | |||||
| 2026-02-09 | 13F | Hartland & Co., LLC | 17.846 | 1.373,66 | 344 | 1.395,65 | ||||
| 2026-01-23 | 13F | Farther Finance Advisors, LLC | 11.027 | 20,71 | 213 | 21,84 | ||||
| 2026-02-02 | 13F | Strs Ohio | 68.633 | 369,86 | 1.324 | 375,90 | ||||
| 2026-02-13 | 13F | Johnson Investment Counsel Inc | 0 | -100,00 | 0 | |||||
| 2026-01-13 | 13F | Stableford Capital Ii Llc | 50.816 | -2,30 | 980 | -1,11 | ||||
| 2026-01-30 | 13F | Joel Isaacson & Co., LLC | 22.105 | 426 | ||||||
| 2026-02-13 | 13F | Marshall Wace, Llp | 0 | -100,00 | 0 | |||||
| 2026-02-13 | 13F | Fieldview Capital Management, LLC | 0 | -100,00 | 0 | |||||
| 2026-02-13 | 13F | Wilmar Advisors LLC | 40.000 | -20,00 | 772 | -19,10 | ||||
| 2026-02-13 | 13F | Parkside Financial Bank & Trust | 130 | 132,14 | 3 | 100,00 | ||||
| 2026-02-13 | 13F | Advyzon Investment Management, LLC | 32.126 | 19,26 | 620 | 20,66 | ||||
| 2026-02-10 | 13F | Seven Grand Managers, Llc | 0 | -100,00 | 0 | |||||
| 2026-02-23 | 13F | Mv Capital Management, Inc. | 1 | 0 | ||||||
| 2026-01-21 | 13F | Rathbone Brothers plc | 0 | -100,00 | 0 | -100,00 | ||||
| 2026-01-29 | 13F | Concurrent Investment Advisors, LLC | 24.802 | 143,78 | 478 | 147,67 | ||||
| 2026-01-26 | 13F | Mirae Asset Global Investments Co., Ltd. | 152.200 | 28,22 | 2.936 | 29,75 | ||||
| 2026-02-05 | 13F | Cambridge Investment Research Advisors, Inc. | 30.258 | 20,27 | 1 | |||||
| 2026-02-11 | 13F | Jpmorgan Chase & Co | 342.448 | -6,71 | 6.606 | -5,59 | ||||
| 2026-02-17 | 13F | FIL Ltd | 671.857 | 34,84 | 12.960 | 36,48 | ||||
| 2026-01-08 | 13F | Sanders Morris Harris Llc | 0 | -100,00 | 0 | -100,00 | ||||
| 2026-02-09 | 13F | Eukles Asset Management | 0 | -100,00 | 0 | |||||
| 2026-01-27 | 13F | Zurcher Kantonalbank (Zurich Cantonalbank) | 877.538 | 748,68 | 16.928 | 759,24 | ||||
| 2026-02-13 | 13F | Greenline Wealth Management LLC | 278 | 5 | ||||||
| 2026-02-12 | 13F | Swiss National Bank | 1.195.300 | 14,95 | 23.057 | 16,34 | ||||
| 2026-02-11 | 13F | CNB Bank | 500 | 0,00 | 10 | 0,00 | ||||
| 2026-02-17 | 13F | Blue Investment Opportunities, LLC - Project Breeze Series 1 | 8.698.038 | -0,31 | 167.785 | 0,89 | ||||
| 2026-01-22 | 13F | Willis Investment Counsel | 20.000 | 33,33 | 386 | 35,09 | ||||
| 2026-01-23 | 13F | Diversify Advisory Services, LLC | 8.587 | 204 | ||||||
| 2026-02-17 | 13F | Nomura Holdings Inc | Call | 32.500 | 627 | |||||
| 2026-02-17 | 13F | Elequin Capital Lp | 230 | 4 | ||||||
| 2025-09-26 | NP | SMMV - iShares Edge MSCI Min Vol USA Small-Cap ETF | 11.708 | 235 | ||||||
| 2026-02-17 | 13F | Alpine Global Management, LLC | 0 | -100,00 | 0 | -100,00 | ||||
| 2026-01-21 | 13F | Capital Advisors, Ltd. LLC | 46 | 0,00 | 0 | |||||
| 2026-01-23 | 13F | E&G Advisors, LP | 10.150 | 196 | ||||||
| 2026-02-13 | 13F | Falcon Edge Capital, LP | 24.390.244 | 0,00 | 470.488 | 1,21 | ||||
| 2026-01-21 | 13F | Future Financial Wealth Managment LLC | 0 | -100,00 | 0 | -100,00 | ||||
| 2026-02-11 | 13F | Nemes Rush Group LLC | 475 | 0,00 | 9 | 0,00 | ||||
| 2026-02-12 | 13F | Steward Partners Investment Advisory, Llc | 292.809 | 83,84 | 5.648 | 86,10 | ||||
| 2026-02-17 | 13F | Shay Capital LLC | 11.000 | -61,64 | 212 | -61,17 | ||||
| 2026-02-17 | 13F | Fred Alger Management, Llc | 15.923.937 | 75,39 | 307.173 | 77,50 | ||||
| 2026-02-09 | 13F | Wellington Shields Capital Management, LLC | 532.758 | 28,86 | 10.277 | 30,42 | ||||
| 2026-02-13 | 13F | MAI Capital Management | 4.715 | 58,49 | 91 | 60,71 | ||||
| 2026-01-08 | 13F | Wealth Enhancement Advisory Services, Llc | 51.107 | -79,34 | 1.226 | -74,61 | ||||
| 2026-02-13 | 13F | MAI Capital Management | Call | 6 | 0,00 | |||||
| 2026-02-04 | 13F | Swiss Life Asset Management Ltd | 29.014 | 19,33 | 560 | 20,73 | ||||
| 2026-02-10 | 13F | Principia Wealth Advisory, LLC | 1 | -50,00 | 0 | |||||
| 2026-01-30 | 13F | Sigma Planning Corp | 36.468 | 7,06 | 703 | 8,32 | ||||
| 2026-02-05 | 13F | Td Private Client Wealth Llc | 27.748 | 19,59 | 535 | 21,04 | ||||
| 2025-09-24 | NP | BLACKROCK FUNDS - iShares Russell Mid-Cap Index Fund Institutional | 103.828 | 2.083 | ||||||
| 2026-01-08 | 13F | Armstrong Advisory Group, Inc | 93 | 0,00 | 2 | 0,00 | ||||
| 2026-01-28 | 13F | Fishman Jay A Ltd/mi | 857.840 | 56,56 | 16.548 | 58,45 | ||||
| 2026-02-17 | 13F | Softbank Group Corp | 5.470.459 | 0,00 | 105.525 | 1,21 | ||||
| 2026-02-17 | 13F | Pennant Investors, Lp | 543.000 | 0,00 | 10.474 | 1,21 | ||||
| 2026-01-28 | 13F | Cornerstone Advisory, LLC | 35.400 | 7,82 | 683 | 9,12 | ||||
| 2026-02-06 | 13F | Covestor Ltd | 618 | 0,00 | 0 | |||||
| 2026-02-06 | 13F | Pnc Financial Services Group, Inc. | 16.374 | 15,56 | 316 | 16,67 | ||||
| 2026-02-12 | 13F | Hm Payson & Co | 369 | 7 | ||||||
| 2026-02-17 | 13F | DV Trading LLC | 33.800 | 652 | ||||||
| 2026-01-23 | 13F | Private Wealth Management Group, LLC | 111 | 0,00 | 2 | 0,00 | ||||
| 2026-02-11 | 13F | M Holdings Securities, Inc. | 15.000 | 0 | ||||||
| 2026-02-13 | 13F | Finepoint Capital LP | 21.177.415 | -5,02 | 408.512 | -3,87 | ||||
| 2026-01-29 | 13F | Simon Quick Advisors, Llc | 27.616 | 1,03 | 533 | 2,11 | ||||
| 2026-02-02 | 13F | Benjamin Edwards Inc | 67.108 | 39,62 | 1.294 | 41,27 | ||||
| 2026-02-12 | 13F | Wealthspire Advisors, LLC | 0 | -100,00 | 0 | |||||
| 2026-01-15 | 13F | SILVER OAK SECURITIES, Inc | 0 | -100,00 | 0 | |||||
| 2026-02-17 | 13F | Advisory Services Network, LLC | 0 | -100,00 | 0 | |||||
| 2026-02-11 | 13F | Parallel Advisors, LLC | 6.615 | -44,91 | 128 | -44,30 | ||||
| 2025-09-25 | NP | BBMC - JPMorgan BetaBuilders U.S. Mid Cap Equity ETF | 276.702 | 68,32 | 5.551 | 153,19 | ||||
| 2026-02-06 | 13F | Global Retirement Partners, LLC | 22.688 | 905,23 | 438 | 916,28 | ||||
| 2026-01-21 | 13F | Portside Wealth Group, LLC | 0 | -100,00 | 0 | -100,00 | ||||
| 2025-11-14 | 13F | Jane Street Group, Llc | 0 | -100,00 | 0 | -100,00 | ||||
| 2026-02-03 | 13F | International Assets Investment Management, Llc | 36.770 | 709 | ||||||
| 2026-02-10 | 13F | Select Asset Management & Trust | 0 | -100,00 | 0 | |||||
| 2025-09-25 | NP | AALGX - Thrivent Global Stock Fund Class A | 2.680 | 54 | ||||||
| 2026-02-10 | 13F/A | Northwestern Mutual Wealth Management Co | 3.118 | 11.448,15 | 60 | |||||
| 2026-02-17 | 13F | Lombard Odier Asset Management (USA) Corp | 101.717 | -37,15 | 1.962 | -36,38 | ||||
| 2026-02-04 | 13F | Knuff & Co LLC | 3.925 | 76 | ||||||
| 2026-02-13 | 13F | Bank Of Nova Scotia | 24.874 | 480 | ||||||
| 2026-02-11 | 13F | Janney Montgomery Scott LLC | 80.341 | 64,34 | 2 | |||||
| 2026-02-13 | 13F | Schf (gpe), Llc | 13.319.457 | 0,00 | 256.932 | 101.454,15 | ||||
| 2026-02-13 | 13F | Sterling Capital Management LLC | 36.217 | -4,11 | 699 | -2,92 | ||||
| 2026-02-17 | 13F | Granahan Investment Management Inc/ma | 0 | -100,00 | 0 | |||||
| 2026-01-16 | 13F | Trust Co Of Vermont | 850 | 16 | ||||||
| 2026-02-06 | 13F | IFP Advisors, Inc | 106 | -40,78 | 2 | -33,33 | ||||
| 2026-02-17 | 13F | Ghisallo Capital Management LLC | 200.000 | -50,00 | 3.858 | -49,40 | ||||
| 2026-02-05 | 13F | Requisite Capital Management, LLC | 0 | -100,00 | 0 | |||||
| 2026-02-05 | 13F | Qsemble Capital Management, LP | 49.195 | 114,23 | 949 | 116,93 | ||||
| 2026-02-03 | 13F | Mitsubishi UFJ Kokusai Asset Management Co., Ltd. | 1.315 | 0,00 | 26 | 0,00 | ||||
| 2026-02-13 | 13F | Caitong International Asset Management Co., Ltd | 4.295 | 7.058,33 | 83 | 8.100,00 | ||||
| 2025-11-13 | 13F | Winton Capital Group Ltd | 0 | -100,00 | 0 | |||||
| 2026-02-10 | 13F | Natixis Advisors, L.p. | 64.843 | -1,10 | 1 | 0,00 | ||||
| 2026-01-13 | 13F | Triangle Securities Wealth Management | 26.100 | 503 | ||||||
| 2026-01-26 | 13F | Great Hill Capital LLC | 341.307 | 25,17 | 6.584 | 26,67 | ||||
| 2026-02-03 | 13F | Washington Trust Advisors, Inc. | 103 | 0,00 | 2 | 0,00 | ||||
| 2026-02-13 | 13F | Baird Financial Group, Inc. | 49.500 | 350,00 | 955 | 356,46 | ||||
| 2026-02-12 | 13F | Mindset Wealth Management, Llc | 12.656 | 244 | ||||||
| 2026-02-17 | 13F | Voleon Capital Management Lp | 361.600 | 121,46 | 6.975 | 124,13 | ||||
| 2026-02-11 | 13F | Motley Fool Asset Management LLC | 453.278 | 0,10 | 8.744 | 1,30 | ||||
| 2026-02-17 | 13F | Frontier Capital Management Co Llc | 836.671 | -42,53 | 16.139 | -41,83 | ||||
| 2026-02-10 | 13F | Eurizon Capital SGR S.p.A. | 14.792 | 297 | ||||||
| 2026-02-12 | 13F | Campbell & CO Investment Adviser LLC | 0 | -100,00 | 0 | |||||
| 2026-02-12 | 13F | New York State Common Retirement Fund | 337.800 | 2,89 | 6.516 | 4,14 | ||||
| 2026-01-23 | 13F | Carnegie Capital Asset Management, LLC | 223.379 | 4.309 | ||||||
| 2026-02-12 | 13F | Banco BTG Pactual S.A. | 40.000 | 0,00 | 772 | 1,18 | ||||
| 2025-09-26 | NP | BKSE - BNY Mellon US Small Cap Core Equity ETF | 12.818 | -34,56 | 257 | -1,53 | ||||
| 2026-02-17 | 13F | Two Sigma Investments, Lp | 226.664 | -48,28 | 4.372 | -47,66 | ||||
| 2026-02-17 | 13F | Engineers Gate Manager LP | 0 | -100,00 | 0 | |||||
| 2025-09-24 | NP | IYJ - iShares U.S. Industrials ETF | 138.760 | 2.784 | ||||||
| 2026-01-21 | 13F | Newbridge Financial Services Group, Inc. | 1.575 | 57,50 | 30 | 57,89 | ||||
| 2026-02-11 | 13F | MCF Advisors LLC | 350 | 7 | ||||||
| 2025-11-14 | 13F | Wolverine Trading, Llc | Put | 216.500 | 102,15 | 4.057 | 82,75 | |||
| 2026-02-13 | 13F | Nfj Investment Group, Llc | 272.029 | 5.247 | ||||||
| 2026-02-12 | 13F | Loomis Sayles & Co L P | 8.303 | 0,00 | 160 | 1,27 | ||||
| 2026-02-13 | 13F | Victory Capital Management Inc | 72.048 | 0,22 | 1.390 | 1,39 | ||||
| 2025-11-14 | 13F | Sculptor Capital LP | 0 | -100,00 | 0 | |||||
| 2026-02-13 | 13F | Cladis Investment Advisory, LLC | 107.360 | 37,03 | 2.071 | 38,65 | ||||
| 2026-02-17 | 13F | EFG International AG | 21.435 | 413 | ||||||
| 2025-11-14 | 13F | Wolverine Trading, Llc | 114.416 | 32,09 | 2.144 | 19,44 | ||||
| 2025-11-14 | 13F | Wolverine Trading, Llc | Call | 198.000 | 36,36 | 3.711 | 23,30 | |||
| 2025-09-25 | NP | ISCB - iShares Morningstar Small-Cap ETF | 27.078 | 60,67 | 543 | 142,41 | ||||
| 2026-01-14 | 13F | Elevatus Welath Management | 0 | -100,00 | 0 | |||||
| 2026-02-13 | 13F | Walleye Trading LLC | Put | 68.700 | -22,37 | 1.325 | -21,41 | |||
| 2026-02-13 | 13F | Walleye Trading LLC | Call | 94.200 | -6,73 | 1.817 | -5,61 | |||
| 2026-01-06 | 13F | Ransom Advisory, Ltd | 100 | 0,00 | 2 | 0,00 | ||||
| 2026-02-09 | 13F | Keating Financial Advisory Services, Inc. | 173 | 3 | ||||||
| 2026-02-13 | 13F | Walleye Trading LLC | 20.692 | -28,11 | 399 | -27,19 | ||||
| 2026-01-30 | 13F | CFC Planning Co LLC | 0 | -100,00 | 0 | |||||
| 2026-02-10 | 13F | Td Asset Management Inc | 941.327 | 18,71 | 18.158 | 20,15 | ||||
| 2026-02-17 | 13F | Burkehill Global Management, LP | 0 | -100,00 | 0 | |||||
| 2026-02-17 | 13F | SummitTX Capital, L.P. | 0 | -100,00 | 0 | |||||
| 2026-02-17 | 13F | HighVista Strategies LLC | 58.720 | -34,90 | 1.133 | -34,15 | ||||
| 2026-02-14 | 13F | BluePath Capital Management, LLC | 11.217 | 216 | ||||||
| 2026-02-04 | 13F | First Eagle Investment Management, LLC | 227.684 | 14,13 | 4.392 | 15,52 | ||||
| 2026-02-10 | 13F | Root Financial Partners, LLC | 2 | 0,00 | 0 | |||||
| 2025-11-13 | 13F | Tribune Investment Group LP | 0 | -100,00 | 0 | |||||
| 2026-01-15 | 13F | Allspring Global Investments Holdings, LLC | 2.560.169 | 4,81 | 50.487 | 10,71 | ||||
| 2025-11-14 | 13F | MIRAE ASSET GLOBAL ETFS HOLDINGS Ltd. | 0 | -100,00 | 0 | |||||
| 2026-02-17 | 13F | Agf Management Ltd | 183.862 | 3.547 | ||||||
| 2026-02-13 | 13F | Itau Unibanco Holding S.A. | 60.000 | -15,13 | 1.260 | -6,46 | ||||
| 2026-02-17 | 13F | Optiver Holding B.V. | 93 | 2 | ||||||
| 2026-02-02 | 13F | Oppenheimer & Co Inc | 350.006 | 30,48 | 6.752 | 32,06 | ||||
| 2025-09-24 | NP | SNXFX - Schwab 1000 Index Fund This fund is a listed as child fund of Charles Schwab Investment Management Inc and if that institution has disclosed ownership in this security, then these positions will not be double counted when calculating total shares and total value | 157.385 | 71,03 | 3.157 | 157,29 | ||||
| 2026-02-10 | 13F | Cercano Management LLC | 10.815.832 | 2,18 | 208.637 | 3,41 | ||||
| 2026-02-05 | 13F | ARS Investment Partners, LLC | 269.156 | 5,90 | 5.192 | 7,18 | ||||
| 2026-02-05 | 13F | Baader Bank INC | 230.000 | 0,00 | 4.437 | 1,21 | ||||
| 2026-02-13 | 13F | AlTi Global, Inc. | 42.300 | 197,89 | 816 | 201,85 | ||||
| 2025-09-24 | NP | BLACKROCK FUNDS - iShares Russell Small/Mid-Cap Index Fund Investor A | 92.259 | 1.851 | ||||||
| 2026-01-15 | 13F | Lewis Asset Management, LLC | 182.780 | 13,90 | 3.526 | 15,27 | ||||
| 2026-02-10 | 13F | Rothschild Investment Llc | 106 | 2 | ||||||
| 2026-02-13 | 13F | Walleye Capital LLC | Call | 67.700 | -47,68 | 1.306 | -47,08 | |||
| 2026-02-13 | 13F | Walleye Capital LLC | Put | 88.200 | -37,00 | 1.701 | -36,24 | |||
| 2026-02-17 | 13F | Gilder Gagnon Howe & Co Llc | 6.226.055 | 7,56 | 120.101 | 8,86 | ||||
| 2026-02-13 | 13F | Walleye Capital LLC | 110.666 | 68,20 | 2.135 | 70,18 | ||||
| 2025-11-14 | 13F | Capstone Investment Advisors, Llc | 0 | -100,00 | 0 | -100,00 | ||||
| 2026-01-12 | 13F | First Bank & Trust | 14.963 | 4,92 | 289 | 6,27 | ||||
| 2026-01-22 | 13F | Massachusetts Financial Services Co /ma/ | 2.424.628 | -0,31 | 46.771 | 0,90 | ||||
| 2026-02-10 | 13F | Goldman Sachs Group Inc | 3.347.144 | 174,85 | 64.566 | 178,17 | ||||
| 2026-01-13 | 13F | Parsons Capital Management Inc/ri | 34.339 | 47,49 | 662 | 49,44 | ||||
| 2026-02-12 | 13F | Penserra Capital Management LLC | 15.774 | 0 | ||||||
| 2026-01-28 | 13F | Chicago Partners Investment Group LLC | 17.544 | 22,79 | 419 | 62,40 | ||||
| 2026-02-13 | 13F | Sycale Advisors (NY) LLC | 293.000 | 5.652 | ||||||
| 2026-02-11 | 13F | GW&K Investment Management, LLC | 2.880 | 0 | ||||||
| 2026-02-13 | 13F | Rhumbline Advisers | 531.534 | 0,28 | 10.253 | 1,49 | ||||
| 2026-02-13 | 13F | FORA Capital, LLC | 0 | -100,00 | 0 | |||||
| 2026-02-13 | 13F | Soros Fund Management Llc | 41.095 | 793 | ||||||
| 2026-02-02 | 13F | Qrg Capital Management, Inc. | 10.890 | 210 | ||||||
| 2026-02-13 | 13F | Smartleaf Asset Management LLC | 521 | 4,20 | 11 | 11,11 | ||||
| 2025-11-07 | 13F | Synovus Financial Corp | 11.262 | 215 | ||||||
| 2026-02-17 | 13F | Cetera Investment Advisers | 96.090 | 29,49 | 1.854 | 31,05 | ||||
| 2026-02-09 | 13F | MTM Investment Management, LLC | 550 | 11 | ||||||
| 2026-02-12 | 13F | Castleark Management Llc | 283.527 | 3,18 | 5.469 | 4,43 | ||||
| 2026-02-13 | 13F | Ieq Capital, Llc | 256.000 | 4.938 | ||||||
| 2026-02-20 | 13F | Sunbelt Securities, Inc. | 6.300 | 6,78 | 122 | 8,04 | ||||
| 2025-09-26 | NP | ISCG - iShares Morningstar Small-Cap Growth ETF | 160.820 | 67,59 | 3.226 | 152,03 | ||||
| 2026-02-17 | 13F | Public Employees Retirement System Of Ohio | 183.871 | -3,65 | 3.547 | -2,50 | ||||
| 2026-02-13 | 13F | Taproot Management LP | 24.120 | 465 | ||||||
| 2026-02-17 | 13F | Lighthouse Investment Partners, LLC | 22.277 | 430 | ||||||
| 2025-09-26 | NP | USMIX - Extended Market Index Fund | 60.750 | 30,61 | 1.219 | 96,45 | ||||
| 2025-11-04 | 13F | Thrivent Financial For Lutherans | 0 | -100,00 | 0 | |||||
| 2026-02-04 | 13F | Meridian Wealth Management, LLC | 138.811 | 16,90 | 2.678 | 18,29 | ||||
| 2026-02-12 | 13F | Hohimer Wealth Management, Llc | 0 | -100,00 | 0 | |||||
| 2025-09-23 | NP | FGRAX - Franklin Growth Opportunities Fund Class A | 931.611 | 18.688 | ||||||
| 2026-02-17 | 13F | Bank Of America Corp /de/ | 2.462.928 | 46,69 | 47.510 | 48,47 | ||||
| 2026-03-06 | 13F | Redwood Family Wealth LLC | 15.200 | 293 | ||||||
| 2026-02-09 | 13F | Quest Partners LLC | 9.705 | 2,52 | 187 | 3,89 | ||||
| 2026-02-17 | 13F | Hilltop Holdings Inc. | 20.879 | 20,73 | 403 | 22,19 | ||||
| 2026-01-14 | 13F | ORG Partners LLC | 245 | 5 | ||||||
| 2026-02-10 | 13F | Sound Shore Management Inc /ct/ | 4.002.028 | 77.199 | ||||||
| 2026-01-28 | 13F | WPG Advisers, LLC | 6.153 | 238,45 | 119 | 247,06 | ||||
| 2026-02-13 | 13F | Golden State Wealth Management, LLC | 80 | 0,00 | 2 | 0,00 | ||||
| 2026-02-13 | 13F | Diametric Capital, LP | 10.864 | 210 | ||||||
| 2026-02-13 | 13F | Neo Ivy Capital Management | 226.432 | 4.368 | ||||||
| 2026-02-13 | 13F | Liberty Mutual Group Asset Management Inc. | 4.082.787 | 0,00 | 78.757 | 1,21 | ||||
| 2026-02-12 | 13F | California Public Employees Retirement System | 1.026.116 | 30,33 | 19.794 | 31,90 | ||||
| 2025-09-25 | NP | WMLIX - Wilmington Large-Cap Strategy Fund Class I Shares | 5.950 | 119 | ||||||
| 2026-01-20 | 13F | Sheets Smith Wealth Management | 18.730 | 0,13 | 361 | 1,40 | ||||
| 2026-02-13 | 13F | Patient Capital Management, LLC | 0 | -100,00 | 0 | |||||
| 2026-02-17 | 13F | Cresset Asset Management, LLC | 14.027 | 271 | ||||||
| 2025-11-14 | 13F | Prelude Capital Management, Llc | 0 | -100,00 | 0 | -100,00 | ||||
| 2025-10-30 | 13F | Ridgewood Investments LLC | Call | 0 | -100,00 | 0 | -100,00 | |||
| 2026-02-12 | 13F | Mission Creek Capital Partners, Inc. | 137.660 | 2.655 | ||||||
| 2026-02-03 | 13F | K.J. Harrison & Partners Inc | 100.000 | 0,00 | 1.929 | -3,11 | ||||
| 2025-11-13 | 13F | Hsbc Holdings Plc | 0 | -100,00 | 0 | -100,00 | ||||
| 2026-01-26 | 13F | KBC Group NV | 17.592 | 19,48 | 0 | |||||
| 2026-01-29 | 13F | Carmel Capital Partners, LLC | 122.725 | 164,72 | 2.367 | 168,06 | ||||
| 2026-01-23 | 13F | Assetmark, Inc | 196 | -4,39 | 4 | 0,00 | ||||
| 2026-02-17 | 13F | Aureus Asset Management, LLC | 409.153 | 0,00 | 7.893 | 1,21 | ||||
| 2026-01-28 | 13F | Arizona State Retirement System | 169.731 | 6,81 | 3.274 | 8,12 | ||||
| 2026-02-17 | 13F | Concentric Capital Strategies, LP | 0 | -100,00 | 0 | |||||
| 2025-11-12 | 13F | Sciencast Management LP | 0 | -100,00 | 0 | |||||
| 2026-02-13 | 13F | Manufacturers Life Insurance Company, The | 0 | -100,00 | 0 | |||||
| 2026-01-27 | 13F | Cfm Wealth Partners Llc | 37.540 | 13,89 | 724 | 15,29 | ||||
| 2026-02-09 | 13F | Huntington National Bank | 11.000 | 69,23 | 212 | 72,36 | ||||
| 2026-01-28 | 13F | Teacher Retirement System Of Texas | 27.483 | -67,74 | 530 | -67,34 | ||||
| 2025-11-12 | 13F | Monashee Investment Management LLC | Put | 0 | -100,00 | 0 | ||||
| 2026-02-13 | 13F | Police & Firemen's Retirement System of New Jersey | 260.988 | -2,89 | 5.034 | -1,72 | ||||
| 2026-02-13 | 13F | Stifel Financial Corp | 145.373 | 166,37 | 2.804 | 169,62 | ||||
| 2026-01-30 | 13F | Archer Investment Corp | 5.000 | 11,11 | 96 | 12,94 | ||||
| 2025-09-24 | NP | SWTSX - Schwab Total Stock Market Index Fund This fund is a listed as child fund of Charles Schwab Investment Management Inc and if that institution has disclosed ownership in this security, then these positions will not be double counted when calculating total shares and total value | 230.715 | 72,10 | 4.628 | 158,84 | ||||
| 2026-02-13 | 13F | SRS Capital Advisors, Inc. | 1.309 | 25 | ||||||
| 2026-02-17 | 13F | D. E. Shaw & Co., Inc. | 46.021 | -62,68 | 888 | -62,26 | ||||
| 2026-02-13 | 13F | Cornerstone Financial Management LLC | 36 | 1 | ||||||
| 2026-02-13 | 13F | Oribel Capital Management, LP | 0 | -100,00 | 0 | |||||
| 2026-02-17 | 13F | Steadfast Capital Management Lp | 0 | -100,00 | 0 | |||||
| 2026-01-30 | 13F | Rachor Investment Advisory Services, LLC | 360 | 7 | ||||||
| 2026-01-16 | 13F | Matauro, Llc | 114.419 | 14,32 | 2.207 | 15,73 | ||||
| 2026-02-13 | 13F | Affinity Partners GP LP | 32.686.065 | 0,04 | 630.514 | 1,25 | ||||
| 2026-01-27 | 13F | First Horizon Corp | 8.849 | 56,65 | 171 | 58,88 | ||||
| 2026-02-06 | 13F | Investment House Llc | 799.935 | 16,37 | 15.431 | 17,78 | ||||
| 2026-01-23 | 13F | TFC Financial Management | 3 | -25,00 | 0 | |||||
| 2026-01-30 | 13F | Mitsubishi UFJ Trust & Banking Corp | 916.907 | 17.687 | ||||||
| 2026-02-11 | 13F | Franklin Resources Inc | 2.550.811 | 1,46 | 49.205 | 2,68 | ||||
| 2026-02-17 | 13F | Point72 Asset Management, L.P. | Put | 102.700 | 1.981 | |||||
| 2026-02-17 | 13F | Aqr Capital Management Llc | 505.177 | -24,95 | 9.745 | -22,38 | ||||
| 2026-02-17 | 13F | Point72 Asset Management, L.P. | Call | 113.000 | 2.180 | |||||
| 2025-09-22 | NP | TGWRX - Transamerica Large Growth R | 298.630 | 396,83 | 5.991 | 647,82 | ||||
| 2026-02-02 | 13F | Miracle Mile Advisors, LLC | 16.533 | -0,05 | 319 | 0,95 | ||||
| 2026-02-10 | 13F | Norges Bank | 7.279.467 | 140.421 | ||||||
| 2026-02-12 | 13F | Commonwealth Equity Services, Llc | 21.133 | 17,03 | 408 | |||||
| 2026-02-17 | 13F | Shay Capital LLC | Call | 0 | -100,00 | 0 | ||||
| 2025-09-26 | NP | FZFLX - Fidelity SAI Small-Mid Cap 500 Index Fund This fund is a listed as child fund of Fmr Llc and if that institution has disclosed ownership in this security, then these positions will not be double counted when calculating total shares and total value | 32.786 | 658 | ||||||
| 2025-09-26 | NP | ETTOX - E*TRADE No Fee Total Market Index Fund | 222 | 192,11 | 4 | 300,00 | ||||
| 2026-02-17 | 13F | Maryland State Retirement & Pension System | 29.596 | 0,00 | 571 | 1,06 | ||||
| 2026-02-17 | 13F | Elkhorn Partners Limited Partnership | 0 | -100,00 | 0 | |||||
| 2026-02-17 | 13F | Advisor Group Holdings, Inc. | 169.362 | 29,38 | 3.267 | 31,69 | ||||
| 2026-02-17 | 13F | Royal Bank Of Canada | 1.213.614 | -47,96 | 23.412 | -47,33 | ||||
| 2026-02-04 | 13F | LRI Investments, LLC | 1.482 | 129,06 | 29 | 133,33 | ||||
| 2026-02-05 | 13F | Cardinal Point Capital Management, ULC | 13.670 | 264 | ||||||
| 2026-02-13 | 13F | Goodnow Investment Group, Llc | 68.620 | -0,44 | 1.324 | 0,76 | ||||
| 2026-01-21 | 13F | Flagship Harbor Advisors, Llc | 11.631 | 224 | ||||||
| 2026-02-17 | 13F | Keebeck Wealth Management, LLC | 19.788 | 0,00 | 382 | 1,06 | ||||
| 2026-01-27 | 13F | TD Waterhouse Canada Inc. | 8.517 | 14,91 | 164 | 18,84 | ||||
| 2026-02-17 | 13F | D L Carlson Investment Group Inc | 0 | -100,00 | 0 | |||||
| 2026-02-17 | 13F | Consulta Ltd | 10.000.000 | 33,33 | 192.900 | 34,94 | ||||
| 2026-02-10 | 13F | CIBC World Markets Inc. | 106.368 | 65,80 | 2.052 | 67,84 | ||||
| 2026-02-06 | 13F | Bare Financial Services, Inc | 23 | 0 | ||||||
| 2025-09-26 | NP | SMLF - iShares Edge MSCI Multifactor USA Small-Cap ETF | 67.831 | 82,70 | 1.361 | 175,86 | ||||
| 2026-02-13 | 13F | Graybill Bartz & Assoc Ltd | 0 | -100,00 | 0 | |||||
| 2026-02-17 | 13F | Odyssean, LLC | 25.327 | 489 | ||||||
| 2026-02-05 | 13F | Novare Capital Management Llc | 23.352 | 49,87 | 450 | 52,03 | ||||
| 2026-02-17 | 13F | Pennant Select, LLC | 215.000 | 0,00 | 4.147 | 1,22 | ||||
| 2026-02-17 | 13F | Captrust Financial Advisors | 573.365 | 59,37 | 11.060 | 61,30 | ||||
| 2026-01-28 | 13F | Salomon & Ludwin, LLC | 6 | 0,00 | 0 | |||||
| 2026-01-13 | 13F | Mather Group, Llc. | 0 | -100,00 | 0 | |||||
| 2026-02-17 | 13F | Janus Henderson Group Plc | 232.963 | 20,36 | 4.493 | 21,73 | ||||
| 2026-01-28 | 13F | Provident Wealth Management, LLC | 12.461 | 0,00 | 240 | 1,27 | ||||
| 2026-02-17 | 13F | Brevan Howard Capital Management LP | 266.897 | 1,12 | 5.389 | 7,12 | ||||
| 2026-02-17 | 13F | California State Teachers Retirement System | 575.366 | 12,92 | 11.099 | 14,28 | ||||
| 2026-02-12 | 13F | Quadrant Capital Group Llc | 266 | -13,36 | 5 | 0,00 | ||||
| 2026-02-13 | 13F | Citigroup Inc | 39.399 | -40,62 | 760 | -39,87 | ||||
| 2026-02-13 | 13F | BNP Paribas Asset Management Holding S.A. | 8.389 | 59,37 | 0 | |||||
| 2026-02-05 | 13F | Allworth Financial LP | 2.580 | 27,22 | 50 | 28,95 | ||||
| 2026-01-13 | 13F | Stephens Consulting, LLC | 1.000 | 0,00 | 21 | 10,53 | ||||
| 2026-02-14 | 13F | Taikang Asset Management (Hong Kong) Co Ltd | 590.759 | 11.396 | ||||||
| 2026-02-10 | 13F | Jackson Hill Advisors, Llc | 941.000 | 80,27 | 18.152 | 82,44 | ||||
| 2026-02-19 | 13F | Invesco Ltd. | 34.222.190 | 1,85 | 660.146 | 3,08 | ||||
| 2026-02-11 | 13F | Contrarius Group Holdings Ltd | 792.686 | 15.291 | ||||||
| 2025-09-25 | NP | TILT - FlexShares Morningstar US Market Factor Tilt Index Fund | 22.197 | 55,37 | 445 | 134,21 | ||||
| 2026-01-20 | 13F | Stratos Wealth Partners, LTD. | 0 | -100,00 | 0 | -100,00 | ||||
| 2026-02-11 | 13F | Janney Capital Management LLC | 21.133 | 1,65 | 0 | |||||
| 2026-02-13 | 13F | Pathstone Holdings, LLC | 16.729 | -63,68 | 323 | -63,28 | ||||
| 2026-03-02 | 13F | Bank Of Hawaii | 232.460 | 92,57 | 4.484 | 94,96 | ||||
| 2025-09-25 | NP | THMAX - Thrivent Moderate Allocation Fund Class A | 2.985 | 60 | ||||||
| 2025-09-26 | NP | FLAPX - Fidelity Flex Mid Cap Index Fund This fund is a listed as child fund of Fmr Llc and if that institution has disclosed ownership in this security, then these positions will not be double counted when calculating total shares and total value | 13.583 | 272 | ||||||
| 2026-01-28 | 13F | B. Metzler seel. Sohn & Co. AG | 232.000 | 0,00 | 4.875 | 10,27 | ||||
| 2026-01-28 | 13F | Klp Kapitalforvaltning As | 136.600 | 22,07 | 2.635 | 23,59 | ||||
| 2026-02-10 | 13F | Peapack Gladstone Financial Corp | 91.400 | 4,04 | 2 | 0,00 | ||||
| 2026-02-06 | 13F | Leonteq Securities AG | 25.044 | 1.145,97 | 483 | 1.171,05 | ||||
| 2026-02-05 | 13F | Bessemer Group Inc | 1.587.543 | 342.781,86 | 31 | |||||
| 2026-01-12 | 13F | Salem Investment Counselors Inc | 94.475 | 17,67 | 1.822 | 19,08 | ||||
| 2026-02-03 | 13F | Navellier & Associates Inc | 21.786 | -30,14 | 420 | -29,29 | ||||
| 2026-02-09 | 13F | Capital Management Associates /ny/ | 0 | -100,00 | 0 | |||||
| 2026-02-17 | 13F | Signature Equity Partners, LLC | 14 | 0 | ||||||
| 2026-02-17 | 13F | Blair William & Co/il | 72.923 | -11,09 | 1.407 | -10,04 | ||||
| 2026-01-13 | 13F | Gillespie Robinson & Grimm Inc | 11.255 | -7,75 | 217 | -6,47 | ||||
| 2026-02-09 | 13F | Geode Capital Management, Llc | 8.777.960 | 0,70 | 169.359 | 1,92 | ||||
| 2026-02-17 | 13F | Hood River Capital Management LLC | 8.052.900 | -2,06 | 155.340 | -0,88 | ||||
| 2026-01-28 | 13F | Hudson Value Partners, LLC | 99.720 | -0,37 | 2.057 | 7,87 | ||||
| 2026-01-28 | 13F | Geneos Wealth Management Inc. | 186 | 0,00 | 4 | 0,00 | ||||
| 2026-02-12 | 13F | MetLife Investment Management, LLC | 9.999 | -1,85 | 193 | -1,03 | ||||
| 2026-02-13 | 13F | Maplelane Capital, Llc | 0 | -100,00 | 0 | |||||
| 2025-09-26 | NP | FIRST EAGLE FUNDS - First Eagle U.S. Smid Cap Opportunity Fund Class A | 24.000 | 481 | ||||||
| 2026-02-13 | 13F | Maplelane Capital, Llc | Call | 0 | -100,00 | 0 | ||||
| 2026-01-05 | 13F | GAMMA Investing LLC | 2.964 | 79,64 | 57 | 83,87 | ||||
| 2026-02-05 | 13F | Atria Investments Llc | 27.645 | 170,08 | 533 | 173,33 | ||||
| 2026-02-06 | 13F | Tortoise Investment Management, LLC | 0 | -100,00 | 0 | |||||
| 2026-02-17 | 13F | TIG Advisors, LLC | 0 | -100,00 | 0 | |||||
| 2025-11-14 | 13F | Peak6 Llc | Put | 0 | -100,00 | 0 | -100,00 | |||
| 2025-09-26 | NP | TIEIX - TIAA-CREF Equity Index Fund Institutional Class | 446.538 | 8.958 | ||||||
| 2025-11-06 | 13F | Skylands Capital, LLC | 0 | -100,00 | 0 | |||||
| 2026-02-12 | 13F | Federated Hermes, Inc. | 3.307.600 | 4,07 | 63.804 | 5,33 | ||||
| 2026-01-16 | 13F | FNY Investment Advisers, LLC | 340 | -97,87 | 0 | |||||
| 2026-01-16 | 13F | Marquette Asset Management, LLC | 51 | -17,74 | 1 | -100,00 | ||||
| 2026-01-20 | 13F | Signaturefd, Llc | 1.089 | -13,16 | 21 | -8,70 | ||||
| 2026-02-13 | 13F | Prudential Financial Inc | 29.080 | -38,46 | 561 | -37,78 | ||||
| 2025-09-26 | NP | FSMDX - Fidelity Mid Cap Index Fund This fund is a listed as child fund of Fmr Llc and if that institution has disclosed ownership in this security, then these positions will not be double counted when calculating total shares and total value | 2.110.358 | 42.334 | ||||||
| 2026-02-17 | 13F | Toronto Dominion Bank | 3.000 | 58 | ||||||
| 2026-02-03 | 13F | Costello Asset Management, INC | 233.380 | -2,40 | 4.502 | -1,23 | ||||
| 2025-09-24 | NP | PMPRX - MidCap Value Fund I R-3 | 14.477 | 290 | ||||||
| 2026-02-13 | 13F | Forest Avenue Capital Management LP | 3.734.990 | -0,10 | 72.048 | 1,11 | ||||
| 2026-02-10 | 13F | Hazlett, Burt & Watson, Inc. | 700 | 0,00 | 0 | |||||
| 2026-02-12 | 13F | Renaissance Technologies Llc | 1.478.200 | -62,97 | 28.514 | -62,53 | ||||
| 2026-02-02 | 13F | Fifth Third Bancorp | 1.039 | 19,43 | 20 | 25,00 | ||||
| 2026-02-17 | 13F | IHT Wealth Management, LLC | 27.726 | 535 | ||||||
| 2026-01-29 | 13F | UBS Group AG | Put | 0 | -100,00 | 0 | -100,00 | |||
| 2026-02-04 | 13F | Sentry Investment Management Llc | 0 | -100,00 | 0 | |||||
| 2025-09-26 | NP | ACAAX - Alger Capital Appreciation Fund Class A | 208.509 | 4.183 | ||||||
| 2026-01-22 | 13F | Fiduciary Alliance LLC | 117.273 | 10,82 | 2.262 | 12,20 | ||||
| 2026-02-13 | 13F | Atlas Capital Advisors Llc | 5.938 | 0,00 | 115 | -10,24 | ||||
| 2026-01-08 | 13F | True Wealth Design, LLC | 40 | 0,00 | 1 | |||||
| 2026-01-20 | 13F | Pflug Koory, LLC | 1.500 | 0,00 | 29 | 0,00 | ||||
| 2026-02-11 | 13F | Motley Fool Wealth Management, LLC | 347.861 | -13,83 | 6.710 | -12,79 | ||||
| 2025-11-14 | 13F | Aperture Investors, LLC | 0 | -100,00 | 0 | |||||
| 2026-02-10 | 13F | Axq Capital, Lp | 19.690 | 380 | ||||||
| 2026-02-13 | 13F | Verition Fund Management LLC | 93.358 | -78,74 | 1.801 | -78,50 | ||||
| 2026-02-09 | 13F | Catalyst Funds Management Pty Ltd | 52.370 | 0,00 | 1.010 | 1,20 | ||||
| 2026-02-04 | 13F | Virginia Retirement Systems Et Al | 58.850 | -28,49 | 1.135 | -27,61 | ||||
| 2026-02-11 | 13F | Empowered Funds, LLC | 67.739 | 1.307 | ||||||
| 2026-01-09 | 13F | Appleton Partners Inc/ma | 613.911 | 12 | ||||||
| 2026-02-17 | 13F | Tudor Investment Corp Et Al | Put | 26.100 | 503 | |||||
| 2026-02-17 | 13F | Tudor Investment Corp Et Al | Call | 22.500 | 434 | |||||
| 2026-01-29 | 13F | Deltec Asset Management Llc | 52.161 | -61,10 | 1.006 | -60,63 | ||||
| 2026-02-12 | 13F | Rossby Financial, LCC | 817 | 50,74 | 16 | 50,00 | ||||
| 2026-01-07 | 13F | Massmutual Trust Co Fsb/adv | 255 | 2,41 | 5 | 0,00 | ||||
| 2026-02-19 | 13F/A | Axxcess Wealth Management, Llc | 58.837 | 48,17 | 1.135 | 50,00 | ||||
| 2026-01-29 | 13F | Verdence Capital Advisors LLC | 22.258 | 0,00 | 429 | 6,72 | ||||
| 2026-02-17 | 13F | Family Management Corp | 10.761 | 208 | ||||||
| 2026-01-16 | 13F | Tenon Financial LLC | 15.930 | 0,00 | 307 | 1,32 | ||||
| 2026-02-13 | 13F | Wexford Capital Lp | 0 | -100,00 | 0 | |||||
| 2026-02-02 | 13F | Pittenger & Anderson Inc | 1.519 | 0,00 | 29 | 3,57 | ||||
| 2026-02-11 | 13F | Walter & Keenan Financial Consulting Co /mi/ /adv | 18.918 | 15,05 | 365 | 16,29 | ||||
| 2026-02-24 | 13F | Bell Investment Advisors, Inc | 228 | 0,00 | 4 | 0,00 | ||||
| 2026-02-10 | 13F | Corrado Advisors, Llc | 82.760 | -0,38 | 1.596 | 0,82 | ||||
| 2026-02-17 | 13F | Wellington Management Group Llp | 32.720 | -3,76 | 631 | -2,62 | ||||
| 2026-01-26 | 13F | JNBA Financial Advisors | 51.413 | 992 | ||||||
| 2025-11-07 | 13F | HighTower Advisors, LLC | Call | 0 | -100,00 | 0 | -100,00 | |||
| 2026-02-10 | 13F | CIBC Asset Management Inc | 21.662 | 69,82 | 418 | 71,60 | ||||
| 2025-11-13 | 13F | Arrowstreet Capital, Limited Partnership | 0 | -100,00 | 0 | |||||
| 2026-02-17 | 13F | DZ BANK AG Deutsche Zentral Genossenschafts Bank, Frankfurt am Main | 223.286 | 92,70 | 4.307 | 95,06 | ||||
| 2026-01-26 | 13F | Wealth Effects Llc | 14.875 | 2,59 | 287 | 3,62 | ||||
| 2026-01-21 | 13F | Sound Income Strategies, LLC | 50 | 0,00 | 1 | |||||
| 2026-02-03 | 13F | Strengthening Families & Communities, LLC | 50 | 1 | ||||||
| 2025-09-24 | NP | FIDU - Fidelity MSCI Industrials Index ETF This fund is a listed as child fund of Fmr Llc and if that institution has disclosed ownership in this security, then these positions will not be double counted when calculating total shares and total value | 133.021 | 2.668 | ||||||
| 2026-02-06 | 13F | HighTower Advisors, LLC | Put | 0 | -100,00 | 0 | -100,00 | |||
| 2025-11-12 | 13F | Bellwether Advisors, LLC | 0 | -100,00 | 0 | |||||
| 2026-02-11 | 13F | SOUTH STATE Corp | 0 | -100,00 | 0 | |||||
| 2026-02-13 | 13F | Venture Visionary Partners LLC | 0 | -100,00 | 0 | |||||
| 2026-02-13 | 13F | Sei Investments Co | 1.898.509 | 90,77 | 36.623 | 93,07 | ||||
| 2026-02-05 | 13F | Castle Rock Wealth Management, LLC | 13.849 | 2,70 | 310 | 19,77 | ||||
| 2026-02-10 | 13F | Bank of New York Mellon Corp | 2.080.670 | -2,89 | 40.136 | -1,72 | ||||
| 2026-01-08 | 13F | Versant Capital Management, Inc | 283 | 0,00 | 5 | 0,00 | ||||
| 2026-01-27 | 13F | Institute for Wealth Management, LLC. | 12.968 | 0,89 | 250 | 2,46 | ||||
| 2026-01-21 | 13F | MTCO Ltd. | 10.940.919 | 0,00 | 211.050 | 1,21 | ||||
| 2025-09-26 | NP | CNECX - Alger Concentrated Equity Fund Class C | 2.323 | 47 | ||||||
| 2026-02-12 | 13F | Edgewood Management Llc | 40.000 | 0,00 | 772 | 1,18 | ||||
| 2026-02-17 | 13F | Magnetar Financial LLC | 0 | -100,00 | 0 | |||||
| 2026-01-08 | 13F | Maridea Wealth Management LLC | 114.427 | 30,78 | 2.207 | 32,79 | ||||
| 2026-02-14 | 13F | Rockefeller Capital Management L.P. | 120.928 | 38,27 | 2.333 | 39,98 | ||||
| 2025-09-26 | NP | RTDAX - Multifactor U.S. Equity Fund Class A | 3.380 | 68 | ||||||
| 2026-02-09 | 13F | Jefferies Financial Group Inc. | 49.264 | -13,42 | 950 | -12,36 | ||||
| 2026-02-17 | 13F | Quantinno Capital Management LP | 14.086 | 272 | ||||||
| 2026-01-20 | 13F | Tritonpoint Wealth, Llc | 329.592 | 15,29 | 6.358 | 16,66 | ||||
| 2026-02-12 | 13F | Sepio Capital, LP | 0 | -100,00 | 0 | |||||
| 2026-01-16 | 13F | Crewe Advisors LLC | 250 | 0,00 | 5 | 0,00 | ||||
| 2026-02-13 | 13F | Charles Schwab Investment Management Inc | 2.906.891 | 1,58 | 56.074 | 2,81 | ||||
| 2026-02-17 | 13F | Point72 Asset Management, L.P. | 0 | -100,00 | 0 | -100,00 | ||||
| 2026-02-05 | 13F | Plante Moran Financial Advisors, LLC | 642 | 0,00 | 12 | 0,00 | ||||
| 2026-01-23 | 13F | Baillie Gifford & Co | 14.735.164 | 16.117,62 | 284.241 | 16.320,62 | ||||
| 2026-02-13 | 13F | Barclays Plc | 74.669 | -87,09 | 1.440 | -86,93 | ||||
| 2026-02-13 | 13F | Wells Fargo & Company/mn | 1.371.261 | 17,41 | 26.452 | 18,83 | ||||
| 2026-02-12 | 13F | Raiffeisen Bank International AG | 90.000 | 1.894 | ||||||
| 2025-09-24 | NP | SWLVX - Schwab U.S. Large-Cap Value Index Fund This fund is a listed as child fund of Charles Schwab Investment Management Inc and if that institution has disclosed ownership in this security, then these positions will not be double counted when calculating total shares and total value | 18.255 | 366 | ||||||
| 2026-02-12 | 13F | Bank Of Montreal /can/ | 10.505 | 203 | ||||||
| 2026-02-17 | 13F | Fmr Llc | 3.043.170 | -18,44 | 58.703 | -17,45 | ||||
| 2026-01-16 | 13F | Ronald Blue Trust, Inc. | 1.134 | 24,48 | 22 | 23,53 | ||||
| 2026-02-17 | 13F | Tower Research Capital LLC (TRC) | 14.150 | 516,83 | 273 | 532,56 | ||||
| 2026-01-12 | 13F | Legacy Wealth Asset Management, LLC | 10.812 | 2,20 | 209 | 3,48 | ||||
| 2026-02-17 | 13F | Gladstone Institutional Advisory LLC | 18.598 | 23,95 | 359 | 25,61 | ||||
| 2025-09-26 | NP | FESRX - First Eagle Small Cap Opportunity Fund Class R6 | 129.376 | 2.595 | ||||||
| 2025-09-24 | NP | SWMCX - Schwab U.S. Mid-Cap Index Fund This fund is a listed as child fund of Charles Schwab Investment Management Inc and if that institution has disclosed ownership in this security, then these positions will not be double counted when calculating total shares and total value | 102.963 | 2.065 | ||||||
| 2026-02-13 | 13F | Headlands Technologies LLC | 0 | -100,00 | 0 | |||||
| 2026-01-12 | 13F | Moody National Bank Trust Division | 54.700 | 11,07 | 1.055 | 12,47 | ||||
| 2026-02-06 | 13F | Tortoise Investment Management, LLC | Call | 0 | -100,00 | 0 | ||||
| 2026-02-11 | 13F | Simplex Trading, Llc | 42.568 | -56,12 | 821 | 82.000,00 | ||||
| 2026-01-29 | 13F | Aprio Wealth Management, LLC | 18.487 | 63,46 | 357 | 65,58 | ||||
| 2026-02-06 | 13F | Vestmark Advisory Solutions, Inc. | 30.827 | 595 | ||||||
| 2026-02-12 | 13F | Nuveen, LLC | 1.106.839 | 0,90 | 21.351 | 2,11 | ||||
| 2026-02-17 | 13F | Maniro Ltd | 10.940.919 | 211.050 | ||||||
| 2026-02-03 | 13F | Ethic Inc. | 27.432 | -7,04 | 529 | -5,87 | ||||
| 2025-11-14 | 13F | Mane Global Capital Management Lp | 0 | -100,00 | 0 | |||||
| 2026-02-14 | 13F | Whipplewood Advisors, LLC | 21 | 0 | ||||||
| 2026-02-17 | 13F | Driehaus Capital Management Llc | 851.019 | 6,74 | 16.416 | 8,04 | ||||
| 2026-02-09 | 13F | Legal & General Group Plc | 510.635 | -10,24 | 9.850 | -9,16 | ||||
| 2026-02-09 | 13F | Wellington Shields & Co., LLC | 81.770 | 0,00 | 1.577 | 1,22 | ||||
| 2026-02-17 | 13F | Price T Rowe Associates Inc /md/ | 1.179.335 | 33,54 | 23 | 37,50 | ||||
| 2026-01-23 | 13F | Oak Ridge Investments Llc | 13.620 | -5,75 | 263 | -4,73 | ||||
| 2026-02-10 | 13F | Gw Henssler & Associates Ltd | 581.040 | -11,04 | 11.208 | -9,96 | ||||
| 2026-02-13 | 13F | State Street Corp | 9.627.321 | 2,23 | 185.711 | 3,47 | ||||
| 2026-02-13 | 13F | Agman Capital Llc | 125.311 | 2.417 | ||||||
| 2026-01-22 | 13F | Sterneck Capital Management, LLC | 29.849 | 54,59 | 576 | 56,25 | ||||
| 2026-01-29 | 13F | Impax Asset Management Group plc | 1.256.785 | 24.243 | ||||||
| 2026-02-17 | 13F | Spruce House Investment Management Llc | 0 | -100,00 | 0 | |||||
| 2026-01-30 | 13F/A | M&t Bank Corp | 21.943 | -1,16 | 424 | 0,24 | ||||
| 2026-01-26 | 13F | Merit Financial Group, LLC | 33.932 | 105,99 | 655 | 108,95 | ||||
| 2025-11-14 | 13F | Goldman Sachs Group Inc | Put | 0 | -100,00 | 0 | -100,00 | |||
| 2025-09-29 | NP | CFMCX - Column Mid Cap Fund | 14.124 | 284 | ||||||
| 2026-02-02 | 13F | Truist Financial Corp | 200.317 | 31,62 | 3.864 | 33,24 | ||||
| 2026-02-03 | 13F | Maple Capital Management, Inc. | 11.988 | 4,74 | 231 | 5,96 | ||||
| 2026-01-15 | 13F | Cherry Creek Investment Advisors, Inc. | 84.636 | 0,56 | 1.633 | 1,75 | ||||
| 2026-01-28 | 13F | Universal- Beteiligungs- und Servicegesellschaft mbH | 101.841 | 16,36 | 1.965 | 17,75 | ||||
| 2026-02-12 | 13F | Ci Investments Inc. | 2.496.002 | 75,43 | 48.148 | 178.222,22 | ||||
| 2026-01-29 | 13F | Dunhill Financial, LLC | 12 | 0 | ||||||
| 2026-02-13 | 13F | Ingalls & Snyder Llc | 12.164 | 0,00 | 0 | |||||
| 2026-02-17 | 13F | Engle Capital Management, L.P. | 358.000 | -60,04 | 6.906 | -59,56 | ||||
| 2025-09-25 | NP | DVRAX - MFS Global Alternative Strategy Fund A | 1.855 | 193,98 | 37 | 362,50 | ||||
| 2025-09-26 | NP | FXSCX - Fidelity Flex Small Cap Focused Index Fund | 1.168 | 23 | ||||||
| 2026-02-04 | 13F | Tsai Capital Corp | 1.336.821 | 0,81 | 25.787 | 2,03 | ||||
| 2026-02-17 | 13F | Permanens Capital L.P. | 44.000 | 0,00 | 849 | 1,19 | ||||
| 2025-09-26 | NP | FLXSX - Fidelity Flex Small Cap Index Fund This fund is a listed as child fund of Fmr Llc and if that institution has disclosed ownership in this security, then these positions will not be double counted when calculating total shares and total value | 104.376 | 2.094 | ||||||
| 2026-01-20 | 13F | Braun Stacey Associates Inc | 1.298.850 | 2,65 | 25.055 | 3,89 | ||||
| 2026-02-17 | 13F | Skye Global Management LP | 0 | -100,00 | 0 | |||||
| 2025-11-14 | 13F | Brooklands Fund Management Ltd | Call | 0 | -100,00 | 0 | ||||
| 2025-09-25 | NP | TMAAX - Thrivent Moderately Aggressive Allocation Fund Class A | 6.186 | 124 | ||||||
| 2025-12-15 | 13F | FNY Investment Advisers, LLC | Call | 0 | -100,00 | 0 | ||||
| 2026-02-12 | 13F | State Board Of Administration Of Florida Retirement System | 453.194 | 4,53 | 8.742 | 5,80 | ||||
| 2026-01-30 | 13F | Torren Management, LLC | 91 | 2 | ||||||
| 2026-02-10 | 13F | Moors & Cabot, Inc. | 34.990 | -1,19 | 675 | 0,00 | ||||
| 2026-02-12 | 13F | Scotia Capital Inc. | 309.167 | 4,08 | 5.964 | 5,33 | ||||
| 2026-02-10 | 13F | Bruce G. Allen Investments, LLC | 42 | 366,67 | 1 | |||||
| 2026-02-13 | 13F | Public Employees Retirement Association Of Colorado | 50.893 | 0,00 | 1 | |||||
| 2026-02-17 | 13F | Select Equity Group, L.P. | 3.462.708 | -4,42 | 66.796 | -3,27 | ||||
| 2026-01-28 | 13F | Diversified Enterprises, LLC | 11.434 | 221 | ||||||
| 2025-11-14 | 13F | Strategic Wealth Partners, Ltd. | 13.800 | 0,00 | 263 | -11,45 | ||||
| 2026-02-11 | 13F | Manchester Capital Management LLC | 35 | 1 | ||||||
| 2026-02-13 | 13F | Samjo Management, LLC | 337.130 | 11,06 | 6.503 | 12,41 | ||||
| 2025-10-22 | 13F | Cerity Partners LLC | 0 | -100,00 | 0 | -100,00 | ||||
| 2026-02-13 | 13F | Ubs Asset Management Americas Inc | 1.322.955 | 15,06 | 25.520 | 16,45 | ||||
| 2026-02-13 | 13F | Gallo Partners, LP | 0 | -100,00 | 0 | |||||
| 2026-02-17 | 13F | Claro Advisors LLC | 43.493 | 29,29 | 839 | 30,73 | ||||
| 2026-02-10 | 13F | Goldstein Advisors, LLC | 13.524 | 261 | ||||||
| 2026-01-12 | 13F | CVA Family Office, LLC | 30 | 1 | ||||||
| 2026-02-13 | 13F | Kestra Advisory Services, LLC | 17.762 | 343 | ||||||
| 2026-02-13 | 13F | Mariner, LLC | 32.085 | 99,11 | 619 | 101,63 | ||||
| 2026-02-17 | 13F | Millennium Management Llc | 112.991 | -83,58 | 2.180 | -83,38 | ||||
| 2026-02-17 | 13F | Millennium Management Llc | Put | 107.400 | 401,87 | 2.072 | 408,85 | |||
| 2026-02-17 | 13F | Cantor Fitzgerald, L. P. | 0 | -100,00 | 0 | -100,00 | ||||
| 2026-02-13 | 13F | Morgan Stanley | 67.129.733 | 25,89 | 1.294.933 | 27,40 | ||||
| 2026-02-17 | 13F | Millennium Management Llc | Call | 100.000 | 367,29 | 1.929 | 373,96 | |||
| 2026-02-13 | 13F | Mml Investors Services, Llc | 130.017 | 11,74 | 2.508 | 13,13 | ||||
| 2026-02-09 | 13F | Harbour Investments, Inc. | 0 | -100,00 | 0 | |||||
| 2025-10-07 | 13F | Thurston, Springer, Miller, Herd & Titak, Inc. | 0 | -100,00 | 0 | |||||
| 2026-02-10 | 13F | Zweig-DiMenna Associates LLC | 0 | -100,00 | 0 | |||||
| 2025-09-26 | NP | FZROX - Fidelity ZERO Total Market Index Fund This fund is a listed as child fund of Fmr Llc and if that institution has disclosed ownership in this security, then these positions will not be double counted when calculating total shares and total value | 226.637 | 102,23 | 4.546 | 204,08 | ||||
| 2026-02-02 | 13F | Oppenheimer Asset Management Inc. | 80.041 | 199,85 | 1.544 | 203,74 | ||||
| 2026-02-17 | 13F | Amundi | 1.136.501 | 9.118,11 | 21.923 | 8.921,81 | ||||
| 2026-02-09 | 13F | Prospera Financial Services Inc | 34.108 | 0,35 | 658 | 1,55 | ||||
| 2026-02-11 | 13F | First Command Advisory Services, Inc. | 253 | 0,00 | 5 | 0,00 | ||||
| 2026-02-13 | 13F | Heritage Wealth Advisors | 200 | 0,00 | 4 | 0,00 | ||||
| 2026-01-30 | 13F | Bogart Wealth, LLC | 952 | -28,15 | 18 | -28,00 | ||||
| 2026-01-29 | 13F | Sanctuary Advisors, LLC | 32.116 | 28,67 | 620 | 30,32 | ||||
| 2025-11-14 | 13F | Point72 Hong Kong Ltd | 91 | 2 | ||||||
| 2026-02-09 | 13F | Penn Capital Management Co Inc | 35.321 | 10,67 | 695 | 11,94 | ||||
| 2026-02-13 | 13F | Squarepoint Ops LLC | Call | 17.600 | -47,62 | 340 | -47,03 | |||
| 2026-02-13 | 13F | Squarepoint Ops LLC | Put | 57.300 | 81,90 | 1.105 | 84,17 | |||
| 2026-02-17 | 13F | Ancora Advisors, LLC | 537 | 10 | ||||||
| 2026-02-13 | 13F | Squarepoint Ops LLC | 343.529 | 2.136,66 | 6.627 | 2.169,18 | ||||
| 2026-02-10 | 13F | Machina Capital S.a.s. | 16.332 | 315 | ||||||
| 2026-02-04 | 13F | MONECO Advisors, LLC | 29.529 | 4,11 | 570 | 5,37 | ||||
| 2026-01-23 | 13F | Gainplan LLC | 201.139 | -5,43 | 3.880 | -4,29 | ||||
| 2026-02-17 | 13F | One68 Global Capital, LLC | 11.000 | -8,33 | 212 | -7,02 | ||||
| 2026-01-23 | 13F | TT International Asset Management LTD | 10.738 | 0 | ||||||
| 2026-02-17 | 13F | T. Rowe Price Investment Management, Inc. | 215.241 | -93,05 | 4 | -93,22 | ||||
| 2025-11-14 | 13F | J. Goldman & Co LP | 0 | -100,00 | 0 | |||||
| 2025-09-22 | NP | IALAX - Transamerica Capital Growth A | 2.491.111 | 406,23 | 49.972 | 661,29 | ||||
| 2026-02-17 | 13F | GeoWealth Management, LLC | 9.422 | 182 | ||||||
| 2026-02-02 | 13F | Danske Bank A/s | 5.400 | 92,86 | 104 | 96,23 | ||||
| 2026-02-11 | 13F | Los Angeles Capital Management Llc | 2.825 | -98,43 | 50 | -98,54 | ||||
| 2026-02-12 | 13F | DRW Securities, LLC | 0 | -100,00 | 0 | |||||
| 2026-02-17 | 13F | Discovery Capital Management, Llc / Ct | 1.346.538 | -26,63 | 25.975 | -25,75 | ||||
| 2026-02-12 | 13F | BRYN MAWR TRUST Co | 0 | -100,00 | 0 | -100,00 | ||||
| 2026-02-13 | 13F | Southport Management, L.l.c. | 0 | -100,00 | 0 | |||||
| 2025-11-14 | 13F | Centiva Capital, LP | Put | 0 | -100,00 | 0 | -100,00 | |||
| 2025-10-03 | NP | WSACX - Wellington Shields All-Cap Fund Institutional Shares | 59.000 | 136,00 | 1.188 | 273,27 | ||||
| 2026-02-17 | 13F | Carret Asset Management, Llc | 76.975 | 25,93 | 1.485 | 27,38 | ||||
| 2025-09-24 | NP | BLACKROCK FUNDS - iShares Total U.S. Stock Market Index Fund Investor A | 34.696 | 696 | ||||||
| 2026-02-13 | 13F | Arkadios Wealth Advisors | 50.396 | 20,27 | 972 | 21,80 | ||||
| 2025-10-30 | 13F | Twin Peaks Wealth Advisors, LLC | 0 | -100,00 | 0 | |||||
| 2026-02-12 | 13F | Douglass Winthrop Advisors, LLC | 20.000 | 0,00 | 386 | 1,05 | ||||
| 2026-02-27 | 13F | Strategic Investment Solutions, Inc. /IL | 608 | 0,00 | 12 | 0,00 | ||||
| 2025-09-29 | NP | CALF - Pacer US Small Cap Cash Cows 100 ETF | 0 | -100,00 | 0 | -100,00 | ||||
| 2026-02-03 | 13F | Nordwand Advisors, LLC | 304.725 | 4,81 | 5.878 | 6,08 | ||||
| 2026-02-04 | 13F | Colonial River Wealth Management, LLC | 58.383 | 47,03 | 1.126 | 48,94 | ||||
| 2026-01-29 | 13F | UBS Group AG | 4.978.172 | 13,92 | 96.029 | 15,30 | ||||
| 2026-02-18 | 13F | GWM Advisors LLC | 1.680 | 42,37 | 32 | 45,45 | ||||
| 2026-02-11 | 13F | CenterBook Partners LP | 0 | -100,00 | 0 | -100,00 | ||||
| 2026-01-21 | 13F | Canton Hathaway, LLC | 381.687 | 4,92 | 7.363 | 6,17 | ||||
| 2026-01-28 | 13F | Ttp Investments, Inc. | Call | 10.000 | 79 | |||||
| 2026-01-30 | 13F | Georgetown University | 0 | -100,00 | 0 | |||||
| 2026-02-13 | 13F | Umb Bank N A/mo | 52 | -36,59 | 1 | 0,00 | ||||
| 2026-02-18 | 13F | State of Tennessee, Treasury Department | 32.255 | 17,31 | 715 | 36,45 | ||||
| 2026-02-17 | 13F | Balyasny Asset Management Llc | Call | 112.500 | 2.170 | |||||
| 2026-02-17 | 13F | Balyasny Asset Management Llc | 1.046.348 | 26,92 | 20.184 | 28,45 | ||||
| 2026-02-17 | 13F | Snowden Capital Advisors LLC | 14.924 | 288 | ||||||
| 2026-02-23 | 13F | Virtu Financial LLC | 42.551 | 1 | ||||||
| 2026-01-20 | 13F | Cromwell Holdings LLC | 91 | -11,65 | 2 | 0,00 | ||||
| 2026-02-17 | 13F | Woodson Capital Management, LP | 850.000 | 16.396 | ||||||
| 2025-09-26 | NP | ALARX - Alger Capital Appreciation Institutional Fund Class I | 229.851 | 4.611 | ||||||
| 2026-02-17 | 13F | Private Advisor Group, LLC | 17.458 | -68,39 | 337 | -68,06 | ||||
| 2026-02-17 | 13F | Private Advisor Group, LLC | Call | 2.000 | 3 | |||||
| 2026-02-05 | 13F | Plancorp, LLC | 11.626 | 224 | ||||||
| 2026-02-17 | 13F | Opal Capital Llc | 11.196 | 216 | ||||||
| 2026-01-13 | 13F | CoreCap Advisors, LLC | 280 | -87,41 | 5 | -88,10 | ||||
| 2026-02-03 | 13F | Diversify Wealth Management, Llc | 15.607 | -0,88 | 393 | 44,12 | ||||
| 2026-02-12 | 13F | Cruiser Capital Advisors, Llc | 10.000 | 0,00 | 552 | 0,36 | ||||
| 2026-02-13 | 13F | Bullseye Asset Management LLC | 112.000 | 4,67 | 2 | 0,00 | ||||
| 2026-02-17 | 13F | Citadel Advisors Llc | 101.795 | -90,67 | 1.964 | -90,56 | ||||
| 2026-02-17 | 13F | Citadel Advisors Llc | Call | 841.300 | 15,55 | 16.229 | 16,94 | |||
| 2026-02-12 | 13F | Ensign Peak Advisors, Inc | 471.221 | -16,70 | 9.090 | -15,69 | ||||
| 2026-02-13 | 13F | JustInvest LLC | 22.075 | 42,49 | 426 | 44,07 | ||||
| 2026-02-17 | 13F | Citadel Advisors Llc | Put | 784.000 | -26,09 | 15.123 | -25,20 | |||
| 2026-02-06 | 13F | Handelsbanken Fonder AB | 170.700 | 52,96 | 3 | 50,00 | ||||
| 2026-02-17 | 13F | State Of Wisconsin Investment Board | 235.649 | 1,29 | 4.546 | 2,50 | ||||
| 2026-02-19 | 13F | CI Private Wealth, LLC | 0 | -100,00 | 0 | |||||
| 2025-09-23 | NP | SBMAX - ClearBridge Mid Cap Fund Class A This fund is a listed as child fund of Clearbridge, Llc and if that institution has disclosed ownership in this security, then these positions will not be double counted when calculating total shares and total value | 400.000 | 8.024 | ||||||
| 2025-09-26 | NP | FZIPX - Fidelity ZERO Extended Market Index Fund This fund is a listed as child fund of Fmr Llc and if that institution has disclosed ownership in this security, then these positions will not be double counted when calculating total shares and total value | 144.185 | 96,02 | 2.892 | 194,80 | ||||
| 2026-02-04 | 13F | Ameritas Advisory Services, LLC | 15.837 | 58,37 | 305 | 60,53 | ||||
| 2026-02-13 | 13F | OMERS ADMINISTRATION Corp | 746.600 | 3,78 | 14.402 | 5,03 | ||||
| 2026-02-02 | 13F | Intact Investment Management Inc. | 51.500 | 0,00 | 993 | 1,22 | ||||
| 2026-01-15 | 13F | Polianta Ltd | 0 | -100,00 | 0 | |||||
| 2025-12-09 | 13F/A | Tudor Investment Corp Et Al | 0 | -100,00 | 0 | |||||
| 2025-09-25 | NP | VMGRX - Vanguard Mid-Cap Growth Fund Investor Shares | 629.438 | 12.627 | ||||||
| 2026-02-13 | 13F | Epoch Investment Partners, Inc. | 1.359.643 | 12,20 | 26.228 | 13,55 | ||||
| 2026-02-03 | 13F | Everence Capital Management Inc | 41.245 | 113,73 | 1 | |||||
| 2026-01-29 | 13F | Horizon Advisory Services, Inc. | 27.993 | -18,84 | 540 | -17,96 | ||||
| 2026-01-28 | 13F | Quaker Wealth Management, LLC | 2 | 0 | ||||||
| 2026-02-12 | 13F | Voya Investment Management Llc | 2.432.184 | 20,08 | 46.917 | 21,53 | ||||
| 2026-02-02 | 13F | Principal Financial Group Inc | 16.739 | -26,20 | 323 | -25,46 |