Grundlæggende statistik
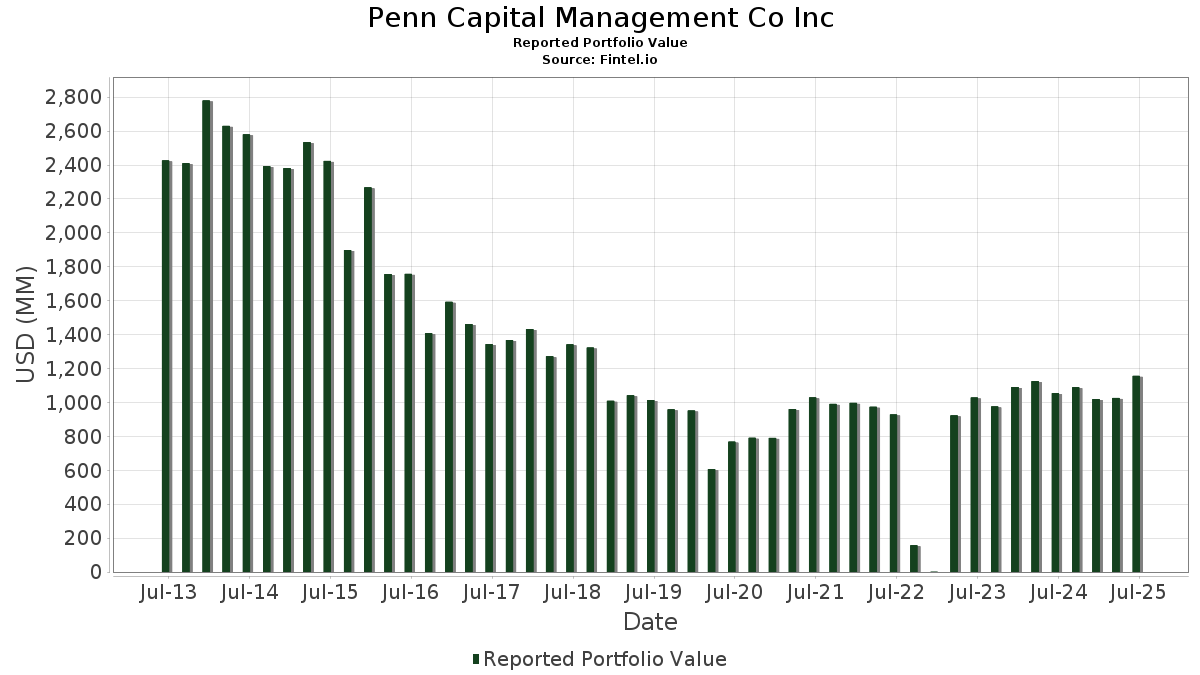
| Porteføljeværdi | $ 1.156.403.010 |
| Nuværende stillinger | 157 |
Seneste beholdninger, ydeevne, AUM (fra 13F, 13D)
Penn Capital Management Co Inc har afsløret 157 samlede besiddelser i deres seneste SEC-arkivering. Den seneste porteføljeværdi er beregnet til at være $ 1.156.403.010 USD. Faktiske aktiver under forvaltning (AUM) er denne værdi plus kontanter (som ikke er oplyst). Penn Capital Management Co Incs største beholdninger er Amentum Holdings, Inc. (US:AMTM) , Lumentum Holdings Inc. (US:LITE) , BGC Group, Inc. (US:BGC) , Dycom Industries, Inc. (US:DY) , and Gulfport Energy Corporation (US:GPOR) . Penn Capital Management Co Incs nye stillinger omfatter eToro Group Ltd. (US:ETOR) , Guardian Pharmacy Services, Inc. (US:GRDN) , Similarweb Ltd. (US:SMWB) , Fortuna Mining Corp. (GB:0QYM) , and Mission Produce, Inc. (US:AVO) .
Top øger dette kvartal
Vi bruger ændringen i porteføljeallokeringen, fordi dette er den mest meningsfulde metrik. Ændringer kan skyldes handler eller ændringer i aktiekurser.
| Sikkerhed | Aktier (MM) |
Værdi (MM$) |
Portefølje % | ΔPortefølje % |
|---|---|---|---|---|
| 0,56 | 16,01 | 1,3846 | 1,2722 | |
| 0,18 | 12,28 | 1,0619 | 1,0619 | |
| 0,21 | 18,16 | 1,5701 | 0,9900 | |
| 0,53 | 11,37 | 0,9829 | 0,9829 | |
| 1,28 | 11,34 | 0,9808 | 0,9808 | |
| 0,22 | 10,94 | 0,9461 | 0,9461 | |
| 1,09 | 16,29 | 1,4088 | 0,8865 | |
| 0,18 | 8,88 | 0,7683 | 0,7683 | |
| 0,13 | 7,82 | 0,6759 | 0,6759 | |
| 0,16 | 18,16 | 1,5700 | 0,5628 |
Top falder i dette kvartal
Vi bruger ændringen i porteføljeallokeringen, fordi dette er den mest meningsfulde metrik. Ændringer kan skyldes handler eller ændringer i aktiekurser.
| Sikkerhed | Aktier (MM) |
Værdi (MM$) |
Portefølje % | ΔPortefølje % |
|---|---|---|---|---|
| 0,00 | 0,00 | -1,3495 | ||
| 1,90 | 8,18 | 0,7074 | -0,4575 | |
| 0,23 | 11,15 | 0,9641 | -0,4565 | |
| 0,18 | 14,82 | 1,2814 | -0,3416 | |
| 0,34 | 9,71 | 0,8397 | -0,3280 | |
| 0,06 | 15,44 | 1,3354 | -0,3123 | |
| 3,19 | 8,27 | 0,7153 | -0,2969 | |
| 0,21 | 16,84 | 1,4561 | -0,2801 | |
| 1,04 | 15,40 | 1,3314 | -0,2731 | |
| 0,01 | 2,02 | 0,1745 | -0,2609 |
13F og Fondsarkivering
Denne formular blev indsendt den 2025-08-14 for rapporteringsperioden 2025-06-30. Klik på linkikonet for at se den fulde transaktionshistorik.
Opgrader for at låse op for premium-data og eksportere til Excel ![]() .
.
| Sikkerhed | Type | Gennemsnitlig aktiekurs | Aktier (MM) |
Δ Aktier (%) |
Δ Aktier (%) |
Værdi ($MM) |
Portefølje (%) |
ΔPortefølje (%) |
|
|---|---|---|---|---|---|---|---|---|---|
| AMTM / Amentum Holdings, Inc. | 1,00 | 12,82 | 23,76 | 46,36 | 2,0544 | 0,4728 | |||
| LITE / Lumentum Holdings Inc. | 0,24 | 2,38 | 22,97 | 56,13 | 1,9862 | 0,5527 | |||
| BGC / BGC Group, Inc. | 2,24 | 0,00 | 22,96 | 11,56 | 1,9853 | -0,0200 | |||
| DY / Dycom Industries, Inc. | 0,09 | -13,32 | 22,79 | 39,05 | 1,9706 | 0,3736 | |||
| GPOR / Gulfport Energy Corporation | 0,11 | 0,16 | 22,11 | 9,42 | 1,9119 | -0,0569 | |||
| NMRK / Newmark Group, Inc. | 1,69 | 11,89 | 20,56 | 11,71 | 1,7775 | -0,0155 | |||
| ABCB / Ameris Bancorp | 0,31 | -0,13 | 20,42 | 12,24 | 1,7656 | -0,0069 | |||
| WAY / Waystar Holding Corp. | 0,50 | 4,59 | 20,34 | 14,42 | 1,7593 | 0,0268 | |||
| EXTR / Extreme Networks, Inc. | 1,12 | 17,58 | 20,12 | 59,60 | 1,7403 | 0,5116 | |||
| GDEN / Golden Entertainment, Inc. | 0,68 | 0,91 | 20,07 | 12,57 | 1,7354 | -0,0017 | |||
| ATEC / Alphatec Holdings, Inc. | 1,73 | -4,27 | 19,20 | 4,78 | 1,6600 | -0,1251 | |||
| RMBS / Rambus Inc. | 0,29 | 15,98 | 18,38 | 43,42 | 1,5892 | 0,3406 | |||
| CAMT / Camtek Ltd. | 0,21 | 111,47 | 18,16 | 204,99 | 1,5701 | 0,9900 | |||
| AGYS / Agilysys, Inc. | 0,16 | 11,10 | 18,16 | 75,65 | 1,5700 | 0,5628 | |||
| MGNI / Magnite, Inc. | 0,75 | -18,24 | 18,09 | 72,82 | 1,5641 | 0,5443 | |||
| GTLS / Chart Industries, Inc. | 0,11 | -11,07 | 17,98 | 1,44 | 1,5546 | -0,1721 | |||
| MIRM / Mirum Pharmaceuticals, Inc. | 0,34 | -8,37 | 17,46 | 3,51 | 1,5101 | -0,1338 | |||
| NXST / Nexstar Media Group, Inc. | 0,10 | 7,87 | 17,29 | 4,11 | 1,4954 | -0,1232 | |||
| CALX / Calix, Inc. | 0,32 | -6,64 | 16,85 | 40,17 | 1,4568 | 0,2857 | |||
| TCBI / Texas Capital Bancshares, Inc. | 0,21 | -11,09 | 16,84 | -5,50 | 1,4561 | -0,2801 | |||
| OUST / Ouster, Inc. | 0,69 | -40,47 | 16,70 | 60,76 | 1,4440 | 0,4319 | |||
| RSI / Rush Street Interactive, Inc. | 1,09 | 118,69 | 16,29 | 203,94 | 1,4088 | 0,8865 | |||
| FWRG / First Watch Restaurant Group, Inc. | 1,01 | -0,48 | 16,18 | -4,14 | 1,3988 | -0,2454 | |||
| RDNT / RadNet, Inc. | 0,28 | 2,55 | 16,05 | 17,43 | 1,3877 | 0,0562 | |||
| CZR / Caesars Entertainment, Inc. | 0,56 | 1.144,21 | 16,01 | 1.288,64 | 1,3846 | 1,2722 | |||
| TGTX / TG Therapeutics, Inc. | 0,44 | 13,05 | 16,00 | 3,19 | 1,3836 | -0,1273 | |||
| LTH / Life Time Group Holdings, Inc. | 0,52 | 7,34 | 15,90 | 7,82 | 1,3754 | -0,0620 | |||
| BPOP / Popular, Inc. | 0,14 | -1,62 | 15,89 | 17,39 | 1,3739 | 0,0551 | |||
| RXO / RXO, Inc. | 1,00 | 41,47 | 15,84 | 16,40 | 1,3694 | 0,0438 | |||
| CHEF / The Chefs' Warehouse, Inc. | 0,25 | -10,78 | 15,79 | 4,54 | 1,3654 | -0,1063 | |||
| RHP / Ryman Hospitality Properties, Inc. | 0,16 | 14,47 | 15,78 | 23,52 | 1,3644 | 0,1197 | |||
| KD / Kyndryl Holdings, Inc. | 0,37 | -29,17 | 15,61 | -5,32 | 1,3496 | -0,2566 | |||
| SRAD / Sportradar Group AG | 0,55 | -2,91 | 15,54 | 26,11 | 1,3436 | 0,1431 | |||
| CRS / Carpenter Technology Corporation | 0,06 | -40,15 | 15,44 | -8,68 | 1,3354 | -0,3123 | |||
| DNOW / DNOW Inc. | 1,04 | 7,69 | 15,40 | -6,50 | 1,3314 | -0,2731 | |||
| WFRD / Weatherford International plc | 0,30 | 13,35 | 15,17 | 6,48 | 1,3119 | -0,0764 | |||
| KNF / Knife River Corporation | 0,18 | -1,70 | 14,82 | -11,04 | 1,2814 | -0,3416 | |||
| NOG / Northern Oil and Gas, Inc. | 0,52 | 31,01 | 14,66 | 22,85 | 1,2678 | 0,1049 | |||
| BV / BrightView Holdings, Inc. | 0,87 | -4,84 | 14,50 | 23,39 | 1,2538 | 0,1088 | |||
| PRKS / United Parks & Resorts Inc. | 0,30 | -2,35 | 14,39 | 1,28 | 1,2448 | -0,1401 | |||
| LGND / Ligand Pharmaceuticals Incorporated | 0,12 | -0,38 | 13,70 | 7,71 | 1,1848 | -0,0547 | |||
| ODD / Oddity Tech Ltd. | 0,17 | -37,56 | 13,16 | 8,95 | 1,1384 | -0,0390 | |||
| DCOM / Dime Community Bancshares, Inc. | 0,49 | 2,89 | 13,13 | -0,61 | 1,1350 | -0,1517 | |||
| OMF / OneMain Holdings, Inc. | 0,23 | -8,66 | 12,91 | 6,53 | 1,1167 | -0,0644 | |||
| BYD / Boyd Gaming Corporation | 0,16 | -7,18 | 12,66 | 10,31 | 1,0947 | -0,0236 | |||
| BANC / Banc of California, Inc. | 0,90 | -1,70 | 12,61 | -2,68 | 1,0901 | -0,1720 | |||
| FBK / FB Financial Corporation | 0,28 | 0,00 | 12,57 | -2,29 | 1,0867 | -0,1665 | |||
| ETOR / eToro Group Ltd. | 0,18 | 12,28 | 1,0619 | 1,0619 | |||||
| CRC / California Resources Corporation | 0,27 | 21,79 | 12,14 | 26,50 | 1,0498 | 0,1146 | |||
| BLKB / Blackbaud, Inc. | 0,19 | -5,10 | 12,10 | -1,82 | 1,0467 | -0,1546 | |||
| PENN / PENN Entertainment, Inc. | 0,67 | -8,08 | 12,04 | 0,70 | 1,0408 | -0,1238 | |||
| PEGA / Pegasystems Inc. | 0,22 | 43,24 | 12,03 | 11,54 | 1,0400 | -0,0107 | |||
| ASO / Academy Sports and Outdoors, Inc. | 0,27 | 21,65 | 11,92 | 19,52 | 1,0305 | 0,0589 | |||
| STGW / Stagwell Inc. | 2,58 | 23,77 | 11,64 | -7,93 | 1,0068 | -0,2254 | |||
| GRDN / Guardian Pharmacy Services, Inc. | 0,53 | 11,37 | 0,9829 | 0,9829 | |||||
| CDE / Coeur Mining, Inc. | 1,28 | 11,34 | 0,9808 | 0,9808 | |||||
| PWP / Perella Weinberg Partners | 0,58 | 10,44 | 11,33 | 16,56 | 0,9798 | 0,0326 | |||
| CMC / Commercial Metals Company | 0,23 | 23,57 | 11,31 | 31,29 | 0,9776 | 0,1386 | |||
| LAZ / Lazard, Inc. | 0,23 | -30,98 | 11,15 | -23,53 | 0,9641 | -0,4565 | |||
| LIND / Lindblad Expeditions Holdings, Inc. | 0,95 | 0,91 | 11,13 | 27,03 | 0,9629 | 0,1088 | |||
| GXO / GXO Logistics, Inc. | 0,22 | 10,94 | 0,9461 | 0,9461 | |||||
| GTN / Gray Media, Inc. | 2,25 | 11,69 | 10,23 | 17,10 | 0,8850 | 0,0334 | |||
| PRSU / Pursuit Attractions and Hospitality, Inc. | 0,34 | -0,53 | 9,71 | -18,97 | 0,8397 | -0,3280 | |||
| NCLH / Norwegian Cruise Line Holdings Ltd. | 0,46 | 4,81 | 9,39 | 12,07 | 0,8123 | -0,0044 | |||
| WTTR / Select Water Solutions, Inc. | 1,05 | 25,26 | 9,09 | 3,06 | 0,7860 | -0,0734 | |||
| HNI / HNI Corporation | 0,18 | 8,88 | 0,7683 | 0,7683 | |||||
| RIG / Transocean Ltd. | 3,19 | -2,51 | 8,27 | -20,37 | 0,7153 | -0,2969 | |||
| BDN / Brandywine Realty Trust | 1,90 | -28,91 | 8,18 | -31,57 | 0,7074 | -0,4575 | |||
| PNFP / Pinnacle Financial Partners, Inc. | 0,07 | -3,28 | 8,13 | 0,73 | 0,7032 | -0,0835 | |||
| GCMG / GCM Grosvenor Inc. | 0,68 | 26,52 | 7,83 | 10,54 | 0,6774 | -0,0131 | |||
| FUL / H.B. Fuller Company | 0,13 | 7,82 | 0,6759 | 0,6759 | |||||
| CCO / Clear Channel Outdoor Holdings, Inc. | 4,87 | -13,94 | 5,71 | -9,27 | 0,4935 | -0,1194 | |||
| ASPN / Aspen Aerogels, Inc. | 0,75 | 16,16 | 4,42 | 7,62 | 0,3822 | -0,0180 | |||
| SSP / The E.W. Scripps Company | 1,43 | 0,46 | 4,21 | -0,21 | 0,3639 | -0,0470 | |||
| SMWB / Similarweb Ltd. | 0,41 | 3,23 | 0,2794 | 0,2794 | |||||
| EZPW / EZCORP, Inc. | 0,22 | 1.599,56 | 3,00 | 1.503,21 | 0,2593 | 0,2411 | |||
| FOXF / Fox Factory Holding Corp. | 0,11 | 7,02 | 2,98 | 18,92 | 0,2577 | 0,0136 | |||
| NWN / Northwest Natural Holding Company | 0,07 | 76,89 | 2,93 | 64,50 | 0,2537 | 0,0799 | |||
| OSPN / OneSpan Inc. | 0,16 | -4,57 | 2,66 | 4,43 | 0,2303 | -0,0182 | |||
| CVGW / Calavo Growers, Inc. | 0,10 | 128,50 | 2,60 | 153,27 | 0,2245 | 0,1246 | |||
| TNC / Tennant Company | 0,03 | 18,19 | 2,46 | 14,81 | 0,2125 | 0,0040 | |||
| PDFS / PDF Solutions, Inc. | 0,11 | 5,56 | 2,45 | 18,12 | 0,2120 | 0,0097 | |||
| DKNG / DraftKings Inc. | 0,05 | -19,15 | 2,37 | 4,79 | 0,2046 | -0,0154 | |||
| MTZ / MasTec, Inc. | 0,01 | -21,22 | 2,34 | 15,31 | 0,2026 | 0,0046 | |||
| 0QYM / Fortuna Mining Corp. | 0,35 | 2,29 | 0,1983 | 0,1983 | |||||
| AVO / Mission Produce, Inc. | 0,19 | 2,23 | 0,1931 | 0,1931 | |||||
| KWR / Quaker Chemical Corporation | 0,02 | 2,21 | 0,1913 | 0,1913 | |||||
| DRS / Leonardo DRS, Inc. | 0,05 | -13,46 | 2,15 | 22,37 | 0,1860 | 0,0147 | |||
| EXE / Expand Energy Corporation | 0,02 | -14,39 | 2,05 | -9,82 | 0,1772 | -0,0442 | |||
| VXF / Vanguard Index Funds - Vanguard Extended Market ETF | 0,01 | -60,04 | 2,02 | -54,83 | 0,1745 | -0,2609 | |||
| CTRI / Centuri Holdings, Inc. | 0,09 | 2,02 | 0,1743 | 0,1743 | |||||
| PNTG / The Pennant Group, Inc. | 0,07 | 1,98 | 0,1710 | 0,1710 | |||||
| YORW / The York Water Company | 0,06 | 42,97 | 1,87 | 30,24 | 0,1617 | 0,0218 | |||
| PRO / PROS Holdings, Inc. | 0,12 | 23,42 | 1,83 | 1,56 | 0,1579 | -0,0173 | |||
| DOLE / Dole plc | 0,13 | 1,80 | 0,1560 | 0,1560 | |||||
| PKE / Park Aerospace Corp. | 0,12 | -0,59 | 1,76 | 9,21 | 0,1518 | -0,0049 | |||
| THS / TreeHouse Foods, Inc. | 0,09 | 1,74 | 0,1502 | 0,1502 | |||||
| FOUR / Shift4 Payments, Inc. | 0,02 | 1,49 | 1,60 | 23,28 | 0,1383 | 0,0118 | |||
| RSKD / Riskified Ltd. | 0,32 | 46,48 | 1,59 | 58,15 | 0,1377 | 0,0396 | |||
| GILT / Gilat Satellite Networks Ltd. | 0,22 | -49,10 | 1,57 | -43,19 | 0,1354 | -0,1331 | |||
| AMWD / American Woodmark Corporation | 0,03 | 171,39 | 1,54 | 146,24 | 0,1332 | 0,0722 | |||
| HQY / HealthEquity, Inc. | 0,01 | 27,43 | 1,53 | 51,28 | 0,1324 | 0,0337 | |||
| AMG / Affiliated Managers Group, Inc. | 0,01 | -29,50 | 1,52 | -17,18 | 0,1317 | -0,0475 | |||
| MSM / MSC Industrial Direct Co., Inc. | 0,02 | 25,21 | 1,50 | 36,68 | 0,1296 | 0,0228 | |||
| OEC / Orion S.A. | 0,14 | -17,40 | 1,50 | -32,99 | 0,1293 | -0,0881 | |||
| ADUS / Addus HomeCare Corporation | 0,01 | 1,47 | 0,1271 | 0,1271 | |||||
| SSYS / Stratasys Ltd. | 0,13 | 15,49 | 1,45 | 35,32 | 0,1256 | 0,0210 | |||
| GWRS / Global Water Resources, Inc. | 0,13 | 310,02 | 1,32 | 306,17 | 0,1139 | 0,0822 | |||
| MRTN / Marten Transport, Ltd. | 0,10 | -30,41 | 1,29 | -34,10 | 0,1115 | -0,0792 | |||
| S / SentinelOne, Inc. | 0,07 | 1,20 | 1,28 | 1,67 | 0,1104 | -0,0120 | |||
| BAND / Bandwidth Inc. | 0,07 | 1,13 | 0,0978 | 0,0978 | |||||
| IWM / iShares Trust - iShares Russell 2000 ETF | 0,00 | -51,73 | 0,99 | -47,79 | 0,0858 | -0,0993 | |||
| TATT / TAT Technologies Ltd. | 0,03 | 0,94 | 0,0812 | 0,0812 | |||||
| MSEX / Middlesex Water Company | 0,02 | 0,94 | 0,0810 | 0,0810 | |||||
| PFGC / Performance Food Group Company | 0,01 | -22,33 | 0,92 | -13,25 | 0,0793 | -0,0237 | |||
| FND / Floor & Decor Holdings, Inc. | 0,01 | -15,49 | 0,83 | -20,04 | 0,0715 | -0,0292 | |||
| OFG / OFG Bancorp | 0,02 | 2,37 | 0,79 | 9,52 | 0,0687 | -0,0020 | |||
| BSVN / Bank7 Corp. | 0,02 | 2,36 | 0,71 | 10,58 | 0,0615 | -0,0012 | |||
| PTLO / Portillo's Inc. | 0,06 | 83,38 | 0,68 | 80,00 | 0,0584 | 0,0218 | |||
| SOC / Sable Offshore Corp. | 0,03 | 70,86 | 0,66 | 48,31 | 0,0568 | 0,0136 | |||
| DEC / Diversified Energy Company PLC | 0,04 | -25,47 | 0,65 | -19,15 | 0,0563 | -0,0221 | |||
| OSW / OneSpaWorld Holdings Limited | 0,03 | 2,36 | 0,59 | 24,36 | 0,0508 | 0,0047 | |||
| HFWA / Heritage Financial Corporation | 0,02 | -7,61 | 0,57 | -9,51 | 0,0494 | -0,0121 | |||
| TCBX / Third Coast Bancshares, Inc. | 0,02 | 80,77 | 0,55 | 77,24 | 0,0479 | 0,0174 | |||
| BFST / Business First Bancshares, Inc. | 0,02 | -8,44 | 0,52 | -7,32 | 0,0449 | -0,0097 | |||
| AORT / Artivion, Inc. | 0,02 | -16,04 | 0,51 | 6,32 | 0,0437 | -0,0027 | |||
| INSE / Inspired Entertainment, Inc. | 0,06 | 34,59 | 0,49 | 28,53 | 0,0425 | 0,0053 | |||
| MNR / Mach Natural Resources LP | 0,03 | 0,00 | 0,48 | -7,14 | 0,0417 | -0,0089 | |||
| RBBN / Ribbon Communications Inc. | 0,12 | 34,17 | 0,48 | 37,14 | 0,0415 | 0,0074 | |||
| GENI / Genius Sports Limited | 0,05 | 14,64 | 0,47 | 18,99 | 0,0407 | 0,0022 | |||
| MAMA / Mama's Creations, Inc. | 0,06 | -83,20 | 0,46 | -78,59 | 0,0401 | -0,1711 | |||
| GOGO / Gogo Inc. | 0,03 | 0,45 | 0,0392 | 0,0392 | |||||
| DCO / Ducommun Incorporated | 0,01 | -64,93 | 0,43 | -50,12 | 0,0370 | -0,0465 | |||
| SIMO / Silicon Motion Technology Corporation - Depositary Receipt (Common Stock) | 0,01 | -90,28 | 0,43 | -85,56 | 0,0370 | -0,2513 | |||
| BZH / Beazer Homes USA, Inc. | 0,02 | -45,92 | 0,41 | -40,69 | 0,0358 | -0,0322 | |||
| CVLG / Covenant Logistics Group, Inc. | 0,02 | 0,41 | 0,0355 | 0,0355 | |||||
| SEI / Solaris Energy Infrastructure, Inc. | 0,01 | 4,63 | 0,40 | 36,15 | 0,0349 | 0,0060 | |||
| ANIP / ANI Pharmaceuticals, Inc. | 0,01 | -10,74 | 0,39 | -13,17 | 0,0337 | -0,0100 | |||
| VSEC / VSE Corporation | 0,00 | -30,86 | 0,38 | -24,70 | 0,0325 | -0,0160 | |||
| FCF / First Commonwealth Financial Corporation | 0,02 | 0,36 | 0,0314 | 0,0314 | |||||
| AMAL / Amalgamated Financial Corp. | 0,01 | 2,36 | 0,36 | 11,21 | 0,0309 | -0,0004 | |||
| NESR / National Energy Services Reunited Corp. | 0,05 | -40,40 | 0,31 | -51,24 | 0,0272 | -0,0357 | |||
| CIVB / Civista Bancshares, Inc. | 0,01 | 2,36 | 0,31 | 21,57 | 0,0268 | 0,0020 | |||
| CLFD / Clearfield, Inc. | 0,01 | 0,29 | 0,0254 | 0,0254 | |||||
| LESL / Leslie's, Inc. | 0,69 | 14,64 | 0,29 | -34,76 | 0,0251 | -0,0181 | |||
| AQST / Aquestive Therapeutics, Inc. | 0,09 | 0,57 | 0,29 | 14,74 | 0,0249 | 0,0005 | |||
| TVTX / Travere Therapeutics, Inc. | 0,02 | -8,39 | 0,29 | -24,60 | 0,0247 | -0,0121 | |||
| FLOC / Flowco Holdings Inc. | 0,02 | 27,73 | 0,28 | -11,53 | 0,0246 | -0,0067 | |||
| MRC / MRC Global Inc. | 0,02 | -54,00 | 0,28 | -45,04 | 0,0240 | -0,0252 | |||
| VVX / V2X, Inc. | 0,01 | 36,50 | 0,28 | 35,29 | 0,0239 | 0,0040 | |||
| US12685JAE55 / Cable One Inc | 0,27 | 0,00 | 0,0237 | -0,0030 | |||||
| FWRD / Forward Air Corporation | 0,01 | 0,26 | 0,0221 | 0,0221 | |||||
| TLNE / Talen Energy Corporation | 0,00 | 0,23 | 0,0201 | 0,0201 | |||||
| THR / Thermon Group Holdings, Inc. | 0,01 | -75,72 | 0,22 | -70,67 | 0,0193 | -0,0095 | |||
| LMNR / Limoneira Company | 0,01 | 0,21 | 0,0182 | 0,0182 | |||||
| DDI / DoubleDown Interactive Co., Ltd. - Depositary Receipt (Common Stock) | 0,02 | 0,19 | 0,0168 | 0,0168 | |||||
| ASPI / ASP Isotopes Inc. | 0,02 | 0,14 | 0,0119 | 0,0119 | |||||
| HCSG / Healthcare Services Group, Inc. | 0,00 | -100,00 | 0,00 | 0,0000 | |||||
| GNRC / Generac Holdings Inc. | 0,00 | -100,00 | 0,00 | 0,0000 | |||||
| PLOW / Douglas Dynamics, Inc. | 0,00 | -100,00 | 0,00 | 0,0000 | |||||
| FWRD / Forward Air Corporation | 0,00 | -100,00 | 0,00 | 0,0000 | |||||
| HTLD / Heartland Express, Inc. | 0,00 | -100,00 | 0,00 | 0,0000 | |||||
| CENX / Century Aluminum Company | 0,00 | -100,00 | 0,00 | 0,0000 | |||||
| SEAT / Vivid Seats Inc. | 0,00 | -100,00 | 0,00 | 0,0000 | |||||
| ARCB / ArcBest Corporation | 0,00 | -100,00 | 0,00 | 0,0000 | |||||
| AMTB / Amerant Bancorp Inc. | 0,00 | -100,00 | 0,00 | 0,0000 | |||||
| BXC / BlueLinx Holdings Inc. | 0,00 | -100,00 | 0,00 | 0,0000 | |||||
| DCGO / DocGo Inc. | 0,00 | -100,00 | 0,00 | 0,0000 | |||||
| DDD / 3D Systems Corporation | 0,00 | -100,00 | 0,00 | 0,0000 | |||||
| CRNT / Ceragon Networks Ltd. | 0,00 | -100,00 | 0,00 | 0,0000 | |||||
| TKO / TKO Group Holdings, Inc. | 0,00 | -100,00 | 0,00 | 0,0000 | |||||
| CBL / CBL & Associates Properties, Inc. | 0,00 | -100,00 | 0,00 | 0,0000 | |||||
| VO / Vanguard Index Funds - Vanguard Mid-Cap ETF | 0,00 | -100,00 | 0,00 | 0,0000 | |||||
| XPO / XPO, Inc. | 0,00 | -100,00 | 0,00 | 0,0000 | |||||
| APLD / Applied Digital Corporation | 0,00 | -100,00 | 0,00 | 0,0000 | |||||
| HLMN / Hillman Solutions Corp. | 0,00 | -100,00 | 0,00 | -100,00 | -1,3495 | ||||
| EPR / EPR Properties | 0,00 | -100,00 | 0,00 | 0,0000 | |||||
| TGNA / TEGNA Inc. | 0,00 | -100,00 | 0,00 | 0,0000 | |||||
| JLL / Jones Lang LaSalle Incorporated | 0,00 | -100,00 | 0,00 | 0,0000 | |||||
| CWCO / Consolidated Water Co. Ltd. | 0,00 | -100,00 | 0,00 | 0,0000 | |||||
| VTI / Vanguard Index Funds - Vanguard Total Stock Market ETF | 0,00 | -100,00 | 0,00 | 0,0000 | |||||
| ROG / Rogers Corporation | 0,00 | -100,00 | 0,00 | 0,0000 | |||||
| LBRT / Liberty Energy Inc. | 0,00 | -100,00 | 0,00 | 0,0000 | |||||
| CYH / Community Health Systems, Inc. | 0,00 | -100,00 | 0,00 | 0,0000 | |||||
| LNTH / Lantheus Holdings, Inc. | 0,00 | -100,00 | 0,00 | 0,0000 | |||||
| NFG / National Fuel Gas Company | 0,00 | -100,00 | 0,00 | 0,0000 | |||||
| EYE / National Vision Holdings, Inc. | 0,00 | -100,00 | 0,00 | 0,0000 | |||||
| VECO / Veeco Instruments Inc. | 0,00 | -100,00 | 0,00 | 0,0000 | |||||
| MNRO / Monro, Inc. | 0,00 | -100,00 | 0,00 | 0,0000 |