Grundlæggende statistik
| Institutionelle aktier (lange) | 167.941.441 - 51,43% (ex 13D/G) - change of 0,86MM shares 0,51% MRQ |
| Institutionel værdi (lang) | $ 25.079.066 USD ($1000) |
Institutionelt ejerskab og aktionærer
Strategy Inc (US:MSTR) har 1022 institutionelle ejere og aktionærer, der har indsendt 13D/G- eller 13F-formularer til Securities Exchange Commission (SEC). Disse institutioner har i alt 167,941,441 aktier. Største aktionærer omfatter Vanguard Group Inc, Capital International Investors, Jane Street Group, Llc, Susquehanna International Group, Llp, Toroso Investments, LLC, BlackRock, Inc., IMC-Chicago, LLC, Citadel Advisors Llc, Citadel Advisors Llc, and Jane Street Group, Llc .
Strategy Inc (NasdaqGS:MSTR) institutionel ejerskabsstruktur viser aktuelle positioner i virksomheden efter institutioner og fonde, samt seneste ændringer i positionsstørrelse. Større aktionærer kan omfatte individuelle investorer, investeringsforeninger, hedgefonde eller institutioner. Skema 13D angiver, at investoren besidder (eller besidder) mere end 5 % af virksomheden og har til hensigt (eller har til hensigt at) aktivt at forfølge en ændring i forretningsstrategi. Skema 13G indikerer en passiv investering på over 5%.
The share price as of April 20, 2026 is 170,81 / share. Previously, on April 21, 2025, the share price was 317,76 / share. This represents a decline of 46,25% over that period.

Fondens stemningsscore
Fund Sentiment Score (fka Ownership Accumulation Score) finder de aktier, der bliver mest købt af fonde. Det er resultatet af en sofistikeret, multi-faktor kvantitativ model, der identificerer virksomheder med de højeste niveauer af institutionel akkumulering. Scoringsmodellen bruger en kombination af den samlede stigning i oplyste ejere, ændringerne i porteføljeallokeringer i disse ejere og andre målinger. Tallet går fra 0 til 100, hvor højere tal indikerer et højere niveau af akkumulering for sine jævnaldrende, og 50 er gennemsnittet.
Opdateringsfrekvens: Dagligt
Se Ownership Explorer, som giver en liste over højest rangerende virksomheder.
AI+ Ask Fintel’s AI assistant about Strategy Inc.
Select a question to share a public post with an AI-crafted answer.
Thinking of good questions…
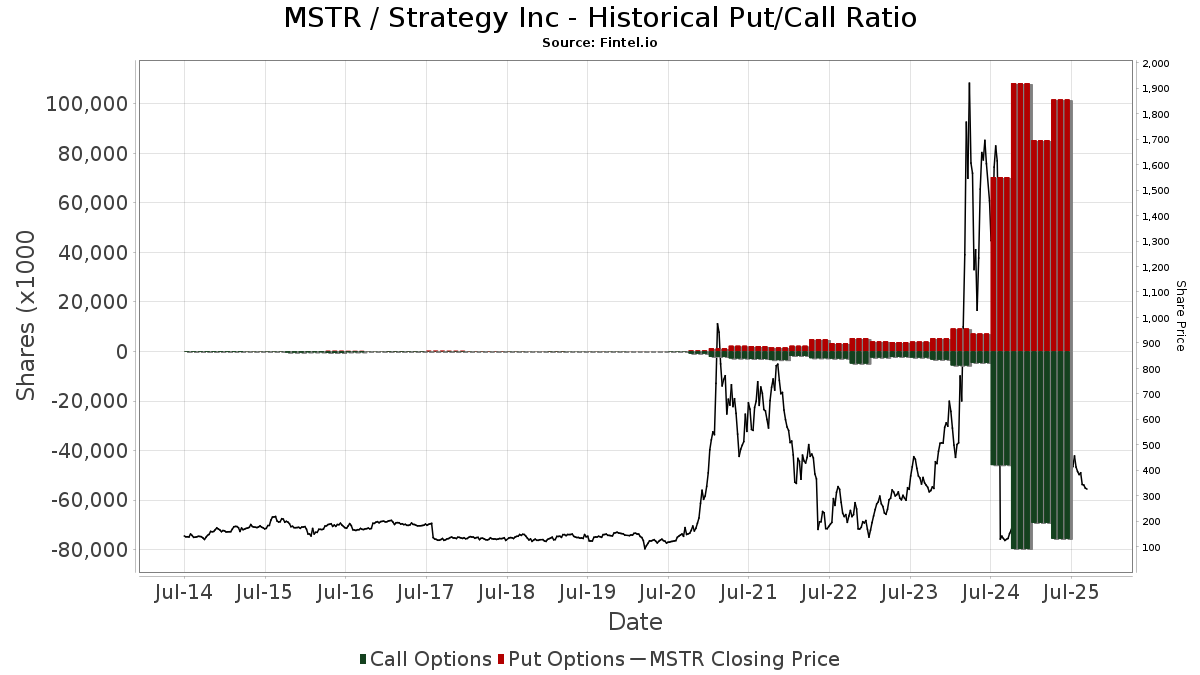
Institutionel Put/Call-forhold
Ud over at indberette standardaktie- og gældsudstedelser skal institutter med mere end 100 mill. aktiver under forvaltning også oplyse deres put- og call-optionsbeholdninger. Da salgsoptioner generelt indikerer negativ stemning, og købsoptioner indikerer positiv stemning, kan vi få en fornemmelse af den overordnede institutionelle stemning ved at plotte forholdet mellem put og kald. Diagrammet til højre viser det historiske put/call-forhold for dette instrument.
Brug af Put/Call Ratio som en indikator for investorernes stemning overvinder en af de vigtigste mangler ved at bruge totalt institutionelt ejerskab, som er, at en betydelig mængde af aktiver under forvaltning investeres passivt for at spore indekser. Passivt forvaltede fonde køber typisk ikke optioner, så indikatoren for put/call-forholdet følger mere nøje følelsen af aktivt forvaltede fonde.
13D/G-arkivering
Vi præsenterer 13D/G ansøgninger separat fra 13F ansøgninger på grund af den forskellige behandling af SEC. 13D/G-ansøgninger kan indgives af grupper af investorer (med én ledende), hvorimod 13F-ansøgninger ikke kan. Dette resulterer i situationer, hvor en investor kan indsende en 13D/G, der rapporterer én værdi for de samlede aktier (der repræsenterer alle de aktier, der ejes af investorgruppen), men derefter indsender en 13F, der rapporterer en anden værdi for de samlede aktier (der udelukkende repræsenterer deres egne) ejendomsret). Det betyder, at aktieejerskab af 13D/G-arkiver og 13F-arkiveringer ofte ikke er direkte sammenlignelige, så vi præsenterer dem separat.
Bemærk: Fra den 16. maj 2021 viser vi ikke længere ejere, der ikke har indsendt en 13D/G inden for det seneste år. Tidligere viste vi den fulde historie af 13D/G-arkiver. Generelt skal enheder, der er forpligtet til at indgive 13D/G-ansøgninger, indgive mindst årligt, før de indsender en afsluttende ansøgning. Dog forlader fonde nogle gange positioner uden at indsende en afsluttende ansøgning (dvs. de afvikler), så visning af den fulde historie resulterede nogle gange i forvirring om det nuværende ejerskab. For at undgå forvirring viser vi nu kun 'aktuelle' ejere - det vil sige - ejere, der har anmeldt inden for det seneste år.
Upgrade to unlock premium data.
| Fil dato | Form | Investor | Forrige Aktier |
Seneste Aktier |
Δ Aktier (Procent) |
Ejendomsret (Procent) |
Δ Ejerskab (Procent) |
|
|---|---|---|---|---|---|---|---|---|
| 2026-02-13 | Capital International Investors | 12,674,903 | 20,869,464 | 64.65 | 7.80 | 39.29 | ||
| 2026-02-11 | JANE STREET GROUP, LLC | 16,778,408 | 19,501,420 | 16.23 | 7.30 | 15.87 | ||
| 2026-01-30 | VANGUARD GROUP INC | 18,539,756 | 24,062,886 | 29.79 | 8.98 | 25.95 | ||
| 2025-11-13 | SUSQUEHANNA SECURITIES, LLC | 13,188,464 | 12,872,539 | -2.40 | 4.80 | -5.88 | ||
| 2025-04-17 | BlackRock, Inc. | 9,477,813 | 14,193,525 | 49.76 | 5.80 | 11.54 |
13F og NPORT arkivering
Detaljer om 13F-arkivering er gratis. Detaljer om NP-ansøgninger kræver et premium-medlemskab. Grønne rækker angiver nye positioner. Røde rækker angiver lukkede positioner. Klik på linket ikon for at se den fulde transaktionshistorik.
Opgrader
for at låse premium-data op og eksportere til Excel ![]() .
.
Important Note
In an effort to reduce load times for our mobile users, we are testing some ways to deliver lighter pages.
In this first test, we will deliver only the most recent 750 transactions (out of 1677 for this stock). If you are interested in loading *all* the transactions for this company, click the "load all" button below. This is just a test and if you don't like it, please let us know by submitting some gentle feedback via the link at the bottom of this page.
Load All| Fil dato | Kilde | Investor | Type | Gennemsnitlig pris (Øst) |
Aktier | Δ Aktier (%) |
Rapporteret Værdi ($1000) |
Δ Værdi (%) |
Port Alloc (%) |
|
|---|---|---|---|---|---|---|---|---|---|---|
| 2026-01-20 | 13F | Princeton Global Asset Management LLC | 0 | -100,00 | 0 | -100,00 | ||||
| 2026-04-08 | 13F | Red Reef Advisors Llc | 2.440 | 371 | ||||||
| 2026-04-15 | 13F | Nations Financial Group Inc, /ia/ /adv | 4.096 | -81,54 | 511 | -84,84 | ||||
| 2025-11-13 | 13F | Glenmede Investment Management, LP | 3.210 | -1,56 | 1.034 | -21,55 | ||||
| 2026-03-16 | 13F | Osbon Capital Management Llc | 60 | 9 | ||||||
| 2025-11-12 | 13F | Montag A & Associates Inc | 0 | -100,00 | 0 | -100,00 | ||||
| 2026-02-17 | 13F | Angeles Wealth Management, Llc | 0 | -100,00 | 0 | -100,00 | ||||
| 2026-02-10 | 13F | Verus Capital Partners, Llc | 8.072 | 7,63 | 1.227 | -49,25 | ||||
| 2026-02-05 | 13F | RiverFront Investment Group, LLC | 3.010 | -65,83 | 457 | -83,90 | ||||
| 2026-01-30 | 13F | Turning Point Benefit Group, Inc. | 25 | 13,64 | 4 | -57,14 | ||||
| 2026-02-06 | 13F | Cullen/frost Bankers, Inc. | 46 | 155,56 | 7 | 20,00 | ||||
| 2026-02-11 | 13F | T3 Companies, LLC | 2.553 | 388 | ||||||
| 2026-01-30 | 13F | American Capital Advisory, LLC | 30 | 3,45 | 5 | -55,56 | ||||
| 2026-02-23 | 13F | Wealth Preservation Advisors, LLC | 1 | 0 | ||||||
| 2026-02-17 | 13F | Old Mission Capital Llc | Put | 849.800 | -59,61 | 59.030 | -25,61 | |||
| 2026-01-23 | 13F | KG&L Capital Management,LLC | 3.348 | -42,52 | 509 | -72,92 | ||||
| 2026-01-22 | 13F | Glass Jacobson Investment Advisors llc | 1.079 | 0,00 | 164 | -53,03 | ||||
| 2025-11-14 | 13F | Financial Sense Advisors, Inc. | 0 | -100,00 | 0 | -100,00 | ||||
| 2026-04-14 | 13F | Drive Wealth Management, Llc | 0 | -100,00 | 0 | |||||
| 2026-01-29 | 13F | Concurrent Investment Advisors, LLC | 9.566 | 49,91 | 1.454 | -29,29 | ||||
| 2026-04-09 | 13F | Turner Capital Investments, LLC | 4.206 | 421 | ||||||
| 2026-02-13 | 13F | Rafferty Asset Management, LLC | 74.433 | 109,60 | 11.310 | -1,15 | ||||
| 2026-02-17 | 13F | MIRAE ASSET GLOBAL ETFS HOLDINGS Ltd. | 142.403 | -1,55 | 21.642 | -53,57 | ||||
| 2026-04-20 | 13F | Dagco, Inc. | 0 | -100,00 | 0 | |||||
| 2026-02-06 | 13F | Twin Capital Management Inc | 2.764 | 420 | ||||||
| 2026-02-17 | 13F | Atom Investors LP | 5.302 | 806 | ||||||
| 2026-02-06 | 13F | Principle Wealth Partners Llc | 4.763 | 392,55 | 724 | 132,48 | ||||
| 2026-02-10 | 13F | EagleClaw Capital Managment, LLC | 24.425 | -2,30 | 3.711 | -53,93 | ||||
| 2026-04-17 | 13F | Anchyra Partners Llc | 2.762 | 9,04 | 345 | -10,42 | ||||
| 2026-01-30 | 13F | Vivid Wealth Management, LLC | 13.984 | 82,87 | 2.125 | -13,76 | ||||
| 2026-04-06 | 13F | GAMMA Investing LLC | 1.831 | 194,37 | 229 | 142,55 | ||||
| 2026-02-17 | 13F | Old Mission Capital Llc | 494.536 | 75.198 | ||||||
| 2026-02-11 | 13F | Capital World Investors | 2.911.311 | 127,60 | 442.379 | 7,33 | ||||
| 2026-01-07 | 13F | American Asset Management Inc. | 0 | -100,00 | 0 | -100,00 | ||||
| 2026-02-10 | 13F | IAG Wealth Partners, LLC | 302 | 147,54 | 46 | 15,38 | ||||
| 2026-02-10 | 13F | Eurizon Capital SGR S.p.A. | 27.856 | 4.237 | ||||||
| 2026-02-13 | 13F | Alchemi Wealth, LLC | 8.292 | 1.260 | ||||||
| 2026-02-17 | 13F | Balyasny Asset Management Llc | 27.056 | 6,34 | 4.111 | -49,85 | ||||
| 2026-01-26 | 13F | PFG Investments, LLC | 6.317 | 98,65 | 960 | -6,35 | ||||
| 2026-02-17 | 13F | Riverview Capital Advisers, LLC | 1.908 | 0,00 | 290 | -52,93 | ||||
| 2026-01-30 | 13F | Oakworth Capital, Inc. | 9 | 0,00 | 1 | -50,00 | ||||
| 2026-02-12 | 13F | Wealthspire Advisors, LLC | 1.714 | 35,60 | 260 | -36,12 | ||||
| 2026-02-17 | 13F/A | Laurion Capital Management LP | Put | 0 | -100,00 | 0 | -100,00 | |||
| 2026-02-13 | 13F | Prudential Financial Inc | 13.656 | -35,49 | 2.420 | -64,53 | ||||
| 2026-02-12 | 13F | Skopos Labs, Inc. | 0 | -100,00 | 0 | |||||
| 2026-02-09 | 13F | Fidelis Capital Partners, LLC | 0 | -100,00 | 0 | |||||
| 2026-01-20 | 13F | Partners Wealth Management, Llc | 7.059 | -0,28 | 1.073 | -52,98 | ||||
| 2026-01-12 | 13F | Wealth Management Partners, LLC | 0 | -100,00 | 0 | -100,00 | ||||
| 2026-02-17 | 13F | Balyasny Asset Management Llc | Call | 57.300 | 122,09 | 8.707 | 4,73 | |||
| 2026-02-17 | 13F | Balyasny Asset Management Llc | Put | 77.200 | 51,67 | 11.731 | -28,48 | |||
| 2026-01-26 | 13F | AE Wealth Management LLC | 21.107 | 626,83 | 3.207 | 242,99 | ||||
| 2026-02-13 | 13F | Kestra Advisory Services, LLC | Call | 0 | -100,00 | 0 | ||||
| 2026-02-17 | 13F/A | Laurion Capital Management LP | Call | 0 | -100,00 | 0 | -100,00 | |||
| 2026-02-17 | 13F | Wealth Watch Advisors, INC | 0 | -100,00 | 0 | -100,00 | ||||
| 2025-11-12 | 13F | Roundview Capital LLC | 0 | -100,00 | 0 | -100,00 | ||||
| 2026-04-17 | 13F | Brown, Lisle/cummings, Inc. | 2 | 0,00 | 0 | |||||
| 2026-02-02 | 13F | Breakwater Investment Management | 3 | 0 | ||||||
| 2026-04-07 | 13F | Park Avenue Securities Llc | 2.722 | -20,01 | 0 | |||||
| 2026-02-06 | 13F | Frisch Financial Group, Inc. | 2.000 | 0,00 | 304 | -52,95 | ||||
| 2026-04-15 | 13F | Exchange Traded Concepts, Llc | Call | 382.200 | -22,36 | 47.699 | -36,24 | |||
| 2026-04-15 | 13F | Exchange Traded Concepts, Llc | 262.066 | 8,22 | 32.706 | -11,12 | ||||
| 2026-02-11 | 13F | Manchester Capital Management LLC | 43 | 7 | ||||||
| 2026-02-09 | 13F | GeoSphere Capital Management | Put | 104.400 | 15.864 | |||||
| 2026-01-30 | 13F | R Squared Ltd | 1.480 | 225 | ||||||
| 2026-02-17 | 13F | DZ BANK AG Deutsche Zentral Genossenschafts Bank, Frankfurt am Main | 0 | -100,00 | 0 | |||||
| 2026-02-05 | 13F | Duncan Williams Asset Management, LLC | 0 | -100,00 | 0 | |||||
| 2026-01-29 | 13F | Sanctuary Advisors, LLC | 15.596 | -7,51 | 2.370 | -56,40 | ||||
| 2026-01-29 | 13F | Sanctuary Advisors, LLC | Call | 17.100 | 61 | |||||
| 2026-02-12 | 13F | Strive Asset Management, LLC | 0 | -100,00 | 0 | |||||
| 2026-01-07 | 13F | Lake Street Financial Llc | 0 | -100,00 | 0 | -100,00 | ||||
| 2026-02-03 | 13F | Black Diamond Financial, LLC | 0 | -100,00 | 0 | |||||
| 2026-01-16 | 13F | Crew Capital Management, Ltd. | 0 | -100,00 | 0 | -100,00 | ||||
| 2026-01-30 | 13F | Strategic Blueprint, LLC | 1.755 | 26,17 | 267 | -40,62 | ||||
| 2026-01-21 | 13F | Sound Income Strategies, LLC | 144 | 132,26 | 25 | 31,58 | ||||
| 2026-02-17 | 13F | Aqr Capital Management Llc | 18.519 | 47,92 | 2.814 | -30,24 | ||||
| 2026-02-12 | 13F | ICICI Prudential Asset Management Co Ltd | 4.296 | 6,00 | 653 | -50,04 | ||||
| 2026-02-09 | 13F | Catalyst Funds Management Pty Ltd | 0 | -100,00 | 0 | |||||
| 2026-01-16 | 13F | Matauro, Llc | 0 | -100,00 | 0 | -100,00 | ||||
| 2026-02-17 | 13F | Gladstone Institutional Advisory LLC | 6.629 | -10,77 | 1.007 | -57,92 | ||||
| 2026-01-28 | 13F | CAPROCK Group, Inc. | 15.279 | -19,27 | 2.322 | -63,33 | ||||
| 2026-02-13 | 13F | Kestra Advisory Services, LLC | 0 | -100,00 | 0 | |||||
| 2026-01-30 | 13F | Bogart Wealth, LLC | 370 | 0,27 | 56 | -52,54 | ||||
| 2026-02-17 | 13F | Core Wealth Partners LLC | Call | 200 | 5 | |||||
| 2026-02-12 | 13F | Raiffeisen Bank International AG | 3.238 | 0,00 | 504 | -52,37 | ||||
| 2026-02-17 | 13F | Core Wealth Partners LLC | 6.242 | -2,01 | 948 | -53,80 | ||||
| 2025-11-14 | 13F | Strategic Wealth Partners, Ltd. | 451 | -47,80 | 145 | -58,45 | ||||
| 2026-02-17 | 13F | LMR Partners LLP | Put | 3.313.000 | 1,37 | 503.410 | -52,19 | |||
| 2026-02-17 | 13F | LMR Partners LLP | 414.952 | 24,57 | 63.052 | -41,26 | ||||
| 2026-02-20 | 13F | Sunbelt Securities, Inc. | 2.094 | 55,23 | 318 | -26,73 | ||||
| 2026-02-12 | 13F | Ci Investments Inc. | 2.212 | 23,85 | 336 | |||||
| 2026-02-13 | 13F | Change Path, LLC | 4.310 | -1,15 | 655 | -53,42 | ||||
| 2026-02-13 | 13F | Korea Investment CORP | 134.263 | 12,90 | 20.401 | -46,76 | ||||
| 2026-02-17 | 13F | LMR Partners LLP | Call | 815.900 | 62,47 | 123.976 | -23,38 | |||
| 2026-01-23 | 13F | Avion Wealth | 31 | -39,22 | 0 | |||||
| 2026-01-30 | 13F | Torren Management, LLC | 8 | 1 | ||||||
| 2026-02-17 | 13F | CHICAGO TRUST Co NA | 0 | -100,00 | 0 | |||||
| 2026-02-17 | 13F | Tower Research Capital LLC (TRC) | 18.475 | 311,29 | 2.807 | 93,99 | ||||
| 2026-02-13 | 13F | Sculptor Capital LP | Put | 192.700 | 0,00 | 29.281 | -52,84 | |||
| 2026-02-13 | 13F | Sculptor Capital LP | 0 | 0 | ||||||
| 2026-02-17 | 13F | Public Employees Retirement System Of Ohio | 106.910 | 1,37 | 16.245 | -52,20 | ||||
| 2025-11-12 | 13F | HAP Trading, LLC | Put | 15.600 | 378 | |||||
| 2025-11-13 | 13F | Lord, Abbett & Co. Llc | Call | 0 | -100,00 | 0 | -100,00 | |||
| 2025-11-12 | 13F | HAP Trading, LLC | Call | 40.300 | 2.865 | |||||
| 2026-02-05 | 13F | Littlejohn Financial Services, Inc. | 0 | -100,00 | 0 | |||||
| 2026-02-11 | 13F | MCF Advisors LLC | 539 | 0,00 | 82 | -53,18 | ||||
| 2026-02-10 | 13F | Rothschild Investment Llc | 2.552 | -0,08 | 388 | -52,92 | ||||
| 2026-02-13 | 13F | Fieldview Capital Management, LLC | 0 | -100,00 | 0 | |||||
| 2026-02-13 | 13F | Brown Advisory Inc | 1.857 | 5,27 | 282 | -50,35 | ||||
| 2026-02-17 | 13F | Cardiff Park Advisors, Llc | 2.094 | 174,08 | 318 | 29,27 | ||||
| 2026-01-27 | 13F | Regions Financial Corp | 1.502 | 41,43 | 228 | -33,33 | ||||
| 2025-11-14 | 13F | Wetherby Asset Management Inc | 1.902 | -6,63 | 613 | -25,64 | ||||
| 2026-02-11 | 13F | Convergence Financial, LLC | 3.260 | 0,00 | 495 | -52,86 | ||||
| 2026-04-10 | 13F | Centurion Wealth Management LLC | Call | 400 | 50 | |||||
| 2026-02-04 | 13F | HighPoint Advisor Group LLC | 5.222 | 0,79 | 793 | -52,49 | ||||
| 2026-04-15 | 13F | Gf Fund Management Co. Ltd. | 54.862 | -2,89 | 6.847 | -20,25 | ||||
| 2026-04-10 | 13F | Centurion Wealth Management LLC | 1.615 | 0,00 | 202 | -17,96 | ||||
| 2026-04-16 | 13F | TB Alternative Assets Ltd. | 0 | -100,00 | 0 | |||||
| 2026-01-23 | 13F | Sumitomo Mitsui Trust Holdings, Inc. | 606.629 | -2,78 | 92.177 | -54,15 | ||||
| 2026-02-13 | 13F | Boreal Capital Management LLC | 0 | -100,00 | 0 | |||||
| 2026-04-07 | 13F | Investment Partners Asset Management, Inc. | 2.561 | 0,08 | 320 | -17,78 | ||||
| 2025-11-12 | 13F | West Family Investments, Inc. | 1.162 | 19,30 | 374 | -4,83 | ||||
| 2026-02-12 | 13F | Summit Financial, LLC | 50.712 | 57,02 | 7.706 | -25,96 | ||||
| 2025-11-20 | 13F | Maven Securities LTD | Put | 0 | -100,00 | 0 | -100,00 | |||
| 2026-01-29 | 13F | IMC-Chicago, LLC | Put | 9.073.400 | -4,25 | 1.378.703 | -54,85 | |||
| 2026-01-29 | 13F | IMC-Chicago, LLC | Call | 12.478.000 | -4,51 | 1.896.032 | -54,97 | |||
| 2026-02-14 | 13F | Militia Capital Partners, LP | 2.560 | 389 | ||||||
| 2026-01-21 | 13F | Azzad Asset Management Inc /adv | 0 | -100,00 | 0 | -100,00 | ||||
| 2026-02-12 | 13F | CIBC Private Wealth Group, LLC | 12.334 | 3,30 | 1.874 | -51,29 | ||||
| 2026-04-07 | 13F | Signaturefd, Llc | 4.758 | 100,00 | 594 | 64,27 | ||||
| 2026-02-17 | 13F | Tcw Group Inc | 4.212 | 640 | ||||||
| 2026-03-04 | 13F | Rehmann Capital Advisory Group | 0 | -100,00 | 0 | |||||
| 2026-02-11 | 13F | Rise Advisors, LLC | 0 | -100,00 | 0 | |||||
| 2026-02-10 | 13F | Quantbot Technologies LP | 0 | -100,00 | 0 | |||||
| 2026-02-13 | 13F | Sofos Investments, Inc. | 0 | -100,00 | 0 | -100,00 | ||||
| 2026-02-06 | 13F | Gsa Capital Partners Llp | 2.706 | -1,02 | 0 | |||||
| 2026-02-13 | 13F | State Street Corp | 6.127.301 | 2,31 | 931.043 | -51,75 | ||||
| 2026-02-13 | 13F | Blueshift Asset Management, LLC | 0 | -100,00 | 0 | |||||
| 2026-01-27 | 13F | Vista Finance, Llc | 0 | -100,00 | 0 | -100,00 | ||||
| 2025-11-14 | 13F | Axa S.a. | 0 | -100,00 | 0 | -100,00 | ||||
| 2026-02-12 | 13F | Bank Of Montreal /can/ | Call | 105.000 | 22.884 | |||||
| 2026-02-12 | 13F | Bank Of Montreal /can/ | Put | 1.068.000 | 18,98 | 232.760 | -19,52 | |||
| 2026-02-13 | 13F | Mariner, LLC | 101.807 | -13,09 | 15.459 | -59,04 | ||||
| 2026-02-12 | 13F | Bank Of Montreal /can/ | 1.086.627 | -16,30 | 236.819 | -43,38 | ||||
| 2025-12-01 | 13F/A | Polar Asset Management Partners Inc. | Call | 0 | -100,00 | 0 | -100,00 | |||
| 2026-04-16 | 13F | SG Americas Securities, LLC | 558.805 | -23,32 | 70 | -37,27 | ||||
| 2026-01-29 | 13F | Quest 10 Wealth Builders, Inc. | 1 | 0,00 | 0 | |||||
| 2026-02-17 | 13F | EFG International AG | 2.307 | 351 | ||||||
| 2026-02-17 | 13F | Schonfeld Strategic Advisors LLC | Call | 0 | -100,00 | 0 | ||||
| 2026-04-14 | 13F | Prospera Financial Services Inc | 11.977 | -11,53 | 1.495 | -27,33 | ||||
| 2026-04-15 | 13F | Financial Management Professionals, Inc. | 105 | 10,53 | 13 | -7,14 | ||||
| 2026-01-26 | 13F | KBC Group NV | 311.624 | 39,66 | 47 | -33,80 | ||||
| 2026-02-17 | 13F | Modern Wealth Management, LLC | 2.423 | 0,79 | 368 | -52,45 | ||||
| 2026-04-09 | 13F | Nelson, Van Denburg & Campbell Wealth Management Group, LLC | 10.007 | 6,03 | 1.249 | -12,97 | ||||
| 2026-02-17 | 13F | Point72 Asset Management, L.P. | 0 | -100,00 | 0 | -100,00 | ||||
| 2026-02-18 | 13F | Beacon Pointe Advisors, LLC | 4.989 | 9,26 | 758 | -48,47 | ||||
| 2025-10-30 | 13F | SAM Advisors, LLC | 0 | -100,00 | 0 | -100,00 | ||||
| 2026-01-15 | 13F | Royal Fund Management, LLC | 2.077 | 5,49 | 316 | -50,32 | ||||
| 2026-02-04 | 13F | Virginia Retirement Systems Et Al | 31.880 | 29,07 | 4.844 | -39,13 | ||||
| 2026-04-17 | 13F | Krilogy Financial LLC | 2.828 | 15,66 | 421 | 7,40 | ||||
| 2026-01-16 | 13F | Hopwood Financial Services, Inc. | 0 | -100,00 | 0 | -100,00 | ||||
| 2026-02-02 | 13F | Caisse Des Depots Et Consignations | 0 | -100,00 | 0 | |||||
| 2026-04-02 | 13F | Byrne Asset Management LLC | 0 | -100,00 | 0 | |||||
| 2026-01-27 | 13F | WealthCollab, LLC | 45 | 7 | ||||||
| 2026-02-12 | 13F | Great Valley Advisor Group, Inc. | 2.080 | -4,10 | 317 | -54,79 | ||||
| 2026-04-06 | 13F | Miller Global Investments, LLC | 28 | 0,00 | 3 | -25,00 | ||||
| 2026-01-29 | 13F | State Of Michigan Retirement System | 5.800 | 881 | ||||||
| 2025-11-13 | 13F | SCS Capital Management LLC | 0 | -100,00 | 0 | -100,00 | ||||
| 2026-02-06 | 13F | Clientfirst Wealth Management, LLC | 1.900 | 289 | ||||||
| 2026-02-11 | 13F | Simplex Trading, Llc | 0 | -100,00 | 0 | -100,00 | ||||
| 2026-04-13 | 13F | Pettinga Financial Advisors, LLC | 2.103 | 262 | ||||||
| 2026-01-14 | 13F | Woodward Diversified Capital, Llc | 3.999 | 41,96 | 608 | -33,08 | ||||
| 2026-02-05 | 13F | Cambridge Investment Research Advisors, Inc. | 110.037 | 9,43 | 17 | -50,00 | ||||
| 2026-02-17 | 13F | Old Mission Capital Llc | Call | 1.292.200 | 11,68 | 2.109 | -98,38 | |||
| 2026-01-29 | 13F | Wise Wealth Partners | 0 | -100,00 | 0 | |||||
| 2026-02-18 | 13F | Caitlin John, LLC | 15 | -96,54 | 2 | -98,56 | ||||
| 2026-04-08 | 13F | Wealth Enhancement Advisory Services, Llc | 15.987 | -60,53 | 1.916 | -69,98 | ||||
| 2026-01-30 | 13F | North Star Investment Management Corp. | 306 | 2,00 | 46 | -52,08 | ||||
| 2025-11-14 | 13F | Cubist Systematic Strategies, LLC | Put | 34.800 | -49,42 | 11.213 | -59,69 | |||
| 2026-04-07 | 13F | CoreCap Advisors, LLC | 2.921 | 4,36 | 365 | -14,35 | ||||
| 2025-11-14 | 13F | Cubist Systematic Strategies, LLC | Call | 19.800 | -88,15 | 6.380 | -90,56 | |||
| 2026-01-21 | 13F | Yousif Capital Management, Llc | 3.514 | 2,45 | 563 | -49,05 | ||||
| 2026-02-13 | 13F | Panagora Asset Management Inc | 2.300 | 349 | ||||||
| 2025-11-20 | 13F | Maven Securities LTD | Call | 0 | -100,00 | 0 | -100,00 | |||
| 2025-11-14 | 13F | Cubist Systematic Strategies, LLC | 56.336 | 547,39 | 18.152 | 416,12 | ||||
| 2026-02-13 | 13F | Squarepoint Ops LLC | 23.696 | 3.601 | ||||||
| 2026-02-17 | 13F | Advisor Group Holdings, Inc. | 29.399 | -73,59 | 4.467 | -87,72 | ||||
| 2026-02-13 | 13F | American Century Companies Inc | 39.216 | 7,58 | 5.959 | -49,27 | ||||
| 2026-02-04 | 13F | Dogwood Wealth Management LLC | 190 | 280,00 | 29 | 75,00 | ||||
| 2026-02-17 | 13F | Advisor Group Holdings, Inc. | Call | 2.002 | 66.633,33 | 304 | 2.230,77 | |||
| 2026-04-21 | 13F | GHP Investment Advisors, Inc. | 9 | 1 | ||||||
| 2026-02-02 | 13F | Qrg Capital Management, Inc. | 30.923 | -24,00 | 4.699 | -64,16 | ||||
| 2026-02-06 | 13F | Associated Banc-corp | 0 | -100,00 | 0 | |||||
| 2026-02-13 | 13F | Squarepoint Ops LLC | Call | 440.700 | 99,32 | 66.964 | -6,00 | |||
| 2026-02-13 | 13F | Squarepoint Ops LLC | Put | 294.200 | -22,52 | 44.704 | -63,46 | |||
| 2026-02-09 | 13F | Integrity Alliance, Llc. | 2.850 | -28,54 | 433 | -66,28 | ||||
| 2026-04-10 | 13F | Quaker Wealth Management, LLC | 208 | 1,46 | 26 | -19,35 | ||||
| 2026-02-12 | 13F | Longitude (Cayman) Ltd. | 0 | -100,00 | 0 | |||||
| 2026-02-17 | 13F | DV Trading LLC | 2.626 | 399 | ||||||
| 2026-01-28 | 13F | United Asset Strategies, Inc. | 4.005 | 3,09 | 609 | -51,40 | ||||
| 2026-02-04 | 13F | Bridgewealth Advisory Group, LLC | 0 | -100,00 | 0 | |||||
| 2026-02-10 | 13F | Exit Wealth Advisors, LLC. | 0 | -100,00 | 0 | |||||
| 2026-01-12 | 13F | Howard Financial Services, Ltd. | 0 | -100,00 | 0 | -100,00 | ||||
| 2026-04-17 | 13F | CENTRAL TRUST Co | 3.962 | -1,57 | 494 | -19,15 | ||||
| 2026-02-06 | 13F | Addison Advisors LLC | 26 | 8,33 | 4 | -57,14 | ||||
| 2026-02-09 | 13F | Integrity Alliance, Llc. | Call | 400 | 61 | |||||
| 2025-10-23 | 13F | Capital Investment Advisors, LLC | 0 | -100,00 | 0 | -100,00 | ||||
| 2026-04-13 | 13F | Bank of New Hampshire | 50 | 0,00 | 6 | -14,29 | ||||
| 2026-01-09 | 13F | Diversified Trust Co | 0 | -100,00 | 0 | -100,00 | ||||
| 2026-02-09 | 13F | Dillon & Associates Inc | 0 | -100,00 | 0 | |||||
| 2026-02-10 | 13F | Calton & Associates, Inc. | 0 | -100,00 | 0 | |||||
| 2026-02-10 | 13F | Westpac Banking Corp | 656 | 100 | ||||||
| 2026-02-19 | 13F | Atomi Financial Group, Inc. | 1.561 | -18,61 | 237 | -61,59 | ||||
| 2026-02-17 | 13F | Voloridge Investment Management, Llc | 60.378 | -77,35 | 9.174 | -89,32 | ||||
| 2026-04-21 | 13F | Maseco Llp | 0 | -100,00 | 0 | |||||
| 2026-02-12 | 13F | Nuveen, LLC | 481.232 | 0,69 | 73.086 | -52,54 | ||||
| 2026-02-13 | 13F | Patient Capital Management, LLC | 0 | -100,00 | 0 | -100,00 | ||||
| 2026-04-13 | 13F | Lauer Wealth, LLC | 4.046 | 39,47 | 519 | 7,23 | ||||
| 2026-02-13 | 13F | Invictus Private Wealth, Llc | 0 | -100,00 | 0 | |||||
| 2026-02-13 | 13F | Acumen Wealth Advisors, LLC | 3 | 0 | ||||||
| 2026-04-15 | 13F | Client 1st Advisory Group, Llc | 3.911 | 6,28 | 488 | -12,70 | ||||
| 2026-01-21 | 13F | Walkner Condon Financial Advisors LLC | 0 | -100,00 | 0 | |||||
| 2026-01-29 | 13F | Pictet Asset Management Holding SA | 106.340 | 3,67 | 16.158 | -51,11 | ||||
| 2026-02-03 | 13F | Cheviot Value Management, LLC | 120 | 0,00 | 19 | -44,12 | ||||
| 2025-11-10 | 13F | Dana Investment Advisors, Inc. | 0 | -100,00 | 0 | -100,00 | ||||
| 2026-01-26 | 13F | Means Investment Co., Inc. | 3.055 | -3,57 | 464 | -54,51 | ||||
| 2026-02-05 | 13F | High Note Wealth, LLC | 11 | 450,00 | 2 | |||||
| 2026-02-12 | 13F | Intesa Sanpaolo Wealth Management | 540 | 82 | ||||||
| 2025-11-12 | 13F | Sprott Inc. | 0 | -100,00 | 0 | -100,00 | ||||
| 2026-04-15 | 13F | NorthAvenue LLC | 0 | -100,00 | 0 | |||||
| 2026-02-17 | 13F | Wiley Bros.-aintree Capital, Llc | 5.899 | 6,44 | 895 | -49,86 | ||||
| 2026-02-06 | 13F | Americana Partners, LLC | 2.372 | 360 | ||||||
| 2026-01-27 | 13F | Lodestar Private Asset Management Llc | 1.888 | 0,00 | 287 | -52,96 | ||||
| 2026-01-28 | 13F | Walleye Partners, LLC | 3.171 | 482 | ||||||
| 2026-02-17 | 13F | Evergreen Wealth Solutions, LLC | 5.143 | -5,51 | 781 | -55,45 | ||||
| 2026-02-03 | 13F | Crossmark Global Holdings, Inc. | 2.580 | 25,36 | 392 | -40,87 | ||||
| 2026-02-09 | 13F | Frazier Financial Advisors, LLC | 45 | 0,00 | 7 | -57,14 | ||||
| 2025-10-22 | 13F | Grandview Asset Management LLC | 0 | -100,00 | 0 | |||||
| 2026-01-21 | 13F | MBL Wealth, LLC | 6.514 | 137,48 | 990 | 12,00 | ||||
| 2026-02-09 | 13F | Harbour Investments, Inc. | 2.906 | -20,95 | 442 | -62,75 | ||||
| 2026-01-27 | 13F | Prakash Investment Advisors Llc | 4.300 | 126,32 | 653 | 6,70 | ||||
| 2026-04-16 | 13F | True Vision MN LLC | 3.078 | 15,24 | 384 | -5,19 | ||||
| 2025-11-14 | 13F | Jain Global LLC | 0 | -100,00 | 0 | -100,00 | ||||
| 2026-04-13 | 13F | Hm Payson & Co | 50 | 0,00 | 6 | -14,29 | ||||
| 2026-01-23 | 13F | Diversify Advisory Services, LLC | 2.244 | 29,71 | 390 | -14,88 | ||||
| 2026-02-17 | 13F | Keebeck Wealth Management, LLC | 5.227 | -2,34 | 794 | -53,94 | ||||
| 2026-02-17 | 13F | Parallax Volatility Advisers, L.P. | 39.735 | 6.038 | ||||||
| 2026-02-13 | 13F | DeepCurrents Investment Group LLC | Put | 2.000 | 250,88 | 30.390 | 65,48 | |||
| 2026-02-17 | 13F | Parallax Volatility Advisers, L.P. | Put | 1.386.900 | 9,03 | 210.739 | -48,58 | |||
| 2026-02-17 | 13F | Woodline Partners LP | 4.811 | 731 | ||||||
| 2026-02-11 | 13F | Vestor Capital, Llc | 1.091 | 208,19 | 0 | |||||
| 2026-02-12 | 13F | Marex Group plc | 2.934.332 | 40,88 | 445.872 | -33,57 | ||||
| 2026-02-17 | 13F | Parallax Volatility Advisers, L.P. | Call | 543.300 | 142,11 | 82.554 | 14,18 | |||
| 2026-01-23 | 13F | Steigerwald, Gordon & Koch Inc. | 48 | 0,00 | 7 | -53,33 | ||||
| 2026-01-29 | 13F | China Universal Asset Management Co., Ltd. | 7.576 | 8,74 | 1.151 | -48,71 | ||||
| 2025-10-27 | 13F | Gwn Securities Inc. | 0 | -100,00 | 0 | -100,00 | ||||
| 2026-01-28 | 13F | Rockingstone Advisors LLC | 0 | -100,00 | 0 | -100,00 | ||||
| 2026-02-17 | 13F | Schonfeld Strategic Advisors LLC | Put | 0 | -100,00 | 0 | ||||
| 2026-01-27 | 13F | BigSur Wealth Management LLC | 500 | 76 | ||||||
| 2026-02-13 | 13F | Banco Santander, S.A. | 3.547 | 539 | ||||||
| 2026-02-17 | 13F | Nomura Holdings Inc | 179.275 | 65,45 | 27.241 | -21,98 | ||||
| 2026-02-17 | 13F | Nomura Holdings Inc | Call | 52.600 | 1.361,11 | 7.993 | 589,56 | |||
| 2026-02-17 | 13F | Nomura Holdings Inc | Put | 402.900 | -45,02 | 61.221 | -74,07 | |||
| 2026-02-10 | 13F | Nomura Asset Management Co Ltd | 92.463 | 5,53 | 14.050 | -50,23 | ||||
| 2025-11-14 | 13F | Idaho Trust Bank | 0 | -100,00 | 0 | -100,00 | ||||
| 2025-11-10 | 13F | Highbridge Capital Management Llc | Call | 0 | -100,00 | 0 | -100,00 | |||
| 2026-02-10 | 13F | IFG Advisory, LLC | 0 | -100,00 | 0 | |||||
| 2026-02-04 | 13F | Swiss Life Asset Management Ltd | 26.184 | -4,95 | 3.979 | -55,18 | ||||
| 2026-01-23 | 13F | Private Wealth Management Group, LLC | 117 | 15,84 | 18 | -46,87 | ||||
| 2026-02-06 | 13F | EverSource Wealth Advisors, LLC | 52.606 | 48,87 | 7.994 | -29,79 | ||||
| 2026-01-12 | 13F | Contravisory Investment Management, Inc. | 0 | -100,00 | 0 | -100,00 | ||||
| 2026-02-06 | 13F | Envestnet Portfolio Solutions, Inc. | 1.648 | -0,78 | 250 | -53,27 | ||||
| 2025-11-06 | 13F | Versor Investments LP | 0 | -100,00 | 0 | -100,00 | ||||
| 2026-02-12 | 13F | Penserra Capital Management LLC | 1.433 | 6,31 | 0 | |||||
| 2026-02-12 | 13F | StoneX Group Inc. | 3.316 | -75,66 | 504 | -88,54 | ||||
| 2026-02-10 | 13F | Peapack Gladstone Financial Corp | 3.370 | 10,31 | 1 | |||||
| 2026-01-12 | 13F | CVA Family Office, LLC | 158 | -20,20 | 24 | -61,90 | ||||
| 2026-02-17 | 13F | Northeast Financial Group, Inc. | 3.500 | -33,96 | 532 | -68,89 | ||||
| 2026-02-17 | 13F | Northeast Financial Group, Inc. | Put | 1.800 | 274 | |||||
| 2026-02-03 | 13F | International Assets Investment Management, Llc | 2.274 | 102,85 | 346 | -17,46 | ||||
| 2025-11-14 | 13F | Binnacle Investments Inc | 89 | 7,23 | 29 | -15,15 | ||||
| 2025-11-03 | 13F | Hollencrest Capital Management | Call | 0 | -100,00 | 0 | -100,00 | |||
| 2026-04-13 | 13F | Foster Group, Inc. | 1.659 | 207 | ||||||
| 2026-02-18 | 13F | EP Wealth Advisors, Inc. | 4.365 | 16,65 | 663 | -56,15 | ||||
| 2026-02-13 | 13F | Resources Investment Advisors, LLC. | 1.472 | -10,24 | 224 | -57,77 | ||||
| 2026-02-13 | 13F | Smartleaf Asset Management LLC | 1.329 | 13,40 | 207 | -46,07 | ||||
| 2025-11-21 | 13F/A | CIBC Bancorp USA Inc. | 19.023 | 6.129 | ||||||
| 2025-10-30 | 13F | Naples Global Advisors, Llc | 0 | -100,00 | 0 | -100,00 | ||||
| 2026-02-10 | 13F | Principia Wealth Advisory, LLC | 9 | -25,00 | 1 | -66,67 | ||||
| 2026-02-17 | 13F | Mercer Global Advisors Inc /adv | 62.024 | 5,51 | 9.320 | -50,68 | ||||
| 2026-02-12 | 13F | Quadrant Capital Group Llc | 54 | -19,40 | 8 | -61,90 | ||||
| 2026-01-30 | 13F | Sigma Planning Corp | 7.419 | -0,86 | 1.155 | -52,09 | ||||
| 2026-02-05 | 13F | Navalign, LLC | 20 | 3 | ||||||
| 2026-02-06 | 13F | Resona Asset Management Co.,Ltd. | 75.650 | -3,32 | 11.531 | -54,34 | ||||
| 2026-01-21 | 13F | Newbridge Financial Services Group, Inc. | 8.998 | -2,70 | 1.367 | -54,11 | ||||
| 2026-01-23 | 13F | Oxler Private Wealth LLC | 4.678 | -8,58 | 711 | -56,92 | ||||
| 2026-01-28 | 13F | Proathlete Wealth Management Llc | 0 | -100,00 | 0 | |||||
| 2026-02-13 | 13F | Towarzystwo Funduszy Inwestycyjnych Pzu Sa | 0 | -100,00 | 0 | |||||
| 2026-02-17 | 13F | Optiver Holding B.V. | Call | 74.000 | 11.244 | |||||
| 2026-02-17 | 13F | Optiver Holding B.V. | Put | 38.300 | 5.820 | |||||
| 2026-02-06 | 13F | Pnc Financial Services Group, Inc. | 9.821 | -16,33 | 1.492 | -60,55 | ||||
| 2026-02-04 | 13F | MADDEN SECURITIES Corp | 47.540 | -5,00 | 7.224 | -55,20 | ||||
| 2026-02-12 | 13F | Lansforsakringar Fondforvaltning AB (publ) | 84.705 | 10,59 | 12.871 | -47,85 | ||||
| 2026-01-20 | 13F | Independence Bank of Kentucky | 5 | 1 | ||||||
| 2026-02-17 | 13F | Warren Averett Asset Management, LLC | 4.902 | 15,18 | 745 | -45,73 | ||||
| 2026-04-17 | 13F | Bellecapital International Ltd. | 16.347 | 80,73 | 2.040 | 48,47 | ||||
| 2026-02-05 | 13F | Tucker Asset Management Llc | 95 | 14 | ||||||
| 2026-01-21 | 13F | Prime Capital Investment Advisors, LLC | Call | 0 | -100,00 | 0 | -100,00 | |||
| 2026-02-09 | 13F | Powell Investment Advisors, LLC | 0 | -100,00 | 0 | |||||
| 2026-04-16 | 13F | Capital Advisors, Ltd. LLC | 370 | -6,57 | 0 | |||||
| 2026-04-16 | 13F | REX Advisers, LLC | Put | 30.500 | -1,61 | 494 | 33,24 | |||
| 2026-04-16 | 13F | REX Advisers, LLC | Call | 45.700 | -1,72 | 100 | -47,09 | |||
| 2026-02-05 | 13F | Sapient Capital Llc | 0 | -100,00 | 0 | |||||
| 2026-04-10 | 13F | Magnus Financial Group LLC | 2.671 | 0,00 | 333 | -17,78 | ||||
| 2026-01-20 | 13F | Savvy Advisors, Inc. | 4.087 | 35,78 | 621 | -35,91 | ||||
| 2026-02-17 | 13F | Shay Capital LLC | 1.500 | 228 | ||||||
| 2026-02-17 | 13F | Shay Capital LLC | Call | 4.000 | 608 | |||||
| 2025-11-07 | 13F | Sierra Ocean, Llc | 0 | -100,00 | 0 | -100,00 | ||||
| 2026-02-04 | 13F | Pacer Advisors, Inc. | 0 | -100,00 | 0 | -100,00 | ||||
| 2025-11-14 | 13F | Delos Wealth Advisors, LLC | 0 | -100,00 | 0 | -100,00 | ||||
| 2026-02-17 | 13F | Hunting Hill Global Capital, LLC | Put | 104.100 | 5.683,33 | 15.818 | 2.631,78 | |||
| 2026-02-17 | 13F | Elequin Capital Lp | 29.957 | -2,72 | 4.552 | -54,13 | ||||
| 2026-01-29 | 13F | Ashton Thomas Private Wealth, LLC | 0 | -100,00 | 0 | |||||
| 2026-02-09 | 13F | Keating Financial Advisory Services, Inc. | 86 | 13 | ||||||
| 2026-01-28 | 13F | Nicholson Meyer Capital Management, Inc. | 0 | -100,00 | 0 | |||||
| 2026-02-20 | 13F | Kovitz Investment Group Partners, LLC | 4.313 | -19,31 | 655 | -61,96 | ||||
| 2026-02-13 | 13F | Ieq Capital, Llc | 4.040 | 6,40 | 614 | -49,88 | ||||
| 2026-02-11 | 13F | Los Angeles Capital Management Llc | 61.022 | 3.200,27 | 15.534 | 2.510,76 | ||||
| 2026-02-13 | 13F | Bridgefront Capital, LLC | 3.622 | 550 | ||||||
| 2026-04-15 | 13F | Avanza Fonder AB | 2.122 | 3,26 | 265 | -15,38 | ||||
| 2026-02-13 | 13F | Polymer Capital Management (HK) LTD | 0 | -100,00 | 0 | |||||
| 2026-02-09 | 13F | Quest Partners LLC | 918 | -14,76 | 139 | -59,94 | ||||
| 2026-02-10 | 13F | Harfst & Associates, Inc. | 4.858 | -0,92 | 738 | -53,26 | ||||
| 2026-02-17 | 13F | Sandler Capital Management | Put | 10.000 | 1.520 | |||||
| 2026-02-13 | 13F | Pin Oak Investment Advisors Inc | 1.203 | 0,00 | 0 | -100,00 | ||||
| 2025-10-29 | 13F | Harel Insurance Investments & Financial Services Ltd. | 0 | -100,00 | 0 | |||||
| 2026-02-13 | 13F | Y-Intercept (Hong Kong) Ltd | 71.884 | 10.923 | ||||||
| 2026-02-09 | 13F | Bleakley Financial Group, LLC | 0 | -100,00 | 0 | |||||
| 2026-02-17 | 13F | Lazard Asset Management Llc | 1.998 | -72,57 | 304 | -87,08 | ||||
| 2026-02-19 | 13F/A | Axxcess Wealth Management, Llc | 11.202 | 21,55 | 1.702 | -42,67 | ||||
| 2026-04-20 | 13F | Fiduciary Alliance LLC | 49.518 | 6,43 | 7.108 | 0,54 | ||||
| 2026-02-17 | 13F | Captrust Financial Advisors | 8.905 | -29,11 | 1.353 | -66,57 | ||||
| 2026-02-05 | 13F | Thrivent Financial For Lutherans | 5.017 | -1,55 | 1 | -100,00 | ||||
| 2026-02-05 | 13F | Avantax Planning Partners, Inc. | 2.107 | 35,15 | 320 | -36,25 | ||||
| 2026-02-13 | 13F | Ossiam | 0 | -100,00 | 0 | |||||
| 2026-01-20 | 13F | SHEPHERD WEALTH MANAGEMENT Ltd LIABILITY Co | 3.349 | -78,06 | 582 | -84,91 | ||||
| 2026-02-05 | 13F | Amalgamated Bank | 13.691 | 0,05 | 2 | -50,00 | ||||
| 2026-02-13 | 13F | Ausdal Financial Partners, Inc. | 10.394 | 297,02 | 1.579 | 87,31 | ||||
| 2026-04-21 | 13F | Paradigm Financial Partners, Llc | 7.067 | -44,25 | 882 | -54,26 | ||||
| 2026-02-04 | 13F | Advisor OS, LLC | 2.054 | -4,69 | 312 | -55,04 | ||||
| 2026-02-11 | 13F | Mirae Asset Securities (usa) Inc. | 235.571 | -0,44 | 35.795 | -53,05 | ||||
| 2026-02-03 | 13F | Generali Asset Management SPA SGR | 77.608 | 15,36 | 11.793 | -45,60 | ||||
| 2026-02-11 | 13F | Parallel Advisors, LLC | 3.473 | 11,21 | 528 | -47,61 | ||||
| 2026-02-12 | 13F | Colonial Trust Advisors | 80 | 0,00 | 12 | -52,00 | ||||
| 2025-10-21 | 13F | Measured Risk Portfolios, Inc. | 0 | -100,00 | 0 | -100,00 | ||||
| 2026-02-04 | 13F | Tsfg, Llc | 2.818 | 64,99 | 0 | |||||
| 2025-11-14 | 13F | ExodusPoint Capital Management, LP | 661 | -98,28 | 213 | 1.313,33 | ||||
| 2026-02-17 | 13F | Creative Planning | 75.652 | -1,50 | 11.495 | -53,55 | ||||
| 2026-02-17 | 13F | Limestone Investment Advisors LP | Call | 0 | -100,00 | 0 | ||||
| 2026-02-06 | 13F | Profund Advisors Llc | 21.084 | 10,50 | 3.204 | -47,90 | ||||
| 2026-02-27 | 13F | Strategic Investment Solutions, Inc. /IL | 49 | -92,84 | 7 | -96,82 | ||||
| 2025-11-21 | 13F | Oarsman Capital, Inc. | 0 | -100,00 | 0 | -100,00 | ||||
| 2026-02-09 | 13F | Clear Investment Research, Llc | 0 | -100,00 | 0 | |||||
| 2026-01-06 | 13F | Canal Capital Management, LLC | 1.615 | -39,08 | 245 | -71,31 | ||||
| 2026-04-20 | 13F | Jfs Wealth Advisors, Llc | 2 | 0,00 | 0 | |||||
| 2026-04-14 | 13F | Beacon Investment Advisory Services, Inc. | 16 | 2 | ||||||
| 2026-02-12 | 13F | Renaissance Technologies Llc | 957.332 | 324,10 | 137.112 | 225,66 | ||||
| 2026-02-12 | 13F | Insigneo Advisory Services, Llc | 3.003 | -23,49 | 456 | -63,92 | ||||
| 2026-01-23 | 13F | U.S. Capital Wealth Advisors, LLC | Call | 0 | -100,00 | 0 | -100,00 | |||
| 2026-02-19 | 13F | Invesco Ltd. | 1.817.979 | 14,12 | 276.242 | -46,18 | ||||
| 2025-11-10 | 13F | Cary Street Partner Investment Advisory Llc | 0 | -100,00 | 0 | -100,00 | ||||
| 2026-02-11 | 13F | Allianz Asset Management GmbH | 11.296 | -1,20 | 1.716 | -53,41 | ||||
| 2026-02-10 | 13F | Norges Bank | 3.528.397 | 536.140 | ||||||
| 2026-02-13 | 13F | E6 Portfolios, LLC | 3.777 | 574 | ||||||
| 2026-04-09 | 13F | Wealth Alliance Advisory Group, LLC | 0 | -100,00 | 0 | |||||
| 2026-02-12 | 13F | BlackRock, Inc. | 14.607.280 | -0,33 | 2.219.576 | -53,00 | ||||
| 2026-02-17 | 13F | Brevan Howard Capital Management LP | 9.675 | -84,43 | 1.470 | -92,66 | ||||
| 2026-02-11 | 13F | Simplex Trading, Llc | Put | 3.851.200 | -20,24 | 583.168 | 38.986,26 | |||
| 2026-02-12 | 13F | JPL Wealth Management, LLC | 0 | -100,00 | 0 | -100,00 | ||||
| 2026-02-25 | 13F | Thryve Wealth Management Llc | 6.128 | 931 | ||||||
| 2026-02-13 | 13F | Ostrum Asset Management | 739 | -24,90 | 112 | -64,67 | ||||
| 2025-10-22 | 13F | Red Tortoise LLC | 0 | -100,00 | 0 | -100,00 | ||||
| 2026-02-11 | 13F | Simplex Trading, Llc | Call | 2.835.200 | 3,97 | 424.576 | 48.367,47 | |||
| 2026-01-27 | 13F | ZEGA Investments, LLC | 4.676 | -46,68 | 711 | -74,87 | ||||
| 2026-02-17 | 13F | Maryland State Retirement & Pension System | 13.168 | 0,00 | 2.001 | -52,85 | ||||
| 2026-01-23 | 13F | Sage Mountain Advisors LLC | 5.985 | 38,86 | 909 | -34,51 | ||||
| 2026-02-13 | 13F | Flow Traders U.s. Llc | 14.912 | 1.729,69 | 2 | |||||
| 2026-02-17 | 13F | Fwl Investment Management, Llc | 0 | -100,00 | 0 | -100,00 | ||||
| 2026-04-08 | 13F | Arlington Trust Co LLC | 101 | 0,00 | 13 | -20,00 | ||||
| 2026-02-09 | 13F | Atlantic Trust, LLC | 152 | 442,86 | 23 | 155,56 | ||||
| 2026-02-10 | 13F | Bnp Paribas Arbitrage, Sa | 653.193 | 211,52 | 99.253 | 46,91 | ||||
| 2026-01-27 | 13F | TD Waterhouse Canada Inc. | 484 | -1,22 | 73 | -55,76 | ||||
| 2026-04-16 | 13F | Polianta Ltd | 9.800 | 18,07 | 1 | 0,00 | ||||
| 2026-02-11 | 13F | EULAV Asset Management | 138.000 | 59,54 | 20.969 | -24,76 | ||||
| 2026-01-26 | 13F | Icapital Wealth Llc | 0 | -100,00 | 0 | -100,00 | ||||
| 2026-02-26 | 13F/A | Alpine Global Management, LLC | 72.211 | 4.499,43 | 10.972 | 2.072,67 | ||||
| 2026-02-11 | 13F | Janney Montgomery Scott LLC | 20.915 | -36,33 | 3 | -70,00 | ||||
| 2025-11-17 | 13F/A | Proficio Capital Partners LLC | 0 | -100,00 | 0 | -100,00 | ||||
| 2025-10-31 | 13F | JFG Wealth Management, LLC | 826 | 3,25 | 266 | -17,65 | ||||
| 2026-04-01 | 13F | Burkett Financial Services, Llc | 562 | 124,80 | 70 | 89,19 | ||||
| 2026-02-10 | 13F | Syntegra Private Wealth Group, LLC | 1.851 | -34,38 | 281 | -69,05 | ||||
| 2025-11-14 | 13F | PineBridge Investments, L.P. | 1.329 | -5,27 | 428 | -24,51 | ||||
| 2026-02-11 | 13F | Gordian Capital Singapore Pte Ltd | 10 | 0,00 | 2 | -66,67 | ||||
| 2026-01-30 | 13F | Simplicity Wealth,LLC | 4.074 | -14,30 | 619 | -59,57 | ||||
| 2026-02-03 | 13F | Pilgrim Partners Asia Pte Ltd | 70.000 | 69.900,00 | 10.636 | 33.137,50 | ||||
| 2026-02-11 | 13F | LPL Financial LLC | 615.877 | -4,30 | 93.583 | -54,87 | ||||
| 2026-04-06 | 13F | CX Institutional | 1.292 | 139,26 | 0 | |||||
| 2026-02-11 | 13F | LPL Financial LLC | Call | 6.100 | 408,33 | 927 | 139,90 | |||
| 2026-02-11 | 13F | LPL Financial LLC | Put | 3.100 | 55,00 | 471 | -26,86 | |||
| 2026-02-12 | 13F | BRYN MAWR TRUST Co | 160 | 60,00 | 24 | -25,00 | ||||
| 2026-04-13 | 13F | Compass Ion Advisors, LLC | 43.045 | -2,13 | 5.372 | -19,60 | ||||
| 2025-11-06 | 13F | Johnson Investment Counsel Inc | Put | 0 | -100,00 | 0 | -100,00 | |||
| 2026-02-12 | 13F | New York State Common Retirement Fund | 279.650 | -0,89 | 42.493 | -53,26 | ||||
| 2026-04-07 | 13F | Farther Finance Advisors, LLC | 11.813 | 4,69 | 1.450 | -15,40 | ||||
| 2026-02-03 | 13F | Sequoia Financial Advisors, LLC | 7.426 | 9,72 | 1.128 | -48,26 | ||||
| 2026-02-10 | 13F | MJT & Associates Financial Advisory Group, Inc. | 0 | -100,00 | 0 | |||||
| 2026-01-29 | 13F | Kercheville Advisors, LLC | 0 | -100,00 | 0 | |||||
| 2026-02-17 | 13F | Quantitative Investment Management, LLC | 178.287 | 27 | ||||||
| 2026-02-09 | 13F | Huntington National Bank | 334 | -28,02 | 51 | -66,44 | ||||
| 2026-02-13 | 13F | Level Four Advisory Services, Llc | 0 | -100,00 | 0 | |||||
| 2026-02-13 | 13F | Neuberger Berman Group LLC | 2.745 | -60,43 | 417 | -81,34 | ||||
| 2026-02-10 | 13F | JTC Employer Solutions Trusteee Ltd | 600 | 0,00 | 0 | |||||
| 2026-02-13 | 13F | Solstein Capital, LLC | Call | 0 | -100,00 | 0 | -100,00 | |||
| 2026-01-08 | 13F | Sound View Wealth Advisors Group, LLC | 0 | -100,00 | 0 | -100,00 | ||||
| 2025-11-14 | 13F | AXA Investment Managers S.A. | 37.147 | 11.969 | ||||||
| 2026-02-13 | 13F | Capula Management Ltd | Put | 126.600 | -92,85 | 19.237 | -96,63 | |||
| 2026-02-02 | 13F | Wolverine Asset Management Llc | 1.740 | 264 | ||||||
| 2026-02-03 | 13F | Everence Capital Management Inc | 0 | -100,00 | 0 | -100,00 | ||||
| 2026-02-13 | 13F | Capula Management Ltd | 126.288 | -92,81 | 19.189 | -96,61 | ||||
| 2026-01-22 | 13F | Harwood Advisory Group, LLC | 190 | 0,00 | 29 | -54,10 | ||||
| 2025-11-14 | 13F | Cnh Partners Llc | Put | 0 | -100,00 | 0 | -100,00 | |||
| 2026-02-13 | 13F | TRUE Private Wealth Advisors | 0 | -100,00 | 0 | |||||
| 2026-02-13 | 13F | Capula Management Ltd | Call | 4.600 | -72,62 | 699 | -87,11 | |||
| 2026-02-11 | 13F | Hughes Financial Services, LLC | 10 | -23,08 | 2 | -66,67 | ||||
| 2026-02-11 | 13F | Capital Research Global Investors | 7.008.535 | 66,66 | 1.064.963 | -21,40 | ||||
| 2026-02-11 | 13F | Capital Group Private Client Services, Inc. | 3.243 | -2,23 | 493 | -53,93 | ||||
| 2026-02-05 | 13F | Allworth Financial LP | 2.512 | -10,51 | 382 | -57,85 | ||||
| 2026-02-13 | 13F | BNP Paribas Asset Management Holding S.A. | 103.076 | 16 | ||||||
| 2026-04-13 | 13F | E Fund Management Co., Ltd. | 10.822 | 81,91 | 1.351 | -43,84 | ||||
| 2026-02-13 | 13F | Solstein Capital, LLC | 0 | -100,00 | 0 | -100,00 | ||||
| 2026-04-07 | 13F | U.S. Capital Wealth Advisors, LLC | 4.975 | 106,86 | 621 | 69,86 | ||||
| 2026-01-26 | 13F | Mirae Asset Global Investments Co., Ltd. | 87.531 | 21,91 | 13.300 | -42,51 | ||||
| 2026-01-07 | 13F | Everhart Financial Group, Inc. | 0 | -100,00 | 0 | -100,00 | ||||
| 2026-01-22 | 13F | Bnc Wealth Management, Llc | 0 | -100,00 | 0 | |||||
| 2026-02-12 | 13F | Mosley Wealth Management | 1.638 | -6,45 | 542 | -9,38 | ||||
| 2026-02-17 | 13F | IHT Wealth Management, LLC | 32.357 | 5,85 | 4.917 | -50,09 | ||||
| 2025-10-27 | 13F | Q3 Asset Management | 0 | -100,00 | 0 | |||||
| 2026-04-15 | 13F | QTR Family Wealth, LLC | 7.379 | 0,37 | 1.014 | 3,68 | ||||
| 2026-02-06 | 13F | Cedar Wealth Management, LLC | 0 | -100,00 | 0 | -100,00 | ||||
| 2026-02-11 | 13F | O'shaughnessy Asset Management, Llc | 10.098 | -51,97 | 1.534 | -77,35 | ||||
| 2026-04-15 | 13F | Milestone Asset Management, Llc | 1.868 | 16,68 | 233 | -4,12 | ||||
| 2026-02-17 | 13F | Canada Pension Plan Investment Board | 438.743 | 11,55 | 66.667 | -47,40 | ||||
| 2026-02-03 | 13F | Mma Asset Management Llc | 0 | -100,00 | 0 | -100,00 | ||||
| 2026-02-17 | 13F | Massar Capital Management, LP | Call | 104.500 | 0,00 | 15.879 | -52,84 | |||
| 2026-02-17 | 13F | Massar Capital Management, LP | 101.139 | 462,60 | 15.368 | 165,33 | ||||
| 2026-02-17 | 13F | Massar Capital Management, LP | Put | 104.500 | 0,00 | 15.879 | -52,84 | |||
| 2026-01-30 | 13F | Precision Wealth Strategies, LLC | 0 | -100,00 | 0 | -100,00 | ||||
| 2025-11-05 | 13F | Moloney Securities Asset Management, LLC | 987 | -26,01 | 318 | -41,00 | ||||
| 2026-02-17 | 13F | Weiss Asset Management LP | 985.720 | -29,01 | 149.780 | -66,52 | ||||
| 2026-02-17 | 13F | Utah Retirement Systems | 29.007 | 0,51 | 4.408 | -52,60 | ||||
| 2026-02-11 | 13F | X-Square Capital, LLC | 28.155 | 54,03 | 4 | -20,00 | ||||
| 2026-01-27 | 13F | Asset Management One Co., Ltd. | 101.951 | 0,94 | 15.836 | -51,34 | ||||
| 2026-02-17 | 13F | Hbk Investments L P | 51.564 | 7.835 | ||||||
| 2026-02-17 | 13F | Weiss Asset Management LP | Put | 2.121.200 | -33,82 | 322.316 | -68,79 | |||
| 2026-04-09 | 13F | Secure Asset Management, LLC | 20.020 | -1,24 | 2.498 | -18,90 | ||||
| 2026-02-17 | 13F | Hbk Investments L P | Put | 122.000 | -8,27 | 18.538 | -56,74 | |||
| 2026-02-17 | 13F | Murchinson Ltd. | Put | 100.000 | 15.195 | |||||
| 2026-02-10 | 13F | KERR FINANCIAL PLANNING Corp | 1 | 0,00 | 0 | |||||
| 2026-02-02 | 13F | Millstone Evans Group, LLC | 50 | 0,00 | 8 | -56,25 | ||||
| 2026-02-12 | 13F | Cibc World Markets Corp | 22.061 | -22,29 | 3.352 | -70,79 | ||||
| 2025-11-10 | 13F | Private Advisory Group LLC | 0 | -100,00 | 0 | -100,00 | ||||
| 2026-02-11 | 13F | Strategic Advocates LLC | 7.812 | 1,59 | 1.216 | -50,95 | ||||
| 2026-01-23 | 13F | Blue Sky Capital Consultants Group, Inc. | Call | 7.900 | -23,30 | 1.200 | -63,83 | |||
| 2026-01-23 | 13F | Blue Sky Capital Consultants Group, Inc. | 20.862 | 12,18 | 3.170 | -47,11 | ||||
| 2026-02-17 | 13F | Equitable Holdings, Inc. | 12.412 | -10,78 | 1.886 | -57,92 | ||||
| 2026-02-05 | 13F | Pinnacle Associates Ltd | 10.746 | 123,64 | 1.633 | 5,43 | ||||
| 2026-02-05 | 13F | HighMark Wealth Management LLC | 185 | 15,62 | 28 | -45,10 | ||||
| 2025-11-14 | 13F | Zurich Insurance Group Ltd/FI | 0 | -100,00 | 0 | -100,00 | ||||
| 2026-02-12 | 13F | Gerber Kawasaki Wealth & Investment Management | 221.529 | 19.080,00 | 216 | -41,94 | ||||
| 2026-02-10 | 13F | Daiwa Securities Group Inc. | Put | 15.000 | 2 | |||||
| 2026-02-12 | 13F | Chilton Capital Management Llc | 48 | 0,00 | 7 | -53,33 | ||||
| 2026-02-09 | 13F | Texas Capital Bank Wealth Management Services Inc | 2.248 | 7,20 | 342 | -49,48 | ||||
| 2026-02-10 | 13F | Daiwa Securities Group Inc. | 61.118 | 39,98 | 9 | -35,71 | ||||
| 2026-01-22 | 13F | Premier Path Wealth Partners, LLC | 0 | -100,00 | 0 | |||||
| 2026-02-17 | 13F | FIL Ltd | 6.361 | -8,80 | 967 | -57,01 | ||||
| 2026-02-17 | 13F | Perennial Investment Advisors, LLC | Call | 200 | 30 | |||||
| 2026-02-17 | 13F | Perennial Investment Advisors, LLC | 5.321 | 1,55 | 809 | -52,13 | ||||
| 2026-04-07 | 13F | Retirement Wealth Solutions LLC | 25 | 3 | ||||||
| 2026-02-03 | 13F | Ethic Inc. | 12.341 | -2,37 | 1.875 | -53,97 | ||||
| 2026-02-04 | 13F | Independent Advisor Alliance | 46.793 | -11,30 | 7.110 | -58,17 | ||||
| 2026-02-03 | 13F | Chesapeake Capital Corp /il/ | 0 | -100,00 | 0 | |||||
| 2026-02-17 | 13F | Philadelphia Financial Management of San Francisco, LLC | Put | 300.000 | 45.585 | |||||
| 2026-02-06 | 13F | Harvest Portfolios Group Inc. | 2.110.081 | 36,09 | 320.627 | -35,82 | ||||
| 2025-11-13 | 13F | Quartz Partners, LLC | 0 | -100,00 | 0 | -100,00 | ||||
| 2025-11-06 | 13F | Financial Advocates Investment Management | 0 | -100,00 | 0 | -100,00 | ||||
| 2026-02-17 | 13F | Chokshi & Queen Wealth Advisors, Inc | 14.350 | 178,64 | 2.180 | 31,40 | ||||
| 2026-02-06 | 13F | Heritage Investors Management Corp | 21.909 | 0,00 | 3 | -57,14 | ||||
| 2026-02-09 | 13F | Allstate Corp | 19.613 | 104,52 | 2.980 | -3,53 | ||||
| 2026-02-13 | 13F | Independent Family Office, LLC | 4.100 | 0,00 | 623 | -52,91 | ||||
| 2026-02-06 | 13F | Mjp Associates Inc /adv | 1.622 | -5,86 | 246 | -55,68 | ||||
| 2026-02-13 | 13F | Police & Firemen's Retirement System of New Jersey | 40.798 | -4,25 | 6.199 | -54,85 | ||||
| 2026-01-26 | 13F | Pennsylvania Capital Management Inc /adv | 3.432 | -0,26 | 521 | -52,98 | ||||
| 2026-02-17 | 13F | Magnetar Financial LLC | 0 | -100,00 | 0 | -100,00 | ||||
| 2026-02-02 | 13F | Sun Financial Inc | 6.271 | 953 | ||||||
| 2026-02-10 | 13F | National Pension Service | 614.409 | 20,09 | 93.359 | -43,37 | ||||
| 2026-01-28 | 13F | Mountain Capital Investment Advisors, Inc | 1.806 | 1,18 | 295 | -51,32 | ||||
| 2026-02-02 | 13F | Eq Wealth Advisors, Llc | 307 | 47 | ||||||
| 2026-02-02 | 13F | Fifth Third Bancorp | 2.790 | -3,83 | 424 | -54,71 | ||||
| 2025-10-29 | 13F | Tradewinds, LLC. | 0 | -100,00 | 0 | -100,00 | ||||
| 2026-02-11 | 13F | Franklin Resources Inc | 51.100 | 8,25 | 7.765 | -48,95 | ||||
| 2026-01-20 | 13F | Cigna Investments Inc /new | 2.546 | -1,66 | 0 | |||||
| 2025-11-13 | 13F | Heritage Wealth Advisors | 0 | -100,00 | 0 | -100,00 | ||||
| 2026-02-13 | 13F | McAdam, LLC | 1.837 | 6,49 | 279 | -49,73 | ||||
| 2025-11-14 | 13F | Sassicaia Capital Advisers Llc | 0 | -100,00 | 0 | -100,00 | ||||
| 2026-02-12 | 13F | Annandale Capital, LLC | 1.600 | 0 | ||||||
| 2026-02-10 | 13F | Kentucky Retirement Systems Insurance Trust Fund | 6.948 | 0,00 | 1.056 | -52,86 | ||||
| 2026-02-11 | 13F | Erste Asset Management GmbH | 33.740 | 5.243 | ||||||
| 2026-04-16 | 13F | SG Americas Securities, LLC | Call | 33.000 | -76,74 | 0 | -100,00 | |||
| 2026-04-17 | 13F | Weaver Capital Management LLC | 0 | -100,00 | 0 | |||||
| 2026-02-17 | 13F | Citadel Advisors Llc | Put | 9.904.500 | -33,98 | 1.504.989 | -68,87 | |||
| 2026-02-17 | 13F | Citadel Advisors Llc | Call | 10.975.600 | -13,44 | 1.667.742 | -59,18 | |||
| 2026-02-17 | 13F | Citadel Advisors Llc | 714.361 | 966,37 | 108.547 | 402,90 | ||||
| 2026-02-05 | 13F | AlphaCore Capital LLC | 0 | -100,00 | 0 | -100,00 | ||||
| 2026-01-28 | 13F | Atwood & Palmer Inc | 0 | -100,00 | 0 | -100,00 | ||||
| 2025-10-28 | 13F | Copperleaf Capital, LLC | 1.942 | 626 | ||||||
| 2026-02-05 | 13F | Western Wealth Management, LLC | 14.430 | 0,03 | 2.193 | -52,84 | ||||
| 2026-02-13 | 13F | Truvestments Capital Llc | 21.773 | 22,95 | 3.308 | -42,03 | ||||
| 2026-04-17 | 13F | HHM Wealth Advisors, LLC | 18.011 | 0,16 | 2.248 | -17,75 | ||||
| 2026-02-13 | 13F | McAdam, LLC | Call | 100 | 5 | |||||
| 2026-02-17 | 13F | Guggenheim Capital Llc | 66.036 | 5,42 | 10.034 | -50,28 | ||||
| 2026-04-09 | 13F | Key Client Fiduciary Advisors, LLC | 2.191 | 36,85 | 273 | 12,35 | ||||
| 2026-01-15 | 13F | Presidio Capital Management, LLC | 0 | -100,00 | 0 | -100,00 | ||||
| 2025-11-06 | 13F | Willis Johnson & Associates, Inc. | 0 | -100,00 | 0 | -100,00 | ||||
| 2026-02-11 | 13F | Twin Tree Management, LP | Call | 0 | -100,00 | 0 | -100,00 | |||
| 2026-02-11 | 13F | IMA Wealth, Inc. | 21 | 600,00 | 3 | |||||
| 2026-02-13 | 13F | Citigroup Inc | Put | 368.200 | 60,09 | 55.948 | -24,51 | |||
| 2026-04-14 | 13F | Nbc Securities, Inc. | 825 | 0,61 | 103 | -17,74 | ||||
| 2025-11-04 | 13F | Guerra Advisors Inc | 10 | 3 | ||||||
| 2026-01-20 | 13F | Ethos Financial Group, LLC | 0 | -100,00 | 0 | -100,00 | ||||
| 2026-01-30 | 13F | Valued Wealth Advisors LLC | 2 | 0,00 | 0 | |||||
| 2026-02-13 | 13F | Quarry LP | 246 | 96,80 | 37 | -7,50 | ||||
| 2025-11-05 | 13F | Triglav Skladi, D.o.o. | 0 | -100,00 | 0 | -100,00 | ||||
| 2026-04-16 | 13F | Trium Capital LLP | Call | 285.200 | 941 | |||||
| 2025-10-21 | 13F | PDS Planning, Inc | 0 | -100,00 | 0 | -100,00 | ||||
| 2026-04-09 | 13F | Veracity Capital LLC | 0 | -100,00 | 0 | |||||
| 2026-02-10 | 13F | Td Asset Management Inc | 108.770 | -0,13 | 16.528 | -52,90 | ||||
| 2026-01-29 | 13F | RMG Wealth Management LLC | 14 | 0,00 | 2 | -50,00 | ||||
| 2026-02-17 | 13F | BLKBRD Asset Management, LP | 7.468 | -93,53 | 1.135 | -96,95 | ||||
| 2026-02-11 | 13F | Deutsche Bank Ag\ | 731.704 | -12,73 | 111.182 | -58,84 | ||||
| 2026-02-17 | 13F | Lombard Odier Asset Management (USA) Corp | Call | 19.500 | 413,16 | 2.963 | 142,08 | |||
| 2025-11-14 | 13F | Westwood Holdings Group Inc | 0 | -100,00 | 0 | -100,00 | ||||
| 2025-11-14 | 13F | Moore Capital Management, Lp | 0 | -100,00 | 0 | -100,00 | ||||
| 2026-02-10 | 13F | Envestnet Asset Management Inc | 24.952 | 10,39 | 3.791 | -47,95 | ||||
| 2026-02-17 | 13F | CWM Advisors, LLC | 28 | 4 | ||||||
| 2026-02-17 | 13F | Rakuten Investment Management, Inc. | 25.509 | 1.102,12 | 3.964 | 934,73 | ||||
| 2026-04-09 | 13F | Diversified Management Inc | 1.650 | 206 | ||||||
| 2026-04-03 | 13F | Global Wealth Strategies & Associates | 50 | 0,00 | 6 | -14,29 | ||||
| 2025-11-13 | 13F | Riggs Asset Managment Co. Inc. | 0 | -100,00 | 0 | -100,00 | ||||
| 2026-04-06 | 13F | Versant Capital Management, Inc | 909 | 350,00 | 113 | 276,67 | ||||
| 2025-11-03 | 13F | EPG Wealth Management LLC | 0 | -100,00 | 0 | -100,00 | ||||
| 2026-02-13 | 13F | Citigroup Inc | 506.827 | 47,21 | 77.012 | -30,58 | ||||
| 2026-01-09 | 13F | Tactive Advisors, LLC | 0 | -100,00 | 0 | -100,00 | ||||
| 2026-02-13 | 13F | Citigroup Inc | Call | 246.700 | 2.142,73 | 37.486 | 957,73 | |||
| 2026-02-10 | 13F | Sittner & Nelson, Llc | 30 | 100,00 | 4 | 0,00 | ||||
| 2026-02-13 | 13F | Gts Securities Llc | 1.398 | -82,96 | 212 | -91,98 | ||||
| 2026-02-05 | 13F | STF Management LP | 1.445 | -53,86 | 220 | -78,30 | ||||
| 2026-04-21 | 13F | Unique Wealth, Llc | 0 | -100,00 | 0 | |||||
| 2026-02-20 | 13F | Wick Capital Partners, LLC | 14.059 | 547,58 | 330 | -52,93 | ||||
| 2026-01-22 | 13F | Ofi Invest Asset Management | 629 | 81 | ||||||
| 2026-01-23 | 13F | Westside Investment Management, Inc. | 219 | -27,24 | 33 | -66,33 | ||||
| 2026-01-28 | 13F | Chicago Partners Investment Group LLC | 16.452 | 13,27 | 2.683 | -35,10 | ||||
| 2026-04-16 | 13F | BridgePort Financial Solutions, LLC | 2.330 | 0,00 | 291 | -18,08 | ||||
| 2026-02-11 | 13F | Empowered Funds, LLC | 8.370 | 1,17 | 1.272 | -52,31 | ||||
| 2026-02-13 | 13F | SRS Capital Advisors, Inc. | 2.950 | 448 | ||||||
| 2026-02-17 | 13F | Cresset Asset Management, LLC | 29.402 | -2,71 | 4.468 | -54,12 | ||||
| 2025-11-04 | 13F | Strengthening Families & Communities, LLC | 0 | -100,00 | 0 | -100,00 | ||||
| 2026-02-13 | 13F | Transamerica Financial Advisors, Inc. | 4 | 1 | ||||||
| 2025-11-14 | 13F | Point72 Asia (Singapore) Pte. Ltd. | 11.270 | 3.631 | ||||||
| 2025-11-06 | 13F | Fundamentun, Llc | 0 | -100,00 | 0 | -100,00 | ||||
| 2025-10-27 | 13F | Concurrent Investment Advisors, LLC | Call | 0 | -100,00 | 0 | -100,00 | |||
| 2026-02-11 | 13F | Cerity Partners LLC | 16.114 | 70,63 | 2.449 | -19,42 | ||||
| 2026-02-13 | 13F | Centiva Capital, LP | 844 | 128 | ||||||
| 2026-02-13 | 13F | Centiva Capital, LP | Put | 36.200 | -74,40 | 5.501 | -87,93 | |||
| 2026-01-29 | 13F | Resonant Capital Advisors, LLC | 0 | -100,00 | 0 | |||||
| 2026-02-11 | 13F | Capital Group Investment Management Pte. Ltd. | 0 | -100,00 | 0 | |||||
| 2026-02-13 | 13F | Centiva Capital, LP | Call | 116.100 | 112,25 | 17.641 | 0,10 | |||
| 2025-11-03 | 13F | Retirement Planning Co of New England, Inc. | 0 | -100,00 | 0 | -100,00 | ||||
| 2026-02-11 | 13F | Cerity Partners LLC | Call | 30.000 | 48 | |||||
| 2026-01-20 | 13F | C2P Capital Advisory Group, LLC d.b.a. Prosperity Capital Advisors | 0 | -100,00 | 0 | |||||
| 2026-01-23 | 13F | Clear Creek Financial Management, LLC | 2.922 | 59,76 | 444 | -24,79 | ||||
| 2026-04-13 | 13F | Mather Group, Llc. | 23 | 3 | ||||||
| 2026-02-13 | 13F | Parkside Financial Bank & Trust | 53 | -71,35 | 8 | -86,44 | ||||
| 2026-04-17 | 13F | Andina Capital Management, LLC | 9.011 | 74,60 | 1.125 | 43,37 | ||||
| 2026-02-12 | 13F | Great Lakes Advisors, Llc | 3.743 | -13,99 | 569 | -59,49 | ||||
| 2026-02-17 | 13F | Ameriflex Group, Inc. | 1 | -50,00 | 0 | |||||
| 2026-04-16 | 13F | Quotient Wealth Partners, LLC | 2.868 | 358 | ||||||
| 2026-02-10 | 13F | Bruce G. Allen Investments, LLC | 17 | -10,53 | 3 | -66,67 | ||||
| 2026-02-13 | 13F | Venture Visionary Partners LLC | 1.621 | -35,70 | 246 | -69,70 | ||||
| 2026-02-12 | 13F | Alpha Family Trust | 0 | -100,00 | 0 | |||||
| 2026-02-10 | 13F | Oxford Wealth Group, LLC | 0 | -100,00 | 0 | -100,00 | ||||
| 2026-02-11 | 13F | Capital International Sarl | 10.805 | -52,71 | 1.642 | -77,71 | ||||
| 2026-02-13 | 13F | Venture Visionary Partners LLC | Put | 200 | 30 | |||||
| 2026-02-13 | 13F | Venture Visionary Partners LLC | Call | 200 | 30 | |||||
| 2026-01-29 | 13F | Calamos Wealth Management LLC | 1.507 | -2,59 | 229 | -54,22 | ||||
| 2026-02-05 | 13F | North Dakota State Investment Board | 9.295 | 1.412 | ||||||
| 2026-01-12 | 13F | National Wealth Management Group, LLC | 2.640 | 4,43 | 401 | -50,74 | ||||
| 2026-01-20 | 13F | Ascent Group, LLC | 0 | -100,00 | 0 | -100,00 | ||||
| 2025-11-03 | 13F | Private Wealth Asset Management, LLC | 0 | -100,00 | 0 | -100,00 | ||||
| 2025-11-14 | 13F | Qube Research & Technologies Ltd | 0 | -100,00 | 0 | -100,00 | ||||
| 2026-03-06 | 13F | Hsbc Holdings Plc | Call | 0 | -100,00 | 0 | -100,00 | |||
| 2026-02-11 | 13F | Winton Capital Group Ltd | 47.894 | 189,32 | 7.277 | 36,45 | ||||
| 2026-02-10 | 13F | Tidemark, LLC | 9 | 0,00 | 1 | -50,00 | ||||
| 2026-02-17 | 13F/A | Kovack Advisors, Inc. | 32.890 | 4.779,82 | 4.998 | 2.202,76 | ||||
| 2026-01-09 | 13F | Friday Financial | 0 | -100,00 | 0 | -100,00 | ||||
| 2026-01-27 | 13F | MASTERINVEST Kapitalanlage GmbH | 0 | -100,00 | 0 | -100,00 | ||||
| 2026-02-04 | 13F | Pensionmark Financial Group, Llc | 9.154 | 27,55 | 1.132 | -51,04 | ||||
| 2026-02-10 | 13F | Foundations Investment Advisors, LLC | 265.745 | 141,17 | 40.380 | 13,73 | ||||
| 2026-02-14 | 13F | BluePath Capital Management, LLC | 3.769 | -12,08 | 573 | -58,58 | ||||
| 2026-02-13 | 13F | Allianz Se | 2.078 | -43,84 | 316 | -73,57 | ||||
| 2026-01-20 | 13F | Coastal Investment Advisors, Inc. | 16.600 | 6,10 | 2.522 | -49,96 | ||||
| 2026-02-04 | 13F | Pure Financial Advisors, Inc. | 0 | -100,00 | 0 | |||||
| 2026-02-17 | 13F | NorthRock Partners, LLC | 0 | -100,00 | 0 | -100,00 | ||||
| 2026-02-04 | 13F | KLCM Advisors, Inc. | 2.010 | 305 | ||||||
| 2026-01-15 | 13F | Nisa Investment Advisors, Llc | 8.130 | -69,62 | 1.235 | -85,68 | ||||
| 2026-01-07 | 13F | Harbor Investment Advisory, Llc | 290 | -56,39 | 44 | -79,44 | ||||
| 2026-01-12 | 13F | Rialto Wealth Management, LLC | 3 | -57,14 | 0 | -100,00 | ||||
| 2026-02-23 | 13F | Kera Capital Partners, Inc. | 2.321 | 347 | ||||||
| 2026-02-12 | 13F | Jane Street Group, Llc | Put | 9.767.100 | 16,26 | 1.484.111 | -45,17 | |||
| 2025-11-10 | 13F | Bridgewater Advisors Inc. | 0 | -100,00 | 0 | -100,00 | ||||
| 2026-02-12 | 13F | Jane Street Group, Llc | Call | 18.548.500 | 11,59 | 2.818.445 | -47,38 | |||
| 2025-12-16 | 13F | Keel Point, LLC | 0 | -100,00 | 0 | -100,00 | ||||
| 2026-02-12 | 13F | Jane Street Group, Llc | 951.187 | 473,13 | 144.533 | 170,28 | ||||
| 2026-02-03 | 13F | Bokf, Na | 2.317 | -0,26 | 352 | -52,94 | ||||
| 2026-02-05 | 13F | Rahlfs Capital, Llc | 2.485 | -4,79 | 378 | -55,12 | ||||
| 2025-11-10 | 13F | Cary Street Partners Financial Llc | 0 | -100,00 | 0 | -100,00 | ||||
| 2026-03-04 | 13F | SHP Wealth Management | 417 | 63 | ||||||
| 2026-02-17 | 13F | Johns Hopkins University | 8.400 | 1.276 | ||||||
| 2026-02-17 | 13F | Point72 Asset Management, L.P. | Put | 164.200 | 114,64 | 24.950 | 1,22 | |||
| 2026-02-17 | 13F | Point72 Asset Management, L.P. | Call | 1.073.300 | 3.477,67 | 163.088 | 1.587,22 | |||
| 2026-01-07 | 13F | Sagespring Wealth Partners, Llc | 0 | -100,00 | 0 | -100,00 | ||||
| 2026-04-13 | 13F | Salem Investment Counselors Inc | 261 | 33 | ||||||
| 2026-04-14 | 13F | Moisand Fitzgerald Tamayo, LLC | 441 | 0,00 | 55 | -17,91 | ||||
| 2026-04-20 | 13F | First PREMIER Bank | 84 | 0,00 | 0 | |||||
| 2026-02-13 | 13F | Ubs Asset Management Americas Inc | 1.493.816 | 19,39 | 226.985 | -43,70 | ||||
| 2026-01-29 | 13F | UMA Financial Services, Inc. | 69 | -19,77 | 10 | -62,96 | ||||
| 2026-02-17 | 13F | State Of Wisconsin Investment Board | 131.555 | -4,14 | 19.990 | -54,80 | ||||
| 2026-02-13 | 13F | USS Investment Management Ltd | 44.382 | 8,37 | 6.742 | -48,90 | ||||
| 2026-02-12 | 13F | Fortress Private Ledger, Llc | 0 | -100,00 | 0 | |||||
| 2026-02-12 | 13F | Hrt Financial Lp | 0 | -100,00 | 0 | -100,00 | ||||
| 2026-02-13 | 13F | Public Sector Pension Investment Board | 0 | -100,00 | 0 | |||||
| 2026-02-17 | 13F | VestGen Advisors, LLC | Call | 10.000 | 1 | |||||
| 2026-02-17 | 13F | VestGen Advisors, LLC | Put | 30.000 | 71 | |||||
| 2026-02-17 | 13F | VestGen Advisors, LLC | 10.097 | 110,40 | 1.534 | -0,78 | ||||
| 2026-02-12 | 13F | Cloud Capital Management, LLC | 0 | -100,00 | 0 | |||||
| 2026-02-02 | 13F | Cornerstone Planning Group LLC | 264 | 576,92 | 42 | |||||
| 2025-11-14 | 13F | Wolverine Trading, Llc | 1.934 | -97,67 | 631 | -98,02 | ||||
| 2025-11-14 | 13F | Wolverine Trading, Llc | Call | 5.711.200 | 0,91 | 1.864.250 | -14,20 | |||
| 2025-11-14 | 13F | Wolverine Trading, Llc | Put | 3.285.200 | 17,43 | 1.072.355 | -0,15 | |||
| 2026-02-10 | 13F | CIBC Asset Management Inc | 60.592 | 9,02 | 9.207 | -48,59 | ||||
| 2026-01-22 | 13F | Weaver Capital Management LLC | Call | 304 | -52,95 | |||||
| 2026-04-14 | 13F | Patriot Investment Management Inc. | 14.506 | -0,22 | 1.810 | -18,06 | ||||
| 2026-02-11 | 13F | Atlanta Consulting Group Advisors, LLC | 0 | -100,00 | 0 | |||||
| 2026-02-05 | 13F | DnB Asset Management AS | 92.133 | 0,03 | 14.000 | -52,83 | ||||
| 2026-01-20 | 13F | Cromwell Holdings LLC | 0 | -100,00 | 0 | |||||
| 2026-01-20 | 13F | Stratos Wealth Advisors, LLC | 10.375 | 8,34 | 1.577 | -48,91 | ||||
| 2026-02-03 | 13F | Costello Asset Management, INC | 200 | 0,00 | 30 | -53,12 | ||||
| 2025-11-13 | 13F | Meiji Yasuda Asset Management Co Ltd. | 0 | -100,00 | 0 | |||||
| 2026-02-13 | 13F | Centaurus Financial, Inc. | 6.856 | 2,04 | 1 | -50,00 | ||||
| 2026-02-13 | 13F | Cavalier Investments, LLC | Call | 2.000 | 1.804,76 | 304 | -91,04 | |||
| 2026-02-13 | 13F | Cavalier Investments, LLC | 21.712 | 86,74 | 3.299 | -11,93 | ||||
| 2026-02-17 | 13F | Sona Asset Management (us) Llc | Put | 200.000 | 166,67 | 30.390 | 25,76 | |||
| 2026-04-21 | 13F | Robeco Institutional Asset Management B.V. | 120.464 | 6,72 | 15.034 | -12,35 | ||||
| 2026-02-13 | 13F | Glen Eagle Advisors, LLC | 230 | 5,50 | 35 | -51,43 | ||||
| 2026-02-13 | 13F | Cavalier Investments, LLC | Put | 21.300 | 19.441,28 | 3.237 | -7,86 | |||
| 2026-02-17 | 13F | Odyssean, LLC | 2.842 | 432 | ||||||
| 2026-01-14 | 13F | Game Plan Financial Advisors, LLC | 0 | -100,00 | 0 | -100,00 | ||||
| 2026-04-15 | 13F | Norden Group Llc | 2.783 | 75,81 | 347 | 44,58 | ||||
| 2025-11-14 | 13F | Eqis Capital Management, Inc. | 0 | -100,00 | 0 | -100,00 | ||||
| 2026-02-17 | 13F | Prelude Capital Management, Llc | 13.303 | 2.025 | ||||||
| 2026-04-21 | 13F | Gilpin Wealth Management, Llc | 80 | 0,00 | 10 | -25,00 | ||||
| 2026-02-05 | 13F | Beese Fulmer Investment Management, Inc. | 0 | -100,00 | 0 | |||||
| 2026-02-03 | 13F | Primoris Wealth Advisors, Llc | 0 | -100,00 | 0 | |||||
| 2026-01-28 | 13F | B. Metzler seel. Sohn & Co. AG | 8.604 | -6,22 | 1.307 | -55,78 | ||||
| 2026-02-17 | 13F | Schonfeld Strategic Advisors LLC | 53.466 | 2.766,81 | 8.124 | 1.254,00 | ||||
| 2026-04-08 | 13F | Miracle Mile Advisors, LLC | 1.988 | 248 | ||||||
| 2025-11-14 | 13F | Voleon Capital Management Lp | 0 | -100,00 | 0 | -100,00 | ||||
| 2026-02-09 | 13F | Themes Management Co LLC | Call | 6.000 | 912 | |||||
| 2026-02-09 | 13F | Themes Management Co LLC | 122 | 19 | ||||||
| 2026-02-17 | 13F/A | Intesa Sanpaolo S.p.a. | Put | 1.215.000 | 184.619 | |||||
| 2026-01-09 | 13F | 180 Wealth Advisors, Llc | 2.167 | 329 | ||||||
| 2026-02-12 | 13F | Johnson Financial Group, Inc. | 13 | -27,78 | 2 | -80,00 | ||||
| 2026-01-27 | 13F | Traphagen Investment Advisors Llc | 7.357 | 2,71 | 1.118 | -51,60 | ||||
| 2026-02-11 | 13F | Harvest Fund Management Co., Ltd | 19.989 | 23,41 | 3 | -40,00 | ||||
| 2026-02-12 | 13F | Voya Investment Management Llc | 9.770 | 1,11 | 1.485 | -52,33 | ||||
| 2026-01-23 | 13F | KG&L Capital Management,LLC | Call | 0 | -100,00 | 0 | -100,00 | |||
| 2026-02-17 | 13F | Toronto Dominion Bank | Put | 0 | -100,00 | 0 | -100,00 | |||
| 2026-04-16 | 13F | Brookstone Capital Management | 2.395 | -84,31 | 299 | -87,14 | ||||
| 2026-02-05 | 13F | IMG Wealth Management, Inc. | 1 | 0,00 | 0 | |||||
| 2026-01-07 | 13F | CWA Asset Management Group, LLC | 0 | -100,00 | 0 | |||||
| 2026-01-27 | 13F | Brighton Jones Llc | 0 | -100,00 | 0 | |||||
| 2026-01-14 | 13F | ORG Partners LLC | 125 | -0,79 | 19 | -55,00 | ||||
| 2025-11-10 | 13F | Axq Capital, Lp | 0 | -100,00 | 0 | -100,00 | ||||
| 2026-04-16 | 13F | Davis Capital Management | 4 | 300,00 | 0 | |||||
| 2025-11-17 | 13F | Laurion Capital Management LP | 0 | -100,00 | 0 | -100,00 | ||||
| 2026-01-27 | 13F | Bayforest Capital Ltd | 0 | -100,00 | 0 | -100,00 | ||||
| 2025-12-16 | 13F | Garde Capital, Inc. | 0 | -100,00 | 0 | -100,00 | ||||
| 2026-01-26 | 13F | Consolidated Portfolio Review Corp | 0 | -100,00 | 0 | |||||
| 2026-04-08 | 13F | E Fund Management (Hong Kong) Co., Ltd. | 1.887 | 119,42 | 235 | 95,83 | ||||
| 2026-02-17 | 13F | Edmond De Rothschild Holding S.a. | 56 | 9 | ||||||
| 2026-02-06 | 13F | Van Hulzen Asset Management, LLC | 1.388 | -50,04 | 211 | -76,54 | ||||
| 2026-02-17 | 13F | Graham Capital Management, L.P. | Put | 4.160.600 | -1,81 | 632.203 | -53,69 | |||
| 2026-02-17 | 13F | Graham Capital Management, L.P. | 1.452 | 17,57 | 221 | -44,58 | ||||
| 2026-01-27 | 13F | Prasad Wealth Partners, LLC | 0 | -100,00 | 0 | -100,00 | ||||
| 2026-02-10 | 13F | Thoroughbred Financial Services, Llc | 2.314 | 223,64 | 0 | |||||
| 2026-02-17 | 13F | Signature Equity Partners, LLC | 33 | 5 | ||||||
| 2026-02-02 | 13F | Pittenger & Anderson Inc | 20 | 3 | ||||||
| 2026-04-13 | 13F | Cyndeo Wealth Partners, LLC | 3.009 | 9,74 | 376 | -9,86 | ||||
| 2026-02-17 | 13F | Family Management Corp | 0 | -100,00 | 0 | |||||
| 2026-02-03 | 13F | ASR Vermogensbeheer N.V. | 22.631 | -0,85 | 3.439 | -53,25 | ||||
| 2026-02-05 | 13F | Atria Investments Llc | 0 | -100,00 | 0 | |||||
| 2026-01-15 | 13F | J. Safra Sarasin Holding AG | 1.889 | 287 | ||||||
| 2026-01-22 | 13F | Fiduciary Planning LLC | 0 | -100,00 | 0 | |||||
| 2026-02-02 | 13F | Horizon Investments, LLC | 871 | 132 | ||||||
| 2026-02-13 | 13F | Bank Of Nova Scotia | 18.495 | 32,23 | 2.810 | -37,64 | ||||
| 2025-11-14 | 13F | Mount Yale Investment Advisors, LLC | 0 | -100,00 | 0 | -100,00 | ||||
| 2026-02-05 | 13F | Mesirow Financial Investment Management, Inc. | 0 | -100,00 | 0 | |||||
| 2026-02-12 | 13F | Lbmc Investment Advisors, Llc | 1.840 | -2,70 | 280 | -54,19 | ||||
| 2026-01-23 | 13F | Rsm Us Wealth Management Llc | 6.359 | 11,56 | 990 | -46,13 | ||||
| 2026-02-04 | 13F | Fourth Dimension Wealth, LLC | 0 | -100,00 | 0 | |||||
| 2026-02-13 | 13F | Baird Financial Group, Inc. | 1.476 | -81,90 | 224 | -91,47 | ||||
| 2026-02-20 | 13F/A | CMT Capital Markets Trading GmbH | Put | 25.800 | -60,19 | 4 | -85,00 | |||
| 2026-02-20 | 13F/A | CMT Capital Markets Trading GmbH | Call | 25.400 | -31,90 | 4 | -75,00 | |||
| 2026-02-03 | 13F | Falcon Wealth Planning | 0 | -100,00 | 0 | |||||
| 2026-02-13 | 13F | Evelyn Partners Investment Management Services Ltd | 387 | 5.428,57 | 59 | 2.800,00 | ||||
| 2026-02-12 | 13F | Rossby Financial, LCC | 1.210 | 0,58 | 184 | -55,04 | ||||
| 2026-02-17 | 13F | Strive Financial Group ,LLC | 30 | 5 | ||||||
| 2026-02-17 | 13F | Mpwm Advisory Solutions, Llc | 0 | -100,00 | 0 | |||||
| 2026-04-10 | 13F/A | OP Asset Management Ltd | 26.657 | -8,20 | 3.327 | -24,61 | ||||
| 2026-02-17 | 13F | Investment Management Corp of Ontario | 23.197 | 89,91 | 3.525 | -10,44 | ||||
| 2026-02-13 | 13F | First Trust Advisors Lp | 608.328 | 47,42 | 92.435 | -30,48 | ||||
| 2026-01-21 | 13F | Stone House Investment Management, LLC | 0 | -100,00 | 0 | |||||
| 2026-01-27 | 13F | Vestia Personal Wealth Advisors | 0 | -100,00 | 0 | |||||
| 2026-01-27 | 13F | Tred Avon Family Wealth, Llc | 8.906 | -8,82 | 1.353 | -57,01 | ||||
| 2026-02-03 | 13F | Legacy Wealth Managment, LLC/ID | 1.428 | -80,91 | 217 | -91,04 | ||||
| 2026-02-13 | 13F | PYA Waltman Capital, LLC | 1.625 | 111,04 | 247 | -0,81 | ||||
| 2026-02-17 | 13F | National Asset Management, Inc. | 4.699 | -6,43 | 714 | -55,87 | ||||
| 2026-02-10 | 13F | Gulf International Bank (UK) Ltd | 13.249 | 0,00 | 2 | -50,00 | ||||
| 2026-01-27 | 13F | Bonfire Financial | 4.205 | 3,39 | 639 | -51,30 | ||||
| 2026-02-13 | 13F | Verition Fund Management LLC | Call | 0 | -100,00 | 0 | -100,00 | |||
| 2026-01-30 | 13F | Yong Rong (HK) Asset Management Ltd | Call | 3.000 | 0 | |||||
| 2026-02-13 | 13F | Kayne Anderson Rudnick Investment Management Llc | 44 | 1.366,67 | 7 |