Grundlæggende statistik
| Institutionelle aktier (lange) | 122.935.883 - 89,04% (ex 13D/G) - change of -20,26MM shares -14,14% MRQ |
| Institutionel værdi (lang) | $ 4.649.397 USD ($1000) |
Institutionelt ejerskab og aktionærer
Lamb Weston Holdings, Inc. (US:LW) har 618 institutionelle ejere og aktionærer, der har indsendt 13D/G- eller 13F-formularer til Securities Exchange Commission (SEC). Disse institutioner har i alt 122,935,883 aktier. Største aktionærer omfatter Vanguard Group Inc, BlackRock, Inc., Price T Rowe Associates Inc /md/, Jpmorgan Chase & Co, State Street Corp, JANA Partners Management, LP, Geode Capital Management, Llc, Invesco Ltd., Norges Bank, and Capital Research Global Investors .
Lamb Weston Holdings, Inc. (NYSE:LW) institutionel ejerskabsstruktur viser aktuelle positioner i virksomheden efter institutioner og fonde, samt seneste ændringer i positionsstørrelse. Større aktionærer kan omfatte individuelle investorer, investeringsforeninger, hedgefonde eller institutioner. Skema 13D angiver, at investoren besidder (eller besidder) mere end 5 % af virksomheden og har til hensigt (eller har til hensigt at) aktivt at forfølge en ændring i forretningsstrategi. Skema 13G indikerer en passiv investering på over 5%.
The share price as of April 24, 2026 is 44,32 / share. Previously, on April 28, 2025, the share price was 51,75 / share. This represents a decline of 14,36% over that period.

Fondens stemningsscore
Fund Sentiment Score (fka Ownership Accumulation Score) finder de aktier, der bliver mest købt af fonde. Det er resultatet af en sofistikeret, multi-faktor kvantitativ model, der identificerer virksomheder med de højeste niveauer af institutionel akkumulering. Scoringsmodellen bruger en kombination af den samlede stigning i oplyste ejere, ændringerne i porteføljeallokeringer i disse ejere og andre målinger. Tallet går fra 0 til 100, hvor højere tal indikerer et højere niveau af akkumulering for sine jævnaldrende, og 50 er gennemsnittet.
Opdateringsfrekvens: Dagligt
Se Ownership Explorer, som giver en liste over højest rangerende virksomheder.
AI+ Ask Fintel’s AI assistant about Lamb Weston Holdings, Inc..
Select a question to share a public post with an AI-crafted answer.
Thinking of good questions…
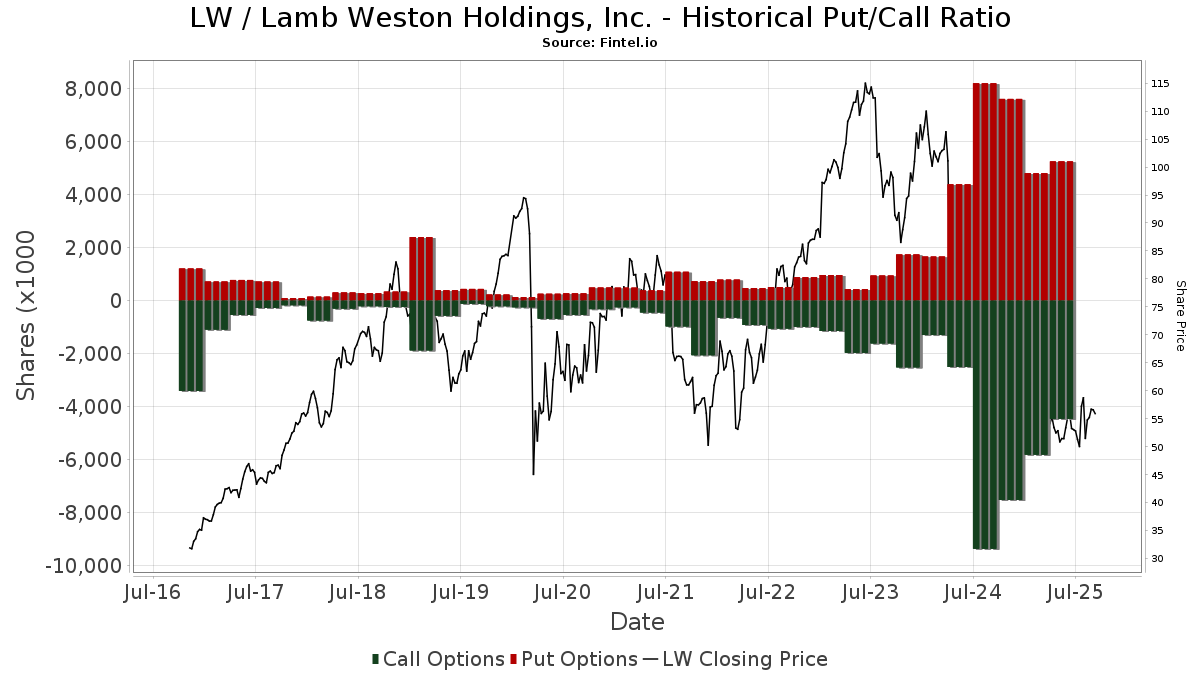
Institutionel Put/Call-forhold
Ud over at indberette standardaktie- og gældsudstedelser skal institutter med mere end 100 mill. aktiver under forvaltning også oplyse deres put- og call-optionsbeholdninger. Da salgsoptioner generelt indikerer negativ stemning, og købsoptioner indikerer positiv stemning, kan vi få en fornemmelse af den overordnede institutionelle stemning ved at plotte forholdet mellem put og kald. Diagrammet til højre viser det historiske put/call-forhold for dette instrument.
Brug af Put/Call Ratio som en indikator for investorernes stemning overvinder en af de vigtigste mangler ved at bruge totalt institutionelt ejerskab, som er, at en betydelig mængde af aktiver under forvaltning investeres passivt for at spore indekser. Passivt forvaltede fonde køber typisk ikke optioner, så indikatoren for put/call-forholdet følger mere nøje følelsen af aktivt forvaltede fonde.
13D/G-arkivering
Vi præsenterer 13D/G ansøgninger separat fra 13F ansøgninger på grund af den forskellige behandling af SEC. 13D/G-ansøgninger kan indgives af grupper af investorer (med én ledende), hvorimod 13F-ansøgninger ikke kan. Dette resulterer i situationer, hvor en investor kan indsende en 13D/G, der rapporterer én værdi for de samlede aktier (der repræsenterer alle de aktier, der ejes af investorgruppen), men derefter indsender en 13F, der rapporterer en anden værdi for de samlede aktier (der udelukkende repræsenterer deres egne) ejendomsret). Det betyder, at aktieejerskab af 13D/G-arkiver og 13F-arkiveringer ofte ikke er direkte sammenlignelige, så vi præsenterer dem separat.
Bemærk: Fra den 16. maj 2021 viser vi ikke længere ejere, der ikke har indsendt en 13D/G inden for det seneste år. Tidligere viste vi den fulde historie af 13D/G-arkiver. Generelt skal enheder, der er forpligtet til at indgive 13D/G-ansøgninger, indgive mindst årligt, før de indsender en afsluttende ansøgning. Dog forlader fonde nogle gange positioner uden at indsende en afsluttende ansøgning (dvs. de afvikler), så visning af den fulde historie resulterede nogle gange i forvirring om det nuværende ejerskab. For at undgå forvirring viser vi nu kun 'aktuelle' ejere - det vil sige - ejere, der har anmeldt inden for det seneste år.
Upgrade to unlock premium data.
| Fil dato | Form | Investor | Forrige Aktier |
Seneste Aktier |
Δ Aktier (Procent) |
Ejendomsret (Procent) |
Δ Ejerskab (Procent) |
|
|---|---|---|---|---|---|---|---|---|
| 2026-02-17 | PRICE T ROWE ASSOCIATES INC /MD/ | 7,712,816 | 9,824,721 | 27.38 | 7.10 | 29.09 | ||
| 2026-01-16 | JPMORGAN CHASE & CO | 7,070,793 | 5.00 | |||||
| 2025-08-06 | FMR LLC | 7,770,029 | 5,919,815 | -23.81 | 4.20 | -22.22 | ||
| 2025-07-01 | JANA Partners Management, LP | 7,557,519 | 6,957,519 | -7.94 | 4.90 | -9.26 | ||
| 2025-07-01 | CONTINENTAL GRAIN CO | 2,134,080 | 2,134,080 | 0.00 | 1.50 | 0.00 | ||
| 2025-04-17 | BlackRock, Inc. | 12,540,240 | 8,891,160 | -29.10 | 6.20 | -29.55 |
13F og NPORT arkivering
Detaljer om 13F-arkivering er gratis. Detaljer om NP-ansøgninger kræver et premium-medlemskab. Grønne rækker angiver nye positioner. Røde rækker angiver lukkede positioner. Klik på linket ikon for at se den fulde transaktionshistorik.
Opgrader
for at låse premium-data op og eksportere til Excel ![]() .
.
Important Note
In an effort to reduce load times for our mobile users, we are testing some ways to deliver lighter pages.
In this first test, we will deliver only the most recent 750 transactions (out of 870 for this stock). If you are interested in loading *all* the transactions for this company, click the "load all" button below. This is just a test and if you don't like it, please let us know by submitting some gentle feedback via the link at the bottom of this page.
Load All| Fil dato | Kilde | Investor | Type | Gennemsnitlig pris (Øst) |
Aktier | Δ Aktier (%) |
Rapporteret Værdi ($1000) |
Δ Værdi (%) |
Port Alloc (%) |
|
|---|---|---|---|---|---|---|---|---|---|---|
| 2026-01-23 | 13F | Carnegie Capital Asset Management, LLC | 10.356 | 146,57 | 434 | 78,19 | ||||
| 2026-02-04 | 13F | Swiss Life Asset Management Ltd | 7.329 | 22,64 | 307 | -11,53 | ||||
| 2026-02-17 | 13F | Captrust Financial Advisors | 28.146 | 20,94 | 1.179 | -12,73 | ||||
| 2026-02-17 | 13F | Parallax Volatility Advisers, L.P. | 1.627 | -97,59 | 68 | -98,26 | ||||
| 2026-02-17 | 13F | NEOS Investment Management LLC | 15.092 | 19,64 | 632 | -13,66 | ||||
| 2025-11-06 | 13F | IMA Wealth, Inc. | 0 | -100,00 | 0 | |||||
| 2025-11-20 | 13F | Asset Dedication, LLC | 0 | -100,00 | 0 | |||||
| 2026-02-17 | 13F | Clearline Capital LP | 0 | -100,00 | 0 | |||||
| 2026-02-13 | 13F | Candriam Luxembourg S.C.A. | 43.274 | 1.813 | ||||||
| 2026-02-05 | 13F | Cambridge Investment Research Advisors, Inc. | 34.689 | 175,31 | 1 | |||||
| 2026-02-05 | 13F | Td Private Client Wealth Llc | 13.150 | 3,36 | 551 | -25,47 | ||||
| 2026-02-05 | 13F | Qsemble Capital Management, LP | 0 | -100,00 | 0 | |||||
| 2026-02-17 | 13F | Parallax Volatility Advisers, L.P. | Call | 50.000 | 2.094 | |||||
| 2026-02-11 | 13F | Ing Groep Nv | 18.009 | 754 | ||||||
| 2026-04-03 | 13F | Investors Research Corp | 26.025 | 36,79 | 1.100 | 38,07 | ||||
| 2026-02-06 | 13F | Larson Financial Group LLC | 974 | 2,20 | 41 | -27,27 | ||||
| 2025-11-12 | 13F | Transce3nd, LLC | 0 | -100,00 | 0 | |||||
| 2026-04-15 | 13F | Ai Financial Services Llc | 15.852 | 20,92 | 670 | 21,86 | ||||
| 2026-04-14 | 13F | Zrc Wealth Management, Llc | 8 | -84,31 | 0 | -100,00 | ||||
| 2026-04-15 | 13F | FNY Investment Advisers, LLC | 2.700 | -2,88 | 0 | |||||
| 2026-02-11 | 13F | T3 Companies, LLC | 5.600 | 235 | ||||||
| 2026-04-15 | 13F | Hartford Financial Management Inc. | 466 | 0,00 | 20 | 0,00 | ||||
| 2026-02-13 | 13F | Caxton Associates Llp | 0 | -100,00 | 0 | |||||
| 2025-11-14 | 13F | Hrt Financial Lp | 0 | -100,00 | 0 | -100,00 | ||||
| 2026-04-15 | 13F | Fortitude Family Office, LLC | 99 | 125,00 | 4 | 300,00 | ||||
| 2026-02-13 | 13F | Williams Jones Wealth Management, LLC. | 8.621 | 0,00 | 361 | -27,80 | ||||
| 2026-04-24 | 13F | Eagle Bay Advisors LLC | 0 | -100,00 | 0 | |||||
| 2026-02-17 | 13F | Gotham Asset Management, LLC | 136.574 | -12,75 | 5.721 | -37,07 | ||||
| 2026-02-05 | 13F | IMG Wealth Management, Inc. | 0 | -100,00 | 0 | |||||
| 2026-02-12 | 13F | Fuller & Thaler Asset Management, Inc. | 0 | -100,00 | 0 | |||||
| 2026-01-07 | 13F | Aventura Private Wealth, LLC | 150 | 6 | ||||||
| 2026-04-23 | 13F | Exeter Financial, LLC | 12.497 | -1,75 | 528 | -0,75 | ||||
| 2025-11-14 | 13F | Ilex Capital Partners (UK) LLP | 0 | -100,00 | 0 | -100,00 | ||||
| 2026-02-09 | 13F | MTM Investment Management, LLC | 233 | 0,00 | 10 | -30,77 | ||||
| 2026-02-11 | 13F | MCF Advisors LLC | 649 | 44,22 | 27 | 3,85 | ||||
| 2026-02-12 | 13F | JPL Wealth Management, LLC | 0 | -100,00 | 0 | |||||
| 2026-02-17 | 13F | Jones Financial Companies Lllp | 5.066 | -14,87 | 212 | -35,37 | ||||
| 2025-11-14 | 13F | Binnacle Investments Inc | 9 | 1 | ||||||
| 2026-02-13 | 13F | Rafferty Asset Management, LLC | 11.671 | -1,76 | 489 | -29,17 | ||||
| 2026-02-12 | 13F | South Dakota Investment Council | 84.981 | -23,45 | 4 | -50,00 | ||||
| 2025-11-14 | 13F | Nomura Holdings Inc | Put | 0 | -100,00 | 0 | -100,00 | |||
| 2026-01-28 | 13F | Klp Kapitalforvaltning As | 32.000 | 8,11 | 1.340 | -22,05 | ||||
| 2026-02-10 | 13F | Nomura Asset Management Co Ltd | 4.580 | 14,24 | 192 | -17,67 | ||||
| 2026-02-13 | 13F | Edgestream Partners, L.P. | 0 | -100,00 | 0 | |||||
| 2026-02-17 | 13F | Canada Pension Plan Investment Board | 20.600 | -65,49 | 863 | -75,14 | ||||
| 2026-02-06 | 13F | Kimelman & Baird, LLC | 999 | 0,00 | 42 | -29,31 | ||||
| 2026-02-12 | 13F | Federated Hermes, Inc. | 4.447 | 45,76 | 186 | 5,08 | ||||
| 2026-02-10 | 13F | Rothschild Investment Llc | 3.692 | -15,94 | 155 | -39,61 | ||||
| 2026-02-17 | 13F | Boothbay Fund Management, Llc | 0 | -100,00 | 0 | |||||
| 2026-02-17 | 13F | Delaware Management Holdings, Inc. | 1.685.085 | 70.589 | ||||||
| 2026-02-17 | 13F | Wiley Bros.-aintree Capital, Llc | 25.492 | 3,02 | 1.049 | -26,80 | ||||
| 2026-04-22 | 13F | Janney Montgomery Scott LLC | 0 | -100,00 | 0 | |||||
| 2026-04-22 | 13F | Romano Brothers And Company | 13.061 | -2,30 | 552 | -1,61 | ||||
| 2026-01-28 | 13F | Mowery & Schoenfeld Wealth Management, LLC | 25 | 1 | ||||||
| 2026-02-11 | 13F | Franklin Resources Inc | 9.659 | -6,90 | 405 | -32,89 | ||||
| 2025-11-13 | 13F | Riggs Asset Managment Co. Inc. | 0 | -100,00 | 0 | |||||
| 2026-02-17 | 13F | Lombard Odier Asset Management (Europe) Ltd | 82.266 | -72,55 | 3.446 | -53,86 | ||||
| 2026-02-12 | 13F | Jane Street Group, Llc | Call | 372.800 | -23,54 | 15.617 | -44,86 | |||
| 2026-02-03 | 13F | Enhancing Capital LLC | 0 | -100,00 | 0 | -100,00 | ||||
| 2026-02-12 | 13F | Jane Street Group, Llc | 17.447 | -82,05 | 731 | -87,07 | ||||
| 2026-02-12 | 13F | Jane Street Group, Llc | Put | 551.600 | 102,87 | 23.107 | 46,32 | |||
| 2026-04-17 | 13F | Krilogy Financial LLC | 4.844 | 212 | ||||||
| 2026-04-16 | 13F | Capital Advisors, Ltd. LLC | 134 | 0 | ||||||
| 2026-02-17 | 13F | Schonfeld Strategic Advisors LLC | 0 | -100,00 | 0 | -100,00 | ||||
| 2026-01-22 | 13F | V-Square Quantitative Management LLC | 3.305 | 138 | ||||||
| 2026-01-29 | 13F | Camelot Portfolios, LLC | 15.000 | 26,05 | 628 | -9,12 | ||||
| 2026-02-10 | 13F | Goldman Sachs Group Inc | 642.428 | 21,63 | 26.911 | -12,27 | ||||
| 2026-02-12 | 13F | California Public Employees Retirement System | 229.434 | 22,57 | 9.611 | -11,60 | ||||
| 2026-04-24 | 13F | Retirement Systems of Alabama | 0 | -100,00 | 0 | |||||
| 2026-02-17 | 13F | Aristeia Capital Llc | 12.065 | 505 | ||||||
| 2026-02-10 | 13F | Mutual Of America Capital Management Llc | 82.628 | -20,56 | 3.461 | -42,71 | ||||
| 2026-04-22 | 13F | Motco | 519 | 0,00 | 22 | 0,00 | ||||
| 2026-04-20 | 13F | Hilton Head Capital Partners, LLC | 50 | 0,00 | 2 | 0,00 | ||||
| 2026-02-17 | 13F | Nomura Holdings Inc | 52.224 | -52,25 | 2.188 | -65,57 | ||||
| 2025-11-14 | 13F | Interval Partners, LP | Call | 0 | -100,00 | 0 | -100,00 | |||
| 2026-02-13 | 13F | Manufacturers Life Insurance Company, The | 0 | -100,00 | 0 | |||||
| 2026-04-17 | 13F | Brown, Lisle/cummings, Inc. | 1.248 | 0,00 | 53 | 0,00 | ||||
| 2026-02-17 | 13F | Alphadyne Asset Management, LLC | Put | 12.000 | 503 | |||||
| 2026-02-09 | 13F | Arnhold LLC | 38.217 | 710,20 | 1.601 | 486,08 | ||||
| 2026-02-10 | 13F | Grandfield & Dodd, Llc | 213.409 | 26,39 | 8.940 | -8,84 | ||||
| 2026-02-17 | 13F | Norinchukin Bank, The | 7.147 | 3,33 | 299 | -25,44 | ||||
| 2026-01-26 | 13F | PFG Investments, LLC | 5.540 | -4,55 | 232 | -31,16 | ||||
| 2026-02-10 | 13F | Eurizon Capital SGR S.p.A. | 1.283 | 54 | ||||||
| 2026-01-30 | 13F | Mitsubishi UFJ Trust & Banking Corp | 6.350 | 266 | ||||||
| 2026-01-23 | 13F | Guidance Capital, Inc | 20.932 | 11,04 | 923 | -26,22 | ||||
| 2026-02-17 | 13F | Ivy Lane Capital Management, Llc | 27.000 | 1.131 | ||||||
| 2026-04-13 | 13F | True Wealth Design, LLC | 926 | 478,75 | 39 | 550,00 | ||||
| 2026-01-21 | 13F | Sound Income Strategies, LLC | 72 | 0,00 | 3 | -25,00 | ||||
| 2026-04-21 | 13F | Morey & Quinn Wealth Partners, LLC | 6.234 | 0,00 | 263 | 0,77 | ||||
| 2026-02-06 | 13F | Global Retirement Partners, LLC | 7.551 | 24,69 | 316 | -9,97 | ||||
| 2026-01-30 | 13F | Westhampton Capital, LLC | 0 | -100,00 | 0 | |||||
| 2026-02-05 | 13F | Amalgamated Bank | 27.496 | 4,99 | 1 | 0,00 | ||||
| 2026-02-11 | 13F | Twin Tree Management, LP | Call | 229.800 | 12,87 | 9.626 | -18,60 | |||
| 2026-02-11 | 13F | Twin Tree Management, LP | Put | 84.200 | -56,01 | 3.527 | -68,27 | |||
| 2026-02-13 | 13F | Heritage Wealth Advisors | 0 | -100,00 | 0 | |||||
| 2026-02-11 | 13F | Twin Tree Management, LP | 55.072 | 2.307 | ||||||
| 2026-02-13 | 13F | Mariner, LLC | 40.705 | 53,66 | 1.705 | 10,86 | ||||
| 2025-11-14 | 13F | Ion Asset Management Ltd. | 524.905 | -67,74 | 30.486 | -63,87 | ||||
| 2026-01-28 | 13F | WPG Advisers, LLC | 10 | 0,00 | 0 | |||||
| 2026-02-17 | 13F | Alphadyne Asset Management, LLC | 11.917 | 499 | ||||||
| 2026-02-17 | 13F | Alphadyne Asset Management, LLC | Call | 10.100 | 423 | |||||
| 2026-04-10 | 13F | Quaker Wealth Management, LLC | 2 | 0 | ||||||
| 2026-04-02 | 13F | Ares Financial Consulting, LLC | 36 | -60,44 | 1 | -66,67 | ||||
| 2026-02-17 | 13F | ISAM Funds (UK) Ltd | 0 | -100,00 | 0 | |||||
| 2026-02-04 | 13F | Oregon Public Employees Retirement Fund | 15.940 | 0,00 | 668 | -27,89 | ||||
| 2026-02-10 | 13F | Quantbot Technologies LP | 0 | -100,00 | 0 | |||||
| 2026-02-13 | 13F | Fieldview Capital Management, LLC | 0 | -100,00 | 0 | |||||
| 2026-04-15 | 13F | Douglas Lane & Associates, LLC | 1.430.629 | 17,86 | 60.458 | 18,90 | ||||
| 2026-02-13 | 13F | Prudential Financial Inc | 128.902 | 58,04 | 5.400 | 13,98 | ||||
| 2025-11-14 | 13F | WealthTrak Capital Management LLC | 0 | -100,00 | 0 | |||||
| 2026-02-13 | 13F | Fiduciary Trust Co | 0 | -100,00 | 0 | |||||
| 2026-02-17 | 13F | Gates Capital Management, Inc. | 0 | -100,00 | 0 | |||||
| 2026-02-11 | 13F | Rise Advisors, LLC | 0 | -100,00 | 0 | |||||
| 2026-02-17 | 13F | Advisory Services Network, LLC | 31.103 | 314,15 | 1.303 | 198,62 | ||||
| 2026-04-15 | 13F | Exchange Traded Concepts, Llc | 29.233 | 27,61 | 1.235 | 28,78 | ||||
| 2026-02-03 | 13F | Sumitomo Mitsui DS Asset Management Company, Ltd | 0 | -100,00 | 0 | |||||
| 2026-02-12 | 13F | Ensign Peak Advisors, Inc | 184.935 | -19,09 | 7.747 | -41,65 | ||||
| 2026-01-08 | 13F | Maridea Wealth Management LLC | 0 | -100,00 | 0 | -100,00 | ||||
| 2026-02-11 | 13F | Simplex Trading, Llc | Put | 102.600 | -62,92 | 4.298 | 26.756,25 | |||
| 2026-02-11 | 13F | Simplex Trading, Llc | 34.455 | 220,57 | 1.443 | |||||
| 2026-01-28 | 13F | Universal- Beteiligungs- und Servicegesellschaft mbH | 34.355 | -5,35 | 1.496 | -29,03 | ||||
| 2026-02-11 | 13F | Simplex Trading, Llc | Call | 62.500 | -8,22 | 2.618 | 87.166,67 | |||
| 2026-02-17 | 13F | London Co Of Virginia | 0 | -100,00 | 0 | |||||
| 2026-04-20 | 13F | State of Alaska, Department of Revenue | 76.185 | 321,77 | 3 | |||||
| 2026-04-20 | 13F | Kestra Private Wealth Services, Llc | 11.325 | -26,35 | 479 | -25,78 | ||||
| 2026-02-05 | 13F | Northwestern Mutual Investment Management Company, Llc | 4.452 | 0,23 | 186 | -27,63 | ||||
| 2026-02-17 | 13F | Clear Street Markets Llc | 206 | -13,81 | 9 | -38,46 | ||||
| 2026-02-13 | 13F | Parkside Financial Bank & Trust | 296 | 6,86 | 12 | -25,00 | ||||
| 2026-02-13 | 13F | Public Employees Retirement Association Of Colorado | 14.028 | 0,00 | 1 | |||||
| 2026-01-29 | 13F | Comerica Bank | 33.105 | -39,72 | 1.387 | -56,54 | ||||
| 2026-02-13 | 13F | Clarkston Capital Partners, LLC | 2.408.447 | -4,26 | 100.890 | -30,95 | ||||
| 2026-02-17 | 13F | Glenmede Trust Co Na | 5.871 | -6,82 | 246 | -26,87 | ||||
| 2025-11-10 | 13F | Mitsubishi UFJ Asset Management (UK) Ltd. | 0 | -100,00 | 0 | |||||
| 2026-02-06 | 13F | EverSource Wealth Advisors, LLC | 3.758 | 1,08 | 157 | -26,98 | ||||
| 2026-01-21 | 13F | Signature Resources Capital Management, LLC | 76 | 0,00 | 3 | -25,00 | ||||
| 2026-02-17 | 13F | Two Sigma Advisers, Lp | 0 | -100,00 | 0 | -100,00 | ||||
| 2026-02-18 | 13F | State of Tennessee, Treasury Department | 42.201 | 158,17 | 1.938 | 104,21 | ||||
| 2026-02-11 | 13F | SOUTH STATE Corp | 80 | 700,00 | 3 | |||||
| 2026-04-20 | 13F | Inscription Capital, LLC | 0 | -100,00 | 0 | |||||
| 2026-02-11 | 13F | Sunrise Financial Services, LLC | 14 | 1 | ||||||
| 2026-02-13 | 13F | Marshall Wace, Llp | 1.022.143 | 42.818 | ||||||
| 2026-02-17 | 13F | Mercer Global Advisors Inc /adv | 23.837 | 58,43 | 999 | 14,32 | ||||
| 2026-02-13 | 13F | Smartleaf Asset Management LLC | 247 | 8,33 | 10 | -16,67 | ||||
| 2026-04-27 | 13F | Y-Intercept (Hong Kong) Ltd | 0 | -100,00 | 0 | |||||
| 2026-01-23 | 13F | Sumitomo Mitsui Trust Holdings, Inc. | 7.155 | -0,67 | 300 | -28,47 | ||||
| 2026-02-10 | 13F | Parr Mcknight Wealth Management Group, Llc | 14.426 | -41,96 | 604 | -58,14 | ||||
| 2026-02-06 | 13F | Pnc Financial Services Group, Inc. | 27.372 | -5,17 | 1.147 | -31,62 | ||||
| 2026-04-23 | 13F | Farmers & Merchants Investments Inc | 1.232 | -5,52 | 52 | -3,70 | ||||
| 2026-04-14 | 13F | Cornerstone National Bank & Trust Co | 0 | -100,00 | 0 | |||||
| 2026-02-06 | 13F | Cullen/frost Bankers, Inc. | 54 | 0,00 | 2 | -33,33 | ||||
| 2026-02-13 | 13F | Level Four Advisory Services, Llc | 202.565 | 0,01 | 8.485 | -27,87 | ||||
| 2026-02-13 | 13F | JustInvest LLC | 11.781 | -1,22 | 494 | -29,17 | ||||
| 2026-02-12 | 13F | BRYN MAWR TRUST Co | 283 | -60,64 | 12 | -73,17 | ||||
| 2026-01-16 | 13F | First Pacific Financial | 0 | -100,00 | 0 | |||||
| 2026-02-13 | 13F | Kestra Advisory Services, LLC | 0 | -100,00 | 0 | |||||
| 2026-02-12 | 13F | Carson Advisory Inc. | 8.818 | 369 | ||||||
| 2026-02-17 | 13F | T. Rowe Price Investment Management, Inc. | 60.198 | 99,69 | 3 | 100,00 | ||||
| 2026-02-17 | 13F | Maryland State Retirement & Pension System | 6.641 | 0,00 | 278 | -27,79 | ||||
| 2026-03-17 | 13F | Stance Capital Llc | 0 | -100,00 | 0 | -100,00 | ||||
| 2026-02-10 | 13F | Envestnet Asset Management Inc | 765.320 | -0,39 | 32.059 | -28,15 | ||||
| 2026-04-23 | 13F | Private Wealth Management Group, LLC | 19 | 0,00 | 1 | |||||
| 2026-04-17 | 13F | Leeward Investments, LLC - MA | 130.614 | -3,33 | 5.520 | -2,47 | ||||
| 2026-02-13 | 13F | Sei Investments Co | 22.842 | 3,22 | 957 | -25,60 | ||||
| 2026-04-24 | 13F | Root Financial Partners, LLC | 572 | 226,86 | 24 | 242,86 | ||||
| 2026-04-23 | 13F | Harbor Investment Advisory, Llc | 176 | -63,64 | 7 | -65,00 | ||||
| 2026-02-13 | 13F | Rhumbline Advisers | 291.093 | -4,67 | 12.194 | -31,25 | ||||
| 2025-11-14 | 13F | Wolverine Trading, Llc | 36.365 | 55,34 | 2.024 | 61,92 | ||||
| 2026-02-10 | 13F | Evolution Wealth Management Inc. | 119 | 80,30 | 5 | 33,33 | ||||
| 2025-11-14 | 13F | Wolverine Trading, Llc | Call | 103.200 | -44,13 | 5.745 | -41,75 | |||
| 2025-11-14 | 13F | Wolverine Trading, Llc | Put | 214.100 | 83,62 | 11.919 | 91,42 | |||
| 2026-04-13 | 13F | Hm Payson & Co | 116 | 0,00 | 5 | 0,00 | ||||
| 2026-02-17 | 13F | Shay Capital LLC | 16.500 | 691 | ||||||
| 2026-04-13 | 13F | Trust Co | 1.154 | 0,79 | 49 | 2,13 | ||||
| 2026-02-10 | 13F | Norges Bank | 2.999.818 | 125.662 | ||||||
| 2026-01-21 | 13F | Raleigh Capital Management Inc. | 0 | 0 | ||||||
| 2026-02-17 | 13F | Woodline Partners LP | 21.208 | 15,27 | 888 | -16,85 | ||||
| 2026-04-13 | 13F | Clayton Financial Group LLC | 8 | -66,67 | 0 | -100,00 | ||||
| 2026-02-06 | 13F | Handelsbanken Fonder AB | 41.200 | -12,34 | 2 | -50,00 | ||||
| 2026-02-10 | 13F | Thompson Siegel & Walmsley Llc | 0 | -100,00 | 0 | |||||
| 2026-04-20 | 13F | Jfs Wealth Advisors, Llc | 64 | -73,33 | 3 | -80,00 | ||||
| 2026-02-05 | 13F | Tucker Asset Management Llc | 1.470 | 62 | ||||||
| 2026-02-03 | 13F | Crossmark Global Holdings, Inc. | 6.557 | 2,49 | 275 | -26,15 | ||||
| 2026-02-11 | 13F | Prestige Wealth Management Group LLC | 39 | -79,37 | 2 | -90,00 | ||||
| 2026-04-07 | 13F | Park Avenue Securities Llc | 0 | -100,00 | 0 | |||||
| 2026-02-13 | 13F | Great West Life Assurance Co /can/ | 62.764 | 57,36 | 3 | 0,00 | ||||
| 2026-01-30 | 13F | United Community Bank | 0 | -100,00 | 0 | |||||
| 2026-02-13 | 13F | Walleye Capital LLC | Put | 2.600 | -64,86 | 109 | -74,83 | |||
| 2026-02-13 | 13F | Walleye Capital LLC | 7.879 | 393.850,00 | 330 | |||||
| 2026-02-17 | 13F | Toronto Dominion Bank | 42.812 | 50,90 | 1.793 | 8,86 | ||||
| 2025-11-14 | 13F | Mbb Public Markets I Llc | 0 | -100,00 | 0 | |||||
| 2026-02-10 | 13F | State of Wyoming | 1.323 | 8,71 | 55 | -21,43 | ||||
| 2026-01-28 | 13F | Teacher Retirement System Of Texas | 6.318 | -64,15 | 265 | -74,19 | ||||
| 2026-02-12 | 13F | State Board Of Administration Of Florida Retirement System | 122.466 | -4,05 | 5.130 | -30,80 | ||||
| 2026-02-11 | 13F | Deutsche Bank Ag\ | 425.231 | 2,58 | 17.813 | -26,02 | ||||
| 2026-02-17 | 13F | SummitTX Capital, L.P. | 26.220 | 146,61 | 1.098 | 77,96 | ||||
| 2026-02-17 | 13F | JANA Partners Management, LP | 5.008.635 | 0,00 | 209.812 | -27,88 | ||||
| 2026-04-06 | 13F | Rosenberg Matthew Hamilton | 285 | 0,00 | 12 | 9,09 | ||||
| 2026-02-13 | 13F | Ubs Asset Management Americas Inc | 370.000 | -3,92 | 15.499 | -30,70 | ||||
| 2025-10-29 | 13F | Massachusetts Financial Services Co /ma/ | 0 | -100,00 | 0 | |||||
| 2026-01-27 | 13F | Summit Financial Wealth Advisors, LLC | 14.131 | 2,95 | 592 | -30,55 | ||||
| 2026-02-17 | 13F | Russell Investments Group, Ltd. | 230.359 | 9,20 | 9.650 | -21,24 | ||||
| 2026-02-05 | 13F | Thrivent Financial For Lutherans | 33.200 | 216,73 | 1 | |||||
| 2026-01-29 | 13F | State Of Michigan Retirement System | 36.532 | -3,18 | 1.530 | -30,17 | ||||
| 2026-02-06 | 13F | Tortoise Investment Management, LLC | 0 | -100,00 | 0 | |||||
| 2026-02-04 | 13F | Money Concepts Capital Corp | 41.618 | 11,78 | 1.743 | -19,38 | ||||
| 2026-02-17 | 13F | Brevan Howard Capital Management LP | 17.557 | -58,37 | 735 | -69,99 | ||||
| 2026-01-29 | 13F | Vanguard Group Inc | 16.679.203 | 0,26 | 698.692 | -27,69 | ||||
| 2026-04-17 | 13F | Hanson & Doremus Investment Management | 133 | 0 | ||||||
| 2026-02-10 | 13F | Principia Wealth Advisory, LLC | 1 | 0,00 | 0 | |||||
| 2026-01-21 | 13F | Oak Thistle LLC | 0 | -100,00 | 0 | |||||
| 2026-02-06 | 13F | Leonteq Securities AG | 3.060 | 241,14 | 128 | 146,15 | ||||
| 2026-04-23 | 13F | CWM Advisors, LLC | 23.123 | -19,48 | 977 | -18,72 | ||||
| 2026-02-06 | 13F | FourThought Financial Partners, LLC | 9.258 | 388 | ||||||
| 2026-02-11 | 13F | Los Angeles Capital Management Llc | 99.527 | 187,84 | 6.190 | 208,22 | ||||
| 2026-02-06 | 13F | Envestnet Portfolio Solutions, Inc. | 7.315 | 5,65 | 306 | -23,88 | ||||
| 2026-02-17 | 13F | ION Fund Management Ltd | 562.314 | 23.555 | ||||||
| 2026-01-29 | 13F | IMC-Chicago, LLC | 55.230 | 5,13 | 2.314 | -24,19 | ||||
| 2026-02-17 | 13F | Scientech Research LLC | 0 | -100,00 | 0 | |||||
| 2026-01-29 | 13F | IMC-Chicago, LLC | Put | 316.000 | -64,76 | 13.237 | -74,58 | |||
| 2026-01-29 | 13F | IMC-Chicago, LLC | Call | 299.300 | 150,67 | 12.538 | 80,80 | |||
| 2026-02-13 | 13F | Charles Schwab Investment Management Inc | 1.296.076 | 2,21 | 54.293 | -26,28 | ||||
| 2026-04-16 | 13F | Security National Bank | 612 | 0,00 | 26 | 0,00 | ||||
| 2026-04-21 | 13F | Pflug Koory, LLC | 774 | -7,86 | 33 | -8,57 | ||||
| 2026-02-13 | 13F | Walleye Capital LLC | Call | 0 | -100,00 | 0 | -100,00 | |||
| 2025-11-21 | 13F/A | CIBC Bancorp USA Inc. | 46.490 | 2.700 | ||||||
| 2026-01-30 | 13F | State of New Jersey Common Pension Fund D | 47.285 | -2,05 | 1.981 | -29,36 | ||||
| 2026-02-09 | 13F | Smithfield Trust Co | 318 | 0,00 | 0 | |||||
| 2026-02-17 | 13F | Jump Financial, LLC | 7.895 | 331 | ||||||
| 2026-02-11 | 13F | Zions Bancorporation, National Association /ut/ | 2.097 | 10.936,84 | 88 | 8.600,00 | ||||
| 2026-02-03 | 13F | Mitsubishi UFJ Kokusai Asset Management Co., Ltd. | 150.562 | 0,01 | 6.367 | -27,18 | ||||
| 2026-02-12 | 13F | Logan Capital Management Inc | 19.458 | -17,37 | 815 | -40,38 | ||||
| 2026-02-13 | 13F | Missouri Trust & Investment Co | 433 | 0,00 | 18 | -28,00 | ||||
| 2026-02-17 | 13F | Highland Capital Management Fund Advisors, L.p. | 0 | -100,00 | 0 | -100,00 | ||||
| 2026-02-13 | 13F | MAI Capital Management | 4.620 | -16,82 | 194 | -40,06 | ||||
| 2026-01-20 | 13F | Family Legacy Financial Solutions, LLC | 0 | -100,00 | 0 | |||||
| 2026-02-19 | 13F | Invesco Ltd. | 3.230.750 | -1,69 | 135.336 | -29,09 | ||||
| 2026-04-22 | 13F | Bravera Wealth | 0 | -100,00 | 0 | |||||
| 2026-04-21 | 13F | Pallas Capital Advisors LLC | 5.302 | 224 | ||||||
| 2026-01-12 | 13F | Rialto Wealth Management, LLC | 1 | -87,50 | 0 | |||||
| 2026-02-13 | 13F | Chevy Chase Trust Holdings, Inc. | 70.650 | -0,66 | 2.960 | -28,35 | ||||
| 2026-02-09 | 13F | Clear Investment Research, Llc | 0 | -100,00 | 0 | |||||
| 2026-04-24 | 13F | Profund Advisors Llc | 5.153 | 218 | ||||||
| 2026-02-05 | 13F | AlphaCore Capital LLC | 5.162 | 216 | ||||||
| 2025-11-04 | 13F | Westside Investment Management, Inc. | 0 | -100,00 | 0 | -100,00 | ||||
| 2026-02-13 | 13F | National Bank Of Canada /fi/ | 88.548 | 92,00 | 3.709 | 38,50 | ||||
| 2025-11-25 | 13F | Briaud Financial Planning, Inc | 0 | -100,00 | 0 | |||||
| 2026-02-13 | 13F | Colony Group, LLC | 22.718 | 953 | ||||||
| 2026-02-13 | 13F | Wells Fargo & Company/mn | 327.110 | -2,69 | 13.703 | -29,82 | ||||
| 2025-11-12 | 13F | Longfellow Investment Management Co Llc | 0 | -100,00 | 0 | |||||
| 2026-04-14 | 13F | Beacon Investment Advisory Services, Inc. | 5.653 | 239 | ||||||
| 2026-02-17 | 13F | Mirabella Financial Services Llp | 5.302 | 222 | ||||||
| 2026-02-13 | 13F | Neuberger Berman Group LLC | 31.459 | -92,81 | 1.318 | -94,82 | ||||
| 2026-02-13 | 13F | Bridgewater Associates, LP | 8.294 | -95,86 | 347 | -97,02 | ||||
| 2026-02-18 | 13F/A | Alberta Investment Management Corp | 210.000 | -41,41 | 8.797 | -57,74 | ||||
| 2026-02-10 | 13F | Axq Capital, Lp | 0 | -100,00 | 0 | |||||
| 2026-01-29 | 13F | D.a. Davidson & Co. | 41.016 | -45,14 | 1.718 | -60,43 | ||||
| 2026-02-10 | 13F/A | Northwestern Mutual Wealth Management Co | 5.210 | -2,21 | 218 | -29,45 | ||||
| 2026-02-17 | 13F | DoubleLine ETF Adviser LP | 7.704 | 3,86 | 323 | -25,12 | ||||
| 2026-04-15 | 13F | Merit Financial Group, LLC | 11.369 | 111,99 | 480 | 114,29 | ||||
| 2026-02-13 | 13F | Kilter Group LLC | 17 | 0,00 | 1 | |||||
| 2025-11-13 | 13F | Kentucky Retirement Systems Insurance Trust Fund | 0 | -100,00 | 0 | -100,00 | ||||
| 2025-11-17 | 13F | LGT Financial Advisors LLC | 0 | -100,00 | 0 | |||||
| 2026-02-11 | 13F | Gwn Securities Inc. | 47.944 | 10,12 | 2.008 | -20,85 | ||||
| 2026-01-26 | 13F | Greenwood Capital Associates Llc | 29.428 | 1.233 | ||||||
| 2026-02-04 | 13F | Nicholas Company, Inc. | 0 | -100,00 | 0 | |||||
| 2026-02-06 | 13F | Fortis Group Advisors, LLC | 15 | 0,00 | 1 | |||||
| 2026-02-13 | 13F | Toroso Investments, LLC | 52.709 | 52,96 | 2.208 | 10,29 | ||||
| 2026-02-13 | 13F | Wbi Investments, Inc. | 0 | -100,00 | 0 | -100,00 | ||||
| 2026-01-09 | 13F | Aull & Monroe Investment Management Corp | 0 | -100,00 | 0 | |||||
| 2026-02-13 | 13F | Harber Asset Management Llc | 0 | -100,00 | 0 | |||||
| 2025-10-30 | 13F | Osborne Partners Capital Management, Llc | 0 | -100,00 | 0 | |||||
| 2026-02-06 | 13F | Hardy Reed LLC | 5.169 | 0,00 | 217 | -28,00 | ||||
| 2026-01-27 | 13F | CenterStar Asset Management, LLC | Call | 0 | -100,00 | 0 | ||||
| 2026-02-04 | 13F | Tsfg, Llc | 68 | 0,00 | 0 | |||||
| 2026-01-20 | 13F | Cohen Klingenstein LLC | 0 | -100,00 | 0 | |||||
| 2026-02-17 | 13F | Man Group plc | 9.300 | -96,15 | 390 | -97,23 | ||||
| 2025-11-07 | 13F | Putney Financial Group LLC | 0 | -100,00 | 0 | |||||
| 2026-04-06 | 13F | CX Institutional | 7.040 | 627,27 | 0 | |||||
| 2026-02-09 | 13F | Harbour Investments, Inc. | 60.899 | 11.282,99 | 2.551 | 8.129,03 | ||||
| 2026-02-06 | 13F | Resona Asset Management Co.,Ltd. | 1.700 | 0,00 | 71 | -24,47 | ||||
| 2026-02-12 | 13F | SWAN Capital LLC | 1.825 | 0,00 | 76 | -27,62 | ||||
| 2026-01-23 | 13F | Steigerwald, Gordon & Koch Inc. | 133 | 0,00 | 6 | -28,57 | ||||
| 2026-02-05 | 13F | Staley Capital Advisers Inc | 25.000 | 1.047 | ||||||
| 2026-02-11 | 13F | Cerity Partners LLC | 20.463 | 16,19 | 857 | -16,14 | ||||
| 2026-02-13 | 13F | Hudson Bay Capital Management LP | 0 | -100,00 | 0 | |||||
| 2026-02-02 | 13F | Danske Bank A/s | 1.300 | 44,44 | 54 | 3,85 | ||||
| 2026-02-12 | 13F | Quadrant Capital Group Llc | 201 | 0,00 | 8 | -27,27 | ||||
| 2026-04-24 | 13F | Yousif Capital Management, Llc | 40.589 | 135,74 | 1.715 | 128,97 | ||||
| 2026-04-14 | 13F | Banque Pictet & Cie Sa | 0 | -100,00 | 0 | |||||
| 2025-11-14 | 13F | Centiva Capital, LP | Call | 0 | -100,00 | 0 | -100,00 | |||
| 2026-02-12 | 13F | UniSuper Management Pty Ltd | 27.887 | -13,94 | 1.168 | -37,94 | ||||
| 2026-04-15 | 13F | Activest Wealth Management | 106 | -56,20 | 4 | -60,00 | ||||
| 2026-02-17 | 13F | Polymer Capital Management (US) LLC | 27.092 | 1.135 | ||||||
| 2026-02-17 | 13F | Trexquant Investment LP | 108.755 | 106,45 | 4.556 | 48,90 | ||||
| 2026-02-03 | 13F | Morse Asset Management, Inc | 33 | 0,00 | 1 | 0,00 | ||||
| 2025-11-14 | 13F | ExodusPoint Capital Management, LP | 11.430 | -45,02 | 664 | 66.200,00 | ||||
| 2026-04-22 | 13F | Adams Diversified Equity Fund, Inc. | 0 | -100,00 | 0 | |||||
| 2026-01-27 | 13F | First Horizon Corp | 28 | 300,00 | 1 | |||||
| 2026-02-13 | 13F | Walleye Trading LLC | 26.348 | 44,85 | 1.104 | 4,45 | ||||
| 2026-02-13 | 13F | Walleye Trading LLC | Put | 39.600 | -62,68 | 1.659 | -73,09 | |||
| 2026-02-13 | 13F | Walleye Trading LLC | Call | 113.700 | 16,14 | 4.763 | -16,25 | |||
| 2026-02-12 | 13F | Benson Wealth Management INC | 37 | 2 | ||||||
| 2026-04-22 | 13F | WestEnd Advisors, LLC | 0 | -100,00 | 0 | |||||
| 2026-02-18 | 13F | Mackenzie Financial Corp | 19.120 | 6,48 | 801 | -23,22 | ||||
| 2026-04-15 | 13F | Murphy, Middleton, Hinkle & Parker, Inc. | 0 | -100,00 | 0 | |||||
| 2026-02-13 | 13F | Van Eck Associates Corp | 113.511 | 56,29 | 5 | 0,00 | ||||
| 2026-04-20 | 13F | Assenagon Asset Management S.A. | 160.610 | 14,04 | 6.787 | 15,05 | ||||
| 2026-02-13 | 13F | Morgan Stanley | 1.881.007 | -9,39 | 78.795 | -34,65 | ||||
| 2026-02-12 | 13F | Skandinaviska Enskilda Banken AB (publ) | 0 | -100,00 | 0 | |||||
| 2026-02-09 | 13F | Huntington National Bank | 67.056 | 0,28 | 2.809 | -27,68 | ||||
| 2025-11-14 | 13F | Toronto Dominion Bank | Call | 0 | -100,00 | 0 | -100,00 | |||
| 2026-02-17 | 13F | Guggenheim Capital Llc | 65.829 | -19,95 | 2.758 | -42,27 | ||||
| 2026-02-12 | 13F | Cloud Capital Management, LLC | 0 | -100,00 | 0 | |||||
| 2026-02-17 | 13F | Auxier Asset Management | 0 | -100,00 | 0 | |||||
| 2026-01-15 | 13F | Allspring Global Investments Holdings, LLC | 5.594 | -4,23 | 237 | -34,81 | ||||
| 2026-01-23 | 13F | Cambiar Investors Llc | 69.710 | -16,54 | 2.920 | -39,81 | ||||
| 2026-02-03 | 13F | Carlson Capital L P | 19.200 | 804 | ||||||
| 2026-04-21 | 13F | Financial Consulate, Inc | 0 | -100,00 | 0 | |||||
| 2026-04-14 | 13F | Banque de Luxembourg S.A. | 779 | 89,54 | 33 | 88,24 | ||||
| 2026-02-06 | 13F | Gsa Capital Partners Llp | 0 | -100,00 | 0 | |||||
| 2026-02-18 | 13F | Vermillion & White Wealth Management Group, LLC | 0 | -100,00 | 0 | |||||
| 2025-11-12 | 13F | Headlands Technologies LLC | 0 | -100,00 | 0 | |||||
| 2026-04-23 | 13F | Oppenheimer & Co Inc | 33.783 | -2,21 | 1.428 | -1,38 | ||||
| 2026-02-17 | 13F | Banco Bilbao Vizcaya Argentaria, S.a. | 0 | -100,00 | 0 | |||||
| 2026-02-05 | 13F | WealthPlan Investment Management, LLC | 5.745 | 3,66 | 241 | -25,23 | ||||
| 2026-02-13 | 13F | Quinn Opportunity Partners LLC | 30.100 | 49,75 | 1.261 | 7,97 | ||||
| 2025-10-29 | 13F | Smith Thornton Advisors LLC | 0 | -100,00 | 0 | -100,00 | ||||
| 2026-03-03 | 13F/A | Caitong International Asset Management Co., Ltd | 43 | 2 | ||||||
| 2026-02-13 | 13F | Royal London Asset Management Ltd | 1.068.987 | 6,31 | 44.780 | -23,33 | ||||
| 2026-04-07 | 13F | First Financial Corp /in/ | 1.364 | 0,00 | 58 | 0,00 | ||||
| 2026-04-23 | 13F | American National Bank | 475 | -5,75 | 20 | -4,76 | ||||
| 2026-02-17 | 13F | Aqr Capital Management Llc | 453.677 | 80,63 | 19.005 | 30,28 | ||||
| 2026-04-23 | 13F | J.w. Cole Advisors, Inc. | 0 | -100,00 | 0 | |||||
| 2025-11-14 | 13F | Point72 Europe (London) LLP | 567 | 33 | ||||||
| 2026-02-05 | 13F | New York Life Investment Management Llc | 31.103 | -6,04 | 1.303 | -32,26 | ||||
| 2026-02-11 | 13F | Jpmorgan Chase & Co | Put | 0 | -100,00 | 0 | -100,00 | |||
| 2026-02-13 | 13F | Pin Oak Investment Advisors Inc | 150 | 0,00 | 0 | -100,00 | ||||
| 2026-02-17 | 13F | Bank Of America Corp /de/ | 1.079.157 | -0,91 | 45.206 | -28,54 | ||||
| 2026-04-10 | 13F | Armstrong Advisory Group, Inc | 0 | -100,00 | 0 | |||||
| 2026-01-28 | 13F | DekaBank Deutsche Girozentrale | 113.557 | 0,00 | 11 | 66,67 | ||||
| 2026-04-13 | 13F | Salem Investment Counselors Inc | 87 | 4 | ||||||
| 2026-02-11 | 13F | Strategic Advocates LLC | 78 | 0,00 | 3 | -25,00 | ||||
| 2026-02-17 | 13F | Weiss Asset Management LP | 54.579 | 2.286 | ||||||
| 2025-11-17 | 13F | Kestra Investment Management, LLC | 0 | -100,00 | 0 | |||||
| 2026-02-12 | 13F | Swiss National Bank | 261.000 | 0,42 | 10.933 | -27,57 | ||||
| 2026-02-17 | 13F | Humankind Investments LLC | 0 | -100,00 | 0 | |||||
| 2026-02-17 | 13F | Parallax Volatility Advisers, L.P. | Put | 0 | -100,00 | 0 | ||||
| 2025-11-13 | 13F | Bank Of Montreal /can/ | Call | 0 | -100,00 | 0 | -100,00 | |||
| 2026-02-02 | 13F | Fifth Third Bancorp | 7.295 | 2,54 | 306 | -26,15 | ||||
| 2026-02-04 | 13F | Clark Wealth Partners | 0 | -100,00 | 0 | -100,00 | ||||
| 2025-11-07 | 13F | PARK CIRCLE Co | 0 | -100,00 | 0 | -100,00 | ||||
| 2026-02-13 | 13F | Victory Capital Management Inc | 89.764 | 357,89 | 3.760 | 230,40 | ||||
| 2026-02-17 | 13F | Cape Investment Advisory, Inc. | 273 | 133,33 | 11 | 83,33 | ||||
| 2026-02-13 | 13F | Okabena Investment Services Inc | 24.358 | 0,00 | 1.020 | -27,86 | ||||
| 2026-02-17 | 13F | California State Teachers Retirement System | 125.770 | -0,18 | 5.269 | -28,01 | ||||
| 2026-01-29 | 13F | Teachers Retirement System Of The State Of Kentucky | 11.157 | 0,00 | 0 | |||||
| 2026-01-15 | 13F | Nisa Investment Advisors, Llc | 47.372 | -4,25 | 1.984 | -30,94 | ||||
| 2026-02-17 | 13F | Tudor Investment Corp Et Al | Put | 28.400 | -32,22 | 1.190 | -51,13 | |||
| 2026-02-17 | 13F | Tudor Investment Corp Et Al | Call | 69.000 | 35,29 | 2.890 | -2,43 | |||
| 2026-02-09 | 13F/A | Swedbank AB | 914.000 | 1,91 | 38.287 | -26,50 | ||||
| 2026-02-17 | 13F | Tudor Investment Corp Et Al | 59.252 | -62,72 | 2.482 | -73,11 | ||||
| 2026-02-06 | 13F | Covestor Ltd | 425 | 105,31 | 0 | |||||
| 2026-02-05 | 13F | May Hill Capital, LLC | 5.098 | 214 | ||||||
| 2026-02-13 | 13F | Police & Firemen's Retirement System of New Jersey | 56.508 | -5,35 | 2.367 | -31,73 | ||||
| 2026-02-04 | 13F | LRI Investments, LLC | 125 | -34,55 | 5 | -54,55 | ||||
| 2025-10-28 | 13F | Avantra Family Wealth, Inc. | 0 | -100,00 | 0 | -100,00 | ||||
| 2026-01-16 | 13F | Standard Life Aberdeen plc | 8.098 | 0,00 | 339 | -24,67 | ||||
| 2026-02-13 | 13F | Healthcare Of Ontario Pension Plan Trust Fund | 44.847 | 712,89 | 1.879 | 486,88 | ||||
| 2026-04-07 | 13F | Retirement Wealth Solutions LLC | 4 | 0 | ||||||
| 2026-02-10 | 13F | Commonwealth Of Pennsylvania Public School Empls Retrmt Sys | 32.414 | -3,14 | 1.358 | -30,16 | ||||
| 2026-02-05 | 13F | Dana Investment Advisors, Inc. | 89.991 | 44,78 | 3.770 | 4,40 | ||||
| 2026-02-11 | 13F | Financiere des Professionnels - Fonds d,investissement inc. | 2.300 | 0,00 | 96 | -27,82 | ||||
| 2026-02-02 | 13F | Millstone Evans Group, LLC | 112 | 0,00 | 5 | -33,33 | ||||
| 2026-04-20 | 13F | Naples Global Advisors, Llc | 23.865 | -1,43 | 1.009 | -0,59 | ||||
| 2026-02-02 | 13F | Acorn Creek Capital Llc | 10.179 | -0,05 | 426 | -27,92 | ||||
| 2026-02-17 | 13F | Cooper Creek Partners Management Llc | 641.556 | 27 | ||||||
| 2026-02-13 | 13F | Transamerica Financial Advisors, Inc. | 1.130 | 47 | ||||||
| 2026-04-09 | 13F | Park Place Capital Corp | 1.569 | 66 | ||||||
| 2026-02-03 | 13F | We Are One Seven, LLC | 0 | -100,00 | 0 | |||||
| 2026-02-17 | 13F | Two Sigma Investments, Lp | 84.947 | -85,52 | 3.558 | -89,55 | ||||
| 2026-02-17 | 13F | Anson Funds Management LP | 149.187 | 36,63 | 6.249 | -1,45 | ||||
| 2026-02-12 | 13F | Xponance, Inc. | 35.393 | 225,30 | 1.483 | 134,87 | ||||
| 2026-02-17 | 13F | Dark Forest Capital Management Lp | 62.407 | 2.614 | ||||||
| 2026-02-17 | 13F | Capital Fund Management S.a. | Call | 60.600 | -2,57 | 2.539 | -29,73 | |||
| 2025-11-24 | 13F | Burkett Financial Services, Llc | 0 | -100,00 | 0 | -100,00 | ||||
| 2026-02-17 | 13F | Capital Fund Management S.a. | Put | 73.700 | -58,80 | 3.087 | -70,29 | |||
| 2025-11-04 | 13F | Gibbs Wealth Management | 0 | -100,00 | 0 | |||||
| 2026-04-13 | 13F | Mather Group, Llc. | 320 | 14 | ||||||
| 2026-02-12 | 13F | Colonial Trust Advisors | 116 | 0,00 | 5 | -33,33 | ||||
| 2026-02-12 | 13F | Chilton Capital Management Llc | 683 | 0,00 | 29 | -28,21 | ||||
| 2026-03-04 | 13F | SHP Wealth Management | 250 | 10 | ||||||
| 2026-01-29 | 13F | UBS Group AG | Call | 105.000 | 130,77 | 4.398 | 66,46 | |||
| 2026-01-29 | 13F | UBS Group AG | Put | 0 | -100,00 | 0 | -100,00 | |||
| 2026-01-29 | 13F | UBS Group AG | 1.147.670 | -12,78 | 48.076 | -37,09 | ||||
| 2026-02-17 | 13F | Jain Global LLC | 6.879 | 288 | ||||||
| 2026-02-17 | 13F | D. E. Shaw & Co., Inc. | 256.355 | 10.739 | ||||||
| 2026-02-17 | 13F | Creative Planning | 55.366 | 34,98 | 2.319 | -2,64 | ||||
| 2026-02-17 | 13F | D. E. Shaw & Co., Inc. | Call | 45.400 | 1.902 | |||||
| 2026-02-17 | 13F | D. E. Shaw & Co., Inc. | Put | 16.500 | -3,51 | 691 | -30,41 | |||
| 2026-02-17 | 13F | Algert Global Llc | 134.573 | 5,12 | 6 | -28,57 | ||||
| 2026-02-17 | 13F | Utah Retirement Systems | 7.201 | 0,00 | 302 | -27,99 | ||||
| 2026-02-10 | 13F | Daiwa Securities Group Inc. | 10.707 | 6,17 | 0 | |||||
| 2026-02-17 | 13F | Royal Bank Of Canada | 222.715 | -23,06 | 9.329 | -44,51 | ||||
| 2026-04-16 | 13F | First Community Trust Na | 0 | -100,00 | 0 | |||||
| 2026-02-17 | 13F | 13D Management LLC | 76.001 | 0,00 | 3.184 | -27,89 | ||||
| 2026-02-23 | 13F | Mv Capital Management, Inc. | 62 | 0,00 | 3 | -33,33 | ||||
| 2026-02-12 | 13F | Cibc World Markets Corp | 45.962 | 286,82 | 1.925 | 212,50 | ||||
| 2026-01-30 | 13F | NJ State Employees Deferred Compensation Plan | 0 | -100,00 | 0 | -100,00 | ||||
| 2026-02-11 | 13F | Flagship Wealth Advisors, Llc | 100 | 0,00 | 4 | -20,00 | ||||
| 2025-11-05 | 13F | Gallacher Capital Management LLC | 0 | -100,00 | 0 | |||||
| 2026-02-10 | 13F | Moors & Cabot, Inc. | 5.066 | 0,00 | 212 | -27,89 | ||||
| 2025-10-30 | 13F | CVA Family Office, LLC | 0 | -100,00 | 0 | |||||
| 2026-01-26 | 13F | Mirae Asset Global Investments Co., Ltd. | 23.804 | 19,26 | 997 | -13,98 | ||||
| 2026-02-03 | 13F | Ethic Inc. | 23.509 | 12,36 | 985 | -19,01 | ||||
| 2026-01-30 | 13F | Ktf Investments, Llc | 6.654 | 279 | ||||||
| 2026-02-23 | 13F | Walser Wealth Management Company, A Ltd Liability Co | 5.264 | 221 | ||||||
| 2026-04-23 | 13F | Oppenheimer Asset Management Inc. | 10.322 | 20,22 | 436 | 21,45 | ||||
| 2026-02-04 | 13F | Advisor OS, LLC | 17.557 | -2,87 | 735 | -29,93 | ||||
| 2026-02-17 | 13F | Credit Agricole S A | 18.401 | -53,91 | 771 | -66,80 | ||||
| 2026-01-30 | 13F | Trifecta Capital Advisors, LLC | 0 | -100,00 | 0 | |||||
| 2026-02-04 | 13F | Sentry Investment Management Llc | 391 | 0,00 | 0 | |||||
| 2026-01-16 | 13F | West Branch Capital LLC | 0 | -100,00 | 0 | -100,00 | ||||
| 2026-03-04 | 13F/A | Savant Capital, LLC | 0 | -100,00 | 0 | |||||
| 2026-02-10 | 13F | Private Wealth Asset Management, LLC | 3 | 0,00 | 0 | |||||
| 2026-04-24 | 13F | Strs Ohio | 305.217 | -5,28 | 12.898 | -4,44 | ||||
| 2025-11-14 | 13F | Point72 Asia (Singapore) Pte. Ltd. | 5.174 | 301 | ||||||
| 2026-01-30 | 13F | Us Bancorp \de\ | 37.286 | -4,27 | 1.562 | -30,99 | ||||
| 2026-02-13 | 13F | Bank Of Nova Scotia | 10.241 | 5,74 | 429 | -23,84 | ||||
| 2025-11-07 | 13F | Shell Asset Management Co | 1.182 | -42,76 | 0 | |||||
| 2025-11-14 | 13F | Capstone Investment Advisors, Llc | Put | 5.800 | 20,83 | 337 | 35,48 | |||
| 2025-11-14 | 13F | Capstone Investment Advisors, Llc | 4.076 | -71,09 | 237 | -67,67 | ||||
| 2026-02-10 | 13F | Argent Trust Co | 0 | -100,00 | 0 | |||||
| 2026-02-17 | 13F | CastleKnight Management LP | 8.400 | -50,30 | 352 | -64,22 | ||||
| 2026-02-17 | 13F | Alpine Woods Capital Investors, Llc | 7.180 | 301 | ||||||
| 2026-02-09 | 13F | Legal & General Group Plc | 252.674 | -9,32 | 10.585 | -34,59 | ||||
| 2026-02-17 | 13F | MIRAE ASSET GLOBAL ETFS HOLDINGS Ltd. | 12.255 | -10,06 | 513 | -35,15 | ||||
| 2026-01-26 | 13F | Whittier Trust Co Of Nevada Inc | 735 | -11,55 | 31 | -42,31 | ||||
| 2026-02-17 | 13F | Raymond James Financial Inc | 359.743 | -5,44 | 15.070 | -31,80 | ||||
| 2026-02-10 | 13F | Bridges Investment Management Inc | 5.570 | 0,18 | 233 | -27,64 | ||||
| 2026-02-11 | 13F | Syon Capital Llc | 8.413 | 352 | ||||||
| 2025-11-13 | 13F | GeoWealth Management, LLC | 0 | -100,00 | 0 | |||||
| 2026-04-07 | 13F | Farther Finance Advisors, LLC | 4.941 | -1,93 | 190 | -9,95 | ||||
| 2026-04-23 | 13F | Rexford Capital Inc | 1.785 | -3,46 | 75 | -2,60 | ||||
| 2026-02-17 | 13F | Nomura Holdings Inc | Call | 0 | -100,00 | 0 | -100,00 | |||
| 2026-02-13 | 13F | Pathstone Holdings, LLC | 17.989 | -11,21 | 754 | -35,97 | ||||
| 2026-02-11 | 13F | LPL Financial LLC | 298.061 | 5,75 | 12.486 | -23,73 | ||||
| 2026-01-29 | 13F | Argyle Capital Management Inc. | 7.608 | 0,00 | 319 | -27,89 | ||||
| 2026-04-24 | 13F | ProShare Advisors LLC | 20.192 | -38,21 | 853 | -37,65 | ||||
| 2026-04-15 | 13F/A | Sl Advisors, Llc | 0 | -100,00 | 0 | |||||
| 2026-02-13 | 13F | Alyeska Investment Group, L.P. | 0 | -100,00 | 0 | -100,00 | ||||
| 2026-04-23 | 13F | Peregrine Capital Management Llc | 290 | 0,00 | 12 | 0,00 | ||||
| 2025-11-14 | 13F | Sig Brokerage, Lp | Call | 0 | -100,00 | 0 | ||||
| 2026-02-04 | 13F | Midwest Trust Co | 17.527 | -4,47 | 734 | -31,08 | ||||
| 2026-02-10 | 13F | Meramec Financial Planners, LLC | 654 | 33 | ||||||
| 2026-02-12 | 13F | BlackRock, Inc. | 11.995.025 | -13,93 | 502.472 | -37,92 | ||||
| 2026-02-13 | 13F | Inspire Advisors, LLC | 0 | -100,00 | 0 | |||||
| 2026-04-13 | 13F | Professional Financial Advisors, LLC | 15.414 | 0,00 | 651 | 0,93 | ||||
| 2026-02-05 | 13F | Elyxium Wealth, LLC | 82 | 3 | ||||||
| 2026-04-22 | 13F | Spire Wealth Management | 24 | 50,00 | 1 | |||||
| 2026-04-17 | 13F | HHM Wealth Advisors, LLC | 0 | -100,00 | 0 | |||||
| 2026-04-13 | 13F | Gill Capital Partners, Llc | 30 | 1 | ||||||
| 2026-02-17 | 13F | Janus Henderson Group Plc | 360.226 | -33,39 | 15.091 | -51,96 | ||||
| 2026-01-16 | 13F | Trust Co Of Vermont | 16 | 0,00 | 1 | |||||
| 2026-02-10 | 13F | Natixis Advisors, L.p. | 438.634 | -18,10 | 18 | -41,94 | ||||
| 2026-02-11 | 13F | Capital Analysts, Inc. | 51 | -16,39 | 0 | |||||
| 2026-02-11 | 13F | Capital Research Global Investors | 2.820.000 | 31,16 | 118.130 | -5,40 | ||||
| 2026-02-03 | 13F | Everence Capital Management Inc | 0 | -100,00 | 0 | |||||
| 2025-11-14 | 13F | Cubist Systematic Strategies, LLC | Put | 50.100 | 0,00 | 2.910 | 12,01 | |||
| 2025-11-14 | 13F | Cubist Systematic Strategies, LLC | Call | 92.900 | 0,00 | 5.396 | 12,02 | |||
| 2026-02-13 | 13F | Allianz Se | 2.500 | 0,00 | 105 | -28,28 | ||||
| 2025-11-14 | 13F | Cubist Systematic Strategies, LLC | 11.039 | 641 | ||||||
| 2026-01-23 | 13F | Assetmark, Inc | 53.278 | 11,78 | 2.232 | -19,40 | ||||
| 2026-02-13 | 13F | Kayne Anderson Rudnick Investment Management Llc | 9 | -99,97 | 0 | -100,00 | ||||
| 2026-02-17 | 13F | Balyasny Asset Management Llc | 157.291 | -57,17 | 6.589 | -69,11 | ||||
| 2026-02-13 | 13F | Jacobs Levy Equity Management, Inc | 6.828 | 22,89 | 286 | -11,18 | ||||
| 2026-04-17 | 13F | Kennebec Savings Bank | 600 | 0,00 | 25 | 0,00 | ||||
| 2026-02-12 | 13F | Triumph Capital Management | 263 | 4.283,33 | 11 | |||||
| 2026-02-02 | 13F | Qrg Capital Management, Inc. | 0 | -100,00 | 0 | |||||
| 2026-01-23 | 13F | Rsm Us Wealth Management Llc | 22.513 | 19,38 | 944 | -13,79 | ||||
| 2026-02-13 | 13F | Baird Financial Group, Inc. | 36.616 | -11,84 | 1.534 | -36,44 | ||||
| 2026-02-06 | 13F | BOK Financial Private Wealth, Inc. | 164 | 0,00 | 7 | -33,33 | ||||
| 2025-11-14 | 13F | PineBridge Investments, L.P. | 0 | -100,00 | 0 | |||||
| 2026-04-07 | 13F | Eastern Bank | 206 | 0,00 | 9 | 0,00 | ||||
| 2026-02-17 | 13F | Advisor Group Holdings, Inc. | 65.191 | 9,67 | 2.732 | -19,88 | ||||
| 2026-02-10 | 13F | Godfrey Financial Associates, Inc. | 3 | 0 | ||||||
| 2025-11-14 | 13F | LMR Partners LLP | Call | 0 | -100,00 | 0 | -100,00 | |||
| 2026-02-10 | 13F | Easterly Investment Partners Llc | 73.316 | 3.071 | ||||||
| 2026-02-17 | 13F | Twinbeech Capital Lp | 5.700 | 239 | ||||||
| 2026-02-13 | 13F | Citigroup Inc | 144.822 | -38,69 | 6.067 | -55,78 | ||||
| 2026-02-17 | 13F | Caption Management, LLC | Call | 0 | -100,00 | 0 | -100,00 | |||
| 2026-02-17 | 13F | Snowden Capital Advisors LLC | 0 | -100,00 | 0 | |||||
| 2026-04-14 | 13F | Moisand Fitzgerald Tamayo, LLC | 333 | 0,00 | 14 | 7,69 | ||||
| 2026-02-12 | 13F | Front Row Advisors LLC | 120 | 0,00 | 5 | -16,67 | ||||
| 2026-02-17 | 13F | State Of Wisconsin Investment Board | 132.300 | 88,37 | 5.542 | 35,87 | ||||
| 2026-02-04 | 13F | Securian Asset Management, Inc | 3.789 | -42,98 | 159 | -58,96 | ||||
| 2026-01-27 | 13F | Lecap Asset Management Ltd | 5.380 | 225 | ||||||
| 2026-02-10 | 13F | Td Asset Management Inc | 24.202 | -2,39 | 1.014 | -29,65 | ||||
| 2026-02-04 | 13F | Family Legacy, Inc. | 0 | -100,00 | 0 | |||||
| 2025-11-10 | 13F | Longview Financial Advisors LLC | 0 | -100,00 | 0 | -100,00 | ||||
| 2026-02-13 | 13F | BNP Paribas Asset Management Holding S.A. | 6.093 | -62,90 | 0 | |||||
| 2026-04-02 | 13F | MJT & Associates Financial Advisory Group, Inc. | 533 | 0,00 | 23 | 0,00 | ||||
| 2026-02-05 | 13F | Bessemer Group Inc | 4.730 | -15,51 | 0 | |||||
| 2025-11-14 | 13F | Lazard Asset Management Llc | 0 | -100,00 | 0 | |||||
| 2026-02-13 | 13F | Itau Unibanco Holding S.A. | 0 | -100,00 | 0 | |||||
| 2026-02-10 | 13F | Bnp Paribas Arbitrage, Sa | Call | 395 | -24,76 | 1.655 | -45,75 | |||
| 2026-02-10 | 13F | Bnp Paribas Arbitrage, Sa | 374.048 | 61,79 | 15.669 | 16,68 | ||||
| 2026-01-30 | 13F | BancorpSouth Bank | 144.470 | 1,09 | 6.052 | -27,10 | ||||
| 2026-01-27 | 13F | Asset Management One Co., Ltd. | 5.113 | 1,45 | 214 | -27,05 | ||||
| 2026-02-10 | 13F | Bnp Paribas Arbitrage, Sa | Put | 488 | 87,69 | 2.044 | 35,36 | |||
| 2026-02-06 | 13F | Mizuho Markets Cayman LP | 159.750 | 6.692 | ||||||
| 2026-02-12 | 13F | Brown Brothers Harriman & Co | 6.664 | -26,18 | 279 | -46,76 | ||||
| 2026-02-13 | 13F | First National Bank Of Omaha | 26.677 | 109,35 | 1.117 | 50,95 | ||||
| 2026-02-12 | 13F | Wealthspire Advisors, LLC | 0 | -100,00 | 0 | |||||
| 2026-02-12 | 13F | Commonwealth Equity Services, Llc | 15.231 | -4,02 | 638 | |||||
| 2026-02-09 | 13F | Atlantic Trust, LLC | 0 | -100,00 | 0 | |||||
| 2026-04-15 | 13F | Fluent Financial, LLC | 0 | -100,00 | 0 | |||||
| 2026-03-13 | 13F/A | Pensionmark Financial Group, Llc | Call | 179 | ||||||
| 2026-02-10 | 13F | Texas Yale Capital Corp. | 30.175 | 1.264 | ||||||
| 2026-03-13 | 13F/A | Pensionmark Financial Group, Llc | 3.088 | 129 | ||||||
| 2026-02-13 | 13F | Palisade Asset Management, LLC | 0 | -100,00 | 0 | |||||
| 2026-02-11 | 13F | GW&K Investment Management, LLC | 168 | 0 | ||||||
| 2026-04-22 | 13F | Caldwell Trust Co | 66 | 0,00 | 3 | 0,00 | ||||
| 2026-02-12 | 13F | Alps Advisors Inc | 12.734 | -6,23 | 533 | -32,36 | ||||
| 2026-02-17 | 13F | Price T Rowe Associates Inc /md/ | 9.824.690 | 27,38 | 412 | -8,05 | ||||
| 2026-04-20 | 13F | Ronald Blue Trust, Inc. | 114 | 9,62 | 5 | 0,00 | ||||
| 2026-02-17 | 13F | Northern Trust Corp | 1.166.469 | -3,36 | 48.863 | -30,30 | ||||
| 2026-02-12 | 13F | MetLife Investment Management, LLC | 33.323 | -3,39 | 1.396 | -30,35 | ||||
| 2025-11-14 | 13F | Mount Yale Investment Advisors, LLC | 0 | -100,00 | 0 | -100,00 | ||||
| 2026-02-13 | 13F | Pinnacle Wealth Planning Services, Inc. | 595 | 25 | ||||||
| 2026-02-17 | 13F | Freestone Grove Partners LP | 0 | -100,00 | 0 | |||||
| 2026-02-02 | 13F | Sachetta, LLC | 10 | 0,00 | 0 | |||||
| 2026-02-10 | 13F | Foundations Investment Advisors, LLC | 5.851 | 245 | ||||||
| 2026-02-17 | 13F | Fmr Llc | 639.855 | -75,67 | 26.804 | -82,45 | ||||
| 2026-02-04 | 13F | Ameritas Advisory Services, LLC | 0 | -100,00 | 0 | |||||
| 2026-04-13 | 13F | Massmutual Trust Co Fsb/adv | 907 | -12,62 | 38 | -11,63 | ||||
| 2026-01-28 | 13F | Chicago Partners Investment Group LLC | 6.136 | 268 | ||||||
| 2026-02-11 | 13F | Weik Capital Management | 8.835 | -2,75 | 370 | -29,79 | ||||
| 2026-04-20 | 13F | Louisiana State Employees Retirement System | 61.600 | 767,61 | 2.603 | 776,43 | ||||
| 2026-02-13 | 13F | Squarepoint Ops LLC | Put | 9.600 | -77,98 | 402 | -84,12 | |||
| 2026-02-13 | 13F | State Street Corp | 5.685.960 | -1,96 | 238.185 | -29,29 | ||||
| 2026-02-17 | 13F | Cresset Asset Management, LLC | 4.930 | -57,65 | 207 | -69,53 | ||||
| 2026-04-22 | 13F | Sterling Capital Management LLC | 5.902 | -83,06 | 249 | -82,93 | ||||
| 2026-02-13 | 13F | Squarepoint Ops LLC | Call | 82.600 | 241,32 | 3.460 | 146,26 | |||
| 2026-04-06 | 13F | GAMMA Investing LLC | 2.261 | -35,29 | 96 | -34,93 | ||||
| 2025-11-12 | 13F | Bellwether Advisors, LLC | 0 | -100,00 | 0 | -100,00 | ||||
| 2026-04-15 | 13F | Bayforest Capital Ltd | 0 | -100,00 | 0 | |||||
| 2026-04-22 | 13F | Atlantic Edge Private Wealth Management, LLC | 66 | 0,00 | 3 | 0,00 | ||||
| 2026-02-17 | 13F | Adage Capital Partners Gp, L.l.c. | 225.800 | 77,94 | 9.459 | 28,33 | ||||
| 2025-11-13 | 13F | Clear Street Markets Llc | Call | 0 | -100,00 | 0 | -100,00 | |||
| 2026-01-30 | 13F | New York State Teachers Retirement System | 126.014 | -0,16 | 5 | -28,57 | ||||
| 2026-02-05 | 13F | Plante Moran Financial Advisors, LLC | 21 | 0,00 | 1 | -100,00 | ||||
| 2025-11-14 | 13F | Marex Group plc | 0 | -100,00 | 0 | -100,00 | ||||
| 2026-02-20 | 13F | Sunbelt Securities, Inc. | 307 | 0,00 | 13 | -29,41 | ||||
| 2026-01-29 | 13F | Sanctuary Advisors, LLC | 8.897 | -5,56 | 373 | -31,99 | ||||
| 2026-01-27 | 13F | Institute for Wealth Management, LLC. | 8.723 | 365 | ||||||
| 2026-04-17 | 13F | Vermillion Wealth Management, Inc. | 31 | 47,62 | 1 | |||||
| 2026-02-13 | 13F | Entropy Technologies, LP | 0 | -100,00 | 0 | |||||
| 2026-02-05 | 13F | Gabelli Funds Llc | 46.808 | 47,16 | 1.961 | 6,12 | ||||
| 2026-02-17 | 13F | Interval Partners, LP | 0 | -100,00 | 0 | -100,00 | ||||
| 2026-02-10 | 13F | Hazlett, Burt & Watson, Inc. | 746 | 0,00 | 0 | |||||
| 2026-02-12 | 13F | Steward Partners Investment Advisory, Llc | 3.928 | 1,55 | 165 | -26,79 | ||||
| 2026-02-13 | 13F | Resources Investment Advisors, LLC. | 10.449 | -1,63 | 438 | -29,06 | ||||
| 2026-02-13 | 13F | Brookfield Asset Management Inc. | 2.226.311 | 28,96 | 93.260 | -6,99 | ||||
| 2026-02-17 | 13F | Howard Hughes Medical Institute | 30 | 0,00 | 1 | 0,00 | ||||
| 2025-11-03 | 13F | Advantage Trust Co | 0 | -100,00 | 0 | |||||
| 2026-01-23 | 13F | Patton Fund Management, Inc. | 0 | -100,00 | 0 | |||||
| 2026-02-13 | 13F | Lavaca Capital Llc | 275 | 9.066,67 | 12 | |||||
| 2026-02-13 | 13F | American Century Companies Inc | 471.369 | 77,27 | 19.746 | 27,85 | ||||
| 2026-02-17 | 13F | Edmond De Rothschild Holding S.a. | 666 | 0,00 | 28 | -28,95 | ||||
| 2026-01-30 | 13F | Caldwell Securities, Inc | 200 | 0,00 | 8 | -27,27 | ||||
| 2026-01-29 | 13F | Quent Capital, LLC | 518 | 3,19 | 22 | -27,59 | ||||
| 2026-02-12 | 13F | Rossby Financial, LCC | 381 | 2,14 | 16 | -34,78 | ||||
| 2026-04-08 | 13F | Castle Rock Wealth Management, LLC | 9.311 | 0,00 | 366 | -13,06 | ||||
| 2026-02-12 | 13F | Bank Of Montreal /can/ | 148.875 | 30,93 | 6.236 | -5,56 | ||||
| 2025-10-29 | 13F | Fisher Funds Management LTD | 0 | -100,00 | 0 | -100,00 | ||||
| 2026-02-03 | 13F | Garner Asset Management Corp | 74 | 3 | ||||||
| 2026-02-17 | 13F | Citadel Advisors Llc | Put | 334.900 | -43,67 | 14.029 | -59,37 | |||
| 2026-02-11 | 13F | Parallel Advisors, LLC | 1.529 | -1,23 | 64 | -28,09 | ||||
| 2026-02-13 | 13F | First Trust Advisors Lp | 104.624 | 5,80 | 4.383 | -23,70 | ||||
| 2026-02-17 | 13F | Citadel Advisors Llc | Call | 288.100 | 9,05 | 12.069 | -21,35 | |||
| 2026-02-17 | 13F | Citadel Advisors Llc | 319.249 | -81,79 | 13.373 | -86,87 | ||||
| 2026-04-24 | 13F | Deprince Race & Zollo Inc | 362.327 | -53,88 | 15.312 | -53,48 | ||||
| 2026-04-07 | 13F | Signaturefd, Llc | 429 | -47,94 | 18 | -47,06 | ||||
| 2026-02-17 | 13F | Ancora Advisors, LLC | 5.773 | -62,84 | 242 | -73,28 | ||||
| 2026-02-13 | 13F | Mml Investors Services, Llc | 49.675 | -1,21 | 2.081 | -28,77 | ||||
| 2026-02-12 | 13F | Johnson Financial Group, Inc. | 28 | -42,86 | 1 | -50,00 | ||||
| 2026-04-20 | 13F | Yorktown Management & Research Co Inc | 7.200 | 304 | ||||||
| 2026-02-09 | 13F | Avalon Trust Co | 0 | -100,00 | 0 | |||||
| 2026-04-03 | 13F | Global Wealth Strategies & Associates | 52 | -60,61 | 2 | -60,00 | ||||
| 2026-04-22 | 13F | Coston, McIsaac & Partners | 100 | 0,00 | 0 | |||||
| 2026-02-17 | 13F | Wealth Watch Advisors, INC | 8 | -11,11 | 0 | |||||
| 2026-01-30 | 13F | Wealthfront Advisers Llc | 0 | -100,00 | 0 | |||||
| 2026-02-17 | 13F | Caption Management, LLC | 163.271 | 6.839 | ||||||
| 2026-02-17 | 13F | Caption Management, LLC | Put | 1.200.000 | 50.268 | |||||
| 2026-04-21 | 13F | Gilpin Wealth Management, Llc | 25 | 1 | ||||||
| 2026-01-30 | 13F/A | M&t Bank Corp | 10.857 | 73,38 | 455 | 25,07 | ||||
| 2026-02-13 | 13F | Truvestments Capital Llc | 203 | 0,00 | 9 | -27,27 | ||||
| 2026-02-17 | 13F | Engineers Gate Manager LP | 25.909 | -16,15 | 1.085 | -39,52 | ||||
| 2026-04-13 | 13F | St Germain D J Co Inc | 503 | -12,67 | 21 | -12,50 | ||||
| 2026-02-17 | 13F | Quantinno Capital Management LP | 492.769 | 939,58 | 20.642 | 649,80 | ||||
| 2026-04-08 | 13F | Wealth Enhancement Advisory Services, Llc | 50.602 | -1,05 | 1.991 | -6,22 | ||||
| 2026-02-09 | 13F | Annis Gardner Whiting Capital Advisors, LLC | 7 | 0 | ||||||
| 2026-02-13 | 13F | Stifel Financial Corp | 65.994 | -35,79 | 2.765 | -53,69 | ||||
| 2026-02-04 | 13F | Versor Investments LP | 9.648 | 404 | ||||||
| 2026-02-10 | 13F | CIBC World Markets Inc. | 20.202 | -0,00 | 846 | -27,88 | ||||
| 2026-02-11 | 13F | Ameritas Investment Partners, Inc. | 1.332 | 56 | ||||||
| 2026-02-13 | 13F | SRS Capital Advisors, Inc. | 13.213 | -55,78 | 553 | -68,13 | ||||
| 2026-02-13 | 13F | Squarepoint Ops LLC | 0 | -100,00 | 0 | -100,00 | ||||
| 2026-04-22 | 13F | Pinnacle Bancorp, Inc. | 924 | 0,00 | 39 | 2,63 | ||||
| 2026-01-26 | 13F | Cwm, Llc | 49.416 | 21,27 | 2 | 0,00 | ||||
| 2026-02-12 | 13F | Skopos Labs, Inc. | 7.873 | 329 | ||||||
| 2026-02-11 | 13F | Empowered Funds, LLC | 40.943 | 3,52 | 1.715 | -25,34 | ||||
| 2025-11-12 | 13F | Fox Run Management, L.l.c. | 0 | -100,00 | 0 | |||||
| 2026-02-13 | 13F | Quarry LP | 544 | -72,80 | 23 | -81,03 | ||||
| 2026-01-23 | 13F | Nbt Bank N A /ny | 66 | 0,00 | 3 | -33,33 | ||||
| 2026-02-13 | 13F | Umb Bank N A/mo | 295.536 | 0,00 | 12.380 | -27,87 | ||||
| 2026-02-17 | 13F | Alliancebernstein L.p. | 138.846 | -35,36 | 5.816 | -53,38 | ||||
| 2026-04-06 | 13F | Versant Capital Management, Inc | 1.086 | -71,91 | 46 | -72,05 | ||||
| 2026-01-30 | 13F | Keating Investment Counselors Inc | 53.734 | 7,84 | 2.251 | -22,23 | ||||
| 2026-04-15 | 13F | Tema Etfs Llc | 0 | -100,00 | 0 | |||||
| 2026-02-12 | 13F | Dimensional Fund Advisors Lp | 2.141.037 | 8,74 | 89.688 | -21,55 | ||||
| 2026-02-17 | 13F | Frontier Capital Management Co Llc | 439.762 | -37,46 | 18.422 | -54,90 | ||||
| 2025-10-30 | 13F | Twin Peaks Wealth Advisors, LLC | 0 | -100,00 | 0 | |||||
| 2026-02-17 | 13F | Blair William & Co/il | 6.706 | -1,44 | 281 | -29,11 | ||||
| 2025-11-06 | 13F | Whipplewood Advisors, LLC | 0 | -100,00 | 0 | |||||
| 2026-02-05 | 13F | Canada Post Corp Registered Pension Plan | 2.739 | 37,02 | 115 | 2,70 | ||||
| 2026-02-02 | 13F | Principal Financial Group Inc | 153.748 | 2,57 | 6.441 | -26,02 | ||||
| 2026-02-17 | 13F | Prelude Capital Management, Llc | 65.000 | 2.723 | ||||||
| 2026-02-23 | 13F | Virtu Financial LLC | 0 | -100,00 | 0 | |||||
| 2026-01-28 | 13F | Arizona State Retirement System | 36.673 | -7,55 | 1.536 | -33,30 | ||||
| 2026-02-12 | 13F | Nuveen, LLC | 442.673 | -0,18 | 18.544 | -28,00 | ||||
| 2026-02-17 | 13F | Rakuten Investment Management, Inc. | 12.429 | -68,26 | 520 | -89,17 | ||||
| 2026-02-03 | 13F | Bernzott Capital Advisors | 118.053 | 2,21 | 4.945 | -26,28 | ||||
| 2026-02-10 | 13F | CIBC Asset Management Inc | 31.106 | 72,07 | 1.303 | 24,21 | ||||
| 2026-02-10 | 13F | Bruce G. Allen Investments, LLC | 8 | 0,00 | 0 | |||||
| 2025-11-03 | 13F | Valeo Financial Advisors, LLC | 0 | -100,00 | 0 | -100,00 | ||||
| 2026-02-02 | 13F | Truist Financial Corp | 11.175 | -10,66 | 468 | -35,54 | ||||
| 2026-02-13 | 13F | Becker Capital Management Inc | 75.375 | -2,69 | 3.157 | -29,81 | ||||
| 2026-02-03 | 13F | Legacy Wealth Managment, LLC/ID | 2 | -33,33 | 0 | |||||
| 2026-02-12 | 13F | Principal Securities, Inc. | 0 | -100,00 | 0 | |||||
| 2026-02-17 | 13F | Ameriflex Group, Inc. | 217 | -51,99 | 9 | -65,38 | ||||
| 2026-02-09 | 13F | Kingsview Wealth Management, LLC | 180.641 | 7.567 | ||||||
| 2026-02-03 | 13F/A | Bank Of America Corp /de/ | Put | 0 | -100,00 | 0 | -100,00 | |||
| 2026-02-13 | 13F | Rodgers Brothers Inc. | 154.644 | 4,51 | 6.478 | -24,61 | ||||
| 2026-02-02 | 13F | Kornitzer Capital Management Inc /ks | 18.505 | 0,14 | 775 | -27,77 | ||||
| 2026-02-13 | 13F | Financial Freedom, LLC | 0 | -100,00 | 0 | |||||
| 2026-01-27 | 13F | Revisor Wealth Management LLC | 11.581 | 100,12 | 498 | 33,24 | ||||
| 2026-04-24 | 13F | Medallion Wealth Advisors, LLC | 1.300 | 0,00 | 55 | 0,00 | ||||
| 2026-02-11 | 13F | Winton Capital Group Ltd | 18.520 | 776 | ||||||
| 2026-02-13 | 13F | Ossiam | 0 | -100,00 | 0 | |||||
| 2026-02-09 | 13F | Employees Retirement System of Texas | 0 | -100,00 | 0 | |||||
| 2026-04-15 | 13F | Hartford Investment Management Co | 0 | -100,00 | 0 | |||||
| 2026-04-14 | 13F | Nbc Securities, Inc. | 4.500 | -16,47 | 190 | -15,56 | ||||
| 2026-01-26 | 13F | KBC Group NV | 3.709 | 0,00 | 0 | |||||
| 2026-01-14 | 13F | Accurate Wealth Management, LLC | 0 | -100,00 | 0 | |||||
| 2026-01-21 | 13F | Crews Bank & Trust | 216 | 0,00 | 9 | -25,00 | ||||
| 2026-02-03 | 13F | Tweedy, Browne Co LLC | 16.565 | 16,75 | 694 | -15,90 | ||||
| 2026-02-13 | 13F | Bridgefront Capital, LLC | 0 | -100,00 | 0 | |||||
| 2026-02-17 | 13F | Armistice Capital, Llc | 18.012 | 755 | ||||||
| 2025-10-30 | 13F | WFA Asset Management Corp | 244 | 0,00 | 16 | -25,00 | ||||
| 2026-01-21 | 13F | Flagship Harbor Advisors, Llc | 2.701 | 113 | ||||||
| 2026-02-12 | 13F | Voya Investment Management Llc | 29.746 | 1,78 | 1.246 | -26,58 | ||||
| 2026-01-28 | 13F | CAPROCK Group, Inc. | 19.139 | 802 | ||||||
| 2026-02-27 | 13F | Groupama Asset Managment | 0 | -100,00 | 0 | |||||
| 2026-04-17 | 13F | Bell Investment Advisors, Inc | 825 | -1,32 | 35 | -2,86 | ||||
| 2026-02-10 | 13F | Machina Capital S.a.s. | 5.095 | 213 | ||||||
| 2026-01-07 | 13F | Hilltop National Bank | 0 | -100,00 | 0 | |||||
| 2026-02-10 | 13F | Koss-Olinger Consulting, LLC | 14.653 | -54,58 | 614 | -63,30 | ||||
| 2026-02-09 | 13F | Continental Grain Co | 2.134.080 | 0,00 | 89.397 | -27,88 | ||||
| 2026-02-09 | 13F | Arq Wealth Advisors, Llc | 7.135 | -27,01 | 299 | -47,44 | ||||
| 2026-04-15 | 13F | DAVENPORT & Co LLC | 7.553 | -14,11 | 319 | -13,32 | ||||
| 2026-02-13 | 13F | Public Sector Pension Investment Board | 0 | -100,00 | 0 | |||||
| 2026-04-23 | 13F | SJS Investment Consulting Inc. | 1.153 | 4.512,00 | 49 | 4.700,00 | ||||
| 2026-02-11 | 13F | CoreFirst Bank & Trust | 1.173 | 0,00 | 49 | -27,94 | ||||
| 2026-02-04 | 13F | Pacer Advisors, Inc. | 0 | -100,00 | 0 | |||||
| 2026-04-13 | 13F | Global X Japan Co., Ltd. | 381 | 9,17 | 16 | 14,29 | ||||
| 2025-10-27 | 13F | Bogart Wealth, LLC | 0 | -100,00 | 0 | |||||
| 2026-02-10 | 13F | Bank of New York Mellon Corp | 1.356.732 | 39,93 | 56.834 | 0,92 | ||||
| 2026-02-12 | 13F | New York State Common Retirement Fund | 197.337 | 0,00 | 8.266 | -27,88 | ||||
| 2026-02-17 | 13F | Imprint Wealth LLC | 0 | -100,00 | 0 | |||||
| 2026-02-06 | 13F | Bare Financial Services, Inc | 24 | 0,00 | 1 | 0,00 | ||||
| 2026-02-10 | 13F | New Mexico Educational Retirement Board | 6.490 | 1,56 | 0 | |||||
| 2026-02-13 | 13F | Neuberger Berman Group LLC | Call | 0 | -100,00 | 0 | -100,00 | |||
| 2025-11-07 | 13F | Sierra Ocean, Llc | 0 | -100,00 | 0 | |||||
| 2026-02-11 | 13F | Jpmorgan Chase & Co | 7.182.556 | 1.408,74 | 300.877 | 988,20 | ||||
| 2026-02-11 | 13F | Jpmorgan Chase & Co | Call | 100.000 | 0,00 | 4.189 | -27,88 | |||
| 2025-11-14 | 13F | Wellington Management Group Llp | 0 | -100,00 | 0 | -100,00 | ||||
| 2026-04-03 | 13F | Hickory Point Bank & Trust | 218 | 9 | ||||||
| 2026-02-17 | 13F | Holocene Advisors, LP | 12.532 | -84,95 | 525 | -89,16 | ||||
| 2026-02-11 | 13F | Manchester Capital Management LLC | 42 | 2 | ||||||
| 2026-01-30 | 13F | Delta Investment Management, LLC | 0 | -100,00 | 0 | |||||
| 2026-02-12 | 13F | Brinker Capital Investments, LLC | 104.045 | 3,57 | 4.358 | -25,30 | ||||
| 2025-12-16 | 13F | Garde Capital, Inc. | 0 | -100,00 | 0 | |||||
| 2026-02-17 | 13F | SageView Advisory Group, LLC | 887 | 37 | ||||||
| 2026-02-09 | 13F | Geode Capital Management, Llc | 3.528.402 | 0,61 | 147.536 | -27,43 | ||||
| 2026-02-04 | 13F | Meridian Wealth Management, LLC | 0 | -100,00 | 0 | |||||
| 2026-03-12 | 13F/A | Peak6 Llc | Call | 239.100 | 159,61 | 10.016 | 87,23 | |||
| 2026-02-03 | 13F | SBI Securities Co., Ltd. | 635 | 6,19 | 27 | -23,53 | ||||
| 2026-02-17 | 13F | Ameriprise Financial Inc | 102.150 | -81,26 | 4.279 | -86,48 | ||||
| 2026-03-12 | 13F/A | Peak6 Llc | 67.953 | 2.847 | ||||||
| 2026-03-12 | 13F/A | Peak6 Llc | Put | 362.100 | -8,86 | 15.168 | -34,27 | |||
| 2026-04-20 | 13F | City State Bank | 629 | 0,00 | 27 | 0,00 | ||||
| 2026-02-13 | 13F | Arrowstreet Capital, Limited Partnership | 322.036 | -59,61 | 13.490 | -70,87 | ||||
| 2026-02-03 | 13F | Bokf, Na | 0 | -100,00 | 0 | |||||
| 2026-02-17 | 13F | Millennium Management Llc | Call | 631.300 | 6.545,26 | 26.445 | 4.699,46 | |||
| 2026-02-17 | 13F | Zacks Investment Management | 15.708 | 658 | ||||||
| 2026-02-17 | 13F | Millennium Management Llc | Put | 13.000 | -87,93 | 545 | -91,30 | |||
| 2026-04-08 | 13F | Miracle Mile Advisors, LLC | 15.342 | -2,66 | 648 | -1,82 | ||||
| 2026-01-26 | 13F | Private Trust Co Na | 416 | 0,00 | 17 | -29,17 | ||||
| 2026-02-17 | 13F | Millennium Management Llc | 580.481 | -77,59 | 24.316 | -83,84 | ||||
| 2026-01-20 | 13F | Cromwell Holdings LLC | 362 | 0,00 | 15 | -28,57 | ||||
| 2026-01-23 | 13F | Avion Wealth | 10 | -50,00 | 0 | |||||
| 2026-04-07 | 13F | CoreCap Advisors, LLC | 181 | 2,26 | 8 | 0,00 | ||||
| 2026-02-04 | 13F | First National Advisers, LLC | 35.953 | 84,09 | 1.506 | 32,80 | ||||
| 2026-02-05 | 13F | Atria Investments Llc | 0 | -100,00 | 0 | |||||
| 2026-02-09 | 13F | Hartland & Co., LLC | 3.101 | 7,97 | 130 | -22,29 | ||||
| 2026-03-06 | 13F | Hsbc Holdings Plc | 471.886 | 191,48 | 19.922 | 111,37 | ||||
| 2026-02-10 | 13F | MUFG Securities EMEA plc | 5.719 | 114,44 | 240 | 55,19 | ||||
| 2026-01-27 | 13F/A | Tributary Capital Management, LLC | 0 | -100,00 | 0 | |||||
| 2026-04-08 | 13F | DiNuzzo Private Wealth, Inc. | 25 | 78,57 | 1 | |||||
| 2025-11-14 | 13F | Redwood Investment Management, Llc | 0 | -100,00 | 0 | |||||
| 2026-01-27 | 13F | Forum Financial Management, LP | 0 | -100,00 | 0 | |||||
| 2025-11-10 | 13F | Clear Creek Financial Management, LLC | 0 | -100,00 | 0 | |||||
| 2025-11-14 | 13F | XTX Topco Ltd | 0 | -100,00 | 0 | |||||
| 2026-02-17 | 13F | Signature Equity Partners, LLC | 2.405 | 101 | ||||||
| 2026-02-13 | 13F | OMERS ADMINISTRATION Corp | 6.033 | 0,00 | 253 | -28,00 | ||||
| 2026-02-17 | 13F | Crawford Investment Counsel Inc | 0 | -100,00 | 0 | |||||
| 2026-02-17 | 13F | Cetera Investment Advisers | 113.998 | 5,81 | 4.775 | -23,69 | ||||
| 2026-04-13 | 13F | Creative Financial Designs Inc /adv | 51 | 0,00 | 2 | 0,00 | ||||
| 2026-02-09 | 13F | Jefferies Financial Group Inc. | 5.241 | -25,13 | 220 | -46,06 | ||||
| 2026-02-17 | 13F | Qube Research & Technologies Ltd | Put | 21.900 | -16,73 | 917 | -39,95 | |||
| 2026-02-17 | 13F | Qube Research & Technologies Ltd | Call | 41.300 | -14,85 | 1.730 | -38,57 | |||
| 2026-04-17 | 13F | AdvisorNet Financial, Inc | 730 | -35,11 | 31 | -36,17 | ||||
| 2026-02-06 | 13F | HighTower Advisors, LLC | 39.735 | -2,87 | 1.665 | -29,97 | ||||
| 2026-02-09 | 13F | Jefferies Financial Group Inc. | Call | 40.000 | 0,00 | 1.676 | -27,89 | |||
| 2026-02-13 | 13F | Trillium Asset Management, Llc | 181.260 | -15,71 | 7.741 | -38,03 | ||||
| 2026-02-17 | 13F | MAC Alpha Capital Management, LP | 95.803 | 4.013 | ||||||
| 2026-04-16 | 13F | SG Americas Securities, LLC | 276.116 | -65,56 | 12 | -66,67 | ||||
| 2026-02-12 | 13F | Colonial Trust Co / SC | 609 | 18,02 | 26 | -13,79 | ||||
| 2026-01-28 | 13F | Geneos Wealth Management Inc. | 2.264 | 21,13 | 95 | -12,96 | ||||
| 2026-02-12 | 13F | CIBC Private Wealth Group, LLC | 1.765 | -46,11 | 74 | -61,58 | ||||
| 2026-02-09 | 13F | Delta Asset Management Llc/tn | 183 | 0,00 | 8 | -30,00 | ||||
| 2026-02-09 | 13F | Mizuho Securities Usa Llc | 10.147 | -0,03 | 599 | 2,74 | ||||
| 2025-11-17 | 13F | FSA Wealth Management LLC | 100 | 0,00 | 6 | 0,00 | ||||
| 2026-01-26 | 13F | AE Wealth Management LLC | 7.029 | 11,04 | 294 | -19,89 | ||||
| 2026-02-02 | 13F | Horizon Investments, LLC | 4.324 | 79,79 | 181 | 31,16 | ||||
| 2026-04-14 | 13F | American State Bank (Iowa) | 0 | -100,00 | 0 | |||||
| 2026-02-12 | 13F | Tocqueville Asset Management L.p. | 21.271 | 891 | ||||||
| 2026-02-04 | 13F | Boyd Watterson Asset Management Llc/oh | 143 | 0,00 | 6 | -37,50 | ||||
| 2026-02-09 | 13F | Hantz Financial Services, Inc. | 721 | 380,67 | 0 |
Other Listings
| DE:0L5 | 37,50 € |