Grundlæggende statistik
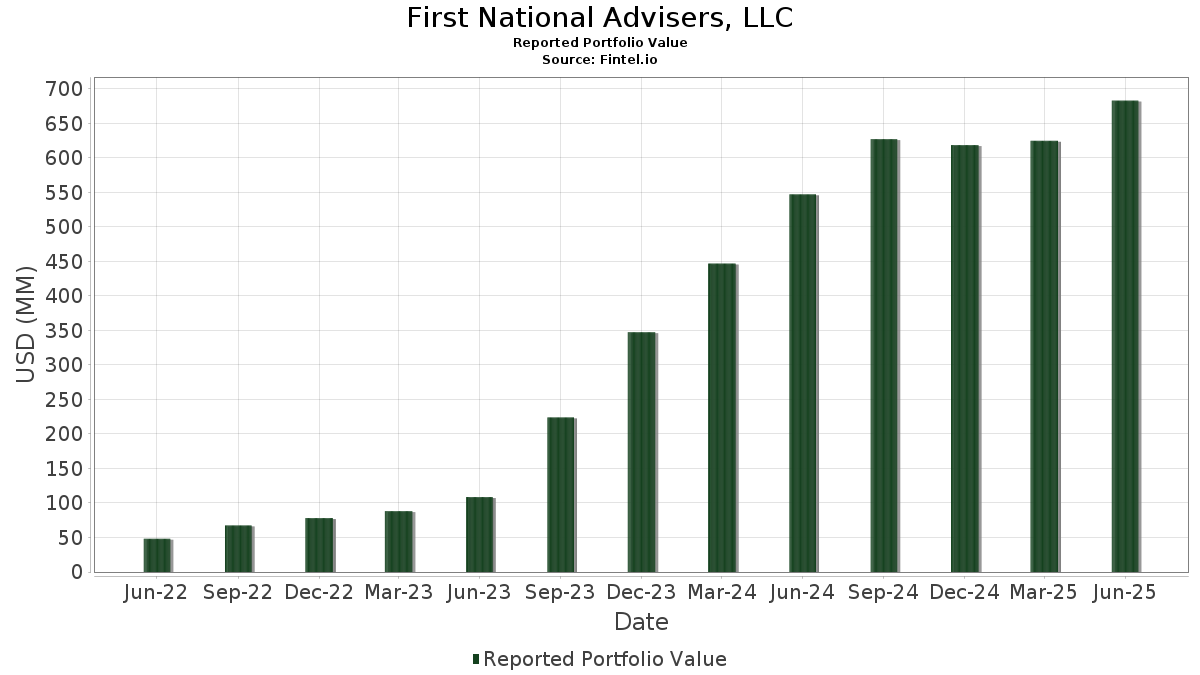
| Porteføljeværdi | $ 682.956.177 |
| Nuværende stillinger | 221 |
Seneste beholdninger, ydeevne, AUM (fra 13F, 13D)
First National Advisers, LLC har afsløret 221 samlede besiddelser i deres seneste SEC-arkivering. Den seneste porteføljeværdi er beregnet til at være $ 682.956.177 USD. Faktiske aktiver under forvaltning (AUM) er denne værdi plus kontanter (som ikke er oplyst). First National Advisers, LLCs største beholdninger er Microsoft Corporation (US:MSFT) , Dimensional ETF Trust - Dimensional International Core Equity Market ETF (US:DFAI) , NVIDIA Corporation (US:NVDA) , Apple Inc. (US:AAPL) , and Amazon.com, Inc. (US:AMZN) . First National Advisers, LLCs nye stillinger omfatter Arista Networks Inc (US:ANET) , Quest Diagnostics Incorporated (US:DGX) , Vanguard World Fund - Vanguard Mega Cap Growth ETF (US:MGK) , Palantir Technologies Inc. (US:PLTR) , and iShares, Inc. - iShares Core MSCI Emerging Markets ETF (US:IEMG) .
Top øger dette kvartal
Vi bruger ændringen i porteføljeallokeringen, fordi dette er den mest meningsfulde metrik. Ændringer kan skyldes handler eller ændringer i aktiekurser.
| Sikkerhed | Aktier (MM) |
Værdi (MM$) |
Portefølje % | ΔPortefølje % |
|---|---|---|---|---|
| 0,22 | 35,10 | 5,1389 | 1,3167 | |
| 0,08 | 41,67 | 6,1018 | 1,0292 | |
| 0,02 | 4,16 | 0,6091 | 0,5747 | |
| 0,03 | 2,76 | 0,4043 | 0,4043 | |
| 0,02 | 17,15 | 2,5116 | 0,3988 | |
| 0,02 | 2,46 | 0,3600 | 0,2927 | |
| 1,20 | 41,65 | 6,0983 | 0,2716 | |
| 0,01 | 1,61 | 0,2361 | 0,2361 | |
| 0,02 | 2,96 | 0,4334 | 0,2166 | |
| 0,06 | 3,97 | 0,5807 | 0,2165 |
Top falder i dette kvartal
Vi bruger ændringen i porteføljeallokeringen, fordi dette er den mest meningsfulde metrik. Ændringer kan skyldes handler eller ændringer i aktiekurser.
| Sikkerhed | Aktier (MM) |
Værdi (MM$) |
Portefølje % | ΔPortefølje % |
|---|---|---|---|---|
| 0,17 | 34,23 | 5,0120 | -0,9308 | |
| 0,00 | 1,31 | 0,1921 | -0,4370 | |
| 0,00 | 11,66 | 1,7074 | -0,3375 | |
| 0,02 | 0,89 | 0,1298 | -0,3170 | |
| 0,01 | 1,10 | 0,1617 | -0,2493 | |
| 0,01 | 1,95 | 0,2850 | -0,2177 | |
| 0,22 | 12,26 | 1,7950 | -0,2072 | |
| 0,00 | 0,00 | -0,1983 | ||
| 0,00 | 1,21 | 0,1769 | -0,1853 | |
| 0,02 | 5,81 | 0,8512 | -0,1755 |
13F og Fondsarkivering
Denne formular blev indsendt den 2025-08-13 for rapporteringsperioden 2025-06-30. Klik på linkikonet for at se den fulde transaktionshistorik.
Opgrader for at låse op for premium-data og eksportere til Excel ![]() .
.
| Sikkerhed | Type | Gennemsnitlig aktiekurs | Aktier (MM) |
Δ Aktier (%) |
Δ Aktier (%) |
Værdi ($MM) |
Portefølje (%) |
ΔPortefølje (%) |
|
|---|---|---|---|---|---|---|---|---|---|
| MSFT / Microsoft Corporation | 0,08 | -0,76 | 41,67 | 31,50 | 6,1018 | 1,0292 | |||
| DFAI / Dimensional ETF Trust - Dimensional International Core Equity Market ETF | 1,20 | 3,36 | 41,65 | 14,42 | 6,0983 | 0,2716 | |||
| NVDA / NVIDIA Corporation | 0,22 | 0,83 | 35,10 | 46,99 | 5,1389 | 1,3167 | |||
| AAPL / Apple Inc. | 0,17 | -0,18 | 34,23 | -7,80 | 5,0120 | -0,9308 | |||
| AMZN / Amazon.com, Inc. | 0,09 | 1,15 | 19,76 | 16,63 | 2,8937 | 0,1814 | |||
| JPM / JPMorgan Chase & Co. | 0,06 | 0,39 | 17,29 | 18,65 | 2,5318 | 0,1989 | |||
| META / Meta Platforms, Inc. | 0,02 | 1,48 | 17,15 | 29,96 | 2,5116 | 0,3988 | |||
| GOOG / Alphabet Inc. | 0,09 | -3,67 | 15,91 | 9,38 | 2,3298 | 0,0012 | |||
| JEPI / J.P. Morgan Exchange-Traded Fund Trust - JPMorgan Equity Premium Income ETF | 0,22 | -1,49 | 12,26 | -1,99 | 1,7950 | -0,2072 | |||
| BRK.A / Berkshire Hathaway Inc. | 0,00 | 0,00 | 11,66 | -8,73 | 1,7074 | -0,3375 | |||
| ABT / Abbott Laboratories | 0,06 | -1,92 | 8,75 | 0,55 | 1,2819 | -0,1117 | |||
| LLY / Eli Lilly and Company | 0,01 | 1,58 | 7,90 | -4,10 | 1,1562 | -0,1620 | |||
| MA / Mastercard Incorporated | 0,01 | 0,65 | 7,74 | 3,19 | 1,1332 | -0,0675 | |||
| COST / Costco Wholesale Corporation | 0,01 | 2,16 | 7,13 | 6,93 | 1,0441 | -0,0234 | |||
| NEE / NextEra Energy, Inc. | 0,10 | 1,88 | 6,75 | -0,24 | 0,9887 | -0,0948 | |||
| RTX / RTX Corporation | 0,04 | -0,69 | 6,23 | 9,49 | 0,9123 | 0,0013 | |||
| BKNG / Booking Holdings Inc. | 0,00 | 0,86 | 6,10 | 26,76 | 0,8927 | 0,1229 | |||
| WMT / Walmart Inc. | 0,06 | 0,49 | 6,03 | 11,93 | 0,8832 | 0,0205 | |||
| AMGN / Amgen Inc. | 0,02 | 1,13 | 5,81 | -9,37 | 0,8512 | -0,1755 | |||
| QCOM / QUALCOMM Incorporated | 0,04 | 0,42 | 5,76 | 4,10 | 0,8433 | -0,0423 | |||
| BRK.B / Berkshire Hathaway Inc. | 0,01 | 26,57 | 5,72 | 15,43 | 0,8380 | 0,0444 | |||
| GOOGL / Alphabet Inc. | 0,03 | 3,08 | 5,51 | 17,46 | 0,8069 | 0,0559 | |||
| XOM / Exxon Mobil Corporation | 0,05 | 0,19 | 5,37 | -9,18 | 0,7862 | -0,1602 | |||
| APH / Amphenol Corporation | 0,05 | -20,74 | 5,31 | 19,31 | 0,7782 | 0,0651 | |||
| BLK / BlackRock, Inc. | 0,01 | 1,24 | 5,31 | 12,24 | 0,7775 | 0,0201 | |||
| KO / The Coca-Cola Company | 0,07 | 7,60 | 5,14 | 6,31 | 0,7525 | -0,0214 | |||
| WFC / Wells Fargo & Company | 0,06 | -0,39 | 5,07 | 11,17 | 0,7420 | 0,0124 | |||
| VTI / Vanguard Index Funds - Vanguard Total Stock Market ETF | 0,02 | 5,66 | 4,91 | 16,85 | 0,7192 | 0,0463 | |||
| EOG / EOG Resources, Inc. | 0,04 | 0,83 | 4,78 | -5,95 | 0,6994 | -0,1136 | |||
| ZTS / Zoetis Inc. | 0,03 | 7,80 | 4,77 | 2,12 | 0,6978 | -0,0492 | |||
| HD / The Home Depot, Inc. | 0,01 | 0,90 | 4,68 | 0,95 | 0,6853 | -0,0568 | |||
| WM / Waste Management, Inc. | 0,02 | 0,70 | 4,58 | -0,48 | 0,6703 | -0,0659 | |||
| MTZ / MasTec, Inc. | 0,03 | -0,29 | 4,57 | 45,62 | 0,6690 | 0,1668 | |||
| PEP / PepsiCo, Inc. | 0,03 | 0,37 | 4,57 | -11,60 | 0,6684 | -0,1583 | |||
| LIN / Linde plc | 0,01 | 0,96 | 4,54 | 1,75 | 0,6643 | -0,0496 | |||
| MS / Morgan Stanley | 0,03 | 1,52 | 4,48 | 22,56 | 0,6564 | 0,0709 | |||
| ADBE / Adobe Inc. | 0,01 | 0,93 | 4,47 | 1,82 | 0,6544 | -0,0483 | |||
| CTAS / Cintas Corporation | 0,02 | -0,10 | 4,33 | 8,34 | 0,6338 | -0,0058 | |||
| CHD / Church & Dwight Co., Inc. | 0,04 | 2,76 | 4,25 | -10,27 | 0,6216 | -0,1359 | |||
| FI / Fiserv, Inc. | 0,02 | 11,97 | 4,21 | -12,57 | 0,6160 | -0,1544 | |||
| CB / Chubb Limited | 0,01 | 1,23 | 4,16 | -2,87 | 0,6093 | -0,0766 | |||
| ABBV / AbbVie Inc. | 0,02 | 2.086,63 | 4,16 | 1.843,93 | 0,6091 | 0,5747 | |||
| ORLY / O'Reilly Automotive, Inc. | 0,05 | 1.440,38 | 4,15 | -3,11 | 0,6076 | -0,0779 | |||
| VZ / Verizon Communications Inc. | 0,10 | 2,50 | 4,13 | -2,25 | 0,6051 | -0,0715 | |||
| CME / CME Group Inc. | 0,01 | 0,10 | 4,05 | 4,01 | 0,5924 | -0,0302 | |||
| BR / Broadridge Financial Solutions, Inc. | 0,02 | 3,45 | 4,03 | 3,71 | 0,5897 | -0,0320 | |||
| TJX / The TJX Companies, Inc. | 0,03 | 4,59 | 4,00 | 6,01 | 0,5860 | -0,0182 | |||
| MCHP / Microchip Technology Incorporated | 0,06 | 19,92 | 3,97 | 74,36 | 0,5807 | 0,2165 | |||
| BRO / Brown & Brown, Inc. | 0,04 | -0,06 | 3,91 | -10,94 | 0,5720 | -0,1302 | |||
| TSLA / Tesla, Inc. | 0,01 | 4,11 | 3,88 | 27,60 | 0,5680 | 0,0814 | |||
| AME / AMETEK, Inc. | 0,02 | 0,07 | 3,86 | 5,18 | 0,5652 | -0,0223 | |||
| RCL / Royal Caribbean Cruises Ltd. | 0,01 | -0,81 | 3,79 | 51,24 | 0,5545 | 0,1536 | |||
| CVX / Chevron Corporation | 0,03 | 1,24 | 3,76 | -13,37 | 0,5513 | -0,1443 | |||
| ETN / Eaton Corporation plc | 0,01 | 1,10 | 3,68 | 32,79 | 0,5390 | 0,0952 | |||
| MKL / Markel Group Inc. | 0,00 | 8,95 | 3,57 | 16,42 | 0,5232 | 0,0318 | |||
| MCO / Moody's Corporation | 0,01 | 0,90 | 3,54 | 8,70 | 0,5179 | -0,0030 | |||
| SO / The Southern Company | 0,04 | 1,19 | 3,52 | 1,03 | 0,5153 | -0,0422 | |||
| CFR / Cullen/Frost Bankers, Inc. | 0,03 | 1,30 | 3,44 | 3,99 | 0,5039 | -0,0258 | |||
| ATO / Atmos Energy Corporation | 0,02 | 2,57 | 3,25 | 2,26 | 0,4762 | -0,0329 | |||
| EW / Edwards Lifesciences Corporation | 0,04 | 30,29 | 3,24 | 40,55 | 0,4751 | 0,1057 | |||
| VOO / Vanguard Index Funds - Vanguard S&P 500 ETF | 0,01 | -0,21 | 3,22 | 10,32 | 0,4713 | 0,0042 | |||
| FICO / Fair Isaac Corporation | 0,00 | 13,70 | 3,20 | 12,72 | 0,4687 | 0,0141 | |||
| IR / Ingersoll Rand Inc. | 0,04 | 2,54 | 3,16 | 6,59 | 0,4621 | -0,0119 | |||
| MANH / Manhattan Associates, Inc. | 0,02 | 33,36 | 3,12 | 52,22 | 0,4568 | 0,1287 | |||
| GLW / Corning Incorporated | 0,06 | 4,58 | 3,03 | 20,14 | 0,4438 | 0,0401 | |||
| DIS / The Walt Disney Company | 0,02 | 73,92 | 2,96 | 118,61 | 0,4334 | 0,2166 | |||
| EQH / Equitable Holdings, Inc. | 0,05 | -0,90 | 2,95 | 6,70 | 0,4313 | -0,0106 | |||
| PCT / PureCycle Technologies, Inc. | 0,21 | -22,21 | 2,90 | 53,95 | 0,4250 | 0,1233 | |||
| LFUS / Littelfuse, Inc. | 0,01 | 16,28 | 2,89 | 34,01 | 0,4235 | 0,0779 | |||
| AVGO / Broadcom Inc. | 0,01 | 8,26 | 2,88 | 78,33 | 0,4217 | 0,1631 | |||
| AMT / American Tower Corporation | 0,01 | 1,69 | 2,87 | 3,28 | 0,4197 | -0,0245 | |||
| ACN / Accenture plc | 0,01 | 1,69 | 2,86 | -2,59 | 0,4193 | -0,0513 | |||
| FAF / First American Financial Corporation | 0,05 | 1,14 | 2,81 | -5,38 | 0,4120 | -0,0640 | |||
| PAYC / Paycom Software, Inc. | 0,01 | 53,30 | 2,80 | 62,35 | 0,4099 | 0,1339 | |||
| TXN / Texas Instruments Incorporated | 0,01 | 0,54 | 2,80 | 16,17 | 0,4093 | 0,0241 | |||
| ANET / Arista Networks Inc | 0,03 | 2,76 | 0,4043 | 0,4043 | |||||
| TKR / The Timken Company | 0,04 | -0,28 | 2,68 | 0,68 | 0,3927 | -0,0338 | |||
| LW / Lamb Weston Holdings, Inc. | 0,05 | 0,61 | 2,58 | -2,12 | 0,3778 | -0,0442 | |||
| PWR / Quanta Services, Inc. | 0,01 | 3,30 | 2,57 | 53,68 | 0,3766 | 0,1086 | |||
| TXRH / Texas Roadhouse, Inc. | 0,01 | 2,96 | 2,52 | 15,81 | 0,3691 | 0,0206 | |||
| TMUS / T-Mobile US, Inc. | 0,01 | 4,99 | 2,52 | -6,19 | 0,3686 | -0,0610 | |||
| PTC / PTC Inc. | 0,01 | 4,25 | 2,51 | 15,96 | 0,3671 | 0,0210 | |||
| FR / First Industrial Realty Trust, Inc. | 0,05 | 1,34 | 2,50 | -9,59 | 0,3656 | -0,0766 | |||
| PG / The Procter & Gamble Company | 0,02 | 1,23 | 2,48 | -5,37 | 0,3636 | -0,0564 | |||
| UFPT / UFP Technologies, Inc. | 0,01 | 3,44 | 2,47 | 25,24 | 0,3612 | 0,0459 | |||
| BCPC / Balchem Corporation | 0,02 | 509,91 | 2,46 | 485,24 | 0,3600 | 0,2927 | |||
| MDLZ / Mondelez International, Inc. | 0,04 | 1,46 | 2,45 | 0,86 | 0,3592 | -0,0301 | |||
| NSSC / Napco Security Technologies, Inc. | 0,08 | 1,33 | 2,45 | 30,72 | 0,3583 | 0,0587 | |||
| VEA / Vanguard Tax-Managed Funds - Vanguard FTSE Developed Markets ETF | 0,04 | 0,20 | 2,36 | 12,37 | 0,3459 | 0,0094 | |||
| TRV / The Travelers Companies, Inc. | 0,01 | 1,04 | 2,34 | 2,23 | 0,3428 | -0,0238 | |||
| XEL / Xcel Energy Inc. | 0,03 | 1,21 | 2,34 | -2,62 | 0,3424 | -0,0420 | |||
| ENTG / Entegris, Inc. | 0,03 | 0,54 | 2,33 | -7,32 | 0,3412 | -0,0612 | |||
| V / Visa Inc. | 0,01 | 18,34 | 2,33 | 19,91 | 0,3405 | 0,0300 | |||
| UTHR / United Therapeutics Corporation | 0,01 | 3,80 | 2,32 | -3,25 | 0,3401 | -0,0442 | |||
| LNTH / Lantheus Holdings, Inc. | 0,03 | 0,77 | 2,29 | -15,49 | 0,3356 | -0,0984 | |||
| CSX / CSX Corporation | 0,07 | -4,92 | 2,26 | 5,47 | 0,3305 | -0,0122 | |||
| SYF / Synchrony Financial | 0,03 | -3,64 | 2,24 | 21,54 | 0,3280 | 0,0329 | |||
| COP / ConocoPhillips | 0,02 | 0,74 | 2,24 | -13,93 | 0,3276 | -0,0885 | |||
| LOW / Lowe's Companies, Inc. | 0,01 | 0,87 | 2,15 | -4,06 | 0,3151 | -0,0439 | |||
| SUI / Sun Communities, Inc. | 0,02 | 3,10 | 2,13 | 1,38 | 0,3120 | -0,0244 | |||
| JNJ / Johnson & Johnson | 0,01 | 1,18 | 2,13 | -6,79 | 0,3116 | -0,0540 | |||
| FANG / Diamondback Energy, Inc. | 0,02 | 1,92 | 2,13 | -12,41 | 0,3113 | -0,0771 | |||
| APD / Air Products and Chemicals, Inc. | 0,01 | 0,83 | 2,07 | -3,55 | 0,3024 | -0,0404 | |||
| ECL / Ecolab Inc. | 0,01 | 4,20 | 2,06 | 10,79 | 0,3022 | 0,0040 | |||
| POOL / Pool Corporation | 0,01 | -0,24 | 2,06 | -8,64 | 0,3019 | -0,0593 | |||
| SN / SharkNinja, Inc. | 0,02 | 2,14 | 2,03 | 21,22 | 0,2970 | 0,0291 | |||
| CDW / CDW Corporation | 0,01 | -44,38 | 1,95 | -38,03 | 0,2850 | -0,2177 | |||
| ICE / Intercontinental Exchange, Inc. | 0,01 | 4,77 | 1,92 | 11,39 | 0,2808 | 0,0053 | |||
| JLL / Jones Lang LaSalle Incorporated | 0,01 | 1,61 | 1,82 | 4,84 | 0,2664 | -0,0114 | |||
| RHI / Robert Half Inc. | 0,04 | 1,68 | 1,76 | -23,45 | 0,2582 | -0,1106 | |||
| ROP / Roper Technologies, Inc. | 0,00 | 4,27 | 1,63 | 0,25 | 0,2394 | -0,0217 | |||
| STT / State Street Corporation | 0,02 | -0,55 | 1,63 | 18,14 | 0,2385 | 0,0178 | |||
| CSCO / Cisco Systems, Inc. | 0,02 | 2,76 | 1,62 | 15,55 | 0,2373 | 0,0128 | |||
| RPM / RPM International Inc. | 0,01 | 2,61 | 1,62 | -2,53 | 0,2366 | -0,0289 | |||
| DGX / Quest Diagnostics Incorporated | 0,01 | 1,61 | 0,2361 | 0,2361 | |||||
| RVTY / Revvity, Inc. | 0,01 | -2,15 | 1,44 | -10,56 | 0,2110 | -0,0469 | |||
| REET / iShares Trust - iShares Global REIT ETF | 0,06 | 0,00 | 1,44 | 1,85 | 0,2101 | -0,0155 | |||
| USB / U.S. Bancorp | 0,03 | 0,02 | 1,42 | 7,15 | 0,2085 | -0,0041 | |||
| PSX / Phillips 66 | 0,01 | -0,64 | 1,36 | -4,09 | 0,1992 | -0,0277 | |||
| TMO / Thermo Fisher Scientific Inc. | 0,00 | -59,04 | 1,31 | -66,62 | 0,1921 | -0,4370 | |||
| UNP / Union Pacific Corporation | 0,01 | -3,69 | 1,23 | -6,18 | 0,1802 | -0,0298 | |||
| IJH / iShares Trust - iShares Core S&P Mid-Cap ETF | 0,02 | 0,03 | 1,22 | 6,38 | 0,1784 | -0,0050 | |||
| UNH / UnitedHealth Group Incorporated | 0,00 | -10,39 | 1,21 | -46,64 | 0,1769 | -0,1853 | |||
| UPS / United Parcel Service, Inc. | 0,01 | 0,95 | 1,13 | -7,36 | 0,1659 | -0,0299 | |||
| TSCO / Tractor Supply Company | 0,02 | 5,24 | 1,12 | 0,81 | 0,1642 | -0,0139 | |||
| MDT / Medtronic plc | 0,01 | -55,68 | 1,10 | -56,99 | 0,1617 | -0,2493 | |||
| DUK / Duke Energy Corporation | 0,01 | 3,03 | 1,10 | -0,27 | 0,1614 | -0,0156 | |||
| KEYS / Keysight Technologies, Inc. | 0,01 | 0,59 | 1,09 | 10,13 | 0,1592 | 0,0011 | |||
| PAYX / Paychex, Inc. | 0,01 | -14,60 | 1,08 | -19,52 | 0,1588 | -0,0568 | |||
| LAMR / Lamar Advertising Company | 0,01 | 91,36 | 1,02 | 104,19 | 0,1499 | 0,0696 | |||
| ICLR / ICON Public Limited Company | 0,01 | 23,94 | 1,01 | 3,06 | 0,1478 | -0,0090 | |||
| LMT / Lockheed Martin Corporation | 0,00 | 3,33 | 1,01 | 7,14 | 0,1472 | -0,0030 | |||
| T / AT&T Inc. | 0,03 | 0,69 | 0,99 | 3,13 | 0,1450 | -0,0088 | |||
| TGT / Target Corporation | 0,01 | -1,53 | 0,98 | -6,93 | 0,1437 | -0,0251 | |||
| IDA / IDACORP, Inc. | 0,01 | 4,34 | 0,95 | 3,70 | 0,1394 | -0,0076 | |||
| NDAQ / Nasdaq, Inc. | 0,01 | 3,03 | 0,94 | 21,40 | 0,1371 | 0,0137 | |||
| OLLI / Ollie's Bargain Outlet Holdings, Inc. | 0,01 | 6,25 | 0,91 | 20,42 | 0,1339 | 0,0122 | |||
| CMCSA / Comcast Corporation | 0,02 | -67,17 | 0,89 | -68,26 | 0,1298 | -0,3170 | |||
| BURL / Burlington Stores, Inc. | 0,00 | 5,92 | 0,87 | 3,31 | 0,1279 | -0,0073 | |||
| SF / Stifel Financial Corp. | 0,01 | 6,23 | 0,86 | 16,94 | 0,1264 | 0,0083 | |||
| CASY / Casey's General Stores, Inc. | 0,00 | 6,29 | 0,84 | 25,00 | 0,1224 | 0,0153 | |||
| BAX / Baxter International Inc. | 0,03 | 14,38 | 0,80 | 1,26 | 0,1175 | -0,0094 | |||
| SPY / SPDR S&P 500 ETF | 0,00 | 0,00 | 0,79 | 10,46 | 0,1161 | 0,0012 | |||
| SBUX / Starbucks Corporation | 0,01 | 3,66 | 0,79 | -3,18 | 0,1159 | -0,0149 | |||
| VYM / Vanguard Whitehall Funds - Vanguard High Dividend Yield ETF | 0,01 | 33,80 | 0,78 | 38,34 | 0,1148 | 0,0241 | |||
| VUG / Vanguard Index Funds - Vanguard Growth ETF | 0,00 | 14,33 | 0,78 | 35,24 | 0,1142 | 0,0218 | |||
| AMD / Advanced Micro Devices, Inc. | 0,01 | 2,41 | 0,72 | 41,29 | 0,1059 | 0,0240 | |||
| FELE / Franklin Electric Co., Inc. | 0,01 | 0,13 | 0,70 | -4,25 | 0,1023 | -0,0145 | |||
| CACI / CACI International Inc | 0,00 | 6,23 | 0,68 | 38,26 | 0,1000 | 0,0208 | |||
| SCHW / The Charles Schwab Corporation | 0,01 | -28,72 | 0,68 | -16,95 | 0,0990 | -0,0313 | |||
| CAG / Conagra Brands, Inc. | 0,03 | 0,00 | 0,67 | -23,25 | 0,0981 | -0,0416 | |||
| VTV / Vanguard Index Funds - Vanguard Value ETF | 0,00 | 13,39 | 0,66 | 15,96 | 0,0969 | 0,0056 | |||
| HUM / Humana Inc. | 0,00 | -21,91 | 0,66 | -27,84 | 0,0968 | -0,0499 | |||
| EXLS / ExlService Holdings, Inc. | 0,01 | 6,27 | 0,65 | -1,51 | 0,0957 | -0,0104 | |||
| MGV / Vanguard World Fund - Vanguard Mega Cap Value ETF | 0,00 | 0,00 | 0,65 | 1,72 | 0,0953 | -0,0070 | |||
| TTEK / Tetra Tech, Inc. | 0,02 | 6,27 | 0,64 | 30,61 | 0,0938 | 0,0153 | |||
| QQQ / Invesco QQQ Trust, Series 1 | 0,00 | -13,12 | 0,63 | 2,27 | 0,0926 | -0,0064 | |||
| NPO / Enpro Inc. | 0,00 | 17,48 | 0,61 | 39,18 | 0,0895 | 0,0192 | |||
| IJR / iShares Trust - iShares Core S&P Small-Cap ETF | 0,01 | -0,36 | 0,60 | 4,15 | 0,0882 | -0,0044 | |||
| CSL / Carlisle Companies Incorporated | 0,00 | 6,34 | 0,60 | 16,70 | 0,0880 | 0,0055 | |||
| SSB / SouthState Corporation | 0,01 | 6,29 | 0,59 | 5,32 | 0,0870 | -0,0033 | |||
| DORM / Dorman Products, Inc. | 0,00 | 3,59 | 0,58 | 5,42 | 0,0855 | -0,0032 | |||
| ADC / Agree Realty Corporation | 0,01 | 6,31 | 0,58 | 0,69 | 0,0852 | -0,0074 | |||
| PR / Permian Resources Corporation | 0,04 | 6,24 | 0,56 | 4,48 | 0,0820 | -0,0038 | |||
| SIGI / Selective Insurance Group, Inc. | 0,01 | 6,25 | 0,54 | 0,55 | 0,0798 | -0,0069 | |||
| MC / Moelis & Company | 0,01 | 6,27 | 0,52 | 13,60 | 0,0759 | 0,0028 | |||
| POWI / Power Integrations, Inc. | 0,01 | 20,15 | 0,51 | 32,99 | 0,0751 | 0,0134 | |||
| MRK / Merck & Co., Inc. | 0,01 | -54,32 | 0,49 | -59,75 | 0,0720 | -0,1234 | |||
| ITGR / Integer Holdings Corporation | 0,00 | 6,29 | 0,48 | 10,80 | 0,0706 | 0,0009 | |||
| AUB / Atlantic Union Bankshares Corporation | 0,01 | 33,93 | 0,46 | 34,50 | 0,0675 | 0,0126 | |||
| QLYS / Qualys, Inc. | 0,00 | 6,25 | 0,44 | 20,65 | 0,0651 | 0,0061 | |||
| ENOV / Enovis Corporation | 0,01 | 17,78 | 0,44 | -3,30 | 0,0643 | -0,0084 | |||
| MCD / McDonald's Corporation | 0,00 | 1,36 | 0,44 | -5,22 | 0,0639 | -0,0098 | |||
| ICFI / ICF International, Inc. | 0,01 | 6,28 | 0,43 | 5,90 | 0,0632 | -0,0020 | |||
| MZTI / The Marzetti Company | 0,00 | 21,60 | 0,43 | 20,06 | 0,0622 | 0,0056 | |||
| BLKB / Blackbaud, Inc. | 0,01 | 6,27 | 0,41 | 10,13 | 0,0605 | 0,0004 | |||
| LECO / Lincoln Electric Holdings, Inc. | 0,00 | 6,22 | 0,41 | 16,48 | 0,0601 | 0,0037 | |||
| WH / Wyndham Hotels & Resorts, Inc. | 0,00 | 6,26 | 0,41 | -4,71 | 0,0594 | -0,0087 | |||
| DIOD / Diodes Incorporated | 0,01 | 34,36 | 0,39 | 64,41 | 0,0569 | 0,0191 | |||
| MOH / Molina Healthcare, Inc. | 0,00 | 6,40 | 0,39 | -3,74 | 0,0566 | -0,0077 | |||
| AMBA / Ambarella, Inc. | 0,01 | 6,28 | 0,39 | 39,49 | 0,0565 | 0,0122 | |||
| UMBF / UMB Financial Corporation | 0,00 | -2,86 | 0,38 | 1,08 | 0,0550 | -0,0045 | |||
| ONTO / Onto Innovation Inc. | 0,00 | 32,14 | 0,37 | 9,82 | 0,0541 | 0,0003 | |||
| ADP / Automatic Data Processing, Inc. | 0,00 | 0,25 | 0,37 | 1,11 | 0,0536 | -0,0043 | |||
| NXST / Nexstar Media Group, Inc. | 0,00 | 6,30 | 0,36 | 2,56 | 0,0530 | -0,0035 | |||
| NTRS / Northern Trust Corporation | 0,00 | 0,00 | 0,36 | 28,57 | 0,0528 | 0,0079 | |||
| IWR / iShares Trust - iShares Russell Mid-Cap ETF | 0,00 | 0,00 | 0,36 | 8,16 | 0,0525 | -0,0006 | |||
| ENS / EnerSys | 0,00 | -9,19 | 0,35 | -14,90 | 0,0519 | -0,0148 | |||
| BLD / TopBuild Corp. | 0,00 | 6,36 | 0,35 | 12,86 | 0,0515 | 0,0016 | |||
| LNT / Alliant Energy Corporation | 0,01 | -4,93 | 0,35 | -10,74 | 0,0512 | -0,0115 | |||
| DPZ / Domino's Pizza, Inc. | 0,00 | 6,54 | 0,35 | 4,55 | 0,0505 | -0,0023 | |||
| NOG / Northern Oil and Gas, Inc. | 0,01 | 6,25 | 0,34 | -0,29 | 0,0502 | -0,0049 | |||
| MGK / Vanguard World Fund - Vanguard Mega Cap Growth ETF | 0,00 | 0,33 | 0,0488 | 0,0488 | |||||
| LDOS / Leidos Holdings, Inc. | 0,00 | 0,00 | 0,32 | 16,73 | 0,0471 | 0,0031 | |||
| FBIN / Fortune Brands Innovations, Inc. | 0,01 | 6,27 | 0,32 | -10,26 | 0,0462 | -0,0100 | |||
| SM / SM Energy Company | 0,01 | 6,26 | 0,30 | -12,13 | 0,0435 | -0,0107 | |||
| PLTR / Palantir Technologies Inc. | 0,00 | 0,29 | 0,0429 | 0,0429 | |||||
| DFAC / Dimensional ETF Trust - Dimensional U.S. Core Equity 2 ETF | 0,01 | 0,00 | 0,29 | 8,55 | 0,0428 | -0,0003 | |||
| VGT / Vanguard World Fund - Vanguard Information Technology ETF | 0,00 | 3,82 | 0,29 | 26,87 | 0,0422 | 0,0059 | |||
| AMN / AMN Healthcare Services, Inc. | 0,01 | -0,95 | 0,29 | -16,28 | 0,0422 | -0,0129 | |||
| MKSI / MKS Inc. | 0,00 | -78,84 | 0,29 | -73,79 | 0,0421 | -0,1333 | |||
| IBM / International Business Machines Corporation | 0,00 | 7,90 | 0,29 | 27,80 | 0,0419 | 0,0061 | |||
| VO / Vanguard Index Funds - Vanguard Mid-Cap ETF | 0,00 | 6,75 | 0,27 | 15,61 | 0,0402 | 0,0022 | |||
| HSY / The Hershey Company | 0,00 | 0,00 | 0,27 | -3,19 | 0,0401 | -0,0051 | |||
| EFA / iShares Trust - iShares MSCI EAFE ETF | 0,00 | 0,00 | 0,26 | 9,17 | 0,0385 | 0,0000 | |||
| EVRG / Evergy, Inc. | 0,00 | 0,00 | 0,26 | 0,00 | 0,0380 | -0,0036 | |||
| DGRO / iShares Trust - iShares Core Dividend Growth ETF | 0,00 | 0,00 | 0,24 | 3,43 | 0,0354 | -0,0020 | |||
| TT / Trane Technologies plc | 0,00 | 0,23 | 0,0344 | 0,0344 | |||||
| IEMG / iShares, Inc. - iShares Core MSCI Emerging Markets ETF | 0,00 | 0,23 | 0,0335 | 0,0335 | |||||
| CI / The Cigna Group | 0,00 | 0,73 | 0,23 | 1,33 | 0,0334 | -0,0027 | |||
| OKE / ONEOK, Inc. | 0,00 | 0,41 | 0,22 | -17,36 | 0,0322 | -0,0104 | |||
| IEFA / iShares Trust - iShares Core MSCI EAFE ETF | 0,00 | 0,22 | 0,0317 | 0,0317 | |||||
| SPTM / SPDR Series Trust - SPDR Portfolio S&P 1500 Composite Stock Market ETF | 0,00 | 0,21 | 0,0311 | 0,0311 | |||||
| CLH / Clean Harbors, Inc. | 0,00 | 0,21 | 0,0305 | 0,0305 | |||||
| SMMD / iShares Trust - iShares Russell 2500 ETF | 0,00 | 0,21 | 0,0302 | 0,0302 | |||||
| BDX / Becton, Dickinson and Company | 0,00 | 0,42 | 0,21 | -24,35 | 0,0301 | -0,0135 | |||
| AMAT / Applied Materials, Inc. | 0,00 | 0,20 | 0,0298 | 0,0298 | |||||
| SCZ / iShares Trust - iShares MSCI EAFE Small-Cap ETF | 0,00 | 0,20 | 0,0298 | 0,0298 | |||||
| RSPT / Invesco Exchange-Traded Fund Trust - Invesco S&P 500 Equal Weight Technology ETF | 0,00 | 0,20 | 0,0297 | 0,0297 | |||||
| EQT / EQT Corporation | 0,00 | 0,20 | 0,0294 | 0,0294 | |||||
| DNP / DNP Select Income Fund Inc. | 0,01 | 0,00 | 0,10 | -1,01 | 0,0144 | -0,0015 | |||
| STZ / Constellation Brands, Inc. | 0,00 | -100,00 | 0,00 | 0,0000 | |||||
| FMC / FMC Corporation | 0,00 | -100,00 | 0,00 | -100,00 | -0,1983 | ||||
| O / Realty Income Corporation | 0,00 | -100,00 | 0,00 | 0,0000 | |||||
| UPBD / Upbound Group, Inc. | 0,00 | -100,00 | 0,00 | 0,0000 | |||||
| JAZZ / Jazz Pharmaceuticals plc | 0,00 | -100,00 | 0,00 | 0,0000 |