Grundlæggende statistik
| Institutionelle ejere | 595 total, 543 long only, 0 short only, 52 long/short - change of -35,47% MRQ |
| Gennemsnitlig porteføljeallokering | 1.6629 % - change of 7,61% MRQ |
| Institutionelle aktier (lange) | 427.425.779 (ex 13D/G) - change of -12,26MM shares -2,79% MRQ |
| Institutionel værdi (lang) | $ 46.179.353 USD ($1000) |
Institutionelt ejerskab og aktionærer
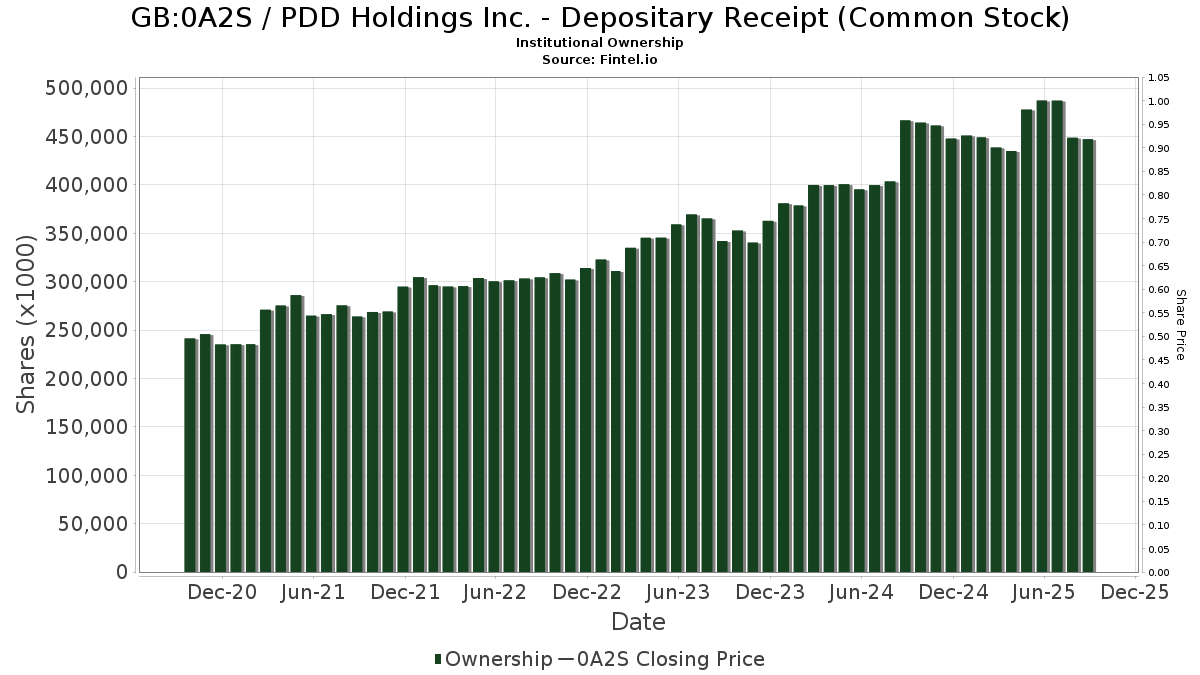
PDD Holdings Inc. - Depositary Receipt (Common Stock) (GB:0A2S) har 595 institutionelle ejere og aktionærer, der har indsendt 13D/G- eller 13F-formularer til Securities Exchange Commission (SEC). Disse institutioner har i alt 427,425,779 aktier. Største aktionærer omfatter BlackRock, Inc., Vanguard Group Inc, Baillie Gifford & Co, Fmr Llc, State Street Corp, H&H International Investment, LLC, SC CHINA HOLDING Ltd, Hillhouse Capital Advisors, Ltd., Norges Bank, and Sc Us (ttgp), Ltd. .
PDD Holdings Inc. - Depositary Receipt (Common Stock) (LSE:0A2S) institutionel ejerskabsstruktur viser aktuelle positioner i virksomheden efter institutioner og fonde, samt seneste ændringer i positionsstørrelse. Større aktionærer kan omfatte individuelle investorer, investeringsforeninger, hedgefonde eller institutioner. Skema 13D angiver, at investoren besidder (eller besidder) mere end 5 % af virksomheden og har til hensigt (eller har til hensigt at) aktivt at forfølge en ændring i forretningsstrategi. Skema 13G indikerer en passiv investering på over 5%.
Fondens stemningsscore
Fund Sentiment Score (fka Ownership Accumulation Score) finder de aktier, der bliver mest købt af fonde. Det er resultatet af en sofistikeret, multi-faktor kvantitativ model, der identificerer virksomheder med de højeste niveauer af institutionel akkumulering. Scoringsmodellen bruger en kombination af den samlede stigning i oplyste ejere, ændringerne i porteføljeallokeringer i disse ejere og andre målinger. Tallet går fra 0 til 100, hvor højere tal indikerer et højere niveau af akkumulering for sine jævnaldrende, og 50 er gennemsnittet.
Opdateringsfrekvens: Dagligt
Se Ownership Explorer, som giver en liste over højest rangerende virksomheder.
AI+ Ask Fintel’s AI assistant about PDD Holdings Inc. - Depositary Receipt (Common Stock).
Select a question to share a public post with an AI-crafted answer.
Thinking of good questions…
13F og NPORT arkivering
Detaljer om 13F-arkivering er gratis. Detaljer om NP-ansøgninger kræver et premium-medlemskab. Grønne rækker angiver nye positioner. Røde rækker angiver lukkede positioner. Klik på linket ikon for at se den fulde transaktionshistorik.
Opgrader
for at låse premium-data op og eksportere til Excel ![]() .
.
| Fil dato | Kilde | Investor | Type | Gennemsnitlig pris (Øst) |
Aktier | Δ Aktier (%) |
Rapporteret Værdi ($1000) |
Δ Værdi (%) |
Port Alloc (%) |
|
|---|---|---|---|---|---|---|---|---|---|---|
| 2026-02-02 | 13F | Qrg Capital Management, Inc. | 10.605 | -2,05 | 1.203 | -16,00 | ||||
| 2026-04-15 | 13F | Exchange Traded Concepts, Llc | 222.057 | -8,51 | 22.690 | -17,56 | ||||
| 2026-02-05 | 13F | Bank Julius Baer & Co. Ltd, Zurich | 675 | -0,15 | 77 | -14,61 | ||||
| 2026-02-13 | 13F | Ieq Capital, Llc | 11.666 | -6,64 | 1.323 | -19,93 | ||||
| 2026-04-20 | 13F | Amiral Gestion | 27.000 | -3,57 | 2.759 | -13,11 | ||||
| 2026-04-24 | 13F | Key FInancial Inc | 82 | 0,00 | 8 | -11,11 | ||||
| 2026-02-10 | 13F | Crake Asset Management LLP | 46.000 | 5.216 | ||||||
| 2026-04-27 | 13F | Leonteq Securities AG | 99.141 | 71,40 | 10.130 | 54,47 | ||||
| 2026-02-13 | 13F | Causeway Capital Management Llc | 371.241 | 19,89 | 42.095 | 2,86 | ||||
| 2026-04-27 | 13F | Polaris Capital Management, LLC | 13.600 | 138,60 | 1.390 | 115,02 | ||||
| 2026-04-20 | 13F | Hilton Head Capital Partners, LLC | 5 | 1 | ||||||
| 2026-02-17 | 13F | GAM Holding AG | 22.196 | -51,43 | 2.517 | -58,34 | ||||
| 2026-01-14 | 13F | Hennion & Walsh Asset Management, Inc. | 6.502 | 4,03 | 737 | -10,77 | ||||
| 2026-02-17 | 13F | Advisory Services Network, LLC | 16.451 | 6,42 | 1.865 | -8,71 | ||||
| 2026-02-26 | 13F | Ssa Swiss Advisors Ag | 27.445 | 0,00 | 3.125 | -12,66 | ||||
| 2026-01-29 | 13F | UBS Group AG | Put | 2.843.100 | 11,73 | 322.379 | -4,15 | |||
| 2026-02-17 | 13F | one8zero8, LLC | 2.300 | 261 | ||||||
| 2026-01-29 | 13F | UBS Group AG | Call | 2.739.663 | 4,38 | 310.650 | -10,45 | |||
| 2026-01-29 | 13F | UBS Group AG | 4.148.190 | 68,25 | 470.363 | 44,35 | ||||
| 2026-02-12 | 13F | California Public Employees Retirement System | 1.195.822 | 0,13 | 135.594 | -14,09 | ||||
| 2026-02-11 | 13F | IvyRock Asset Management (HK) Ltd | 991.509 | -4,23 | 112.427 | -17,83 | ||||
| 2026-02-17 | 13F | Nearwater Capital Markets, Ltd | 83.100 | 0,00 | 9.423 | -14,21 | ||||
| 2026-02-10 | 13F | Hazlett, Burt & Watson, Inc. | 0 | -100,00 | 0 | |||||
| 2026-02-13 | 13F | Golden State Wealth Management, LLC | 6 | 0,00 | 1 | |||||
| 2026-01-21 | 13F | All-Stars Investment Ltd | 31.650 | -9,57 | 3.589 | -22,42 | ||||
| 2026-02-17 | 13F | Oberweis Asset Management Inc/ | 0 | -100,00 | 0 | |||||
| 2026-03-04 | 13F | Rehmann Capital Advisory Group | 2.122 | 0,28 | 241 | -13,98 | ||||
| 2026-02-13 | 13F | Edgestream Partners, L.P. | 0 | -100,00 | 0 | |||||
| 2026-02-13 | 13F | BNP Paribas Asset Management Holding S.A. | 499.516 | 36,08 | 57 | 16,67 | ||||
| 2026-02-13 | 13F | Headlands Technologies LLC | 5.974 | -64,63 | 677 | -69,67 | ||||
| 2026-02-13 | 13F | Resources Investment Advisors, LLC. | 1.889 | -5,03 | 214 | -18,32 | ||||
| 2026-02-13 | 13F | Boston Partners | 0 | -100,00 | 0 | |||||
| 2026-02-10 | 13F | Acadian Asset Management Llc | 1.411.514 | 27,73 | 160 | 9,59 | ||||
| 2025-11-14 | 13F | Think Investments LP | 0 | -100,00 | 0 | |||||
| 2026-02-13 | 13F | National Bank Of Canada /fi/ | 1.428.593 | 135,86 | 161.988 | 102,35 | ||||
| 2026-02-17 | 13F | Holocene Advisors, LP | 0 | -100,00 | 0 | -100,00 | ||||
| 2026-02-13 | 13F | Wexford Capital Lp | 30.371 | 9.075,53 | 3.444 | 7.906,98 | ||||
| 2026-02-17 | 13F | Norinchukin Bank, The | 25.317 | 19,22 | 2.871 | 2,28 | ||||
| 2026-02-11 | 13F | Capital International Investors | 4.698.655 | 20,75 | 532.780 | 3,59 | ||||
| 2026-04-14 | 13F | Focus Financial Network, Inc. | 0 | -100,00 | 0 | |||||
| 2026-02-17 | 13F | Orbis Allan Gray Ltd | 1.168.327 | -83,17 | 132.477 | -85,56 | ||||
| 2025-12-15 | 13F | FNY Investment Advisers, LLC | Call | 0 | -100,00 | 0 | ||||
| 2026-02-11 | 13F | Group One Trading, L.p. | Call | 2.075.700 | 55,13 | 235.364 | 33,09 | |||
| 2026-02-13 | 13F | Panagora Asset Management Inc | 123.896 | -39,85 | 14.049 | -48,39 | ||||
| 2026-02-11 | 13F | Group One Trading, L.p. | Put | 940.000 | 3,79 | 106.587 | -10,96 | |||
| 2026-02-12 | 13F | Voya Investment Management Llc | 225.227 | 22,93 | 25.538 | 5,46 | ||||
| 2025-10-30 | 13F | Ridgewood Investments LLC | Call | 0 | -100,00 | 0 | ||||
| 2025-10-30 | 13F | Ridgewood Investments LLC | 0 | -100,00 | 0 | |||||
| 2026-03-09 | 13F/A | CI Private Wealth, LLC | 8.440 | 0,90 | 957 | -13,39 | ||||
| 2026-02-11 | 13F | Krane Funds Advisors LLC | 6.397.960 | 4,22 | 725.465 | -8,45 | ||||
| 2026-02-17 | 13F | Public Employees Retirement System Of Ohio | 197.711 | -11,54 | 22.418 | -24,11 | ||||
| 2026-02-10 | 13F | Turn8 Private Wealth Inc. | 24.446 | 0,00 | 2.772 | -14,24 | ||||
| 2025-11-14 | 13F | Public Investment Fund | 0 | -100,00 | 0 | -100,00 | ||||
| 2026-04-22 | 13F | Pictet Asset Management Holding SA | 899.487 | -26,98 | 91.910 | -34,20 | ||||
| 2026-02-02 | 13F | Chung Wu Investment Group, LLC | 1.800 | 0,00 | 204 | -13,92 | ||||
| 2026-02-12 | 13F | M&G Plc | 325.505 | -0,03 | 36.782 | -14,42 | ||||
| 2026-02-17 | 13F | Susquehanna Advisors Group, Inc. | 0 | -100,00 | 0 | -100,00 | ||||
| 2026-02-13 | 13F | SC CHINA HOLDING Ltd | 11.348.426 | 0,00 | 1.203.728 | -18,85 | ||||
| 2026-01-23 | 13F | Howard Capital Management Inc. | 14.034 | 2,90 | 1.591 | -11,71 | ||||
| 2026-01-22 | 13F/A | Cresset Asset Management, LLC | 0 | -100,00 | 0 | |||||
| 2026-01-22 | 13F/A | Cresset Asset Management, LLC | Put | 0 | -100,00 | 0 | ||||
| 2026-02-19 | 13F | Atomi Financial Group, Inc. | 9.119 | 9,39 | 1.034 | -6,09 | ||||
| 2025-11-14 | 13F | Equitable Holdings, Inc. | 0 | -100,00 | 0 | |||||
| 2026-02-13 | 13F | Sc Us (ttgp), Ltd. | 8.841.576 | 0,00 | 1.002.546 | -14,21 | ||||
| 2025-11-10 | 13F | Garda Capital Partners Lp | Put | 0 | -100,00 | 0 | ||||
| 2025-11-10 | 13F | Garda Capital Partners Lp | Call | 0 | -100,00 | 0 | ||||
| 2026-01-29 | 13F | Vanguard Group Inc | 32.810.630 | 1,32 | 3.720.397 | -13,08 | ||||
| 2025-11-10 | 13F | Garda Capital Partners Lp | 0 | -100,00 | 0 | |||||
| 2026-02-13 | 13F | Goldstream Capital Management Ltd | 0 | -100,00 | 0 | |||||
| 2026-02-17 | 13F | Owl Creek Asset Management, L.P. | 0 | -100,00 | 0 | |||||
| 2026-02-17 | 13F | Qube Research & Technologies Ltd | Call | 518.900 | -12,64 | 58.838 | -25,05 | |||
| 2026-02-12 | 13F | AI-Squared Management Ltd | 27.143 | -84,96 | 3.078 | -87,10 | ||||
| 2026-02-17 | 13F | FACT Capital, LP | 73.156 | 20,07 | 8.295 | 3,02 | ||||
| 2026-02-13 | 13F | Korea Investment CORP | 554.687 | 1,61 | 62.896 | -12,83 | ||||
| 2026-02-17 | 13F | SRS Investment Management, LLC | 1.016.859 | -61,69 | 115.302 | -67,13 | ||||
| 2026-02-10 | 13F | Catalyst Capital Advisors LLC | 278 | -14,98 | 32 | -27,91 | ||||
| 2026-02-12 | 13F | Federation des caisses Desjardins du Quebec | 50.105 | 53,77 | 5.681 | 31,93 | ||||
| 2026-02-13 | 13F | Marathon Trading Investment Management LLC | 62.986 | 57,92 | 7.142 | 35,48 | ||||
| 2026-02-13 | 13F | Marathon Trading Investment Management LLC | Call | 58.200 | 7,98 | 6.599 | -7,36 | |||
| 2026-02-17 | 13F | Cetera Investment Advisers | 10.865 | -1,81 | 1.232 | -15,80 | ||||
| 2026-02-13 | 13F | Manufacturers Life Insurance Company, The | 484.402 | 97,44 | 54.981 | 69,56 | ||||
| 2026-02-13 | 13F | Marathon Trading Investment Management LLC | Put | 173.000 | 25,82 | 19.616 | 7,94 | |||
| 2026-02-17 | 13F | Polar Capital Holdings Plc | 577.391 | 3,87 | 65.470 | -10,89 | ||||
| 2025-11-04 | 13F | Blue Creek Capital Management Ltd | 116.721 | 0,00 | 15.427 | 26,29 | ||||
| 2026-02-17 | 13F | Qube Research & Technologies Ltd | Put | 565.500 | 0,89 | 64.122 | -13,44 | |||
| 2026-02-19 | 13F/A | Himalaya Capital Management LLC | 4.608.000 | 0,00 | 522.501 | -14,21 | ||||
| 2026-04-10 | 13F | Henry James International Management Inc. | 16.148 | 0,00 | 1.650 | -9,89 | ||||
| 2026-02-17 | 13F | Susquehanna Advisors Group, Inc. | Put | 0 | -100,00 | 0 | -100,00 | |||
| 2026-02-17 | 13F | Tiger Pacific Capital LP | 0 | -100,00 | 0 | |||||
| 2026-02-02 | 13F | Advisors Preferred, LLC | 3.436 | 265,53 | 398 | 215,08 | ||||
| 2026-02-13 | 13F | Natixis | 7.459 | -75,51 | 846 | -79,01 | ||||
| 2026-02-12 | 13F | ICICI Prudential Asset Management Co Ltd | 10.719 | 4,50 | 1.215 | -10,33 | ||||
| 2026-02-06 | 13F | HighTower Advisors, LLC | 8.486 | -34,34 | 962 | -43,68 | ||||
| 2026-03-12 | 13F/A | Peak6 Llc | Put | 1.470.400 | 18,75 | 166.729 | 1,88 | |||
| 2026-03-12 | 13F/A | Peak6 Llc | Call | 770.800 | -67,81 | 87.401 | -72,38 | |||
| 2026-02-11 | 13F | Ramirez Asset Management, Inc. | 90 | 0,00 | 10 | -9,09 | ||||
| 2026-03-12 | 13F/A | Peak6 Llc | 435.042 | 1.604,24 | 49.329 | 1.362,47 | ||||
| 2026-02-12 | 13F | BlackRock, Inc. | 39.152.152 | 9,23 | 4.439.463 | -6,29 | ||||
| 2026-02-13 | 13F | Citigroup Inc | 1.543.816 | -28,64 | 175.053 | -38,78 | ||||
| 2026-02-06 | 13F | Larson Financial Group LLC | 405 | 0,75 | 46 | -15,09 | ||||
| 2026-02-13 | 13F | Citigroup Inc | Call | 507.000 | -4,34 | 57.489 | -17,93 | |||
| 2026-02-13 | 13F | Citigroup Inc | Put | 1.077.000 | 15,78 | 122.121 | -0,67 | |||
| 2026-02-12 | 13F | BRILLIANCE ASSET MANAGEMENT Ltd | 595.174 | 67.487 | ||||||
| 2026-02-17 | 13F | SageView Advisory Group, LLC | 47 | 5 | ||||||
| 2026-02-13 | 13F | QVT Financial LP | 6.042 | 27,79 | 685 | 9,78 | ||||
| 2026-02-11 | 13F | Parallel Advisors, LLC | 3.110 | -0,64 | 353 | -14,77 | ||||
| 2026-02-13 | 13F | Charles-Lim Capital Ltd | 500.000 | -16,67 | 56.695 | -28,51 | ||||
| 2026-02-12 | 13F | Campbell & CO Investment Adviser LLC | 2.696 | -87,23 | 306 | -89,06 | ||||
| 2026-02-13 | 13F | SRS Capital Advisors, Inc. | 1.112 | -6,95 | 126 | -19,75 | ||||
| 2026-02-12 | 13F | Steward Partners Investment Advisory, Llc | 925 | 7,81 | 105 | -7,96 | ||||
| 2026-02-05 | 13F | WIM INVESTMENT MANAGEMENT Ltd | 0 | -100,00 | 0 | |||||
| 2026-02-12 | 13F | Brown Brothers Harriman & Co | 27 | 68,75 | 3 | 50,00 | ||||
| 2026-04-17 | 13F | Bell Investment Advisors, Inc | 87 | 19,18 | 9 | 0,00 | ||||
| 2025-11-14 | 13F | Public Investment Fund | Call | 0 | -100,00 | 0 | -100,00 | |||
| 2025-11-14 | 13F | Principal Street Partners, LLC | 0 | -100,00 | 0 | |||||
| 2026-02-05 | 13F | Allworth Financial LP | 237 | -7,42 | 27 | -21,21 | ||||
| 2026-04-21 | 13F/A | Corsair Capital Management, L.p. | 0 | -100,00 | 0 | |||||
| 2026-02-17 | 13F | Tower Research Capital LLC (TRC) | 38.324 | 329,83 | 4.346 | 268,85 | ||||
| 2026-04-13 | 13F | True Wealth Design, LLC | 46 | 318,18 | 5 | 300,00 | ||||
| 2025-11-12 | 13F | Keystone Investors Pte Ltd | 0 | -100,00 | 0 | -100,00 | ||||
| 2026-02-12 | 13F | Polen Capital Management Llc | 0 | -100,00 | 0 | |||||
| 2026-04-21 | 13F | Vise Technologies, Inc. | 15.131 | 0,00 | 1.716 | 0,00 | ||||
| 2026-02-05 | 13F | AustralianSuper Pty Ltd | 79.200 | 91,20 | 8.980 | 64,05 | ||||
| 2026-02-17 | 13F | Liontrust Investment Partners LLP | 36.392 | -53,51 | 4.126 | -60,12 | ||||
| 2026-04-21 | 13F | Financial Consulate, Inc | 6 | 100,00 | 1 | |||||
| 2026-02-11 | 13F | BIT Capital GmbH | 5.356 | -97,08 | 607 | -97,50 | ||||
| 2026-01-28 | 13F | Klp Kapitalforvaltning As | 181.400 | 7,85 | 20.569 | -7,48 | ||||
| 2026-02-11 | 13F | OPTIMAS CAPITAL Ltd | 120.256 | 269,46 | 13.636 | 216,95 | ||||
| 2025-11-14 | 13F | Binnacle Investments Inc | 271 | 281,69 | 36 | 400,00 | ||||
| 2026-02-11 | 13F | West Family Investments, Inc. | 3.144 | -21,91 | 356 | -33,08 | ||||
| 2026-04-13 | 13F | IFP Advisors, Inc | 1.360 | -55,41 | 139 | -60,00 | ||||
| 2026-02-20 | 13F | Kovitz Investment Group Partners, LLC | 8.847 | 1.003 | ||||||
| 2026-02-17 | 13F | Cantor Fitzgerald, L. P. | Put | 50.000 | 5.670 | |||||
| 2026-02-17 | 13F | Cantor Fitzgerald, L. P. | 109.110 | 99,33 | 12.372 | 129,94 | ||||
| 2026-02-17 | 13F | Point72 Asset Management, L.P. | 0 | -100,00 | 0 | -100,00 | ||||
| 2026-02-13 | 13F | Prudential Financial Inc | 60.984 | 9,04 | 6.941 | -6,09 | ||||
| 2025-10-30 | 13F | Twin Peaks Wealth Advisors, LLC | 0 | -100,00 | 0 | |||||
| 2026-04-15 | 13F | FNY Investment Advisers, LLC | 600 | 0 | ||||||
| 2026-02-13 | 13F | Sculptor Capital LP | Put | 0 | -100,00 | 0 | -100,00 | |||
| 2026-02-17 | 13F | DV Trading LLC | 452 | 51 | ||||||
| 2026-02-13 | 13F | Verition Fund Management LLC | Put | 88.200 | -45,01 | 10.001 | -52,83 | |||
| 2026-02-13 | 13F | Verition Fund Management LLC | Call | 199.700 | 41,33 | 22.644 | 21,25 | |||
| 2026-02-17 | 13F | Parallax Volatility Advisers, L.P. | Put | 487.400 | 18,70 | 55.266 | 1,84 | |||
| 2026-02-17 | 13F | Parallax Volatility Advisers, L.P. | Call | 649.100 | -18,32 | 73.601 | -29,93 | |||
| 2026-02-17 | 13F | Parallax Volatility Advisers, L.P. | 187.904 | 21.306 | ||||||
| 2025-11-12 | 13F | NewSquare Capital LLC | 0 | -100,00 | 0 | |||||
| 2026-02-10 | 13F | Nomura Asset Management Co Ltd | 128.886 | 4,91 | 14.614 | -10,00 | ||||
| 2026-02-13 | 13F | Kestra Advisory Services, LLC | 564 | 64 | ||||||
| 2026-02-13 | 13F | Verition Fund Management LLC | 31.797 | -68,30 | 3.605 | -72,81 | ||||
| 2026-02-12 | 13F | Barings Llc | 654.567 | 21,44 | 74.221 | 4,19 | ||||
| 2026-02-12 | 13F | Renaissance Technologies Llc | 273.900 | 66,61 | 31.058 | 42,94 | ||||
| 2026-02-13 | 13F | Pinpoint Asset Management (Singapore) Pte. Ltd. | 625.807 | 1,08 | 70.960 | -13,28 | ||||
| 2026-04-16 | 13F | TB Alternative Assets Ltd. | 340.228 | 0,00 | 34.764 | -9,89 | ||||
| 2026-02-17 | 13F | Cardiff Park Advisors, Llc | 4.556 | 0,00 | 517 | -14,29 | ||||
| 2026-02-17 | 13F | SummitTX Capital, L.P. | 4.528 | 513 | ||||||
| 2026-02-04 | 13F | Swiss Life Asset Management Ltd | 92.430 | 31,62 | 10.481 | 12,92 | ||||
| 2026-02-03 | 13F | Maxi Investments CY Ltd | 14.308 | 2 | ||||||
| 2026-04-27 | 13F | Ping Capital Management, Inc. | 20.500 | 2.095 | ||||||
| 2026-02-13 | 13F | Hudson Bay Capital Management LP | 0 | -100,00 | 0 | |||||
| 2026-02-17 | 13F | California State Teachers Retirement System | 309.209 | -4,97 | 35.061 | -18,47 | ||||
| 2026-02-17 | 13F | Capitolis Liquid Global Markets LLC | 72.000 | -5,26 | 8.164 | -18,72 | ||||
| 2026-02-17 | 13F | Wellington Management Group Llp | 810.863 | -9,36 | 91.944 | -22,24 | ||||
| 2025-11-07 | 13F | Prospect Financial Services LLC | 0 | -100,00 | 0 | -100,00 | ||||
| 2026-04-27 | 13F | Greenleaf Trust | 2.038 | 1,85 | 208 | -7,96 | ||||
| 2026-01-29 | 13F | Matthews International Capital Management Llc | 370.640 | -24,94 | 42.027 | -35,61 | ||||
| 2026-02-17 | 13F | Nomura Holdings Inc | 384.271 | 276,84 | 43.572 | 223,31 | ||||
| 2026-01-27 | 13F | Zurcher Kantonalbank (Zurich Cantonalbank) | 286.726 | 44,68 | 32.512 | 24,12 | ||||
| 2026-02-06 | 13F | Global Retirement Partners, LLC | 1.389 | 214,25 | 157 | 170,69 | ||||
| 2026-02-12 | 13F | Groupe la Francaise | 0 | -100,00 | 0 | |||||
| 2026-02-18 | 13F | GWM Advisors LLC | 4.543 | -16,26 | 515 | -28,17 | ||||
| 2026-01-29 | 13F | China Universal Asset Management Co., Ltd. | 40.052 | 41,24 | 4.541 | 21,19 | ||||
| 2026-02-17 | 13F | Ameriprise Financial Inc | 253.111 | -62,39 | 28.700 | -67,73 | ||||
| 2026-02-17 | 13F | Tcw Group Inc | 4.881 | 553 | ||||||
| 2026-02-13 | 13F | Polymer Capital Management (HK) LTD | 378.574 | 107,80 | 42.927 | 78,27 | ||||
| 2025-11-14 | 13F | Wetherby Asset Management Inc | 10.622 | 0,21 | 1.404 | 26,51 | ||||
| 2026-02-17 | 13F | Orland Properties Ltd | 138.835 | 0,00 | 15.743 | -14,21 | ||||
| 2026-02-12 | 13F | New York State Common Retirement Fund | 69.234 | -17,23 | 7.850 | -28,99 | ||||
| 2026-01-08 | 13F | Tuttle Tactical Management LLC | 8.866 | 37,93 | 1.005 | 18,37 | ||||
| 2026-02-09 | 13F | Fisher Asset Management, LLC | 573.184 | -0,48 | 64.993 | -14,62 | ||||
| 2026-02-12 | 13F | SWAN Capital LLC | 8 | 0,00 | 1 | -100,00 | ||||
| 2026-02-17 | 13F | Shelton Capital Management | 76.164 | 9,94 | 8.636 | -5,68 | ||||
| 2026-02-13 | 13F | Itau Unibanco Holding S.A. | 136.375 | 15.464 | ||||||
| 2026-02-09 | 13F | Geode Capital Management, Llc | 6.759.780 | 5,62 | 761.720 | -9,33 | ||||
| 2026-02-13 | 13F | Sanders Capital, LLC | 8.112.327 | -0,26 | 919.857 | -14,43 | ||||
| 2026-02-17 | 13F | Delaware Management Holdings, Inc. | 1.049.894 | 119.048 | ||||||
| 2026-02-17 | 13F | NEOS Investment Management LLC | 279.363 | 36,70 | 31.677 | 17,28 | ||||
| 2026-03-09 | 13F | EMC Capital Management | 500 | -50,00 | 0 | |||||
| 2026-02-04 | 13F | Kepler Cheuvreux (Suisse) SA | 28.007 | 8,04 | 3.176 | -7,33 | ||||
| 2026-02-13 | 13F | Candriam Luxembourg S.C.A. | 139.800 | -20,11 | 15.853 | -31,46 | ||||
| 2026-04-22 | 13F | ABN AMRO Bank N.V. | 7.293 | 0,00 | 749 | -9,11 | ||||
| 2026-02-11 | 13F | Prudential Plc | 1.751.095 | 12,47 | 198.557 | -3,51 | ||||
| 2026-01-05 | 13F | Commons Capital, Llc | 5.600 | 0,00 | 635 | -14,32 | ||||
| 2026-02-10 | 13F | Bank of New York Mellon Corp | 1.488.074 | -14,40 | 168.733 | -26,57 | ||||
| 2026-02-17 | 13F | Persistent Asset Partners Ltd | 16.423 | -24,85 | 1.862 | -35,53 | ||||
| 2026-02-17 | 13F | Advisor Group Holdings, Inc. | Call | 1 | 0,00 | 4 | -20,00 | |||
| 2026-02-14 | 13F | Triata Capital Ltd | 2.557.700 | 0,52 | 290.018 | -13,76 | ||||
| 2026-02-12 | 13F | Penserra Capital Management LLC | 7.509 | -21,54 | 1 | -100,00 | ||||
| 2026-02-17 | 13F | First Beijing Investment Ltd | 6.782.955 | 9,96 | 769.119 | -5,67 | ||||
| 2026-04-14 | 13F | Yarbrough Capital, LLC | 53.202 | 0,00 | 5.436 | -9,88 | ||||
| 2026-01-27 | 13F | WealthCollab, LLC | 73 | 0,00 | 8 | -11,11 | ||||
| 2026-02-17 | 13F | EFG International AG | 12.013 | 1.362 | ||||||
| 2026-02-13 | 13F | Caitong International Asset Management Co., Ltd | 67 | 8 | ||||||
| 2026-02-10 | 13F | Eurizon Capital SGR S.p.A. | 96.606 | 10.954 | ||||||
| 2025-11-03 | 13F | Truist Financial Corp | 0 | -100,00 | 0 | |||||
| 2026-04-24 | 13F | UMA Financial Services, Inc. | 39 | -40,00 | 4 | -57,14 | ||||
| 2026-02-03 | 13F | NewEdge Wealth, LLC | 15.583 | 3,56 | 1.767 | -13,90 | ||||
| 2026-02-11 | 13F | Ing Groep Nv | 3.887 | -2,61 | 441 | -16,51 | ||||
| 2026-04-15 | 13F | Myriad Asset Management US LP | 0 | -100,00 | 0 | |||||
| 2026-01-07 | 13F | Sagespring Wealth Partners, Llc | 3.457 | -5,16 | 392 | -18,50 | ||||
| 2026-02-13 | 13F | NLB Skladi, upravljanje premozenja, d.o.o. | 16.349 | 1.854 | ||||||
| 2026-02-17 | 13F | Bracebridge Capital, LLC | 9.000 | 1.021 | ||||||
| 2026-02-17 | 13F | Bracebridge Capital, LLC | Call | 193 | 2.188 | |||||
| 2026-02-17 | 13F | Bracebridge Capital, LLC | Put | 193 | 2.188 | |||||
| 2026-04-16 | 13F | BI Asset Management Fondsmaeglerselskab A/S | 211.209 | -4,48 | 22 | -16,00 | ||||
| 2026-02-13 | 13F | Rafferty Asset Management, LLC | 112.024 | 18,47 | 12.702 | 1,63 | ||||
| 2026-02-13 | 13F | Platinum Investment Management Ltd | 78.445 | -11,37 | 8.895 | -23,97 | ||||
| 2026-02-10 | 13F | IFG Advisory, LLC | 0 | -100,00 | 0 | |||||
| 2026-04-24 | 13F | LB Partners LLC | 22.000 | 2.248 | ||||||
| 2026-01-23 | 13F | Sumitomo Mitsui Trust Holdings, Inc. | 1.682.194 | -2,17 | 190.744 | -16,07 | ||||
| 2026-02-12 | 13F | Ensign Peak Advisors, Inc | 36.200 | 0,00 | 4.105 | -14,21 | ||||
| 2026-02-11 | 13F | Jpmorgan Chase & Co | 5.068.738 | -9,19 | 574.744 | -22,10 | ||||
| 2026-02-11 | 13F | Jpmorgan Chase & Co | Call | 639.600 | 10,62 | 72.524 | -5,10 | |||
| 2026-02-11 | 13F | Jpmorgan Chase & Co | Put | 577.900 | 12,28 | 65.528 | -3,67 | |||
| 2026-02-12 | 13F | Wealthspire Advisors, LLC | 0 | -100,00 | 0 | |||||
| 2026-01-06 | 13F | E Six Thirteen, Llc | 8.059 | -0,24 | 914 | -14,43 | ||||
| 2026-01-23 | 13F | Steigerwald, Gordon & Koch Inc. | 11 | 1 | ||||||
| 2025-11-13 | 13F | Eisler Capital Management Ltd. | 4.071 | -84,65 | 537 | -80,68 | ||||
| 2025-11-13 | 13F | Eisler Capital Management Ltd. | Call | 219.400 | 30,91 | 28.939 | 64,95 | |||
| 2026-04-15 | 13F | Compagnie Lombard Odier SCmA | 6.200 | 396,00 | 634 | 348,94 | ||||
| 2025-11-13 | 13F | Eisler Capital Management Ltd. | Put | 533.300 | 142,63 | 70.342 | 205,73 | |||
| 2026-01-28 | 13F | Legacy Capital Group California, Inc. | 3.092 | 351 | ||||||
| 2026-02-17 | 13F | Lazard Asset Management Llc | 784.898 | 9,32 | 89.000 | -6,21 | ||||
| 2026-02-04 | 13F | Clark Wealth Partners | 0 | -100,00 | 0 | |||||
| 2026-02-11 | 13F | Capital International Inc /ca/ | 409.537 | 14,66 | 46.437 | -1,63 | ||||
| 2026-04-20 | 13F | Assenagon Asset Management S.A. | 2.193.918 | -67,40 | 224.175 | -70,62 | ||||
| 2026-02-13 | 13F | JustInvest LLC | 17.688 | -1,23 | 2.006 | -15,29 | ||||
| 2026-02-12 | 13F | BRIGHT VALLEY CAPITAL Ltd | 72.600 | 8.232 | ||||||
| 2026-02-10 | 13F | Axq Capital, Lp | 0 | -100,00 | 0 | |||||
| 2026-02-17 | 13F | Nissay Asset Management Corp /japan/ /adv | 107.767 | 8,19 | 12.220 | -7,18 | ||||
| 2026-02-04 | 13F | Pacer Advisors, Inc. | 0 | -100,00 | 0 | |||||
| 2026-04-21 | 13F | Sicart Associates LLC | 11.631 | 0,00 | 1.188 | -9,86 | ||||
| 2026-02-06 | 13F | Handelsbanken Fonder AB | 289.419 | 10,39 | 33 | -5,88 | ||||
| 2026-01-28 | 13F | Migdal Insurance & Financial Holdings Ltd. | 1.590 | 0,00 | 0 | |||||
| 2026-02-13 | 13F | Great West Life Assurance Co /can/ | 548.649 | -39,62 | 62 | -47,46 | ||||
| 2026-02-02 | 13F | Varma Mutual Pension Insurance Co | 37.500 | 10,29 | 4.252 | -5,36 | ||||
| 2026-02-23 | 13F | Virtu Financial LLC | 18.338 | 2 | ||||||
| 2026-01-13 | 13F | Stephens Consulting, LLC | 1.000 | 0,00 | 113 | -14,39 | ||||
| 2026-02-12 | 13F | Keel Point, LLC | 3.512 | -17,85 | 398 | -29,56 | ||||
| 2026-02-05 | 13F | Cambridge Investment Research Advisors, Inc. | 7.285 | 277,85 | 1 | |||||
| 2026-02-17 | 13F | Hillhouse Capital Advisors, Ltd. | 10.721.400 | 24,77 | 1.215.700 | 7,05 | ||||
| 2026-02-13 | 13F | Morgan Stanley | 5.948.846 | -16,17 | 674.540 | -28,08 | ||||
| 2026-02-13 | 13F | Charles Schwab Investment Management Inc | 1.249.313 | 4,70 | 141.660 | -10,17 | ||||
| 2025-11-20 | 13F | Maven Securities LTD | Call | 0 | -100,00 | 0 | ||||
| 2026-02-13 | 13F | Cornerstone Financial Management LLC | 25 | 3 | ||||||
| 2026-04-27 | 13F | Leonteq Securities AG | Put | 0 | -100,00 | 0 | -100,00 | |||
| 2026-02-09 | 13F | Wcm Investment Management, Llc | 228.515 | 17,92 | 26.012 | 2,73 | ||||
| 2025-11-14 | 13F | Mangrove Partners | 0 | -100,00 | 0 | |||||
| 2026-02-10 | 13F | Norges Bank | 9.396.292 | 1.065.446 | ||||||
| 2025-11-20 | 13F | Maven Securities LTD | 0 | -100,00 | 0 | |||||
| 2026-02-17 | 13F | Clear Street Markets Llc | 64.117 | 7.270 | ||||||
| 2026-02-17 | 13F | Clear Street Markets Llc | Call | 10.000 | 1.134 | |||||
| 2025-11-20 | 13F | Maven Securities LTD | Put | 0 | -100,00 | 0 | ||||
| 2025-11-14 | 13F | Polymer Capital Management (US) LLC | 0 | -100,00 | 0 | |||||
| 2026-02-17 | 13F | Aqr Capital Management Llc | 0 | -100,00 | 0 | -100,00 | ||||
| 2025-11-17 | 13F | Sender Co & Partners, Inc. | 0 | -100,00 | 0 | |||||
| 2026-02-13 | 13F | Banco Santander, S.A. | 12.766 | -2,24 | 1.448 | -16,16 | ||||
| 2026-04-20 | 13F | Jfs Wealth Advisors, Llc | 97 | -11,01 | 10 | -25,00 | ||||
| 2026-01-30 | 13F | Archer Investment Corp | 17 | 0,00 | 2 | -50,00 | ||||
| 2026-02-09 | 13F | Frazier Financial Advisors, LLC | 4 | 0,00 | 0 | |||||
| 2026-04-24 | 13F | IFM Investors Pty Ltd | 75.408 | 0,54 | 7.705 | 96.212,50 | ||||
| 2026-02-17 | 13F | Two Sigma Securities, Llc | 0 | -100,00 | 0 | |||||
| 2026-02-05 | 13F | Thrivent Financial For Lutherans | 44.491 | 20,83 | 5 | 25,00 | ||||
| 2026-04-16 | 13F | Toth Financial Advisory Corp | 1 | 0,00 | 0 | |||||
| 2026-01-21 | 13F | AMS Capital Ltda | 0 | -100,00 | 0 | |||||
| 2026-01-27 | 13F | CenterStar Asset Management, LLC | Call | 0 | -100,00 | 0 | ||||
| 2026-02-13 | 13F | Avenir Tech Ltd | 1 | 0,00 | 0 | |||||
| 2026-01-27 | 13F | CenterStar Asset Management, LLC | Put | 0 | -100,00 | 0 | ||||
| 2026-01-30 | 13F | Jennison Associates Llc | 213.348 | 24.192 | ||||||
| 2026-02-12 | 13F | Quadrant Capital Group Llc | 21.197 | -0,18 | 2.404 | -14,36 | ||||
| 2026-04-20 | 13F | Arta Finance Wealth Management LLC | 2.970 | 2,73 | 303 | -7,34 | ||||
| 2025-11-13 | 13F | LGT Group Foundation | 0 | -100,00 | 0 | |||||
| 2026-02-10 | 13F | Eurizon SLJ Capital Ltd | 5.139 | 583 | ||||||
| 2026-02-17 | 13F | Brevan Howard Capital Management LP | Put | 96.000 | -76,95 | 174.167 | -80,28 | |||
| 2026-02-17 | 13F | Anatole Investment Management Ltd | 837.433 | 94.957 | ||||||
| 2026-02-17 | 13F | Brevan Howard Capital Management LP | Call | 101.000 | -84,51 | 183.238 | -86,74 | |||
| 2026-02-11 | 13F | Franklin Resources Inc | 802.538 | 17,79 | 91.000 | 1,05 | ||||
| 2026-02-14 | 13F | Taikang Asset Management (Hong Kong) Co Ltd | 95.665 | 7,12 | 10.847 | -8,10 | ||||
| 2026-02-17 | 13F | Millennium Management Llc | Call | 441.600 | -20,03 | 50.073 | -31,39 | |||
| 2026-02-13 | 13F | Van Eck Associates Corp | 36.560 | -12,41 | 4 | -20,00 | ||||
| 2026-02-17 | 13F | Millennium Management Llc | Put | 1.501.000 | 98,52 | 170.198 | 70,31 | |||
| 2025-11-14 | 13F | Flow Traders U.s. Llc | 0 | -100,00 | 0 | |||||
| 2026-02-17 | 13F | Millennium Management Llc | 382.550 | 132,90 | 43.377 | 99,81 | ||||
| 2025-11-14 | 13F | Axa S.a. | 0 | -100,00 | 0 | -100,00 | ||||
| 2026-02-03 | 13F | Crossmark Global Holdings, Inc. | 32.859 | 30,25 | 3.726 | 11,73 | ||||
| 2026-02-11 | 13F | Fosun International Ltd | 11.038 | 1.252 | ||||||
| 2025-11-14 | 13F | Kamunting Street Capital Management, L.P. | 0 | -100,00 | 0 | -100,00 | ||||
| 2026-02-06 | 13F | Fairtree Asset Management (Pty) Ltd | 10.209 | -29,30 | 1.158 | -39,36 | ||||
| 2026-02-03 | 13F | Sequoia Financial Advisors, LLC | 5.845 | -10,50 | 663 | -23,29 | ||||
| 2026-01-27 | 13F | TD Waterhouse Canada Inc. | 201 | 20.000,00 | 23 | |||||
| 2026-04-20 | 13F | Banque Cantonale Vaudoise | 6.064 | 7,04 | 620 | -3,43 | ||||
| 2026-02-14 | 13F | Frec Markets, Inc. | 2.932 | 333 | ||||||
| 2026-04-13 | 13F | Trust Co | 4 | 0,00 | 0 | |||||
| 2026-04-15 | 13F | Gf Fund Management Co. Ltd. | 830.784 | -18,48 | 84.890 | -26,54 | ||||
| 2026-02-18 | 13F | Cat Rock Capital Management Lp | 445.228 | 0,00 | 50.484 | -14,21 | ||||
| 2026-01-14 | 13F | Exchange Traded Concepts, Llc | Put | 0 | -100,00 | 0 | -100,00 | |||
| 2026-04-27 | 13F | Sound Income Strategies, LLC | 6 | 0,00 | 1 | |||||
| 2026-02-17 | 13F | Point72 Asset Management, L.P. | Put | 296.300 | 779,23 | 33.597 | 654,31 | |||
| 2026-02-17 | 13F | Point72 Asset Management, L.P. | Call | 493.800 | 5.326,37 | 55.992 | 4.558,15 | |||
| 2026-02-17 | 13F | Maytus Capital Management, LLC | 0 | -100,00 | 0 | |||||
| 2025-11-14 | 13F | Wolverine Trading, Llc | Call | 921.600 | 17,64 | 120.425 | 46,21 | |||
| 2025-11-14 | 13F | Wolverine Trading, Llc | Put | 582.400 | 38,34 | 76.102 | 71,93 | |||
| 2026-02-05 | 13F | May Hill Capital, LLC | 7.218 | 65,66 | 818 | 42,26 | ||||
| 2026-02-12 | 13F | Cibc World Markets Corp | 32.445 | -31,80 | 3.679 | -26,11 | ||||
| 2026-02-17 | 13F | Maniro Ltd | 18.346 | 2.080 | ||||||
| 2026-02-11 | 13F | Mirae Asset Securities (usa) Inc. | 100.247 | 11.367 | ||||||
| 2026-02-17 | 13F | FIL Ltd | 6.516.042 | -9,65 | 738.854 | -22,49 | ||||
| 2026-02-17 | 13F | H&H International Investment, LLC | 11.536.694 | 34,55 | 1.308.146 | 15,43 | ||||
| 2025-11-14 | 13F | Wolverine Trading, Llc | 31.490 | -63,84 | 4.115 | -55,07 | ||||
| 2026-01-30 | 13F | State of New Jersey Common Pension Fund D | 40.370 | 4.578 | ||||||
| 2026-01-23 | 13F | Bridgewater Advisors Inc. | 2.515 | 3,88 | 266 | -19,64 | ||||
| 2026-04-27 | 13F | RWC Asset Management LLP | 0 | -100,00 | 0 | |||||
| 2026-02-17 | 13F | Ardsley Advisory Partners Lp | Call | 0 | -100,00 | 0 | ||||
| 2026-01-20 | 13F | Cigna Investments Inc /new | 12.464 | -1,73 | 1 | 0,00 | ||||
| 2025-11-14 | 13F | Brooklands Fund Management Ltd | Call | 0 | -100,00 | 0 | ||||
| 2025-11-13 | 13F | Barometer Capital Management Inc. | 0 | -100,00 | 0 | -100,00 | ||||
| 2026-02-04 | 13F | NAN FUNG TRINITY (HK) Ltd | 108.100 | 0,00 | 12.257 | -14,21 | ||||
| 2026-02-09 | 13F | Genus Capital Management Inc. | 3.795 | 430 | ||||||
| 2026-02-13 | 13F | Ubs Oconnor Llc | 31.107 | -33,53 | 3.527 | -42,97 | ||||
| 2026-02-13 | 13F | Smartleaf Asset Management LLC | 377 | 230,70 | 43 | 200,00 | ||||
| 2026-02-12 | 13F | NetEase, Inc. | 3.555.488 | 0,00 | 403.157 | -14,21 | ||||
| 2026-02-05 | 13F | Central Asset Investments & Management Holdings (HK) Ltd | 14.083 | -63,28 | 1.597 | -68,51 | ||||
| 2026-02-11 | 13F | Cerity Partners LLC | 18.847 | -6,79 | 2.137 | -20,02 | ||||
| 2026-04-27 | 13F | La Banque Postale Asset Management SA | 66.000 | 11,86 | 6.744 | 0,79 | ||||
| 2026-04-16 | 13F | Allegheny Financial Group LTD | 2.395 | -0,70 | 245 | -10,62 | ||||
| 2026-02-17 | 13F | Quadrature Capital Ltd | 50.210 | -78,05 | 5.693 | -81,17 | ||||
| 2026-02-10 | 13F | Goldman Sachs Group Inc | Put | 3.413.600 | 34,36 | 387.068 | 15,27 | |||
| 2026-02-17 | 13F | Man Group plc | 533.660 | 3.510,45 | 60.512 | 2.998,36 | ||||
| 2026-02-17 | 13F | Credit Agricole S A | Call | 50.000 | 0,00 | 5.670 | -14,21 | |||
| 2026-02-10 | 13F | Goldman Sachs Group Inc | 8.826.751 | -12,18 | 1.000.865 | -24,66 | ||||
| 2026-02-17 | 13F | Man Group plc | Put | 5.000 | 8,70 | 567 | -6,75 | |||
| 2026-02-10 | 13F | Goldman Sachs Group Inc | Call | 979.900 | -46,65 | 111.111 | -54,23 | |||
| 2026-02-11 | 13F | 111 Capital | 6.018 | 682 | ||||||
| 2026-02-13 | 13F | Dodge & Cox | 4.439.800 | 503.429 | ||||||
| 2026-02-17 | 13F | Man Group plc | Call | 5.000 | 8,70 | 567 | -6,75 | |||
| 2026-01-26 | 13F | Mirae Asset Global Investments Co., Ltd. | 364.337 | 4,28 | 41.312 | -10,54 | ||||
| 2026-02-17 | 13F | Credit Agricole S A | 239.796 | 32,75 | 27.190 | 13,88 | ||||
| 2026-02-17 | 13F | Credit Agricole S A | Put | 25.000 | 0,00 | 2.835 | -14,23 | |||
| 2026-02-13 | 13F | Marshall Wace, Llp | Call | 9.100 | 1.032 | |||||
| 2026-02-13 | 13F | Marshall Wace, Llp | Put | 17.700 | 2.007 | |||||
| 2026-02-13 | 13F | Aspex Management (HK) Ltd | 3.109.525 | -1,98 | 353 | -15,99 | ||||
| 2026-02-05 | 13F | ANTIPODES PARTNERS Ltd | 98.144 | -3,69 | 11.129 | -17,37 | ||||
| 2026-02-13 | 13F | Marshall Wace, Llp | 4.512.664 | 511.691 | ||||||
| 2026-04-27 | 13F | Rwc Asset Advisors (us) Llc | 19.727 | -17,94 | 2.016 | -26,06 | ||||
| 2026-02-17 | 13F | Russell Investments Group, Ltd. | 1.074.635 | 30,12 | 122.050 | 12,25 | ||||
| 2026-04-22 | 13F | Union Bancaire Privee, UBP SA | 109.760 | 25,83 | 9.810 | 9,76 | ||||
| 2026-02-10 | 13F | Savant Capital, LLC | 2.816 | 7,11 | 319 | -8,07 | ||||
| 2025-12-15 | 13F/A | Hudson Bay Capital Management LP | Call | 0 | -100,00 | 0 | -100,00 | |||
| 2026-02-10 | 13F | Quantbot Technologies LP | 6.773 | 768 | ||||||
| 2026-02-17 | 13F | Bamco Inc /ny/ | 62.386 | 0,00 | 7.074 | -14,21 | ||||
| 2026-02-17 | 13F | Temasek Holdings (Private) Ltd | 4.682.894 | 7,70 | 530.993 | -7,61 | ||||
| 2026-02-10 | 13F | Bnp Paribas | 2.300 | 53,33 | 261 | 31,31 | ||||
| 2026-02-13 | 13F | Toroso Investments, LLC | 96.529 | -3,93 | 10.945 | -17,58 | ||||
| 2026-01-28 | 13F | Oversea-Chinese Banking CORP Ltd | 400.127 | 8,56 | 45.379 | -6,81 | ||||
| 2026-02-11 | 13F | Deutsche Bank Ag\ | 2.776.077 | 2,69 | 314.779 | -11,90 | ||||
| 2025-11-13 | 13F | Total Investment Management Inc | 0 | -100,00 | 0 | |||||
| 2026-02-12 | 13F | Qtron Investments LLC | 0 | -100,00 | 0 | |||||
| 2026-01-16 | 13F | Crewe Advisors LLC | 46 | 0,00 | 5 | -16,67 | ||||
| 2026-02-17 | 13F | Quantitative Investment Management, LLC | 0 | -100,00 | 0 | |||||
| 2026-04-16 | 13F | Franchise GP Ltd | 497.860 | 64,60 | 50.871 | 48,33 | ||||
| 2026-02-17 | 13F | Seldon Capital Lp | 48.226 | -2,53 | 5.468 | -16,38 | ||||
| 2026-02-17 | 13F | Toronto Dominion Bank | 11.225 | -67,38 | 1.273 | -72,03 | ||||
| 2026-01-23 | 13F | U.S. Capital Wealth Advisors, LLC | 0 | -100,00 | 0 | |||||
| 2026-02-13 | 13F | Parkside Financial Bank & Trust | 35 | 0,00 | 4 | -25,00 | ||||
| 2026-02-09 | 13F | Boundless Plain Holdings Ltd | 1.294.753 | 146.812 | ||||||
| 2026-04-24 | 13F | Root Financial Partners, LLC | 63 | 43,18 | 6 | 50,00 | ||||
| 2026-02-17 | 13F | Cederberg Capital Ltd | 755.900 | 0,00 | 100 | 0,00 | ||||
| 2026-02-19 | 13F/A | Headwater Capital Co Ltd | 260.000 | 73,33 | 29.481 | 48,71 | ||||
| 2025-11-12 | 13F | Close Asset Management Ltd | 0 | -100,00 | 0 | |||||
| 2026-02-17 | 13F | SIH Partners, LLLP | 0 | -100,00 | 0 | |||||
| 2025-11-21 | 13F/A | CIBC Bancorp USA Inc. | 24.455 | 3.232 | ||||||
| 2026-04-24 | 13F | Profund Advisors Llc | 82.749 | -12,24 | 8.455 | -20,91 | ||||
| 2026-02-09 | 13F | Freemont Capital Pte Ltd | 35.000 | 0,00 | 3.969 | -14,21 | ||||
| 2025-11-12 | 13F | Tounjian Advisory Partners, Llc | 0 | -100,00 | 0 | |||||
| 2026-02-10 | 13F | Parametrica Management Ltd | 29.230 | 52,00 | 3.314 | 30,42 | ||||
| 2025-11-14 | 13F | PineBridge Investments, L.P. | 8.830 | 29,28 | 1.167 | 63,45 | ||||
| 2025-11-04 | 13F | High Note Wealth, LLC | 0 | -100,00 | 0 | |||||
| 2026-02-17 | 13F | Veritas Asset Management LLP | 22.506 | 0,00 | 2.552 | -14,22 | ||||
| 2026-02-17 | 13F | Maple Rock Capital Partners Inc. | 306.641 | -40,91 | 34.770 | -49,31 | ||||
| 2025-11-14 | 13F | Point72 Hong Kong Ltd | 1.577.173 | 215,56 | 208.455 | 298,51 | ||||
| 2026-02-06 | 13F | Investment House Llc | 0 | -100,00 | 0 | |||||
| 2026-02-10 | 13F | Envestnet Asset Management Inc | 13.394 | -28,89 | 1.519 | -39,01 | ||||
| 2026-02-13 | 13F | Schroder Investment Management Group | 4.137.857 | 199,84 | 469.192 | 157,24 | ||||
| 2026-02-17 | 13F | Old Mission Capital Llc | 4.437 | 503 | ||||||
| 2025-11-14 | 13F | Grafton Street Partners Fund, LP | 0 | -100,00 | 0 | -100,00 | ||||
| 2026-02-12 | 13F | Ankerstar Wealth, LLC | 1 | 0 | ||||||
| 2026-02-09 | 13F | Morningstar Investment Management LLC | 3.034 | 0,00 | 0 | |||||
| 2026-02-12 | 13F | APG Asset Management N.V. | 380.428 | 0,77 | 36.729 | -13,51 | ||||
| 2025-11-14 | 13F | Luxor Capital Group, LP | 0 | -100,00 | 0 | |||||
| 2025-11-14 | 13F | Luxor Capital Group, LP | Call | 0 | -100,00 | 0 | ||||
| 2026-02-12 | 13F | Principal Securities, Inc. | 0 | -100,00 | 0 | -100,00 | ||||
| 2026-02-10 | 13F | Hershey Trust Co | 0 | -100,00 | 0 | -100,00 | ||||
| 2026-02-06 | 13F | Resona Asset Management Co.,Ltd. | 179.539 | -4,47 | 20.377 | -17,84 | ||||
| 2026-02-11 | 13F | O'shaughnessy Asset Management, Llc | 53.219 | 3,43 | 6.035 | -11,26 | ||||
| 2026-02-03 | 13F | SBI Securities Co., Ltd. | 2.672 | -2,12 | 303 | -16,11 | ||||
| 2026-02-12 | 13F | Skopos Labs, Inc. | 31.958 | 326,68 | 3.648 | 363,53 | ||||
| 2026-02-17 | 13F | Fullerton Fund Management Co Ltd | 8.179 | 927 | ||||||
| 2026-02-09 | 13F | Arista Wealth Management, LLC | 0 | -100,00 | 0 | |||||
| 2026-02-13 | 13F | Barclays Plc | Call | 679.200 | 14,54 | 77.014 | -1,74 | |||
| 2025-11-13 | 13F | Limestone Investment Advisors LP | Call | 0 | -100,00 | 0 | -100,00 | |||
| 2025-11-13 | 13F | Limestone Investment Advisors LP | Put | 0 | -100,00 | 0 | -100,00 | |||
| 2026-04-21 | 13F | Aaron Wealth Advisors LLC | 10.089 | 154,64 | 1.031 | 129,40 | ||||
| 2026-01-29 | 13F | IMC-Chicago, LLC | 347.618 | 39.416 | ||||||
| 2026-04-15 | 13F | Activest Wealth Management | 350 | 0,00 | 36 | -10,26 | ||||
| 2026-01-29 | 13F | IMC-Chicago, LLC | Put | 3.015.700 | 7,02 | 341.950 | -8,18 | |||
| 2026-01-29 | 13F | IMC-Chicago, LLC | Call | 3.531.100 | -46,57 | 400.391 | -54,16 | |||
| 2026-02-13 | 13F | Ubs Asset Management Americas Inc | 392 | 44 | ||||||
| 2026-01-30 | 13F | ABS Direct Equity Fund LLC | 57.530 | 33,69 | 6.523 | 14,70 | ||||
| 2026-02-02 | 13F | Danske Bank A/s | 109.112 | 1,30 | 12.372 | -13,09 | ||||
| 2026-02-18 | 13F | Mackenzie Financial Corp | 421.758 | 13,56 | 47.914 | -2,39 | ||||
| 2026-02-02 | 13F | Robertson Stephens Wealth Management, LLC | 4.000 | 0,00 | 454 | -14,20 | ||||
| 2026-02-13 | 13F | Barclays Plc | 2.660.115 | 57,80 | 301.630 | 35,38 | ||||
| 2026-02-13 | 13F | Barclays Plc | Put | 1.340.000 | 81,55 | 151.943 | 55,75 | |||
| 2025-11-04 | 13F | Twenty Acre Capital LP | 0 | -100,00 | 0 | -100,00 | ||||
| 2026-02-13 | 13F | Fortis Capital Management LLC | 0 | -100,00 | 0 | |||||
| 2026-02-17 | 13F | Guggenheim Capital Llc | 159.549 | 3,00 | 18.091 | -11,63 | ||||
| 2026-03-20 | 13F/A | Hsbc Holdings Plc | 4.669.352 | -44,46 | 531.078 | -52,10 | ||||
| 2026-04-20 | 13F | Ronald Blue Trust, Inc. | 3.410 | -2,60 | 348 | -12,12 | ||||
| 2026-03-20 | 13F/A | Hsbc Holdings Plc | Put | 128.700 | -96,71 | 14.601 | -97,15 | |||
| 2026-03-20 | 13F/A | Hsbc Holdings Plc | Call | 67.000 | 7.601 | |||||
| 2026-02-12 | 13F | Insigneo Advisory Services, Llc | 3.708 | 7,17 | 420 | -8,10 | ||||
| 2026-02-17 | 13F | Jones Financial Companies Lllp | 1.832 | 39,95 | 208 | 21,76 | ||||
| 2026-04-13 | 13F | E Fund Management Co., Ltd. | 4.593.053 | 34,94 | 469.318 | 31,74 | ||||
| 2026-02-09 | 13F | Huntington National Bank | 593 | 25,37 | 67 | 8,06 | ||||
| 2026-04-24 | 13F | Severin Investments, LLC | 0 | -100,00 | 0 | |||||
| 2026-01-15 | 13F | Allspring Global Investments Holdings, LLC | 556.693 | 4.697,01 | 64.437 | 4.033,23 | ||||
| 2026-02-17 | 13F | Hilltop Holdings Inc. | 5.504 | 624 | ||||||
| 2026-02-11 | 13F | Modus Advisors, LLC | 50 | 6 | ||||||
| 2026-02-17 | 13F | Comprehensive Financial Management LLC | 7.789 | -4,35 | 883 | -17,94 | ||||
| 2026-01-28 | 13F | DekaBank Deutsche Girozentrale | 408.010 | 0,00 | 83 | 54,72 | ||||
| 2026-02-10 | 13F | Lido Advisors, LLC | 1.638 | 0,00 | 214 | -1,39 | ||||
| 2026-02-11 | 13F | Capital Analysts, Inc. | 60 | -29,41 | 0 | |||||
| 2026-02-12 | 13F | BRYN MAWR TRUST Co | 0 | -100,00 | 0 | -100,00 | ||||
| 2026-01-23 | 13F | Westside Investment Management, Inc. | 458 | 2,23 | 53 | -13,33 | ||||
| 2026-02-03 | 13F | Virtus Family Office LLC | 37.134 | 1,32 | 4.211 | -13,09 | ||||
| 2026-04-22 | 13F | Janney Montgomery Scott LLC | 66.375 | 7 | ||||||
| 2026-02-13 | 13F | Dynamic Technology Lab Private Ltd | 0 | -100,00 | 0 | |||||
| 2025-11-14 | 13F | KEYWISE CAPITAL MANAGEMENT (HK) Ltd | Call | 0 | -100,00 | 0 | -100,00 | |||
| 2026-04-16 | 13F | SG Americas Securities, LLC | Call | 69.200 | -74,97 | 0 | -100,00 | |||
| 2026-02-03 | 13F | Mitsubishi UFJ Kokusai Asset Management Co., Ltd. | 860.912 | 5,25 | 99.651 | -7,82 | ||||
| 2026-02-09 | 13F | New Age Alpha Advisors, LLC | 35 | 0,00 | 4 | -25,00 | ||||
| 2026-02-17 | 13F | Himension Fund | 127.812 | 15,19 | 14.493 | -1,17 | ||||
| 2026-04-15 | 13F | Merit Financial Group, LLC | 5.377 | -22,48 | 549 | -30,15 | ||||
| 2026-02-12 | 13F | Marex Group plc | 199.627 | -14,31 | 22.636 | -26,49 | ||||
| 2026-02-13 | 13F | Walleye Trading LLC | 885.812 | 100.442 | ||||||
| 2026-04-23 | 13F | iA Global Asset Management Inc. | 85.201 | -6,02 | 9 | -20,00 | ||||
| 2026-02-13 | 13F | Walleye Trading LLC | Put | 3.432.200 | -21,05 | 389.177 | -32,27 | |||
| 2026-02-13 | 13F | Walleye Trading LLC | Call | 1.893.100 | -20,30 | 214.659 | -31,62 | |||
| 2026-02-13 | 13F | Centiva Capital, LP | Call | 629.800 | 989,62 | 71.413 | 834,85 | |||
| 2026-02-13 | 13F | Centiva Capital, LP | 400.000 | 96,86 | 45.356 | 68,89 | ||||
| 2026-02-13 | 13F | Centiva Capital, LP | Put | 2.216.500 | 58,40 | 251.329 | 35,89 | |||
| 2026-04-24 | 13F | Sumitomo Mitsui DS Asset Management Company, Ltd | 46.847 | 2,19 | 4.787 | -7,93 | ||||
| 2026-02-11 | 13F | Allianz Asset Management GmbH | 691.141 | 27,33 | 78.368 | 9,24 | ||||
| 2026-01-28 | 13F | Geneos Wealth Management Inc. | 0 | -100,00 | 0 | |||||
| 2026-02-13 | 13F | Sei Investments Co | 449.686 | 72,68 | 50.990 | 48,14 | ||||
| 2026-02-17 | 13F | Bayesian Capital Management, LP | 0 | -100,00 | 0 | |||||
| 2026-02-17 | 13F | Banco Bilbao Vizcaya Argentaria, S.a. | 0 | -100,00 | 0 | |||||
| 2026-02-17 | 13F | Citadel Advisors Llc | Call | 4.666.200 | -20,10 | 529.100 | -31,45 | |||
| 2026-02-17 | 13F | Citadel Advisors Llc | 315.262 | -76,54 | 35.748 | -79,88 | ||||
| 2026-02-17 | 13F | Citadel Advisors Llc | Put | 3.336.800 | -18,01 | 378.360 | -29,66 | |||
| 2026-02-17 | 13F | Woodline Partners LP | 0 | -100,00 | 0 | |||||
| 2026-04-06 | 13F | GAMMA Investing LLC | 599 | 115,47 | 61 | 96,77 | ||||
| 2026-02-17 | 13F | Boothbay Fund Management, Llc | 16.081 | 38,02 | 1.823 | 18,45 | ||||
| 2026-02-10 | 13F | Commonwealth Of Pennsylvania Public School Empls Retrmt Sys | 58.117 | 0,00 | 6.590 | -14,22 | ||||
| 2026-01-22 | 13F | Massachusetts Financial Services Co /ma/ | 1.259.912 | 1,23 | 142.861 | -13,15 | ||||
| 2026-02-10 | 13F/A | Northwestern Mutual Wealth Management Co | 17.704 | 21,03 | 2.007 | 3,83 | ||||
| 2026-01-15 | 13F | Gunderson Capital Management Inc. | 0 | -100,00 | 0 | |||||
| 2026-02-10 | 13F | National Pension Service | 196.838 | 9,68 | 22.319 | -5,90 | ||||
| 2026-02-12 | 13F | Comgest Global Investors S.a.s. | 55.752 | -1,34 | 6.322 | -15,36 | ||||
| 2026-02-17 | 13F | Newlands Management Operations LLC | 0 | -100,00 | 0 | |||||
| 2026-02-17 | 13F | Caption Management, LLC | 0 | -100,00 | 0 | |||||
| 2026-02-17 | 13F | Caption Management, LLC | Put | 0 | -100,00 | 0 | ||||
| 2026-02-12 | 13F | Nipun Capital, L.P. | 28.000 | 65,68 | 3.175 | 39,33 | ||||
| 2026-02-13 | 13F | Capula Management Ltd | Put | 177.800 | 315,42 | 20.161 | 256,44 | |||
| 2026-01-07 | 13F | Aventura Private Wealth, LLC | 0 | -100,00 | 0 | |||||
| 2026-02-13 | 13F | Capula Management Ltd | Call | 27.400 | -35,38 | 3.107 | -44,58 | |||
| 2026-02-13 | 13F | Rhumbline Advisers | 72.766 | -4,51 | 8.251 | -18,08 | ||||
| 2025-11-06 | 13F | Leading Securities Co Ltd | 0 | -100,00 | 0 | -100,00 | ||||
| 2026-02-13 | 13F | Victory Capital Management Inc | 333.281 | 2,13 | 37.791 | -12,38 | ||||
| 2026-04-27 | 13F | Victory Financial Group, Llc | 0 | -100,00 | 0 | |||||
| 2026-02-13 | 13F | Capula Management Ltd | 34.442 | 3.344,20 | 3.905 | 2.858,33 | ||||
| 2026-02-10 | 13F | Texas Yale Capital Corp. | 11.728 | -23,66 | 1.330 | -34,53 | ||||
| 2026-02-06 | 13F | EverSource Wealth Advisors, LLC | 1.547 | -15,56 | 175 | -27,69 | ||||
| 2026-02-13 | 13F | Healthcare Of Ontario Pension Plan Trust Fund | 710.731 | 36,42 | 80.590 | 17,04 | ||||
| 2025-11-12 | 13F | Anfield Capital Management, LLC | 0 | -100,00 | 0 | |||||
| 2026-02-17 | 13F | Creative Planning | 44.609 | -9,75 | 5.058 | -22,57 | ||||
| 2026-02-13 | 13F | Walleye Capital LLC | Call | 161.800 | 789,01 | 18.347 | 662,83 | |||
| 2026-02-13 | 13F | Walleye Capital LLC | Put | 151.400 | 100,53 | 17.167 | 72,05 | |||
| 2026-02-13 | 13F | Walleye Capital LLC | 73.216 | -47,36 | 8.302 | -54,84 | ||||
| 2026-02-17 | 13F | Dragoneer Investment Group, LLC | 1.835.428 | 0,00 | 208.119 | -14,21 | ||||
| 2025-11-14 | 13F | AXA Investment Managers S.A. | 198.948 | 26.295 | ||||||
| 2026-04-13 | 13F | Mather Group, Llc. | 97 | 10 | ||||||
| 2026-04-22 | 13F | Spire Wealth Management | 21 | 0,00 | 2 | 0,00 | ||||
| 2026-02-23 | 13F | Beaird Harris Wealth Management, LLC | 1 | -83,33 | 0 | |||||
| 2026-01-29 | 13F | WT Asset Management Ltd | 0 | -100,00 | 0 | |||||
| 2025-10-31 | 13F | Aegon Asset Management Uk Plc | 0 | -100,00 | 0 | -100,00 | ||||
| 2026-02-13 | 13F | Alberta Investment Management Corp | 11.300 | -34,68 | 1.281 | -43,96 | ||||
| 2026-02-13 | 13F | Solstein Capital, LLC | 14.233 | -3,17 | 1.614 | -16,94 | ||||
| 2026-01-30 | 13F | RV Capital GmbH | 0 | -100,00 | 0 | |||||
| 2026-02-13 | 13F | Public Sector Pension Investment Board | 414.330 | 0,58 | 46.981 | -13,71 | ||||
| 2026-02-17 | 13F | Jump Financial, LLC | 3.659 | -81,41 | 415 | -84,08 | ||||
| 2026-02-06 | 13F | Pnc Financial Services Group, Inc. | 6.211 | -5,85 | 704 | -19,17 | ||||
| 2026-02-17 | 13F | Punch Card Management L.P. | 415.004 | 0,00 | 47.057 | -14,21 | ||||
| 2026-04-21 | 13F | PDS Planning, Inc | 3.726 | 29,38 | 381 | 16,56 | ||||
| 2026-02-13 | 13F | Royal London Asset Management Ltd | 696.172 | 1,13 | 78.939 | -13,24 | ||||
| 2025-11-03 | 13F | J. Safra Sarasin Holding AG | 0 | -100,00 | 0 | -100,00 | ||||
| 2026-02-12 | 13F | Integrated Quantitative Investments LLC | 0 | -100,00 | 0 | |||||
| 2026-02-02 | 13F | Sparta 24 Ltd. | 8.371 | 949 | ||||||
| 2026-02-13 | 13F | Neuberger Berman Group LLC | 120.173 | 17,94 | 13.630 | 1,20 | ||||
| 2026-02-13 | 13F | Colony Group, LLC | 13.886 | 1,03 | 1.512 | -16,74 | ||||
| 2026-02-11 | 13F | Mirae Asset Securities (usa) Inc. | Put | 100.247 | 11.339 | |||||
| 2026-02-09 | 13F | Harbour Investments, Inc. | 94 | 1.466,67 | 11 | |||||
| 2026-02-17 | 13F | Laird Norton Trust Company, Llc | 15.852 | 1.797 | ||||||
| 2026-01-16 | 13F | Standard Life Aberdeen plc | 1.013.878 | -17,45 | 114.964 | -28,93 | ||||
| 2026-02-04 | 13F | Pathway Capital Management, Lp | 0 | -100,00 | 0 | |||||
| 2025-12-16 | 13F | Garde Capital, Inc. | 0 | -100,00 | 0 | |||||
| 2026-02-17 | 13F | StepStone Group LP | 5.841 | 562 | ||||||
| 2026-04-24 | 13F | ProShare Advisors LLC | 869.588 | -17,65 | 88.855 | -25,79 | ||||
| 2026-02-17 | 13F | DZ BANK AG Deutsche Zentral Genossenschafts Bank, Frankfurt am Main | 35.837 | -34,29 | 4.064 | -43,63 | ||||
| 2026-01-29 | 13F | Sanctuary Advisors, LLC | 0 | -100,00 | 0 | -100,00 | ||||
| 2026-04-23 | 13F | American National Bank | 0 | -100,00 | 0 | |||||
| 2026-02-12 | 13F | Commonwealth Equity Services, Llc | 3.913 | -17,04 | 444 | |||||
| 2026-02-06 | 13F | Greenwoods Asset Management Hong Kong Ltd. | 3.968.270 | 18,21 | 449.962 | 1,41 | ||||
| 2026-02-10 | 13F | Jupiter Asset Management Ltd | 180.704 | 721,38 | 20.490 | 604,85 | ||||
| 2026-02-11 | 13F | Winton Capital Group Ltd | 2.700 | 306 | ||||||
| 2026-02-12 | 13F | Alps Advisors Inc | 29.033 | -3,22 | 3.292 | -16,95 | ||||
| 2025-11-20 | 13F | First Affirmative Financial Network | 2.362 | 10,84 | 312 | 39,91 | ||||
| 2026-02-10 | 13F | CIBC Asset Management Inc | 150.924 | 6,20 | 17.113 | -8,89 | ||||
| 2026-02-11 | 13F | Empowered Funds, LLC | 18.231 | 2.067 | ||||||
| 2025-11-13 | 13F | Aware Super Pty Ltd as trustee of Aware Super | 73.243 | 0,00 | 9.681 | 26,29 | ||||
| 2026-02-03 | 13F | AnglePoint Asset Management Ltd | 513.112 | 74,14 | 58.182 | 49,40 | ||||
| 2026-01-29 | 13F | Resonant Capital Advisors, LLC | 0 | -100,00 | 0 | |||||
| 2026-02-17 | 13F | Tudor Investment Corp Et Al | Put | 274.500 | 31.126 | |||||
| 2026-02-17 | 13F | Tudor Investment Corp Et Al | 151.348 | 14,86 | 17.161 | -1,46 | ||||
| 2026-02-17 | 13F | Tudor Investment Corp Et Al | Call | 112.000 | 12.700 | |||||
| 2026-02-05 | 13F | Bessemer Group Inc | 106 | 0,00 | 0 | |||||
| 2026-02-10 | 13F | State of Wyoming | 9.280 | -3,53 | 1.052 | -17,23 | ||||
| 2026-02-13 | 13F | Dymon Asia Capital (singapore) Pte. Ltd. | 0 | -100,00 | 0 | |||||
| 2026-02-17 | 13F | Susquehanna International Group, Llp | Put | 7.685.600 | -24,51 | 871.470 | -35,24 | |||
| 2026-02-17 | 13F | Susquehanna International Group, Llp | Call | 7.496.700 | -57,30 | 850.051 | -63,37 | |||
| 2026-02-17 | 13F | Advisor Group Holdings, Inc. | 8.530 | -20,55 | 967 | -28,74 | ||||
| 2026-02-17 | 13F | Susquehanna International Group, Llp | 666.594 | -79,42 | 75.585 | -82,35 | ||||
| 2026-02-09 | 13F | Todd Asset Management Llc | 312.283 | -1,93 | 35.411 | -15,87 | ||||
| 2026-04-24 | 13F | Strs Ohio | 9.018 | -78,47 | 921 | -80,61 | ||||
| 2026-04-24 | 13F | Yousif Capital Management, Llc | 18.501 | 0,00 | 1.890 | -2,17 | ||||
| 2026-02-12 | 13F | Aviva Plc | 641.018 | -1,75 | 72.685 | -15,71 | ||||
| 2026-02-13 | 13F | Police & Firemen's Retirement System of New Jersey | 83.999 | -0,97 | 9.525 | -15,05 | ||||
| 2026-02-10 | 13F | Connor, Clark & Lunn Investment Management Ltd. | 216.765 | -27,50 | 24.579 | -37,81 | ||||
| 2026-04-14 | 13F | Clean Yield Group | 26 | 0,00 | 3 | 0,00 | ||||
| 2026-02-11 | 13F | Capital International Sarl | 27.738 | 7,49 | 3.145 | -7,77 | ||||
| 2026-02-06 | 13F | Carrhae Capital LLP | 222.654 | -42,46 | 25.247 | -50,63 | ||||
| 2026-02-13 | 13F | Bank Of Nova Scotia | 16.662 | 645,50 | 1.889 | 540,34 | ||||
| 2026-02-04 | 13F | Plato Investment Management Ltd | 1.940 | 0,00 | 221 | -12,99 | ||||
| 2026-02-02 | 13F | MN Wealth Advisors, LLC | 0 | -100,00 | 0 | |||||
| 2026-02-13 | 13F | Bank Of Nova Scotia | Put | 381 | 0,00 | 43 | -14,00 | |||
| 2026-02-05 | 13F | Elyxium Wealth, LLC | 43 | 5 | ||||||
| 2026-02-05 | 13F | STF Management LP | 3.392 | -49,35 | 385 | -56,61 | ||||
| 2026-01-15 | 13F | Range Financial Group LLC | 3.620 | 3,75 | 410 | -11,06 | ||||
| 2026-02-12 | 13F | Banco BTG Pactual S.A. | 68.967 | 135,13 | 7.820 | 101,75 | ||||
| 2025-11-07 | 13F | Sierra Ocean, Llc | 0 | -100,00 | 0 | |||||
| 2026-02-13 | 13F | Pinnacle Wealth Planning Services, Inc. | 1.190 | 135 | ||||||
| 2026-04-16 | 13F | SG Americas Securities, LLC | 6.301.820 | 94,61 | 644 | 75,20 | ||||
| 2026-02-17 | 13F | Saba Capital Management, L.P. | 36.318 | 64,05 | 4.118 | 40,74 | ||||
| 2026-02-17 | 13F | Saba Capital Management, L.P. | Put | 85.800 | 0,00 | 9.729 | -14,22 | |||
| 2026-02-03 | 13F | Ballentine Partners, LLC | 3.178 | 14,81 | 360 | -1,37 | ||||
| 2026-02-12 | 13F | Pitcairn Co | 0 | -100,00 | 0 | |||||
| 2026-04-27 | 13F | Y-Intercept (Hong Kong) Ltd | 48.419 | 4.947 | ||||||
| 2026-02-05 | 13F | Baader Bank INC | 3.073 | 345 | ||||||
| 2026-02-05 | 13F | Baader Bank INC | Call | 200.000 | 22.678 | |||||
| 2025-11-14 | 13F | Sylebra Capital Llc | 0 | -100,00 | 0 | |||||
| 2026-02-13 | 13F | Allianz Se | 0 | -100,00 | 0 | |||||
| 2026-02-17 | 13F | Appaloosa Lp | 1.775.000 | -1,39 | 201.267 | -15,40 | ||||
| 2026-02-17 | 13F | Rakuten Investment Management, Inc. | 62.688 | -54,75 | 7.156 | -51,98 | ||||
| 2026-04-27 | 13F | Td Private Client Wealth Llc | 3 | 0,00 | 0 | |||||
| 2026-02-12 | 13F | Triumph Capital Management | 6 | 1 | ||||||
| 2026-02-13 | 13F | Siren, L.L.C. | 63.401 | 46,08 | 7.189 | 25,33 | ||||
| 2026-02-17 | 13F | Redwood Investment Management, Llc | 7.647 | 1 | ||||||
| 2026-02-19 | 13F | Invesco Ltd. | 6.159.608 | 16,70 | 698.438 | 0,12 | ||||
| 2026-02-13 | 13F | Global Endowment Management, LP | 6.358 | -24,82 | 721 | -35,45 | ||||
| 2026-02-02 | 13F | Fifth Third Bancorp | 3.649 | 4,32 | 414 | -10,61 | ||||
| 2026-02-20 | 13F/A | CMT Capital Markets Trading GmbH | 63.508 | 5,96 | 7 | 0,00 | ||||
| 2026-02-18 | 13F | Ctc Llc | Call | 51 | -17,74 | 578 | -29,43 | |||
| 2026-02-17 | 13F | Sig Brokerage, Lp | Call | 63.000 | 0,00 | 7.144 | -14,21 | |||
| 2026-02-12 | 13F | Swiss National Bank | 1.552.644 | -2,99 | 176.054 | -16,77 | ||||
| 2025-11-14 | 13F | Sig Brokerage, Lp | 0 | -100,00 | 0 | -100,00 | ||||
| 2026-02-18 | 13F | Ctc Llc | Put | 45 | -45,12 | 510 | -52,91 | |||
| 2026-02-17 | 13F | CastleKnight Management LP | 56.700 | 0,00 | 6.429 | -14,21 | ||||
| 2025-11-03 | 13F | Valeo Financial Advisors, LLC | 0 | -100,00 | 0 | -100,00 | ||||
| 2026-02-17 | 13F | Agf Management Ltd | 2.030 | 0,00 | 230 | -14,18 | ||||
| 2026-02-12 | 13F | Alpha Family Trust | 2.815 | 0,00 | 319 | -14,25 | ||||
| 2026-02-12 | 13F | Sustainable Insight Capital Management, LLC | 2.938 | 20,51 | 333 | 3,42 | ||||
| 2026-03-10 | 13F | MY.Alpha Management HK Advisors Ltd | 145.263 | 16.471 | ||||||
| 2026-02-10 | 13F | Td Asset Management Inc | 86.650 | -11,42 | 9.825 | -24,00 | ||||
| 2026-02-13 | 13F | IDG China Venture Capital Fund IV Associates L.P. | 1.749.029 | -12,46 | 198.322 | -24,90 | ||||
| 2025-11-12 | 13F | Group One Trading, L.p. | 0 | -100,00 | 0 | -100,00 | ||||
| 2026-01-22 | 13F | BOCHK Asset Management Ltd | 200 | -97,33 | 23 | -97,78 | ||||
| 2026-02-17 | 13F | Price T Rowe Associates Inc /md/ | 3.262.954 | -39,24 | 370 | -47,95 | ||||
| 2026-01-27 | 13F | Asset Management One Co., Ltd. | 118.509 | -5,12 | 13.528 | -18,06 | ||||
| 2026-02-03 | 13F | Encompass More Asset Management | 3.168 | 359 | ||||||
| 2026-02-13 | 13F | Ossiam | 0 | -100,00 | 0 | -100,00 | ||||
| 2026-02-10 | 13F | Yunqi Capital Ltd | 185.100 | 27,83 | 20.988 | 9,67 | ||||
| 2026-01-29 | 13F | Sava Infond d.o.o. | 9.400 | 13,25 | 1.066 | -2,92 | ||||
| 2026-02-17 | 13F | Johns Hopkins University | 0 | -100,00 | 0 | -100,00 | ||||
| 2026-02-13 | 13F | MAI Capital Management | 22 | -74,12 | 2 | -81,82 | ||||
| 2026-04-24 | 13F | Private Advisor Group, LLC | 12.896 | -5,31 | 1.318 | -14,70 | ||||
| 2026-02-03 | 13F | Credit Industriel Et Commercial | Put | 30.200 | 0,00 | 3.424 | -14,21 | |||
| 2026-02-03 | 13F | Credit Industriel Et Commercial | 10.849 | 181,65 | 1.230 | 141,65 | ||||
| 2026-02-06 | 13F | Gsa Capital Partners Llp | 20.700 | 353,35 | 2 | |||||
| 2026-02-13 | 13F | OMERS ADMINISTRATION Corp | 27.805 | 292,89 | 3.153 | 237,11 | ||||
| 2026-02-13 | 13F | State Street Corp | 12.257.360 | 1,27 | 1.389.862 | -13,12 | ||||
| 2026-02-12 | 13F | Northwest & Ethical Investments L.P. | 0 | -100,00 | 0 | |||||
| 2026-04-06 | 13F | Versant Capital Management, Inc | 22 | 2 | ||||||
| 2026-02-13 | 13F | Mml Investors Services, Llc | 3.882 | 98,87 | 440 | 71,21 | ||||
| 2026-02-17 | 13F | Northern Trust Corp | 3.189.599 | -0,74 | 361.669 | -14,84 | ||||
| 2026-02-12 | 13F | Bank of Jackson Hole Trust | 22 | 2 | ||||||
| 2026-02-17 | 13F | Fmr Llc | 14.597.758 | -15,72 | 1.655.240 | -27,69 | ||||
| 2026-02-17 | 13F | Engineers Gate Manager LP | 21.056 | 2.388 | ||||||
| 2026-04-16 | 13F | SG Americas Securities, LLC | Put | 96.800 | -60,03 | 0 | ||||
| 2026-04-23 | 13F | North Star Investment Management Corp. | 57 | 67,65 | 6 | 66,67 | ||||
| 2026-02-12 | 13F | Rossby Financial, LCC | 3 | 0,00 | 0 | |||||
| 2026-01-15 | 13F | Nisa Investment Advisors, Llc | 315 | 5,00 | 36 | -10,26 | ||||
| 2026-01-29 | 13F | Teachers Retirement System Of The State Of Kentucky | 210.660 | -1,50 | 24 | -17,86 | ||||
| 2025-10-28 | 13F | Wolverine Asset Management Llc | Call | 0 | -100,00 | 0 | -100,00 | |||
| 2026-01-26 | 13F | AE Wealth Management LLC | 17.900 | 47,87 | 2.030 | 26,89 | ||||
| 2025-11-12 | 13F | Accuvest Global Advisors | 2.140 | -4,59 | 283 | 20,43 | ||||
| 2026-02-02 | 13F | Horizon Investments, LLC | 20.717 | 62,26 | 2.349 | 39,24 | ||||
| 2026-02-09 | 13F | Legal & General Group Plc | 4.147.464 | -8,35 | 470.280 | -21,38 | ||||
| 2026-02-10 | 13F | PARUS FINANCE (UK) Ltd | 112.506 | -38,68 | 12.757 | -47,39 | ||||
| 2026-02-12 | 13F | Advisors Asset Management, Inc. | 3.568 | -15,19 | 405 | -27,34 | ||||
| 2026-04-24 | 13F | USS Investment Management Ltd | 697.636 | 86,00 | 71.295 | 67,69 | ||||
| 2026-02-23 | 13F | Copos Capital S.a r.l. | 78.300 | 8.878 | ||||||
| 2026-02-20 | 13F/A | Capital Markets Trading UK LLP | 3.250 | 0 | ||||||
| 2026-02-13 | 13F | Hel Ved Capital Management Ltd | 38.637 | 0,52 | 4.381 | -13,76 | ||||
| 2026-02-17 | 13F | Signature Equity Partners, LLC | 18 | 2 | ||||||
| 2025-10-28 | 13F | Franchise Capital Ltd | 501.460 | -0,12 | 66.278 | 26,14 | ||||
| 2026-02-12 | 13F | Hrt Financial Lp | 0 | -100,00 | 0 | |||||
| 2025-11-14 | 13F | Capstone Investment Advisors, Llc | Call | 19.500 | -22,31 | 2.577 | -1,87 | |||
| 2026-02-10 | 13F | NINE MASTS CAPITAL Ltd | 6.586 | 747 | ||||||
| 2025-11-14 | 13F | Capstone Investment Advisors, Llc | 3.175 | -23,20 | 420 | -3,01 | ||||
| 2026-04-06 | 13F | Highline Wealth Partners Llc | 66 | -50,38 | 7 | -60,00 | ||||
| 2026-02-17 | 13F | united american securities inc. (d/b/a uas asset management) | 15.000 | 20,00 | 1.701 | 2,91 | ||||
| 2026-01-27 | 13F | Checchi Capital Advisers, LLC | 3.842 | -5,02 | 436 | -18,54 | ||||
| 2026-02-13 | 13F | Squarepoint Ops LLC | Call | 93.900 | -82,96 | 10.647 | -85,39 | |||
| 2026-02-13 | 13F | Squarepoint Ops LLC | Put | 472.900 | -82,23 | 53.622 | -84,75 | |||
| 2026-02-13 | 13F | Squarepoint Ops LLC | 3.910 | -99,00 | 443 | -99,14 | ||||
| 2026-02-13 | 13F | Quarry LP | 57 | 111,11 | 6 | 100,00 | ||||
| 2026-02-13 | 13F | Umb Bank N A/mo | 232 | 36,47 | 26 | 18,18 | ||||
| 2026-04-21 | 13F | Nemes Rush Group LLC | 17 | 0,00 | 2 | 0,00 | ||||
| 2025-11-14 | 13F | Cubist Systematic Strategies, LLC | Put | 359.500 | 20,56 | 47.515 | 52,25 | |||
| 2025-11-14 | 13F | Cubist Systematic Strategies, LLC | Call | 487.500 | 23,86 | 64.433 | 56,41 | |||
| 2026-01-15 | 13F | Frank, Rimerman Advisors LLC | 4.007 | 0,73 | 454 | -13,52 | ||||
| 2026-02-10 | 13F | Intech Investment Management Llc | 23.223 | 14,79 | 2.633 | -1,50 | ||||
| 2026-02-02 | 13F | Principal Financial Group Inc | 6.971 | 790 | ||||||
| 2025-10-28 | 13F | Wolverine Asset Management Llc | Put | 0 | -100,00 | 0 | -100,00 | |||
| 2026-02-11 | 13F | Harvest Fund Management Co., Ltd | 422.263 | 6,60 | 48 | -9,62 | ||||
| 2026-03-31 | 13F | Sankala Group LLC | 1.574 | 25,02 | 160 | 22,31 | ||||
| 2026-04-08 | 13F | E Fund Management (Hong Kong) Co., Ltd. | 279.435 | -4,58 | 28.553 | -5,75 | ||||
| 2026-01-30 | 13F | Mitsubishi UFJ Trust & Banking Corp | 3.167.810 | 25,54 | 359.198 | 7,71 | ||||
| 2026-01-30 | 13F/A | M&t Bank Corp | 18.960 | 2.150 | ||||||
| 2026-04-17 | 13F | AdvisorNet Financial, Inc | 0 | -100,00 | 0 | |||||
| 2026-02-17 | 13F | Balyasny Asset Management Llc | 335.433 | -23,53 | 38.035 | -34,39 | ||||
| 2026-02-17 | 13F | Balyasny Asset Management Llc | Put | 1.177.900 | 32,54 | 133.468 | 13,63 | |||
| 2026-01-30 | 13F | Wealthfront Advisers Llc | 3.482 | 395 | ||||||
| 2026-02-17 | 13F | Balyasny Asset Management Llc | Call | 280.500 | 79,23 | 31.783 | 53,67 | |||
| 2026-02-09 | 13F | Accent Capital Management, LLC | 650 | 0,00 | 74 | -14,12 | ||||
| 2026-02-11 | 13F | Ameritas Investment Partners, Inc. | 24.147 | 2.738 | ||||||
| 2026-02-13 | 13F | Wells Fargo & Company/mn | 135.516 | 5,97 | 15.366 | -9,09 | ||||
| 2026-02-10 | 13F | Mawer Investment Management Ltd. | 34.390 | -0,03 | 3.899 | -14,23 | ||||
| 2026-02-10 | 13F | CIBC World Markets Inc. | 6.615 | 110,87 | 750 | 81,16 | ||||
| 2026-02-13 | 13F | Osmosis Investment Management UK Ltd | 5.573 | 632 | ||||||
| 2026-04-23 | 13F | Lansforsakringar Fondforvaltning AB (publ) | 139.939 | 1,90 | 14.299 | -8,18 | ||||
| 2025-11-13 | 13F | Private Advisor Group, LLC | Put | 0 | -100,00 | 0 | -100,00 | |||
| 2026-02-11 | 13F | Simplex Trading, Llc | Call | 2.129.600 | 27,53 | 241.475 | 109.661,36 | |||
| 2026-02-11 | 13F | Simplex Trading, Llc | Put | 1.067.000 | -50,02 | 120.987 | 42.803,19 | |||
| 2026-02-11 | 13F | Simplex Trading, Llc | 14.795 | -96,81 | 1.678 | 2.649,18 | ||||
| 2026-02-17 | 13F | KEYWISE CAPITAL MANAGEMENT (HK) Ltd | 16.500 | -92,49 | 1.871 | -93,56 | ||||
| 2025-11-14 | 13F | Anson Funds Management LP | 0 | -100,00 | 0 | |||||
| 2026-02-04 | 13F | Bailard, Inc. | 5.000 | 0,00 | 567 | -14,24 | ||||
| 2026-02-12 | 13F | Logan Capital Management Inc | 0 | -100,00 | 0 | |||||
| 2026-02-11 | 13F | IMA Wealth, Inc. | 18 | 2 | ||||||
| 2026-02-12 | 13F | Jane Street Group, Llc | 55.066 | -98,82 | 6.244 | -98,99 | ||||
| 2026-02-12 | 13F | Jane Street Group, Llc | Call | 5.924.400 | -51,76 | 671.768 | -58,61 | |||
| 2026-02-13 | 13F | Alpine Investment Management Ltd | 306.198 | 34.720 | ||||||
| 2026-02-12 | 13F | Jane Street Group, Llc | Put | 8.243.000 | -28,78 | 934.674 | -38,90 | |||
| 2026-02-13 | 13F | Alpine Investment Management Ltd | Call | 8.350 | -37,45 | 94.681 | -46,34 | |||
| 2026-04-21 | 13F | Robeco Institutional Asset Management B.V. | 2.492.893 | 39,58 | 254.724 | 25,78 | ||||
| 2026-02-10 | 13F | Gulf International Bank (UK) Ltd | 33.871 | 0,00 | 4 | -25,00 | ||||
| 2026-02-11 | 13F | Janney Capital Management LLC | 62.035 | -6,96 | 7 | -12,50 | ||||
| 2026-01-21 | 13F | Prime Capital Investment Advisors, LLC | 1.854 | 1,04 | 210 | -13,22 | ||||
| 2026-02-17 | 13F | Ardmore Road Asset Management LP | 0 | -100,00 | 0 | |||||
| 2026-02-06 | 13F | Capstone Capital Management Ltd | 22.530 | 2.555 | ||||||
| 2026-01-26 | 13F | Asset Dedication, LLC | 5 | 0,00 | 1 | |||||
| 2026-02-05 | 13F | DnB Asset Management AS | 66.782 | 13,00 | 7.572 | -3,06 | ||||
| 2026-01-21 | 13F | Step Capital Management Pte. Ltd. | 75.000 | 8.504 | ||||||
| 2026-02-04 | 13F | Ameritas Advisory Services, LLC | 0 | -100,00 | 0 | -100,00 | ||||
| 2026-02-17 | 13F | Altimeter Capital Management, LP | 0 | -100,00 | 0 | |||||
| 2026-02-17 | 13F | Edmond De Rothschild Holding S.a. | 37.163 | 12,06 | 4.214 | -3,88 | ||||
| 2026-02-20 | 13F/A | CMT Capital Markets Trading GmbH | Put | 203.300 | -17,12 | 23 | -28,12 | |||
| 2025-10-29 | 13F | Royal Fund Management, LLC | 0 | -100,00 | 0 | -100,00 | ||||
| 2026-02-20 | 13F/A | CMT Capital Markets Trading GmbH | Call | 446.500 | -4,78 | 51 | -18,03 | |||
| 2025-11-13 | 13F | Riggs Asset Managment Co. Inc. | 0 | -100,00 | 0 | |||||
| 2026-01-21 | 13F | Y.D. More Investments Ltd | 0 | -100,00 | 0 | |||||
| 2026-02-17 | 13F | D. E. Shaw & Co., Inc. | Put | 1.677.000 | -50,20 | 190.155 | -57,28 | |||
| 2026-02-17 | 13F | D. E. Shaw & Co., Inc. | Call | 2.207.000 | -0,92 | 250.252 | -15,00 | |||
| 2026-02-17 | 13F | State Of Wisconsin Investment Board | 7.748 | -40,57 | 879 | -49,04 | ||||
| 2026-02-13 | 13F | Gts Securities Llc | 2.079 | -93,42 | 236 | -94,37 | ||||
| 2026-02-10 | 13F | Daiwa Securities Group Inc. | 76.875 | 9,38 | 9 | -11,11 | ||||
| 2026-01-29 | 13F | Calamos Advisors LLC | Call | 0 | -100,00 | 0 | -100,00 | |||
| 2026-02-17 | 13F | Scientech Research LLC | 3.067 | 348 | ||||||
| 2026-02-12 | 13F | XY Capital Ltd | Put | 1.600 | 181 | |||||
| 2026-02-13 | 13F | Pathstone Holdings, LLC | 10.774 | 3,06 | 1.222 | -11,59 | ||||
| 2026-01-27 | 13F | Evergreen Capital Management Llc | 1.922 | -15,22 | 218 | -27,42 | ||||
| 2026-02-12 | 13F | XY Capital Ltd | Call | 1.600 | 181 | |||||
| 2026-03-16 | 13F/A | Rockefeller Capital Management L.P. | 5.569 | -29,44 | 631 | -39,50 | ||||
| 2026-02-12 | 13F | Perseverance Asset Management International | 0 | -100,00 | 0 | |||||
| 2026-01-28 | 13F | B. Metzler seel. Sohn & Co. AG | 58.208 | 113,51 | 6.600 | 83,18 | ||||
| 2026-04-27 | 13F | Ethic Inc. | 2.642 | 2,17 | 270 | -8,19 | ||||
| 2026-02-17 | 13F | Hidden Lake Asset Management LP | 0 | -100,00 | 0 | -100,00 | ||||
| 2026-02-13 | 13F | Lavaca Capital Llc | 3.189 | -19,43 | 362 | -30,98 | ||||
| 2026-02-17 | 13F | Prelude Capital Management, Llc | 18.411 | 86,91 | 2.088 | 60,42 | ||||
| 2026-01-26 | 13F | KBC Group NV | 239.124 | 20,86 | 27 | 3,85 | ||||
| 2026-01-30 | 13F | Yong Rong (HK) Asset Management Ltd | 50.000 | 6 | ||||||
| 2026-02-13 | 13F | Oakum Bay Capital LLC | 1.900 | 215 | ||||||
| 2026-01-23 | 13F | Assetmark, Inc | 431 | 7,21 | 49 | -9,43 | ||||
| 2026-02-06 | 13F | True Light Capital Pte. Ltd. | 602.262 | 68.290 | ||||||
| 2026-02-11 | 13F | Myriad Asset Management Advisors LLC | 35.106 | 3.981 | ||||||
| 2026-02-17 | 13F | Blair William & Co/il | 4.079 | 63,75 | 463 | 40,43 | ||||
| 2026-02-17 | 13F | Schonfeld Strategic Advisors LLC | 0 | -100,00 | 0 | |||||
| 2026-02-17 | 13F | Schonfeld Strategic Advisors LLC | Put | 0 | -100,00 | 0 | ||||
| 2026-01-23 | 13F | Baillie Gifford & Co | 31.032.323 | -2,41 | 3.518.755 | -16,28 | ||||
| 2025-11-12 | 13F | Contrarius Group Holdings Ltd | 85.372 | -0,76 | 11.284 | 25,32 | ||||
| 2026-02-12 | 13F | CIBC Private Wealth Group, LLC | 1.092 | 0,00 | 124 | -14,58 | ||||
| 2026-01-26 | 13F | Private Trust Co Na | 141 | 28,18 | 16 | 7,14 | ||||
| 2026-03-11 | 13F | Leonteq Securities AG | Call | 0 | -100,00 | 0 | -100,00 | |||
| 2026-02-17 | 13F | Kora Management LP | 490.650 | -18,80 | 55.635 | -30,34 | ||||
| 2026-02-11 | 13F | LPL Financial LLC | 38.831 | -3,10 | 4.403 | -16,86 | ||||
| 2026-02-13 | 13F | Vontobel Holding Ltd. | 40.787 | 0,91 | 4.625 | -13,44 | ||||
| 2026-02-17 | 13F | Schonfeld Strategic Advisors LLC | Call | 0 | -100,00 | 0 | ||||
| 2026-02-17 | 13F | Royal Bank Of Canada | Put | 33.100 | 3.753 | |||||
| 2026-02-17 | 13F | Royal Bank Of Canada | Call | 30.500 | 3.458 | |||||
| 2026-02-13 | 13F | Wells Fargo & Company/mn | Put | 0 | -100,00 | 0 | -100,00 | |||
| 2026-02-10 | 13F | NINE MASTS CAPITAL Ltd | Put | 0 | -100,00 | 0 | -100,00 | |||
| 2026-01-26 | 13F | Cwm, Llc | 867 | -2,03 | 0 | |||||
| 2025-11-14 | 13F | Dark Forest Capital Management Lp | 8.305 | 0,00 | 869 | 0,00 | ||||
| 2026-02-06 | 13F | Bare Financial Services, Inc | 33 | 450,00 | 4 | |||||
| 2026-02-10 | 13F | NINE MASTS CAPITAL Ltd | Call | 0 | -100,00 | 0 | -100,00 | |||
| 2026-02-17 | 13F | Ionic Capital Management LLC | Call | 0 | -100,00 | 0 | -100,00 | |||
| 2026-04-15 | 13F | Generali Investments CEE, investicni spolecnost, a.s. | 786 | 0,00 | 80 | -10,11 | ||||
| 2026-02-13 | 13F | Johnson Investment Counsel Inc | 0 | -100,00 | 0 | |||||
| 2026-02-04 | 13F | Atlantic Union Bankshares Corp | 200 | 0,00 | 23 | -15,38 | ||||
| 2026-02-17 | 13F | Cable Car Capital LLC | 220.000 | 24.946 | ||||||
| 2026-02-17 | 13F | Cable Car Capital LLC | Put | 220.000 | 24.946 | |||||
| 2026-02-13 | 13F | Commerce Bank | 4.025 | -0,05 | 456 | -14,29 | ||||
| 2026-02-03 | 13F | International Assets Investment Management, Llc | 0 | -100,00 | 0 | |||||
| 2026-04-10 | 13F | Abound Wealth Management | 4 | -33,33 | 0 | |||||
| 2026-02-12 | 13F | Ci Investments Inc. | 8.984 | -90,52 | 1.019 | 8.383,33 | ||||
| 2026-02-18 | 13F | Vident Advisory, LLC | 57.280 | 172,28 | 6.495 | 133,60 | ||||
| 2026-04-07 | 13F | Farther Finance Advisors, LLC | 17.698 | 30,82 | 1.801 | 17,48 | ||||
| 2026-02-10 | 13F | Fideuram Asset Management (Ireland) dac | 89.220 | 10.509 | ||||||
| 2026-02-17 | 13F | Bank Of America Corp /de/ | 3.057.744 | 11,69 | 346.718 | -4,18 | ||||
| 2026-02-13 | 13F | American Century Companies Inc | 1.222.648 | 28,39 | 138.636 | 10,15 | ||||
| 2026-02-17 | 13F | Dv Equities, Llc | 954 | 108 | ||||||
| 2026-04-22 | 13F | Apollon Wealth Management, LLC | 2.855 | -21,11 | 292 | -29,02 | ||||
| 2026-02-02 | 13F | Wolverine Asset Management Llc | 0 | -100,00 | 0 | -100,00 | ||||
| 2026-02-06 | 13F | GPS Wealth Strategies Group, LLC | 0 | -100,00 | 0 | |||||
| 2026-04-17 | 13F | PKO Investment Management Joint-Stock Co | 25.000 | 0,00 | 2.554 | -9,88 | ||||
| 2026-02-09 | 13F | Hantz Financial Services, Inc. | 22.459 | -4,81 | 3 | -33,33 | ||||
| 2026-02-12 | 13F | Brinker Capital Investments, LLC | 77.601 | 71,45 | 8.799 | 47,09 | ||||
| 2026-02-12 | 13F | DRW Securities, LLC | 7.699 | 873 | ||||||
| 2026-04-24 | 13F | Q Fund Management (Hong Kong) Ltd | 2.500 | 0,00 | 283 | 0,00 | ||||
| 2026-04-15 | 13F | Alhambra Investment Partners LLC | 2.200 | 0,00 | 225 | -10,04 | ||||
| 2026-01-21 | 13F | Future Financial Wealth Managment LLC | 0 | -100,00 | 0 | |||||
| 2026-02-13 | 13F | Arrowstreet Capital, Limited Partnership | 305.410 | -79,47 | 34.630 | -82,39 | ||||
| 2026-02-13 | 13F | Wells Fargo & Company/mn | Call | 0 | -100,00 | 0 | -100,00 | |||
| 2026-02-10 | 13F | Green Court Capital Management Ltd | 856.958 | -19,22 | 99.476 | -29,05 | ||||
| 2025-11-12 | 13F | HAP Trading, LLC | Put | 69.300 | 262 | |||||
| 2026-04-22 | 13F | APEIRON CAPITAL Ltd | Call | 83.000 | 4 | |||||
| 2025-11-12 | 13F | HAP Trading, LLC | 17.792 | 2.352 | ||||||
| 2025-11-12 | 13F | HAP Trading, LLC | Call | 64.400 | 375 | |||||
| 2025-11-14 | 13F | Mount Yale Investment Advisors, LLC | 0 | -100,00 | 0 | -100,00 | ||||
| 2026-02-17 | 13F | Alliancebernstein L.p. | 927.794 | -6,63 | 105.203 | -19,90 | ||||
| 2026-04-20 | 13F | Louisiana State Employees Retirement System | 43.900 | -1,79 | 4.486 | -11,50 | ||||
| 2026-04-07 | 13F | Signaturefd, Llc | 8.548 | 7,51 | 873 | -3,11 | ||||
| 2026-02-13 | 13F | Macquarie Group Ltd | 100.423 | -92,08 | 11.387 | -93,20 | ||||
| 2026-02-10 | 13F | Capital Today Evergreen Fund, L.P. | 1.634.077 | -34,47 | 185.288 | -43,78 | ||||
| 2026-02-17 | 13F | Mercer Global Advisors Inc /adv | 4.154 | -13,10 | 471 | -25,52 | ||||
| 2026-02-12 | 13F | Dimensional Fund Advisors Lp | 3.484.692 | 1,69 | 395.136 | -12,71 | ||||
| 2026-02-17 | 13F | Royal Bank Of Canada | 672.008 | -24,13 | 76.198 | -34,92 | ||||
| 2026-02-17 | 13F | Monolith Management Ltd | 0 | -100,00 | 0 | |||||
| 2026-04-17 | 13F | Murphy & Mullick Capital Management Corp | 36 | -51,35 | 4 | -62,50 | ||||
| 2026-02-20 | 13F/A | Capital Markets Trading UK LLP | Put | 521.800 | 152,69 | 59 | 118,52 | |||
| 2026-02-20 | 13F/A | Capital Markets Trading UK LLP | Call | 300.000 | -1,64 | 34 | -15,00 | |||
| 2025-11-12 | 13F | Bellwether Advisors, LLC | 0 | -100,00 | 0 | |||||
| 2026-01-30 | 13F | Bogart Wealth, LLC | 0 | -100,00 | 0 | |||||
| 2026-04-13 | 13F | Creative Financial Designs Inc /adv | 112 | 0,00 | 11 | -8,33 | ||||
| 2026-01-30 | 13F | Flossbach Von Storch Ag | 5.665 | 33,45 | 642 | 14,44 | ||||
| 2026-04-24 | 13F | Raiffeisen Bank International AG | 5.687 | 560 | ||||||
| 2026-02-12 | 13F | JPL Wealth Management, LLC | 0 | -100,00 | 0 | |||||
| 2026-02-06 | 13F | Abn Amro Investment Solutions | 6.300 | 714 | ||||||
| 2026-02-12 | 13F | Nuveen, LLC | 1.687.403 | -3,63 | 191.335 | -17,32 | ||||
| 2026-02-17 | 13F | Oddo Bhf Asset Management Sas | 4.600 | 64,29 | 522 | 40,81 | ||||
| 2026-02-13 | 13F | Panview Capital Ltd | 181.680 | 45,34 | 20.601 | 24,69 | ||||
| 2026-02-12 | 13F | Pinebridge Investments Asia Ltd | 8.830 | 1.001 | ||||||
| 2026-01-28 | 13F | CAPROCK Group, Inc. | 5.687 | 1,50 | 645 | -4,31 | ||||
| 2026-02-17 | 13F | Raymond James Financial Inc | 40.947 | 12,86 | 4.643 | -3,19 | ||||
| 2026-02-03 | 13F | RD Finance Ltd | 0 | -100,00 | 0 | |||||
| 2026-02-10 | 13F | Exit Wealth Advisors, LLC. | 5.974 | 677 | ||||||
| 2026-02-10 | 13F | Bnp Paribas Arbitrage, Sa | 5.146.573 | 2,06 | 583.570 | -12,44 | ||||
| 2026-02-13 | 13F | First Trust Advisors Lp | 1.158.932 | 52,54 | 131.411 | 30,87 | ||||
| 2026-02-10 | 13F | Bnp Paribas Arbitrage, Sa | Put | 4.536 | -2,70 | 51.434 | -16,53 | |||
| 2026-02-13 | 13F | BRITISH COLUMBIA INVESTMENT MANAGEMENT Corp | 275.000 | -0,54 | 31.182 | -14,68 | ||||
| 2026-02-10 | 13F | Bnp Paribas Arbitrage, Sa | Call | 2.783 | -9,55 | 31.556 | -22,41 | |||
| 2026-04-22 | 13F | Stone House Investment Management, LLC | 30 | 1.400,00 | 3 | |||||
| 2026-01-23 | 13F | Lester Murray Antman dba SimplyRich | 2.805 | 0,00 | 0 | |||||
| 2026-02-13 | 13F | Intercapital, Llc | 11.900 | 1.349 | ||||||
| 2025-11-14 | 13F | Aspen Grove Capital, LLC | 0 | -100,00 | 0 | |||||
| 2026-02-13 | 13F | Mariner, LLC | 22.092 | 0,75 | 2.506 | -13,56 | ||||
| 2026-02-17 | 13F | Nishkama Capital, LLC | 0 | -100,00 | 0 | -100,00 | ||||
| 2026-01-27 | 13F | Bayforest Capital Ltd | 0 | -100,00 | 0 | |||||
| 2026-02-09 | 13F | AIA Group Ltd | 35.538 | 4.030 | ||||||
| 2025-11-14 | 13F | Capstone Investment Advisors, Llc | Put | 15.900 | -50,47 | 2.102 | -37,45 | |||
| 2026-02-11 | 13F | Los Angeles Capital Management Llc | 0 | -100,00 | 0 | |||||
| 2026-02-12 | 13F | Bank Of Montreal /can/ | 350.801 | 37,58 | 39.777 | 18,03 | ||||
| 2026-02-17 | 13F | Quantinno Capital Management LP | 52.709 | -1,60 | 5.977 | -15,58 | ||||
| 2026-02-10 | 13F | Belvedere Trading LLC | 2.372 | 269 | ||||||
| 2026-02-18 | 13F | Wahed Invest LLC | 14.764 | 6,89 | 1.674 | -8,27 | ||||
| 2026-02-17 | 13F | Evergreen Quality Fund GP, Ltd. | 863.016 | 7,33 | 97.857 | -7,92 | ||||
| 2026-01-28 | 13F | Financial Perspectives, Inc | 81 | 0,00 | 9 | -10,00 | ||||
| 2026-02-17 | 13F | Clough Capital Partners L P | 8.450 | -53,44 | 958 | -60,05 | ||||
| 2026-02-11 | 13F | Trivest Advisors Ltd | 0 | -100,00 | 0 | |||||
| 2026-02-17 | 13F | LMR Partners LLP | Put | 1.299.700 | 4,87 | 147.373 | -10,03 | |||
| 2026-04-20 | 13F | Ritholtz Wealth Management | 12.041 | -9,38 | 1.230 | -18,33 | ||||
| 2026-02-17 | 13F | LMR Partners LLP | 733.647 | 526,61 | 83.188 | 437,60 | ||||
| 2026-02-17 | 13F | DV Trading LLC | Put | 2.000 | 227 | |||||
| 2026-02-17 | 13F | LMR Partners LLP | Call | 885.500 | -9,51 | 100.407 | -22,37 | |||
| 2026-02-17 | 13F | DV Trading LLC | Call | 10.900 | 1.236 | |||||
| 2026-02-13 | 13F | Tairen Capital Ltd | 177.200 | 2.115,00 | 20.093 | 1.800,85 | ||||
| 2026-04-13 | 13F | Global X Japan Co., Ltd. | 257.895 | 16,09 | 26.352 | 4,61 | ||||
| 2025-11-07 | 13F | Shell Asset Management Co | 26.705 | -22,79 | 4 | 0,00 | ||||
| 2026-01-23 | 13F | Avion Wealth | 25 | 0,00 | 0 | |||||
| 2026-02-17 | 13F | MIRAE ASSET GLOBAL ETFS HOLDINGS Ltd. | 526.998 | -6,30 | 59.756 | -19,61 | ||||
| 2026-01-27 | 13F | Elevated Capital Advisors, LLC | 10 | 1 | ||||||
| 2026-02-17 | 13F | 3G Capital Partners LP | 0 | -100,00 | 0 | |||||
| 2026-01-30 | 13F | Us Bancorp \de\ | 6.174 | 1,76 | 700 | -12,61 |