Grundlæggende statistik
| Institutionelle aktier (lange) | 145.067.516 - 89,83% (ex 13D/G) - change of -11,98MM shares -7,63% MRQ |
| Institutionel værdi (lang) | $ 10.820.539 USD ($1000) |
Institutionelt ejerskab og aktionærer
Unum Group (US:UNM) har 709 institutionelle ejere og aktionærer, der har indsendt 13D/G- eller 13F-formularer til Securities Exchange Commission (SEC). Disse institutioner har i alt 145,067,516 aktier. Største aktionærer omfatter Vanguard Group Inc, BlackRock, Inc., Norges Bank, Fmr Llc, Charles Schwab Investment Management Inc, State Street Corp, First Trust Advisors Lp, Dimensional Fund Advisors Lp, Geode Capital Management, Llc, and Morgan Stanley .
Unum Group (NYSE:UNM) institutionel ejerskabsstruktur viser aktuelle positioner i virksomheden efter institutioner og fonde, samt seneste ændringer i positionsstørrelse. Større aktionærer kan omfatte individuelle investorer, investeringsforeninger, hedgefonde eller institutioner. Skema 13D angiver, at investoren besidder (eller besidder) mere end 5 % af virksomheden og har til hensigt (eller har til hensigt at) aktivt at forfølge en ændring i forretningsstrategi. Skema 13G indikerer en passiv investering på over 5%.
The share price as of April 20, 2026 is 79,23 / share. Previously, on April 21, 2025, the share price was 74,17 / share. This represents an increase of 6,82% over that period.

Fondens stemningsscore
Fund Sentiment Score (fka Ownership Accumulation Score) finder de aktier, der bliver mest købt af fonde. Det er resultatet af en sofistikeret, multi-faktor kvantitativ model, der identificerer virksomheder med de højeste niveauer af institutionel akkumulering. Scoringsmodellen bruger en kombination af den samlede stigning i oplyste ejere, ændringerne i porteføljeallokeringer i disse ejere og andre målinger. Tallet går fra 0 til 100, hvor højere tal indikerer et højere niveau af akkumulering for sine jævnaldrende, og 50 er gennemsnittet.
Opdateringsfrekvens: Dagligt
Se Ownership Explorer, som giver en liste over højest rangerende virksomheder.
AI+ Ask Fintel’s AI assistant about Unum Group.
Select a question to share a public post with an AI-crafted answer.
Thinking of good questions…
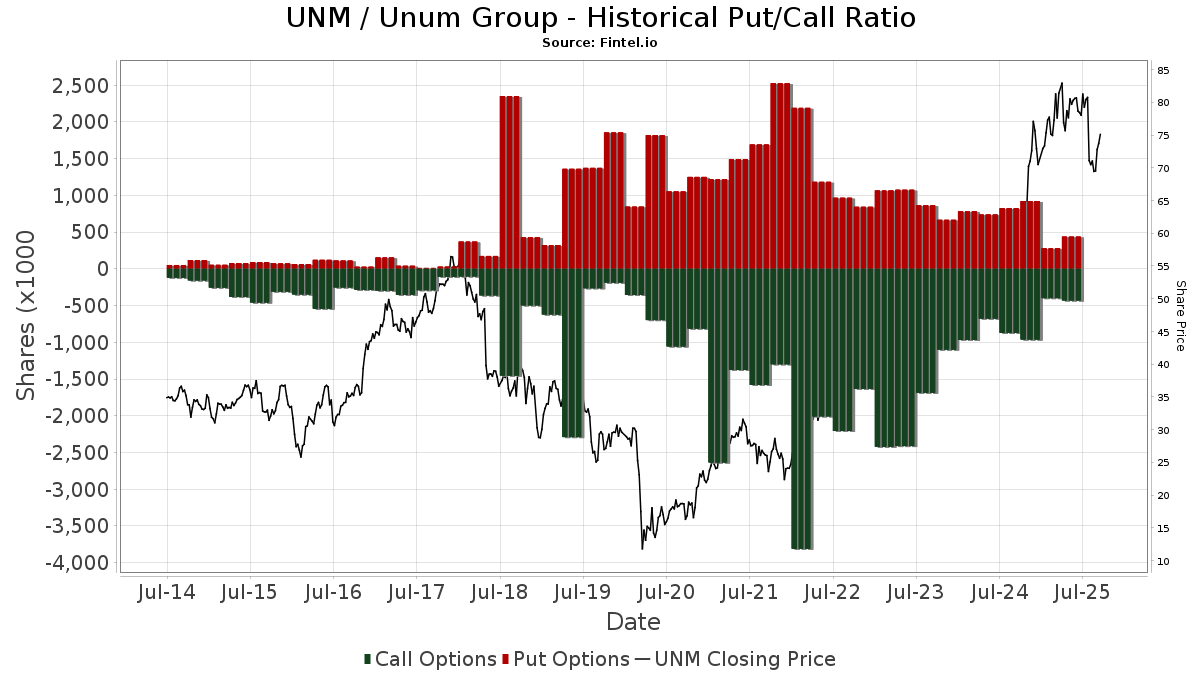
Institutionel Put/Call-forhold
Ud over at indberette standardaktie- og gældsudstedelser skal institutter med mere end 100 mill. aktiver under forvaltning også oplyse deres put- og call-optionsbeholdninger. Da salgsoptioner generelt indikerer negativ stemning, og købsoptioner indikerer positiv stemning, kan vi få en fornemmelse af den overordnede institutionelle stemning ved at plotte forholdet mellem put og kald. Diagrammet til højre viser det historiske put/call-forhold for dette instrument.
Brug af Put/Call Ratio som en indikator for investorernes stemning overvinder en af de vigtigste mangler ved at bruge totalt institutionelt ejerskab, som er, at en betydelig mængde af aktiver under forvaltning investeres passivt for at spore indekser. Passivt forvaltede fonde køber typisk ikke optioner, så indikatoren for put/call-forholdet følger mere nøje følelsen af aktivt forvaltede fonde.
13D/G-arkivering
Vi præsenterer 13D/G ansøgninger separat fra 13F ansøgninger på grund af den forskellige behandling af SEC. 13D/G-ansøgninger kan indgives af grupper af investorer (med én ledende), hvorimod 13F-ansøgninger ikke kan. Dette resulterer i situationer, hvor en investor kan indsende en 13D/G, der rapporterer én værdi for de samlede aktier (der repræsenterer alle de aktier, der ejes af investorgruppen), men derefter indsender en 13F, der rapporterer en anden værdi for de samlede aktier (der udelukkende repræsenterer deres egne) ejendomsret). Det betyder, at aktieejerskab af 13D/G-arkiver og 13F-arkiveringer ofte ikke er direkte sammenlignelige, så vi præsenterer dem separat.
Bemærk: Fra den 16. maj 2021 viser vi ikke længere ejere, der ikke har indsendt en 13D/G inden for det seneste år. Tidligere viste vi den fulde historie af 13D/G-arkiver. Generelt skal enheder, der er forpligtet til at indgive 13D/G-ansøgninger, indgive mindst årligt, før de indsender en afsluttende ansøgning. Dog forlader fonde nogle gange positioner uden at indsende en afsluttende ansøgning (dvs. de afvikler), så visning af den fulde historie resulterede nogle gange i forvirring om det nuværende ejerskab. For at undgå forvirring viser vi nu kun 'aktuelle' ejere - det vil sige - ejere, der har anmeldt inden for det seneste år.
Upgrade to unlock premium data.
| Fil dato | Form | Investor | Forrige Aktier |
Seneste Aktier |
Δ Aktier (Procent) |
Ejendomsret (Procent) |
Δ Ejerskab (Procent) |
|
|---|---|---|---|---|---|---|---|---|
| 2025-04-17 | BlackRock, Inc. | 18,958,500 | 16,181,945 | -14.65 | 9.20 | -9.80 |
13F og NPORT arkivering
Detaljer om 13F-arkivering er gratis. Detaljer om NP-ansøgninger kræver et premium-medlemskab. Grønne rækker angiver nye positioner. Røde rækker angiver lukkede positioner. Klik på linket ikon for at se den fulde transaktionshistorik.
Opgrader
for at låse premium-data op og eksportere til Excel ![]() .
.
Important Note
In an effort to reduce load times for our mobile users, we are testing some ways to deliver lighter pages.
In this first test, we will deliver only the most recent 750 transactions (out of 900 for this stock). If you are interested in loading *all* the transactions for this company, click the "load all" button below. This is just a test and if you don't like it, please let us know by submitting some gentle feedback via the link at the bottom of this page.
Load All| Fil dato | Kilde | Investor | Type | Gennemsnitlig pris (Øst) |
Aktier | Δ Aktier (%) |
Rapporteret Værdi ($1000) |
Δ Værdi (%) |
Port Alloc (%) |
|
|---|---|---|---|---|---|---|---|---|---|---|
| 2026-02-11 | 13F | Vise Technologies, Inc. | 16.047 | 69,42 | 1.244 | 68,89 | ||||
| 2026-02-13 | 13F | Treasurer of the State of North Carolina | 70.828 | -6,81 | 5 | 0,00 | ||||
| 2026-02-11 | 13F | Brandywine Global Investment Management, LLC | 211.266 | 20,04 | 16.373 | 19,61 | ||||
| 2026-01-29 | 13F | DecisionPoint Financial, LLC | 3 | 0,00 | 0 | |||||
| 2026-02-09 | 13F | Arnhold LLC | 4.000 | 0,00 | 310 | -0,32 | ||||
| 2026-04-15 | 13F | Norden Group Llc | 0 | -100,00 | 0 | |||||
| 2026-01-26 | 13F | AE Wealth Management LLC | 10.129 | 20,07 | 785 | 19,51 | ||||
| 2026-02-17 | 13F | Oxford Asset Management Llp | 7.111 | 551 | ||||||
| 2026-04-16 | 13F | Sterling Investment Counsel, LLC | 3.043 | 3,36 | 222 | 3,74 | ||||
| 2026-01-30 | 13F | R Squared Ltd | 6.335 | 491 | ||||||
| 2026-02-03 | 13F | Denali Advisors Llc | 5.120 | 397 | ||||||
| 2026-02-17 | 13F | Tudor Investment Corp Et Al | 203.088 | 38,66 | 15.739 | 38,16 | ||||
| 2026-02-17 | 13F | Shelton Capital Management | 5.302 | -6,80 | 411 | -7,24 | ||||
| 2025-11-13 | 13F | Dynamic Technology Lab Private Ltd | 0 | -100,00 | 0 | -100,00 | ||||
| 2026-04-15 | 13F | Fortitude Family Office, LLC | 181 | 67,59 | 13 | 62,50 | ||||
| 2026-02-17 | 13F | Tudor Investment Corp Et Al | Call | 2.800 | -36,36 | 217 | -36,55 | |||
| 2026-02-23 | 13F | Wealth Preservation Advisors, LLC | 287 | 0,00 | 22 | 0,00 | ||||
| 2026-02-05 | 13F | IMG Wealth Management, Inc. | 0 | -100,00 | 0 | |||||
| 2026-02-13 | 13F | Umb Bank N A/mo | 4.066 | 7,20 | 315 | 6,78 | ||||
| 2026-02-12 | 13F | Wealthspire Advisors, LLC | 5.187 | 180,08 | 402 | 178,47 | ||||
| 2026-02-17 | 13F | Engineers Gate Manager LP | 292.815 | 10.463,31 | 22.693 | 10.454,88 | ||||
| 2026-01-29 | 13F | Sanctuary Advisors, LLC | 3.214 | -44,08 | 249 | -44,30 | ||||
| 2026-01-23 | 13F | Burney Co/ | 71.955 | -3,47 | 5.577 | -3,83 | ||||
| 2026-02-13 | 13F | Van Eck Associates Corp | 120.071 | -2,46 | 9 | 0,00 | ||||
| 2026-02-13 | 13F | Macquarie Group Ltd | 0 | -100,00 | 0 | |||||
| 2026-02-17 | 13F | Susquehanna International Group, Llp | 27.877 | -36,03 | 2.160 | -36,26 | ||||
| 2026-02-17 | 13F | Private Advisor Group, LLC | 8.868 | -10,46 | 687 | -10,78 | ||||
| 2026-02-03 | 13F | Encompass More Asset Management | 0 | -100,00 | 0 | |||||
| 2026-02-05 | 13F | HFM Investment Advisors, LLC | 11 | 0,00 | 1 | |||||
| 2025-11-14 | 13F | Quantessence Capital LLC | 0 | -100,00 | 0 | |||||
| 2026-04-17 | 13F | Anchyra Partners Llc | 4.026 | 294 | ||||||
| 2026-02-09 | 13F | Investors Portfolio Services LLC | 176 | 14 | ||||||
| 2026-02-12 | 13F | Tripletail Wealth Management, LLC | 4.704 | -9,47 | 365 | -11,65 | ||||
| 2026-02-17 | 13F | Susquehanna International Group, Llp | Put | 20.900 | -68,67 | 1.620 | -68,79 | |||
| 2026-02-13 | 13F | Commerce Bank | 13.422 | -5,16 | 1.040 | -5,45 | ||||
| 2026-02-17 | 13F | Susquehanna International Group, Llp | Call | 169.200 | 80,19 | 13.113 | 79,56 | |||
| 2026-02-06 | 13F | Tortoise Investment Management, LLC | 0 | -100,00 | 0 | |||||
| 2026-02-05 | 13F | Abacus Wealth Partners, LLC | 10.739 | 832 | ||||||
| 2025-11-12 | 13F | Armis Advisers, LLC | 0 | -100,00 | 0 | -100,00 | ||||
| 2026-02-05 | 13F | 1620 Investment Advisors, Inc. | 571 | 0,00 | 44 | 0,00 | ||||
| 2026-02-17 | 13F | Stokes Family Office, LLC | 3.204 | 248 | ||||||
| 2026-01-23 | 13F | Avion Wealth | 13 | 0,00 | 0 | |||||
| 2026-02-13 | 13F | Sei Investments Co | 554.012 | 11,26 | 42.942 | 10,88 | ||||
| 2026-02-13 | 13F | MAI Capital Management | 55.252 | -4,46 | 4.282 | -4,80 | ||||
| 2026-04-14 | 13F | West Branch Capital LLC | 2.709 | 0,00 | 198 | -5,74 | ||||
| 2026-01-16 | 13F | Hopwood Financial Services, Inc. | 0 | -100,00 | 0 | |||||
| 2026-02-09 | 13F | Huntington National Bank | 5 | -61,54 | 0 | -100,00 | ||||
| 2026-04-13 | 13F | Wedge Capital Management L L P/nc | 418.832 | -2,40 | 30.587 | -8,03 | ||||
| 2026-02-12 | 13F | Jane Street Group, Llc | Call | 69.000 | 109,09 | 5.348 | 108,38 | |||
| 2026-02-12 | 13F | Jane Street Group, Llc | 502.756 | 357,64 | 38.964 | 356,03 | ||||
| 2026-01-08 | 13F | Nordea Investment Management Ab | 1.078.811 | -24,08 | 83.856 | -23,71 | ||||
| 2026-02-13 | 13F | Walleye Trading LLC | Put | 3.700 | -46,38 | 287 | -46,64 | |||
| 2026-01-27 | 13F | Optas, LLC | 2.945 | 228 | ||||||
| 2026-02-12 | 13F | Jane Street Group, Llc | Put | 2.900 | -73,39 | 225 | -73,55 | |||
| 2026-02-13 | 13F | Walleye Trading LLC | Call | 17.500 | 316,67 | 1.356 | 315,95 | |||
| 2026-02-17 | 13F | Amundi | 254.688 | 51,63 | 19.738 | 49,43 | ||||
| 2026-02-12 | 13F | DRW Securities, LLC | 2.914 | 226 | ||||||
| 2026-02-13 | 13F | Walleye Trading LLC | 6.192 | 4,95 | 480 | 4,59 | ||||
| 2026-02-02 | 13F | Principal Financial Group Inc | 331.449 | -4,90 | 25.687 | -5,24 | ||||
| 2025-11-06 | 13F | Haven Private, LLC | 0 | -100,00 | 0 | -100,00 | ||||
| 2026-02-13 | 13F | Walleye Capital LLC | Put | 3.900 | 3.800,00 | 302 | 4.214,29 | |||
| 2026-02-13 | 13F | Walleye Capital LLC | 68 | 5 | ||||||
| 2026-02-13 | 13F | Walleye Capital LLC | Call | 5.000 | 25,00 | 388 | 24,44 | |||
| 2026-02-10 | 13F | BKD Wealth Advisors, LLC | 27.202 | -8,34 | 2.108 | -8,67 | ||||
| 2026-01-08 | 13F | Signet Financial Management, Llc | 11.460 | -3,72 | 888 | -4,00 | ||||
| 2026-01-30 | 13F | Torren Management, LLC | 2.718 | 211 | ||||||
| 2026-01-15 | 13F | Founders Capital Management | 300 | -50,00 | 23 | -50,00 | ||||
| 2026-04-15 | 13F | Atwood & Palmer Inc | 0 | -100,00 | 0 | |||||
| 2026-04-10 | 13F | Perigon Wealth Management, LLC | 3.717 | -23,49 | 271 | -27,93 | ||||
| 2026-02-11 | 13F | Manchester Capital Management LLC | 1.027 | 80 | ||||||
| 2026-02-03 | 13F | Patten & Patten Inc/tn | 11.077 | 0,00 | 858 | -0,35 | ||||
| 2026-01-28 | 13F | Quent Long Short Global Small Cap Fund, LP | 5.588 | 433 | ||||||
| 2026-02-17 | 13F | Two Sigma Advisers, Lp | 50.800 | -88,54 | 3.937 | -88,58 | ||||
| 2026-02-17 | 13F | Grantham, Mayo, Van Otterloo & Co. LLC | 0 | -100,00 | 0 | |||||
| 2026-02-12 | 13F | MetLife Investment Management, LLC | 75.468 | -6,53 | 5.849 | -6,88 | ||||
| 2026-02-12 | 13F | Leigh Baldwin & Co., Llc | 2.690 | 0,00 | 208 | -0,48 | ||||
| 2026-02-17 | 13F | Occudo Quantitative Strategies Lp | 37.387 | 91,89 | 2.897 | 91,22 | ||||
| 2026-01-23 | 13F | Newton One Investments LLC | 138 | 0,73 | 11 | 0,00 | ||||
| 2026-02-06 | 13F | Global Retirement Partners, LLC | 12.317 | 118,58 | 955 | 117,81 | ||||
| 2025-11-07 | 13F | Abn Amro Investment Solutions | 0 | -100,00 | 0 | |||||
| 2026-02-02 | 13F | Truist Financial Corp | 326.069 | 0,04 | 25.270 | -0,32 | ||||
| 2026-01-30 | 13F | New York State Teachers Retirement System | 174.638 | -9,97 | 14 | -13,33 | ||||
| 2026-02-17 | 13F | Boothbay Fund Management, Llc | 0 | -100,00 | 0 | |||||
| 2026-04-08 | 13F | DiNuzzo Private Wealth, Inc. | 53 | 0,00 | 4 | -25,00 | ||||
| 2026-02-05 | 13F | Bessemer Group Inc | 12.942 | -19,66 | 1 | 0,00 | ||||
| 2026-02-13 | 13F | Boston Partners | 104.424 | -12,35 | 8.093 | -12,67 | ||||
| 2026-02-13 | 13F | Rhumbline Advisers | 440.236 | -4,28 | 34.118 | -4,62 | ||||
| 2026-02-13 | 13F | Marshall Wace, Llp | 0 | -100,00 | 0 | |||||
| 2026-01-28 | 13F | Salomon & Ludwin, LLC | 99 | 0,00 | 8 | 0,00 | ||||
| 2025-11-14 | 13F | ISAM Funds (UK) Ltd | 0 | -100,00 | 0 | |||||
| 2026-02-17 | 13F | Janus Henderson Group Plc | 107.773 | 0,00 | 8.351 | -0,38 | ||||
| 2026-02-13 | 13F/A | Virtus ETF Advisers LLC | 0 | -100,00 | 0 | -100,00 | ||||
| 2026-02-12 | 13F | Hrt Financial Lp | 265.416 | -10,20 | 21 | -9,09 | ||||
| 2026-02-03 | 13F | Mitsubishi UFJ Kokusai Asset Management Co., Ltd. | 478 | 0,00 | 37 | -2,70 | ||||
| 2026-02-17 | 13F | Sciencast Management LP | 20.824 | 1.614 | ||||||
| 2026-03-03 | 13F/A | Caitong International Asset Management Co., Ltd | 259 | 2.777,78 | 20 | |||||
| 2026-01-28 | 13F | CAPROCK Group, Inc. | 10.403 | 806 | ||||||
| 2026-02-18 | 13F | Caitlin John, LLC | 1.658 | -71,60 | 129 | -71,81 | ||||
| 2026-04-08 | 13F | Grove Bank & Trust | 171 | 11,76 | 12 | 9,09 | ||||
| 2026-01-30 | 13F | Bogart Wealth, LLC | 14 | 1 | ||||||
| 2026-04-17 | 13F | Vermillion Wealth Management, Inc. | 11 | 1 | ||||||
| 2026-01-14 | 13F | ORG Partners LLC | 44 | 3 | ||||||
| 2026-02-18 | 13F | Vermillion & White Wealth Management Group, LLC | 326 | 0,00 | 25 | 0,00 | ||||
| 2026-01-28 | 13F | Diversified Enterprises, LLC | 3.403 | 264 | ||||||
| 2026-04-20 | 13F | Ritholtz Wealth Management | 34.866 | -19,48 | 2.546 | -24,11 | ||||
| 2026-02-13 | 13F | Police & Firemen's Retirement System of New Jersey | 72.162 | -4,23 | 5.593 | -4,57 | ||||
| 2026-02-06 | 13F | Larson Financial Group LLC | 37.864 | 0,42 | 2.934 | 0,07 | ||||
| 2026-02-12 | 13F | Ci Investments Inc. | 71.655 | -10,81 | 5.553 | 92.450,00 | ||||
| 2026-01-29 | 13F | Rakuten Securities, Inc. | 1 | -98,70 | 0 | -100,00 | ||||
| 2026-02-06 | 13F | Covestor Ltd | 1.537 | 0,00 | 0 | |||||
| 2026-01-21 | 13F | Westfuller Advisors, LLC | 1.375 | -3,64 | 107 | -3,64 | ||||
| 2026-04-02 | 13F | Ares Financial Consulting, LLC | 418 | 231,75 | 31 | 233,33 | ||||
| 2026-02-04 | 13F | Investors Asset Management Of Georgia Inc /ga/ /adv | 5.938 | 0,07 | 460 | -0,22 | ||||
| 2026-02-17 | 13F | Cresset Asset Management, LLC | 0 | -100,00 | 0 | |||||
| 2026-02-13 | 13F | Pinnacle Wealth Planning Services, Inc. | 470 | 36 | ||||||
| 2026-02-10 | 13F/A | Northwestern Mutual Wealth Management Co | 2.444 | -5,56 | 189 | -5,97 | ||||
| 2026-02-20 | 13F | Dorsey Wright & Associates | 0 | -100,00 | 0 | |||||
| 2026-02-02 | 13F | Cornerstone Planning Group LLC | 0 | -100,00 | 0 | -100,00 | ||||
| 2026-02-10 | 13F | New Mexico Educational Retirement Board | 32.443 | 0,00 | 3 | 0,00 | ||||
| 2026-01-28 | 13F | Arizona State Retirement System | 44.930 | -8,34 | 3.482 | -8,66 | ||||
| 2026-02-09 | 13F | Glenview Trust Co | 5.863 | 0,00 | 454 | -0,44 | ||||
| 2026-01-21 | 13F | Sound Income Strategies, LLC | 688 | 60,37 | 52 | 62,50 | ||||
| 2026-04-14 | 13F | Bay Harbor Wealth Management, LLC | 30 | 42,86 | 2 | 100,00 | ||||
| 2026-02-17 | 13F | Citadel Advisors Llc | 239.127 | 48,96 | 18.532 | 48,42 | ||||
| 2026-02-17 | 13F | Citadel Advisors Llc | Put | 17.800 | -64,33 | 1.380 | -64,47 | |||
| 2026-02-17 | 13F | Citadel Advisors Llc | Call | 8.400 | -68,18 | 651 | -68,29 | |||
| 2026-01-30 | 13F/A | M&t Bank Corp | 10.035 | 2,74 | 778 | 2,37 | ||||
| 2026-01-29 | 13F | Pictet Asset Management Holding SA | 23.754 | 6,08 | 1.841 | 5,69 | ||||
| 2026-02-02 | 13F | Qrg Capital Management, Inc. | 12.026 | 14,13 | 932 | 13,68 | ||||
| 2026-02-09 | 13F | Hantz Financial Services, Inc. | 2.189 | 83,64 | 0 | |||||
| 2026-04-14 | 13F | Prospera Financial Services Inc | 12.711 | -37,25 | 930 | -40,87 | ||||
| 2026-02-13 | 13F | Victory Capital Management Inc | 1.797.305 | -17,42 | 139.291 | -17,72 | ||||
| 2025-11-13 | 13F/A | Peak6 Llc | Put | 0 | -100,00 | 0 | ||||
| 2026-04-10 | 13F | Centurion Wealth Management LLC | 3.750 | 0,00 | 274 | -5,86 | ||||
| 2025-11-13 | 13F/A | Peak6 Llc | Call | 0 | -100,00 | 0 | ||||
| 2026-02-12 | 13F | Advisors Asset Management, Inc. | 3.057 | -31,78 | 237 | -32,18 | ||||
| 2026-02-24 | 13F | DGS Capital Management, LLC | 41.006 | -2,38 | 3.178 | -2,75 | ||||
| 2026-01-07 | 13F | Sagespring Wealth Partners, Llc | 2.898 | 225 | ||||||
| 2026-01-21 | 13F | Yousif Capital Management, Llc | 49.958 | -3,84 | 3.771 | -6,68 | ||||
| 2025-11-14 | 13F | Point72 Hong Kong Ltd | 0 | -100,00 | 0 | |||||
| 2026-02-17 | 13F | Farringdon Capital, Ltd. | 0 | -100,00 | 0 | |||||
| 2026-01-26 | 13F | PFG Investments, LLC | 2.824 | 0,00 | 219 | -0,46 | ||||
| 2026-04-16 | 13F | Consolidated Planning Corp | 29.427 | -51,80 | 2.149 | -54,58 | ||||
| 2025-11-12 | 13F | Proficio Capital Partners LLC | 0 | -100,00 | 0 | |||||
| 2026-01-27 | 13F | WealthCollab, LLC | 370 | 0,00 | 29 | 0,00 | ||||
| 2026-02-12 | 13F | JPL Wealth Management, LLC | 0 | -100,00 | 0 | |||||
| 2026-03-06 | 13F | Hsbc Holdings Plc | 11.259 | -74,59 | 873 | -74,48 | ||||
| 2026-01-27 | 13F | Regions Financial Corp | 6.475 | 2,92 | 502 | 2,45 | ||||
| 2026-02-12 | 13F | California Public Employees Retirement System | 461.161 | -18,30 | 35.740 | -18,60 | ||||
| 2026-02-17 | 13F | MIRAE ASSET GLOBAL ETFS HOLDINGS Ltd. | 50.085 | 10,06 | 3.882 | 9,66 | ||||
| 2026-04-20 | 13F | CWA Asset Management Group, LLC | 0 | -100,00 | 0 | |||||
| 2026-02-17 | 13F | Gillson Capital LP | 0 | -100,00 | 0 | |||||
| 2025-11-14 | 13F | Texas Permanent School Fund | 0 | -100,00 | 0 | |||||
| 2026-04-17 | 13F | Krilogy Financial LLC | 2.993 | -17,46 | 236 | -14,49 | ||||
| 2026-04-17 | 13F | Hanson & Doremus Investment Management | 3.480 | 0,00 | 0 | |||||
| 2026-02-19 | 13F | CI Private Wealth, LLC | 199.133 | 52,06 | 10.744 | 5,48 | ||||
| 2026-02-17 | 13F | Lighthouse Investment Partners, LLC | 37.773 | 2.927 | ||||||
| 2026-02-10 | 13F | Goldman Sachs Group Inc | 1.243.739 | -17,60 | 96.390 | -17,90 | ||||
| 2026-02-13 | 13F | AlTi Global, Inc. | 4.433 | -10,84 | 343 | -11,14 | ||||
| 2025-11-14 | 13F | Wetherby Asset Management Inc | 13.709 | 1,22 | 1.066 | -2,47 | ||||
| 2026-04-20 | 13F | Hilton Head Capital Partners, LLC | 235 | 0,43 | 17 | -5,56 | ||||
| 2026-01-23 | 13F | Patten Group, Inc. | 5.930 | 0,00 | 460 | -0,43 | ||||
| 2026-02-17 | 13F | Campion Asset Management LLC | 7.529 | -1,00 | 583 | -1,35 | ||||
| 2026-02-09 | 13F | Integrity Alliance, Llc. | 5.683 | 440 | ||||||
| 2026-04-17 | 13F | CENTRAL TRUST Co | 1.000 | 0,00 | 73 | -5,19 | ||||
| 2026-04-17 | 13F | Bell Investment Advisors, Inc | 200 | 0,00 | 15 | -6,67 | ||||
| 2026-01-26 | 13F | Private Trust Co Na | 2.657 | 0,00 | 206 | -0,49 | ||||
| 2025-11-12 | 13F | CIBC Bancorp USA Inc. | 5.614 | 437 | ||||||
| 2026-02-17 | 13F | Ibex Wealth Advisors | 124.602 | -0,79 | 9.657 | -1,15 | ||||
| 2025-11-10 | 13F | Raiffeisen Bank International AG | 0 | -100,00 | 0 | -100,00 | ||||
| 2026-02-18 | 13F | First Citizens Bank & Trust Co | 21.140 | 0,79 | 1.638 | 0,43 | ||||
| 2026-04-09 | 13F | Goelzer Investment Management, Inc. | 27.521 | 0,16 | 2.010 | -5,64 | ||||
| 2026-02-13 | 13F | FORA Capital, LLC | 6.190 | 480 | ||||||
| 2026-02-17 | 13F | Balyasny Asset Management Llc | 700.748 | 20,14 | 54.308 | 19,71 | ||||
| 2026-02-19 | 13F | Atomi Financial Group, Inc. | 5.306 | -7,69 | 411 | -8,05 | ||||
| 2026-02-11 | 13F | Total Wealth Planning & Management, Inc. | 7.988 | -74,54 | 619 | -75,56 | ||||
| 2026-02-04 | 13F | Dogwood Wealth Management LLC | 22 | -70,67 | 2 | -80,00 | ||||
| 2025-10-21 | 13F | Simon Quick Advisors, Llc | 0 | -100,00 | 0 | -100,00 | ||||
| 2026-02-11 | 13F | Schulhoff & Co Inc | 4.000 | 0,00 | 310 | -0,32 | ||||
| 2026-02-06 | 13F | Addison Advisors LLC | 1.614 | -1,59 | 125 | -1,57 | ||||
| 2026-02-13 | 13F | Kestra Advisory Services, LLC | 0 | -100,00 | 0 | |||||
| 2025-11-14 | 13F | Williamson Legacy Group, LLC | 0 | -100,00 | 0 | |||||
| 2026-02-17 | 13F | Voloridge Investment Management, Llc | 78.690 | 6.098 | ||||||
| 2026-01-30 | 13F | North Star Investment Management Corp. | 427 | 0,23 | 33 | 0,00 | ||||
| 2025-11-14 | 13F | Cubist Systematic Strategies, LLC | Call | 0 | -100,00 | 0 | -100,00 | |||
| 2026-04-10 | 13F | Quaker Wealth Management, LLC | 2 | 0,00 | 0 | |||||
| 2025-11-14 | 13F | Cubist Systematic Strategies, LLC | 0 | -100,00 | 0 | -100,00 | ||||
| 2026-01-14 | 13F | Hennion & Walsh Asset Management, Inc. | 7.666 | -1,50 | 594 | -1,82 | ||||
| 2026-02-10 | 13F | Baker Avenue Asset Management, LP | 3.873 | 300 | ||||||
| 2026-01-21 | 13F | Greenleaf Trust | 9.885 | -1,70 | 766 | -2,05 | ||||
| 2026-02-04 | 13F | Atlantic Union Bankshares Corp | 1.900 | 0,00 | 147 | 0,00 | ||||
| 2026-02-13 | 13F | Cornerstone Financial Management LLC | 28 | 2 | ||||||
| 2026-01-26 | 13F | Means Investment Co., Inc. | 5.770 | 0,42 | 447 | 0,22 | ||||
| 2026-02-12 | 13F | Keynote Financial Services Llc | 16.291 | -0,28 | 1.263 | -0,63 | ||||
| 2026-02-13 | 13F | Ariadne Wealth Management, LP | 2.865 | -3,54 | 204 | -10,53 | ||||
| 2026-02-09 | 13F | Jefferies Financial Group Inc. | 10.000 | 775 | ||||||
| 2026-01-15 | 13F | Nisa Investment Advisors, Llc | 38.535 | 0,00 | 2.986 | -0,37 | ||||
| 2025-11-04 | 13F | Strategy Asset Managers Llc | 0 | -100,00 | 0 | |||||
| 2026-02-10 | 13F | Spinnaker Trust | 3.515 | 0,00 | 272 | -0,37 | ||||
| 2026-02-06 | 13F | FourThought Financial Partners, LLC | 4.344 | 0,12 | 337 | -0,30 | ||||
| 2026-02-03 | 13F | Coston, McIsaac & Partners | 224 | 0,00 | 0 | |||||
| 2026-02-10 | 13F | Rothschild Investment Llc | 2.019 | -35,60 | 156 | -35,80 | ||||
| 2025-11-13 | 13F | Glenmede Investment Management, LP | 117.326 | -24,25 | 9.126 | -27,05 | ||||
| 2026-04-03 | 13F | Investors Research Corp | 23.401 | -1,27 | 1.709 | -6,97 | ||||
| 2025-11-12 | 13F | Edgestream Partners, L.P. | 0 | -100,00 | 0 | |||||
| 2026-02-17 | 13F | Aqr Capital Management Llc | 2.153.499 | -7,94 | 166.896 | -8,11 | ||||
| 2026-02-13 | 13F | Aviso Financial Inc. | 0 | -100,00 | 0 | |||||
| 2026-01-30 | 13F | Camden Capital, LLC | 2.879 | 223 | ||||||
| 2026-02-12 | 13F | Commonwealth Equity Services, Llc | 37.031 | -6,57 | 2.870 | 95.533,33 | ||||
| 2026-02-13 | 13F | First Trust Advisors Lp | 4.681.079 | -18,38 | 362.784 | -18,67 | ||||
| 2026-02-13 | 13F | Arrowstreet Capital, Limited Partnership | 521.352 | 103,01 | 40.405 | 102,28 | ||||
| 2026-01-22 | 13F | V-Square Quantitative Management LLC | 932 | 72 | ||||||
| 2026-01-29 | 13F | Concurrent Investment Advisors, LLC | 25.319 | -1,01 | 1.962 | -1,36 | ||||
| 2026-02-05 | 13F | Stephens Inc /ar/ | 16.379 | -1,33 | 1.346 | 0,15 | ||||
| 2026-02-12 | 13F | South Dakota Investment Council | 173.957 | 2,59 | 13 | 0,00 | ||||
| 2026-01-20 | 13F | Ascent Group, LLC | 19.891 | -3,82 | 1.542 | -4,17 | ||||
| 2026-02-12 | 13F | Brinker Capital Investments, LLC | 8.740 | 1,18 | 677 | 0,89 | ||||
| 2026-02-17 | 13F | XTX Topco Ltd | 69.498 | 1.752,29 | 5.386 | 1.750,86 | ||||
| 2026-01-23 | 13F | Assetmark, Inc | 12.597 | -0,56 | 976 | -0,91 | ||||
| 2026-02-17 | 13F | Summit Trail Advisors, Llc | 24.751 | 1,95 | 1.918 | 1,59 | ||||
| 2026-01-28 | 13F | HB Wealth Management, LLC | 13.675 | 40,70 | 1.060 | 40,26 | ||||
| 2026-02-10 | 13F | Intech Investment Management Llc | 88.678 | -25,64 | 6.873 | -25,91 | ||||
| 2026-02-18 | 13F | Vident Advisory, LLC | 21.278 | -5,72 | 1.649 | -6,04 | ||||
| 2026-02-17 | 13F | Aquatic Capital Management LLC | 12.592 | 976 | ||||||
| 2026-02-12 | 13F | Federation des caisses Desjardins du Quebec | 12.844 | 13,25 | 995 | 12,81 | ||||
| 2026-02-13 | 13F | Mml Investors Services, Llc | 13.731 | -0,49 | 1.064 | -0,84 | ||||
| 2025-11-13 | 13F | Renaissance Technologies Llc | 0 | -100,00 | 0 | |||||
| 2026-01-26 | 13F | Childress Capital Advisors, Llc | 3.668 | 284 | ||||||
| 2026-02-05 | 13F | High Note Wealth, LLC | 68 | 70,00 | 5 | 66,67 | ||||
| 2026-02-17 | 13F | Ancora Advisors, LLC | 848 | 98,59 | 66 | 96,97 | ||||
| 2026-01-16 | 13F | Kendall Capital Management | 36.950 | -9,79 | 2.864 | -10,11 | ||||
| 2026-01-30 | 13F | Turning Point Benefit Group, Inc. | 32 | 0,00 | 2 | 0,00 | ||||
| 2026-02-13 | 13F | Vontobel Holding Ltd. | 3.405 | 264 | ||||||
| 2026-04-21 | 13F | Foster & Motley Inc | 123.907 | 0,51 | 9 | 0,00 | ||||
| 2026-02-13 | 13F | Dockside LLC | 34.300 | 2.658 | ||||||
| 2026-02-12 | 13F | NDVR, Inc. | 3.488 | -19,11 | 270 | -19,40 | ||||
| 2026-02-03 | 13F | Merrithew & Thorsten Inc | 313 | 0 | ||||||
| 2025-11-07 | 13F | Sierra Ocean, Llc | 0 | -100,00 | 0 | |||||
| 2026-02-17 | 13F | United Capital Financial Advisers, Llc | 9.396 | -1,64 | 728 | -2,02 | ||||
| 2026-01-26 | 13F | Whittier Trust Co | 1.186 | 266,05 | 93 | 272,00 | ||||
| 2026-04-15 | 13F | Merit Financial Group, LLC | 13.181 | -3,33 | 963 | -8,90 | ||||
| 2026-04-15 | 13F | Nations Financial Group Inc, /ia/ /adv | 3.102 | -92,77 | 227 | -93,21 | ||||
| 2026-02-11 | 13F | Jpmorgan Chase & Co | 540.839 | -18,99 | 41.915 | -19,28 | ||||
| 2026-02-13 | 13F | Hudson Bay Capital Management LP | 202.991 | 58,61 | 15.732 | 58,04 | ||||
| 2026-02-09 | 13F | Quest Partners LLC | 6.298 | 1,91 | 488 | 1,67 | ||||
| 2025-11-14 | 13F | Two Sigma Securities, Llc | 0 | -100,00 | 0 | |||||
| 2026-02-17 | 13F | Wellington Management Group Llp | 245.994 | 19.065 | ||||||
| 2026-02-03 | 13F | Bokf, Na | 27.424 | -9,53 | 2.125 | -9,84 | ||||
| 2026-02-11 | 13F | Empowered Funds, LLC | 2.180 | 169 | ||||||
| 2026-02-13 | 13F | State Street Corp | 5.330.104 | -3,20 | 413.083 | -3,54 | ||||
| 2026-02-11 | 13F | Twin Tree Management, LP | Put | 0 | -100,00 | 0 | -100,00 | |||
| 2026-02-11 | 13F | Picton Mahoney Asset Management | 9.050 | 701 | ||||||
| 2026-02-10 | 13F | Principia Wealth Advisory, LLC | 13 | 18,18 | 1 | |||||
| 2026-02-19 | 13F | Mcguire Capital Advisors Inc | 6 | 0 | ||||||
| 2026-04-20 | 13F | MBM Wealth Consultants, LLC | 392 | 29 | ||||||
| 2026-01-16 | 13F | Marquette Asset Management, LLC | 35 | 3 | ||||||
| 2026-02-17 | 13F | Freestone Grove Partners LP | 281.531 | 2,06 | 21.819 | 1,69 | ||||
| 2026-02-04 | 13F | Virginia Retirement Systems Et Al | 308.620 | -5,81 | 23.918 | -6,15 | ||||
| 2026-01-06 | 13F | E Six Thirteen, Llc | 45.556 | -70,93 | 3.531 | -71,04 | ||||
| 2025-11-13 | 13F | Skyline Advisors, Inc. | 0 | -100,00 | 0 | -100,00 | ||||
| 2026-02-02 | 13F | Oppenheimer & Co Inc | 9.129 | -5,53 | 707 | -5,86 | ||||
| 2026-02-12 | 13F | CIBC Private Wealth Group, LLC | 5.252 | -6,45 | 407 | -6,65 | ||||
| 2026-02-17 | 13F | Zurich Insurance Group Ltd/FI | 759.490 | 58.860 | ||||||
| 2026-02-04 | 13F | Swiss Life Asset Management Ltd | 7.639 | 0,00 | 592 | -0,34 | ||||
| 2026-02-06 | 13F | HighTower Advisors, LLC | 107.711 | 114,98 | 8.348 | 114,19 | ||||
| 2026-02-11 | 13F | Sharpepoint Llc | 5.501 | 426 | ||||||
| 2026-04-17 | 13F | Brown, Lisle/cummings, Inc. | 6 | 0 | ||||||
| 2026-02-03 | 13F | F/M Investments LLC | 3.930 | 0,00 | 305 | -0,33 | ||||
| 2026-01-29 | 13F | Nbc Securities, Inc. | 0 | -100,00 | 0 | |||||
| 2026-02-13 | 13F | Stifel Financial Corp | 183.679 | -4,23 | 14.235 | -4,58 | ||||
| 2026-01-23 | 13F | Private Wealth Management Group, LLC | 256 | 0,00 | 20 | 0,00 | ||||
| 2025-11-14 | 13F | Binnacle Investments Inc | 242 | 16,35 | 19 | 12,50 | ||||
| 2026-04-06 | 13F | GAMMA Investing LLC | 9.109 | -0,62 | 665 | -6,34 | ||||
| 2026-01-30 | 13F | Laurel Wealth Advisors LLC | 325 | 25 | ||||||
| 2025-11-12 | 13F | Northwest & Ethical Investments L.P. | 0 | -100,00 | 0 | |||||
| 2026-04-07 | 13F | Signaturefd, Llc | 18.297 | 1,36 | 1.336 | -4,50 | ||||
| 2026-01-14 | 13F | Klein Pavlis & Peasley Financial, Inc. | 28.854 | -1,18 | 2.236 | -1,54 | ||||
| 2026-02-04 | 13F | Ameritas Advisory Services, LLC | 8.231 | 638 | ||||||
| 2026-04-20 | 13F | Louisiana State Employees Retirement System | 44.200 | 3,76 | 3.228 | -2,24 | ||||
| 2026-02-11 | 13F | Prudential Plc | 3.423 | -11,62 | 265 | -11,96 | ||||
| 2026-04-10 | 13F | Oak Thistle LLC | 17.421 | 519,96 | 1.272 | 486,18 | ||||
| 2026-04-21 | 13F | Curat Global, LLC | 2.195 | 0,00 | 160 | -5,88 | ||||
| 2026-02-17 | 13F | Magnetar Financial LLC | 7.705 | 597 | ||||||
| 2026-02-05 | 13F | Requisite Capital Management, LLC | 0 | -100,00 | 0 | |||||
| 2026-02-11 | 13F | Vestcor Inc | 133.192 | -11,28 | 10 | -9,09 | ||||
| 2025-11-14 | 13F | DZ BANK AG Deutsche Zentral Genossenschafts Bank, Frankfurt am Main | 0 | -100,00 | 0 | |||||
| 2026-02-13 | 13F | Capital Square, LLC | 3.331 | 0,06 | 258 | -0,39 | ||||
| 2026-02-17 | 13F | Balyasny Asset Management Llc | Call | 0 | -100,00 | 0 | ||||
| 2026-02-17 | 13F | Signature Equity Partners, LLC | 85 | 7 | ||||||
| 2025-11-05 | 13F | Alps Advisors Inc | 0 | -100,00 | 0 | |||||
| 2026-02-17 | 13F | Cambria Investment Management, L.P. | 0 | -100,00 | 0 | -100,00 | ||||
| 2026-02-12 | 13F | Bank Of Montreal /can/ | 37.563 | -2,47 | 2.911 | -2,80 | ||||
| 2026-02-11 | 13F | Meeder Advisory Services, Inc. | 7.446 | 577 | ||||||
| 2026-02-09 | 13F | Keating Financial Advisory Services, Inc. | 146 | 11 | ||||||
| 2026-01-12 | 13F | CVA Family Office, LLC | 1.090 | 0,00 | 84 | 0,00 | ||||
| 2026-02-10 | 13F | Argent Trust Co | 38.333 | -0,48 | 2.971 | -0,83 | ||||
| 2026-02-26 | 13F | TD Capital Management LLC | 5.657 | 0,00 | 438 | -0,45 | ||||
| 2025-11-14 | 13F | Wolverine Trading, Llc | Call | 14.900 | -26,60 | 1.154 | -29,39 | |||
| 2026-02-13 | 13F | Ieq Capital, Llc | 8.363 | -81,23 | 648 | -81,29 | ||||
| 2025-11-14 | 13F | Wolverine Trading, Llc | Put | 13.900 | 113,85 | 1.076 | 106,13 | |||
| 2026-02-02 | 13F | Benjamin Edwards Inc | 12.505 | 8,53 | 969 | 8,15 | ||||
| 2026-02-02 | 13F | New England Capital Financial Advisors LLC | 1.904 | 0,00 | 148 | -0,68 | ||||
| 2026-01-30 | 13F | Sigma Planning Corp | 3.026 | -6,05 | 234 | -6,40 | ||||
| 2026-04-16 | 13F | Capital Advisors, Ltd. LLC | 77 | 0,00 | 0 | |||||
| 2026-02-13 | 13F | Squarepoint Ops LLC | 642.331 | 89,25 | 49.781 | 88,57 | ||||
| 2025-11-03 | 13F | Carl P. Sherr & Co., LLC | 0 | -100,00 | 0 | |||||
| 2026-02-13 | 13F | Prospector Partners Llc | 0 | -100,00 | 0 | |||||
| 2026-01-26 | 13F | Cwm, Llc | 30.257 | -29,43 | 2 | -33,33 | ||||
| 2026-02-13 | 13F | Squarepoint Ops LLC | Call | 8.000 | 86,05 | 620 | 85,63 | |||
| 2025-11-14 | 13F | Wolverine Trading, Llc | 9.635 | 746 | ||||||
| 2025-11-03 | 13F | JSF Financial, LLC | 0 | -100,00 | 0 | |||||
| 2026-02-12 | 13F | Skandinaviska Enskilda Banken AB (publ) | 0 | -100,00 | 0 | |||||
| 2026-01-29 | 13F | Teachers Retirement System Of The State Of Kentucky | 50.900 | 0,00 | 4 | 0,00 | ||||
| 2026-02-12 | 13F | StoneX Group Inc. | 4.334 | 5,42 | 336 | 5,02 | ||||
| 2026-02-12 | 13F | Affinity Investment Advisors, Llc | 11.629 | 0,00 | 901 | -0,33 | ||||
| 2026-01-29 | 13F | UBS Group AG | 1.356.916 | 5,35 | 105.161 | 4,97 | ||||
| 2026-02-06 | 13F | EverSource Wealth Advisors, LLC | 1.986 | -3,78 | 154 | -4,37 | ||||
| 2026-01-09 | 13F | Silver Lake Advisory, LLC | 74.430 | 1,22 | 5.768 | 0,86 | ||||
| 2026-02-05 | 13F | Amalgamated Bank | 69.824 | -3,97 | 5 | 0,00 | ||||
| 2026-01-29 | 13F | State Of Michigan Retirement System | 36.400 | -2,41 | 2.821 | -2,76 | ||||
| 2026-02-12 | 13F | Dimensional Fund Advisors Lp | 3.791.712 | 0,37 | 293.868 | 0,01 | ||||
| 2026-02-13 | 13F | Brown Advisory Inc | 5.735 | 0,88 | 444 | 0,45 | ||||
| 2026-01-26 | 13F | Grace & White Inc /ny | 488.230 | -1,11 | 37.838 | -1,47 | ||||
| 2026-02-13 | 13F | Bay Colony Advisory Group, Inc d/b/a Bay Colony Advisors | 6.497 | -1,80 | 504 | -2,14 | ||||
| 2026-02-17 | 13F | DV Trading LLC | 400 | 31 | ||||||
| 2026-02-17 | 13F | Delaware Management Holdings, Inc. | 37.500 | 2.906 | ||||||
| 2026-02-17 | 13F | TCG Advisory Services, LLC | 3.824 | 296 | ||||||
| 2026-01-26 | 13F | Main Street Group, LTD | 0 | -100,00 | 0 | |||||
| 2026-02-17 | 13F | D. E. Shaw & Co., Inc. | 542.982 | 635,16 | 42.081 | 632,61 | ||||
| 2026-04-14 | 13F | Zrc Wealth Management, Llc | 71 | 195,83 | 5 | 400,00 | ||||
| 2026-02-17 | 13F | Northern Trust Corp | 1.705.116 | -2,85 | 132.146 | -3,20 | ||||
| 2025-11-13 | 13F | GeoWealth Management, LLC | 0 | -100,00 | 0 | |||||
| 2026-02-13 | 13F | Panagora Asset Management Inc | 0 | -100,00 | 0 | |||||
| 2026-01-30 | 13F | Wealthstar Advisors, Llc | 5.953 | -9,60 | 461 | -9,96 | ||||
| 2025-11-12 | 13F | Beaton Management Co. Inc. | 0 | -100,00 | 0 | |||||
| 2026-04-08 | 13F | Wealth Enhancement Advisory Services, Llc | 46.551 | -21,69 | 3.453 | -26,18 | ||||
| 2026-02-13 | 13F | American Century Companies Inc | 308.753 | -41,06 | 23.928 | -41,28 | ||||
| 2026-02-05 | 13F | Paulson Wealth Management Inc. | 3.980 | 0,00 | 308 | -0,32 | ||||
| 2026-02-10 | 13F | IFG Advisory, LLC | 108.107 | 8.378 | ||||||
| 2026-01-30 | 13F | Us Bancorp \de\ | 96.897 | -0,39 | 7.510 | -0,75 | ||||
| 2026-02-17 | 13F | Advisory Services Network, LLC | 31.723 | -11,00 | 2.459 | -11,33 | ||||
| 2026-02-18 | 13F | EP Wealth Advisors, Inc. | 10.212 | 164,22 | 791 | 153,53 | ||||
| 2026-04-08 | 13F | BOS Asset Management, LLC | 9.208 | -19,00 | 672 | -23,72 | ||||
| 2026-04-15 | 13F | Exchange Traded Concepts, Llc | 2.048 | -39,75 | 150 | -43,35 | ||||
| 2026-02-17 | 13F | Watershed Asset Management, L.L.C. | 0 | -100,00 | 0 | |||||
| 2026-02-17 | 13F | Quantinno Capital Management LP | 658.212 | 48,55 | 51.011 | 48,02 | ||||
| 2026-02-09 | 13F | Hartland & Co., LLC | 3.746 | -7,12 | 290 | -7,35 | ||||
| 2026-02-14 | 13F | Rockefeller Capital Management L.P. | 16.938 | -0,62 | 1.313 | -0,98 | ||||
| 2026-02-04 | 13F | Oregon Public Employees Retirement Fund | 30.783 | -2,53 | 2.386 | -2,89 | ||||
| 2026-02-09 | 13F | Legal & General Group Plc | 286.492 | -25,58 | 22.203 | -25,85 | ||||
| 2026-02-11 | 13F | Twin Tree Management, LP | Call | 125.400 | -57,91 | 9.718 | -58,06 | |||
| 2026-02-17 | 13F | Capitolis Liquid Global Markets LLC | 0 | -100,00 | 0 | |||||
| 2026-02-17 | 13F | BTG Pactual Asset Management US LLC | 2.732 | 212 | ||||||
| 2025-10-21 | 13F | Brown Miller Wealth Management, LLC | 0 | -100,00 | 0 | |||||
| 2025-11-14 | 13F | Axa S.a. | 0 | -100,00 | 0 | |||||
| 2026-02-17 | 13F | SageView Advisory Group, LLC | 4.624 | -4,99 | 358 | -5,29 | ||||
| 2026-01-14 | 13F | Spire Wealth Management | 39 | 0,00 | 3 | 0,00 | ||||
| 2026-04-14 | 13F | Kozak & Associates, Inc. | 142 | 0,71 | 11 | -9,09 | ||||
| 2026-02-11 | 13F | Havemeyer Place LP | 21.070 | 1.633 | ||||||
| 2025-10-28 | 13F | Prossimo Advisors, LLC | 0 | -100,00 | 0 | |||||
| 2026-01-15 | 13F | Retirement Systems of Alabama | 409.759 | -1,13 | 31.756 | -1,49 | ||||
| 2025-11-14 | 13F | KKM Financial LLC | 0 | -100,00 | 0 | |||||
| 2026-02-12 | 13F | Nuveen, LLC | 1.116.877 | -4,36 | 86.558 | -4,71 | ||||
| 2026-02-10 | 13F | Eurizon Capital SGR S.p.A. | 4.480 | 349 | ||||||
| 2026-02-17 | 13F | Alliancebernstein L.p. | 272.333 | 18,53 | 21.106 | 18,10 | ||||
| 2026-02-06 | 13F | Great Diamond Partners, LLC | 36.808 | 0,71 | 2.853 | 0,35 | ||||
| 2026-01-28 | 13F | WPG Advisers, LLC | 1.331 | 2,54 | 103 | 3,00 | ||||
| 2026-02-17 | 13F | Voleon Capital Management Lp | 7.816 | 54,44 | 606 | 53,94 | ||||
| 2026-02-17 | 13F | Numerai GP LLC | 4.578 | -13,08 | 355 | -13,45 | ||||
| 2026-02-03 | 13F | NewEdge Wealth, LLC | 4.939 | 39,09 | 383 | 40,44 | ||||
| 2026-02-17 | 13F | NewSquare Capital LLC | 78.831 | -29,11 | 6.109 | -29,37 | ||||
| 2026-04-07 | 13F | CoreCap Advisors, LLC | 67.858 | 14,89 | 4.956 | 8,26 | ||||
| 2025-11-14 | 13F | Mount Yale Investment Advisors, LLC | 0 | -100,00 | 0 | -100,00 | ||||
| 2026-02-04 | 13F | HighPoint Advisor Group LLC | 2.603 | 202 | ||||||
| 2026-02-11 | 13F | MCF Advisors LLC | 705 | 0,00 | 55 | 0,00 | ||||
| 2026-01-22 | 13F | Wetzel Investment Advisors, Inc. | 4.190 | 0,00 | 325 | -0,31 | ||||
| 2026-02-04 | 13F | LRI Investments, LLC | 58 | 0,00 | 4 | 0,00 | ||||
| 2026-01-29 | 13F | Impax Asset Management Group plc | 13.829 | 1.072 | ||||||
| 2026-02-13 | 13F | Mariner, LLC | 41.586 | -31,96 | 3.224 | -32,19 | ||||
| 2026-02-17 | 13F | Glenmede Trust Co Na | 48.362 | -71,52 | 3.748 | -72,91 | ||||
| 2026-04-20 | 13F | Kestra Private Wealth Services, Llc | 4.804 | 1,26 | 351 | -4,63 | ||||
| 2026-02-06 | 13F | Handelsbanken Fonder AB | 52.707 | 5,61 | 4 | 33,33 | ||||
| 2026-02-13 | 13F | Seneschal Advisors, LLC | 3 | 0,00 | 0 | |||||
| 2025-11-14 | 13F | Squarepoint Ops LLC | Put | 0 | -100,00 | 0 | -100,00 | |||
| 2026-01-28 | 13F | Teacher Retirement System Of Texas | 115.682 | -6,82 | 8.965 | -7,15 | ||||
| 2025-11-14 | 13F | PineBridge Investments, L.P. | 10.805 | -1,86 | 840 | -5,51 | ||||
| 2026-02-17 | 13F | Cetera Investment Advisers | 58.657 | -7,46 | 4.546 | -7,81 | ||||
| 2026-02-06 | 13F | Kingdom Financial Group LLC. | 126 | 10 | ||||||
| 2025-11-14 | 13F | Centiva Capital, LP | 0 | -100,00 | 0 | -100,00 | ||||
| 2026-01-27 | 13F | TD Waterhouse Canada Inc. | 1.851 | -19,49 | 143 | -20,11 | ||||
| 2026-01-28 | 13F | Klp Kapitalforvaltning As | 51.900 | 0,39 | 4.022 | 0,02 | ||||
| 2026-02-10 | 13F | Castlekeep Investment Advisors Llc | 20.879 | 0,00 | 1.618 | -0,31 | ||||
| 2026-02-12 | 13F | New York State Common Retirement Fund | 97.333 | 0,00 | 7.543 | -0,36 | ||||
| 2026-02-17 | 13F | Mirabella Financial Services Llp | 7.293 | 565 | ||||||
| 2026-02-17 | 13F | Auxier Asset Management | 56.329 | -1,82 | 4.365 | -2,17 | ||||
| 2025-11-14 | 13F | Susquehanna Portfolio Strategies, LLC | 0 | -100,00 | 0 | -100,00 | ||||
| 2026-04-17 | 13F | Boston Private Wealth Llc | 4.939 | 1,54 | 361 | -4,26 | ||||
| 2026-01-23 | 13F | Robeco Institutional Asset Management B.V. | 126.091 | -41,21 | 9.772 | -41,42 | ||||
| 2026-02-10 | 13F | Acadian Asset Management Llc | 0 | -100,00 | 0 | |||||
| 2026-04-21 | 13F | Aaron Wealth Advisors LLC | 5.725 | -46,70 | 418 | -49,76 | ||||
| 2026-02-17 | 13F | Maryland State Retirement & Pension System | 8.486 | 0,00 | 658 | -0,45 | ||||
| 2026-02-12 | 13F | Voya Investment Management Llc | 221.527 | -4,07 | 17.168 | -4,42 | ||||
| 2026-02-12 | 13F | Federated Hermes, Inc. | 16.851 | -10,48 | 1.306 | -10,86 | ||||
| 2026-02-11 | 13F | Capital Analysts, Inc. | 952 | -36,28 | 0 | |||||
| 2026-02-06 | 13F | GPS Wealth Strategies Group, LLC | 0 | -100,00 | 0 | |||||
| 2026-01-27 | 13F | First Horizon Corp | 5.443 | -6,24 | 422 | -6,65 | ||||
| 2026-02-17 | 13F | Fmr Llc | 7.431.736 | 3,61 | 575.960 | 3,24 | ||||
| 2026-04-20 | 13F | Assenagon Asset Management S.A. | 231.586 | 16.913 | ||||||
| 2026-04-13 | 13F | Neumann Capital Management, LLC | 16.041 | -4,00 | 1.171 | -9,58 | ||||
| 2026-01-27 | 13F | Zurcher Kantonalbank (Zurich Cantonalbank) | 77.338 | -81,63 | 5.994 | -81,70 | ||||
| 2026-02-13 | 13F | Barclays Plc | Call | 0 | -100,00 | 0 | -100,00 | |||
| 2026-02-13 | 13F | Rafferty Asset Management, LLC | 2.587 | -4,43 | 200 | -4,76 | ||||
| 2026-02-13 | 13F | Alyeska Investment Group, L.P. | 930.534 | 365,27 | 72.116 | 363,59 | ||||
| 2026-01-27 | 13F | Belpointe Asset Management LLC | 9.630 | 2,41 | 746 | 2,05 | ||||
| 2025-11-07 | 13F | Beacon Capital Management, LLC | 0 | -100,00 | 0 | |||||
| 2026-02-03 | 13F | Sequoia Financial Advisors, LLC | 29.289 | 15,22 | 2.270 | 14,77 | ||||
| 2026-02-17 | 13F | Qube Research & Technologies Ltd | 800.762 | 62.059 | ||||||
| 2026-01-23 | 13F | Optima Capital Llc | 20 | 2 | ||||||
| 2026-01-15 | 13F | Nilsine Partners, LLC | 19.239 | 7,29 | 1.491 | 6,96 | ||||
| 2026-01-21 | 13F | Flagship Harbor Advisors, Llc | 0 | -100,00 | 0 | |||||
| 2026-02-11 | 13F | Rise Advisors, LLC | 0 | -100,00 | 0 | |||||
| 2025-11-12 | 13F | Tounjian Advisory Partners, Llc | 0 | -100,00 | 0 | |||||
| 2026-02-17 | 13F | Polymer Capital Management (US) LLC | 14.423 | 145,25 | 1.118 | 144,42 | ||||
| 2025-11-06 | 13F | Versor Investments LP | 0 | -100,00 | 0 | |||||
| 2026-02-17 | 13F | Wiley Bros.-aintree Capital, Llc | 6.311 | -0,83 | 489 | -1,21 | ||||
| 2026-01-15 | 13F | Polianta Ltd | 0 | -100,00 | 0 | |||||
| 2026-01-29 | 13F | Dumont & Blake Investment Advisors Llc | 8.104 | -3,90 | 1 | -100,00 | ||||
| 2026-02-11 | 13F | J.w. Cole Advisors, Inc. | 4.145 | -25,18 | 267 | -38,14 | ||||
| 2026-02-17 | 13F | Raymond James Financial Inc | 245.930 | -7,61 | 19.060 | -7,95 | ||||
| 2026-04-16 | 13F | Toth Financial Advisory Corp | 2.559 | 0,00 | 187 | -6,06 | ||||
| 2026-02-11 | 13F | Fox Run Management, L.l.c. | 21.558 | 20,24 | 1.671 | 19,80 | ||||
| 2025-10-30 | 13F | Boston Common Asset Management, LLC | 0 | -100,00 | 0 | |||||
| 2025-11-10 | 13F | Counterpoint Mutual Funds LLC | 0 | -100,00 | 0 | -100,00 | ||||
| 2026-04-09 | 13F | Sculati Wealth Management, LLC | 35.901 | -0,51 | 2.622 | -6,26 | ||||
| 2026-02-17 | 13F | LaSalle St. Investment Advisors, LLC | 0 | -100,00 | 0 | |||||
| 2026-02-10 | 13F | Evolution Wealth Management Inc. | 241 | 0,00 | 19 | 0,00 | ||||
| 2026-02-11 | 13F | Inceptionr Llc | 11.371 | 881 | ||||||
| 2026-02-17 | 13F | Gotham Asset Management, LLC | 21.054 | -83,62 | 1.632 | -83,69 | ||||
| 2026-02-17 | 13F | Susquehanna Fundamental Investments, Llc | 0 | -100,00 | 0 | -100,00 | ||||
| 2026-02-10 | 13F | Connor, Clark & Lunn Investment Management Ltd. | 0 | -100,00 | 0 | |||||
| 2026-02-12 | 13F | BRYN MAWR TRUST Co | 0 | -100,00 | 0 | -100,00 | ||||
| 2026-02-13 | 13F | Prudential Financial Inc | 66.212 | -73,17 | 5.186 | -72,98 | ||||
| 2026-02-05 | 13F | Applied Finance Capital Management, LLC | 0 | -100,00 | 0 | |||||
| 2026-04-15 | 13F | Financial Management Professionals, Inc. | 29 | 0,00 | 2 | 0,00 | ||||
| 2026-04-10 | 13F | Armstrong Advisory Group, Inc | 322 | 92,81 | 24 | 91,67 | ||||
| 2026-02-17 | 13F | Toronto Dominion Bank | Call | 10.000 | -65,28 | 775 | -65,40 | |||
| 2026-02-03 | 13F | SBI Securities Co., Ltd. | 916 | -21,71 | 71 | -23,08 | ||||
| 2026-02-05 | 13F | Northwestern Mutual Investment Management Company, Llc | 34.444 | -1,38 | 2.669 | -1,73 | ||||
| 2026-02-06 | 13F | Envestnet Portfolio Solutions, Inc. | 19.623 | 1,95 | 1.521 | 1,54 | ||||
| 2026-02-17 | 13F | Woodline Partners LP | 1.412.830 | 112,40 | 109.494 | 111,64 | ||||
| 2026-02-13 | 13F | Quarry LP | 0 | -100,00 | 0 | |||||
| 2026-04-16 | 13F | SG Americas Securities, LLC | 228.473 | 48,65 | 17 | 45,45 | ||||
| 2026-02-11 | 13F | Illinois Municipal Retirement Fund | 84.576 | -5,69 | 6.555 | -6,04 | ||||
| 2026-02-10 | 13F | Nomura Asset Management Co Ltd | 2.080 | 0,00 | 161 | 0,00 | ||||
| 2026-02-13 | 13F | Resources Investment Advisors, LLC. | 3.410 | -2,12 | 264 | -2,22 | ||||
| 2026-04-06 | 13F | Old Port Advisors | 8.729 | 0,00 | 637 | -5,77 | ||||
| 2026-01-15 | 13F | apricus wealth, LLC | 36.870 | 1,65 | 2.857 | 1,28 | ||||
| 2026-02-11 | 13F | Gwn Securities Inc. | 7.677 | 30,34 | 595 | 29,63 | ||||
| 2025-11-14 | 13F/A | Mubadala Investment Co PJSC | 0 | -100,00 | 0 | |||||
| 2026-02-09 | 13F | Coldstream Capital Management Inc | 11.775 | -4,62 | 913 | -5,00 | ||||
| 2026-02-03 | 13F | Crossmark Global Holdings, Inc. | 11.221 | -63,54 | 870 | -63,69 | ||||
| 2025-10-27 | 13F | Roof Eidam & Maycock/adv | 0 | -100,00 | 0 | |||||
| 2026-02-12 | 13F | Steward Partners Investment Advisory, Llc | 1.512 | 6,93 | 117 | 7,34 | ||||
| 2026-02-05 | 13F | Td Private Client Wealth Llc | 279 | -13,89 | 22 | -16,00 | ||||
| 2026-04-13 | 13F | Hm Payson & Co | 11.032 | -3,13 | 806 | -8,73 | ||||
| 2026-02-11 | 13F | Lifestyle Asset Management, Inc. | 0 | -100,00 | 0 | |||||
| 2025-11-14 | 13F | Point72 (DIFC) Ltd | 2.991 | -76,94 | 233 | -77,84 | ||||
| 2026-02-02 | 13F | KPP Advisory Services LLC | 3.194 | -0,78 | 248 | -1,20 | ||||
| 2026-02-12 | 13F | Pitcairn Co | 0 | -100,00 | 0 | |||||
| 2026-02-13 | 13F | Citigroup Inc | 60.232 | 57,00 | 4.668 | 56,40 | ||||
| 2026-02-06 | 13F | Csenge Advisory Group | 5.462 | -0,24 | 423 | -0,47 | ||||
| 2026-01-30 | 13F | BancorpSouth Bank | 7.248 | 0,00 | 562 | -0,36 | ||||
| 2026-02-02 | 13F | Millstone Evans Group, LLC | 620 | 0,00 | 48 | 0,00 | ||||
| 2025-11-13 | 13F | Blueshift Asset Management, LLC | 0 | -100,00 | 0 | |||||
| 2026-02-12 | 13F | Hollencrest Capital Management | 241 | 0,42 | 19 | 0,00 | ||||
| 2026-04-20 | 13F | Sowell Financial Services LLC | 0 | -100,00 | 0 | |||||
| 2026-01-27 | 13F | Lecap Asset Management Ltd | 21.573 | 1.672 | ||||||
| 2026-02-13 | 13F | Verition Fund Management LLC | Call | 5.600 | -40,43 | 434 | -40,63 | |||
| 2026-02-13 | 13F | Verition Fund Management LLC | 28.791 | 125,16 | 2.231 | 124,45 | ||||
| 2026-02-12 | 13F | BlackRock, Inc. | 17.047.275 | -2,07 | 1.321.164 | -2,42 | ||||
| 2026-02-23 | 13F | Beaird Harris Wealth Management, LLC | 63 | 0,00 | 5 | 0,00 | ||||
| 2026-02-17 | 13F | Credit Agricole S A | 5.286 | 0,00 | 410 | -0,49 | ||||
| 2025-10-29 | 13F | Triasima Portfolio Management inc. | 0 | -100,00 | 0 | |||||
| 2026-02-23 | 13F | Mv Capital Management, Inc. | 1 | -66,67 | 0 | |||||
| 2025-10-28 | 13F | American Capital Advisory, LLC | 0 | -100,00 | 0 | |||||
| 2026-01-30 | 13F | Catalytic Wealth RIA, LLC | 0 | -100,00 | 0 | |||||
| 2026-02-09 | 13F | Key FInancial Inc | 64 | 0,00 | 5 | -20,00 | ||||
| 2026-01-14 | 13F/A | TABR Capital Management, LLC | 74.430 | 5.768 | ||||||
| 2025-11-14 | 13F | Boone Capital Management Llc | 0 | -100,00 | 0 | |||||
| 2026-02-17 | 13F | Mercer Global Advisors Inc /adv | 540.144 | 88,02 | 42.067 | 88,27 | ||||
| 2026-02-17 | 13F | Trexquant Investment LP | 68.027 | -45,23 | 5.272 | -45,42 | ||||
| 2026-04-13 | 13F | GoalVest Advisory LLC | 140 | 0,00 | 10 | 0,00 | ||||
| 2026-01-28 | 13F | Universal- Beteiligungs- und Servicegesellschaft mbH | 77.343 | -10,47 | 6.014 | -10,49 | ||||
| 2026-02-17 | 13F | Utah Retirement Systems | 8.948 | 0,00 | 693 | -0,29 | ||||
| 2026-02-10 | 13F | Bank of New York Mellon Corp | 1.669.079 | -6,73 | 129.354 | -7,07 | ||||
| 2025-10-24 | 13F | Hemington Wealth Management | 424 | -26,00 | 0 | |||||
| 2026-02-03 | 13F | Crestwood Advisors Group LLC | 2.782 | 216 | ||||||
| 2026-02-13 | 13F | Public Employees Retirement Association Of Colorado | 16.616 | 0,00 | 1 | 0,00 | ||||
| 2026-02-17 | 13F | Dark Forest Capital Management Lp | 56.911 | 4.411 | ||||||
| 2026-02-10 | 13F | Bnp Paribas Arbitrage, Sa | 82.716 | -31,41 | 6.410 | -31,66 | ||||
| 2026-01-27 | 13F | Waterfront Wealth Inc. | 31.890 | 0,04 | 2.458 | 1,07 | ||||
| 2026-01-26 | 13F | Patriot Financial Group Insurance Agency, LLC | 4.552 | -1,85 | 353 | -2,22 | ||||
| 2026-01-27 | 13F | Forum Financial Management, LP | 6.298 | 0,00 | 488 | -0,20 | ||||
| 2026-01-13 | 13F | Kathmere Capital Management, LLC | 2.857 | 221 | ||||||
| 2026-02-13 | 13F | JustInvest LLC | 69.248 | -1,32 | 5.367 | -1,69 | ||||
| 2026-01-26 | 13F | Pursuit Wealth Management LLC | 8.131 | 630 | ||||||
| 2026-02-13 | 13F | Wells Fargo & Company/mn | 99.987 | -9,65 | 7.749 | -9,97 | ||||
| 2026-02-03 | 13F | Ethic Inc. | 24.322 | 2,80 | 1.885 | 2,39 | ||||
| 2026-02-09 | 13F/A | Swedbank AB | 467.505 | 148,31 | 36.232 | 147,43 | ||||
| 2026-02-10 | 13F | Thompson Siegel & Walmsley Llc | 37.450 | -60,76 | 3 | -71,43 | ||||
| 2026-01-08 | 13F | NorthCrest Asset Manangement, LLC | 0 | -100,00 | 0 | |||||
| 2026-02-11 | 13F | Parallel Advisors, LLC | 2.987 | -0,03 | 232 | -0,43 | ||||
| 2026-02-10 | 13F | Portland Global Advisors LLC | 2.925 | -39,04 | 227 | -39,41 | ||||
| 2025-11-07 | 13F | Readystate Asset Management Lp | 0 | -100,00 | 0 | |||||
| 2026-02-03 | 13F | McIlrath & Eck, LLC | 463 | 0,00 | 36 | -2,78 | ||||
| 2026-02-06 | 13F | Mjp Associates Inc /adv | 2.927 | 2,41 | 227 | 1,80 | ||||
| 2026-02-17 | 13F | Brevan Howard Capital Management LP | 0 | -100,00 | 0 | |||||
| 2026-04-07 | 13F | Retirement Wealth Solutions LLC | 34 | 47,83 | 2 | 100,00 | ||||
| 2025-10-30 | 13F | Twin Peaks Wealth Advisors, LLC | 0 | -100,00 | 0 | |||||
| 2026-04-13 | 13F | True Wealth Design, LLC | 594 | -2,30 | 43 | -8,51 | ||||
| 2026-02-17 | 13F | Fountainhead AM, LLC | 0 | -100,00 | 0 | |||||
| 2026-02-17 | 13F | Css Llc/il | 11.829 | 16,67 | 917 | 16,24 | ||||
| 2026-02-03 | 13F | Winch Advisory Services, LLC | 18 | 0,00 | 1 | 0,00 | ||||
| 2026-02-02 | 13F | Strs Ohio | 4.049 | 0,17 | 314 | -0,32 | ||||
| 2026-02-11 | 13F | Townsquare Capital Llc | 0 | -100,00 | 0 | -100,00 | ||||
| 2026-02-11 | 13F | Dorsey & Whitney Trust CO LLC | 6.134 | -1,60 | 475 | -1,86 | ||||
| 2025-10-28 | 13F | D. Scott Neal, Inc. | 257.423 | -2,71 | 20.022 | -6,30 | ||||
| 2025-11-14 | 13F | Genus Capital Management Inc. | 0 | -100,00 | 0 | |||||
| 2026-02-11 | 13F | Hughes Financial Services, LLC | 9 | 0,00 | 1 | |||||
| 2026-02-17 | 13F | Captrust Financial Advisors | 254.579 | 0,60 | 19.730 | 0,23 | ||||
| 2025-11-14 | 13F | Point72 Europe (London) LLP | 127.393 | 230,79 | 9.909 | 218,59 | ||||
| 2026-02-12 | 13F | State Board Of Administration Of Florida Retirement System | 146.280 | 0,00 | 11.337 | -0,36 | ||||
| 2026-02-13 | 13F | Great West Life Assurance Co /can/ | 94.038 | -25,88 | 7 | -22,22 | ||||
| 2026-02-05 | 13F | Center for Financial Planning, Inc. | 1.234 | 18,20 | 96 | 17,28 | ||||
| 2026-02-13 | 13F | Ossiam | 0 | -100,00 | 0 | |||||
| 2026-02-10 | 13F | Hillsdale Investment Management Inc. | 0 | -100,00 | 0 | |||||
| 2026-02-17 | 13F | Ameriprise Financial Inc | 324.856 | -25,44 | 25.175 | -25,73 | ||||
| 2026-02-10 | 13F | Moors & Cabot, Inc. | 3.791 | 0,00 | 294 | -0,34 | ||||
| 2026-02-06 | 13F | Profund Advisors Llc | 3.125 | -10,64 | 242 | -10,70 | ||||
| 2026-02-12 | 13F | Elo Mutual Pension Insurance Co | 32.170 | 173,04 | 2.493 | 172,16 | ||||
| 2026-02-13 | 13F | Morgan Stanley | 3.259.970 | -3,81 | 252.648 | -4,16 | ||||
| 2026-02-12 | 13F | Ensign Peak Advisors, Inc | 600.257 | -13,11 | 46.520 | -13,43 | ||||
| 2026-02-17 | 13F | Lazard Asset Management Llc | 56.256 | -39,51 | 4.360 | -39,73 | ||||
| 2026-04-07 | 13F | Farther Finance Advisors, LLC | 7.186 | 2,16 | 531 | -2,75 | ||||
| 2026-02-13 | 13F | Bridgewater Associates, LP | 241.414 | -44,64 | 18.710 | -44,84 | ||||
| 2026-02-05 | 13F | Thrivent Financial For Lutherans | 72.345 | 11,16 | 6 | 0,00 | ||||
| 2026-01-28 | 13F | Barrett & Company, Inc. | 396 | 0,00 | 31 | 0,00 | ||||
| 2026-04-20 | 13F | William B. Walkup & Associates, Inc. | 855 | -24,34 | 70 | -20,69 | ||||
| 2026-02-17 | 13F | Price T Rowe Associates Inc /md/ | 201.986 | 4,54 | 16 | 0,00 | ||||
| 2026-01-23 | 13F | Sumitomo Mitsui Trust Holdings, Inc. | 24.491 | 1.898 | ||||||
| 2026-04-08 | 13F | Arlington Trust Co LLC | 21 | 2 | ||||||
| 2026-02-05 | 13F | AlphaCore Capital LLC | 103.450 | -0,59 | 8.017 | -0,95 | ||||
| 2025-10-23 | 13F | Moran Wealth Management, LLC | 0 | -100,00 | 0 | |||||
| 2026-02-02 | 13F | Danske Bank A/s | 1.700 | 183,33 | 132 | 184,78 | ||||
| 2026-02-11 | 13F | LPL Financial LLC | 291.867 | -0,25 | 22.620 | -0,61 | ||||
| 2026-02-18 | 13F | State of Tennessee, Treasury Department | 63.489 | -4,11 | 4.823 | -6,33 | ||||
| 2026-04-17 | 13F | HHM Wealth Advisors, LLC | 31.331 | 0,00 | 2.288 | -5,77 | ||||
| 2026-04-17 | 13F | HHM Wealth Advisors, LLC | Put | 1.965 | -5,76 | |||||
| 2026-02-11 | 13F | Deseret Mutual Benefit Administrators | 396 | 0,00 | 31 | 0,00 | ||||
| 2026-01-21 | 13F | DMG Group, LLC | 11.333 | 3,40 | 878 | 3,05 | ||||
| 2025-11-14 | 13F | Beacon Pointe Advisors, LLC | 0 | -100,00 | 0 | |||||
| 2026-02-09 | 13F | Atlantic Trust, LLC | 92 | -11,54 | 7 | -12,50 | ||||
| 2026-01-29 | 13F | D.a. Davidson & Co. | 7.778 | -1,31 | 603 | -1,79 | ||||
| 2026-01-29 | 13F | Advisors Capital Management, LLC | 7.195 | 11,33 | 558 | 10,96 | ||||
| 2026-02-17 | 13F | Prosperity Consulting Group, LLC | 8.029 | 1,44 | 622 | 1,14 | ||||
| 2026-02-12 | 13F | Brown Brothers Harriman & Co | 5.214 | 20,19 | 404 | 19,88 | ||||
| 2026-02-18 | 13F | Financial Advisory Service, Inc. | 11.085 | 0,60 | 859 | 0,23 | ||||
| 2026-02-12 | 13F | Skopos Labs, Inc. | 9.302 | 44,76 | 731 | 41,20 | ||||
| 2026-02-13 | 13F | Entropy Technologies, LP | 48.766 | 267,66 | 3.779 | 266,54 | ||||
| 2026-02-17 | 13F | NorthRock Partners, LLC | 5.218 | -38,01 | 404 | -38,23 | ||||
| 2026-02-12 | 13F | Keel Point, LLC | 11.152 | -0,89 | 864 | -1,26 | ||||
| 2026-04-20 | 13F | Jfs Wealth Advisors, Llc | 283 | 2,54 | 21 | -4,76 | ||||
| 2025-11-10 | 13F | Lion Street Advisors, LLC | 10.070 | 75,10 | 256 | -44,83 | ||||
| 2026-02-04 | 13F | Advisor OS, LLC | 2.927 | 2,41 | 227 | 1,80 | ||||
| 2026-02-13 | 13F | Palisade Asset Management, LLC | 0 | -100,00 | 0 | |||||
| 2026-02-13 | 13F | Sterling Capital Management LLC | 10.022 | -4,10 | 777 | -4,43 | ||||
| 2026-01-14 | 13F | Clarius Group, LLC | 3.176 | 0,00 | 246 | -0,40 | ||||
| 2026-01-20 | 13F | American National Bank | 122 | 9 | ||||||
| 2026-04-21 | 13F | Paradigm Financial Partners, Llc | 8.943 | -8,84 | 653 | -14,08 | ||||
| 2026-02-09 | 13F | Fidelis Capital Partners, LLC | 3.122 | 1,46 | 242 | 0,84 | ||||
| 2025-11-12 | 13F | Cobblestone Capital Advisors Llc /ny/ | 4.436 | 0,00 | 345 | -3,63 | ||||
| 2026-02-17 | 13F | Balyasny Asset Management Llc | Put | 0 | -100,00 | 0 | ||||
| 2026-02-11 | 13F | 111 Capital | 5.699 | 442 | ||||||
| 2026-04-20 | 13F | Naples Global Advisors, Llc | 33.100 | 0,01 | 2.417 | -5,77 | ||||
| 2026-02-10 | 13F | State of Wyoming | 8.089 | -39,18 | 627 | -39,46 | ||||
| 2026-04-21 | 13F | Pallas Capital Advisors LLC | 5.522 | 3,89 | 403 | -1,95 | ||||
| 2026-02-10 | 13F | Norges Bank | 14.308.628 | 1.108.919 | ||||||
| 2026-02-17 | 13F | Canada Pension Plan Investment Board | 335.376 | -0,50 | 25.992 | -0,86 | ||||
| 2025-11-07 | 13F | Axxcess Wealth Management, Llc | 0 | -100,00 | 0 | |||||
| 2025-11-14 | 13F | FJ Capital Management LLC | 0 | -100,00 | 0 | |||||
| 2026-01-28 | 13F | Chicago Partners Investment Group LLC | 11.052 | 10,16 | 841 | 12,28 | ||||
| 2025-11-14 | 13F | Eqis Capital Management, Inc. | 0 | -100,00 | 0 | |||||
| 2026-02-17 | 13F | Man Group plc | 224.791 | -7,75 | 17.421 | -8,08 | ||||
| 2026-01-29 | 13F | UMA Financial Services, Inc. | 10 | -84,62 | 1 | -100,00 | ||||
| 2026-02-17 | 13F | Advisor Group Holdings, Inc. | 30.764 | -57,30 | 2.385 | -55,18 | ||||
| 2026-02-13 | 13F | Cynosure Management, Llc | 5.912 | 458 | ||||||
| 2026-02-12 | 13F | Gardner Russo & Quinn Llc | 3.800 | 0,00 | 294 | -0,34 | ||||
| 2026-02-05 | 13F | Baader Bank INC | 6.831 | 529 | ||||||
| 2026-02-12 | 13F | Wedbush Securities Inc | 5.214 | -2,58 | 0 | |||||
| 2026-02-23 | 13F | Leonteq Securities AG | 0 | -100,00 | 0 | |||||
| 2026-02-13 | 13F | Ubs Asset Management Americas Inc | 548.703 | -10,59 | 42.524 | -10,91 | ||||
| 2026-04-13 | 13F | Mather Group, Llc. | 3.980 | -1,97 | 291 | -7,64 | ||||
| 2026-01-29 | 13F | Vanguard Group Inc | 18.174.771 | -2,60 | 1.408.545 | -2,95 | ||||
| 2026-02-12 | 13F | Rossby Financial, LCC | 242 | 32,97 | 19 | 28,57 | ||||
| 2026-04-16 | 13F | Capital Investment Advisors, LLC | 2.882 | 0,31 | 211 | -5,41 | ||||
| 2026-02-13 | 13F | Y-Intercept (Hong Kong) Ltd | 46.437 | 3.599 | ||||||
| 2026-02-20 | 13F | Kovitz Investment Group Partners, LLC | 0 | -100,00 | 0 | |||||
| 2025-11-13 | 13F | Brant Point Investment Management Llc | 0 | -100,00 | 0 | -100,00 | ||||
| 2026-02-06 | 13F | Gsa Capital Partners Llp | 33.124 | 3 | ||||||
| 2026-02-13 | 13F | Seven Mile Advisory | 0 | -100,00 | 0 | |||||
| 2026-01-16 | 13F | Trust Co Of Vermont | 521 | 0,00 | 40 | 0,00 | ||||
| 2026-02-17 | 13F | Jump Financial, LLC | 2.607 | -93,44 | 202 | -93,47 | ||||
| 2025-11-12 | 13F | Robertson Stephens Wealth Management, LLC | 0 | -100,00 | 0 | |||||
| 2026-02-05 | 13F | Qsemble Capital Management, LP | 106.742 | 245,92 | 8.273 | 244,67 | ||||
| 2026-02-13 | 13F | Charles Schwab Investment Management Inc | 5.653.246 | 0,48 | 438.127 | 0,11 | ||||
| 2026-02-17 | 13F | Principal Street Partners, LLC | 85.445 | -0,08 | 6.622 | -0,44 | ||||
| 2026-02-11 | 13F | Simplex Trading, Llc | 14.703 | -49,86 | 1.139 | 56.850,00 | ||||
| 2026-02-11 | 13F | Simplex Trading, Llc | Call | 4.500 | -44,44 | 349 | ||||
| 2026-02-11 | 13F | Simplex Trading, Llc | Put | 20.600 | 110,20 | 1.596 | ||||
| 2026-02-11 | 13F | Allianz Asset Management GmbH | 1.154.762 | -54,11 | 89.494 | -54,27 | ||||
| 2026-02-13 | 13F | Toroso Investments, LLC | 8.132 | -25,31 | 630 | -25,53 | ||||
| 2026-04-07 | 13F | U.S. Capital Wealth Advisors, LLC | 0 | -100,00 | 0 | |||||
| 2025-11-07 | 13F | Shell Asset Management Co | 5.231 | -57,80 | 0 | -100,00 | ||||
| 2026-02-04 | 13F | Securian Asset Management, Inc | 11.219 | -4,39 | 869 | -4,71 | ||||
| 2026-02-12 | 13F | Quadrant Capital Group Llc | 4.737 | 0,64 | 367 | 0,27 | ||||
| 2026-02-12 | 13F | Great Lakes Advisors, Llc | 5.346 | -2,69 | 414 | -3,04 | ||||
| 2026-02-05 | 13F | Convergence Investment Partners, LLC | 0 | -100,00 | 0 | -100,00 | ||||
| 2026-02-09 | 13F | New Age Alpha Advisors, LLC | 85.853 | 5,99 | 6.654 | 5,60 | ||||
| 2025-10-30 | 13F | TrueMark Investments, LLC | 0 | -100,00 | 0 | |||||
| 2026-02-17 | 13F | Bank Of America Corp /de/ | 489.580 | -3,62 | 37.942 | -3,97 | ||||
| 2026-01-12 | 13F | Rialto Wealth Management, LLC | 18 | 38,46 | 1 | 0,00 | ||||
| 2026-02-13 | 13F | Neuberger Berman Group LLC | 559.657 | 15,48 | 43.373 | 15,06 | ||||
| 2026-04-14 | 13F | Thurston, Springer, Miller, Herd & Titak, Inc. | 415 | -33,39 | 30 | -37,50 | ||||
| 2026-02-09 | 13F | Geode Capital Management, Llc | 3.272.028 | -3,40 | 253.627 | -5,03 | ||||
| 2026-02-09 | 13F | HBK Sorce Advisory LLC | 0 | -100,00 | 0 | -100,00 | ||||
| 2026-02-05 | 13F | North Dakota State Investment Board | 5.952 | 461 | ||||||
| 2026-02-17 | 13F | Aster Capital Management (DIFC) Ltd | 4.658 | 229,42 | 361 | 230,28 | ||||
| 2026-04-13 | 13F | St Germain D J Co Inc | 1.277 | 109,34 | 93 | 97,87 | ||||
| 2026-02-10 | 13F | Cherry Tree Wealth Management, LLC | 179 | 0,00 | 14 | 0,00 | ||||
| 2026-04-16 | 13F | Quotient Wealth Partners, LLC | 2.791 | 204 | ||||||
| 2026-02-12 | 13F | Xponance, Inc. | 16.925 | -14,49 | 1.312 | -14,81 | ||||
| 2026-02-17 | 13F | Public Employees Retirement System Of Ohio | 115.042 | -13,02 | 8.916 | -13,33 | ||||
| 2026-04-06 | 13F | Versant Capital Management, Inc | 2.167 | 12,16 | 158 | 6,04 | ||||
| 2026-02-02 | 13F | Sachetta, LLC | 61 | 0,00 | 5 | 0,00 | ||||
| 2026-04-20 | 13F | Ronald Blue Trust, Inc. | 3.096 | -1,09 | 226 | -6,61 | ||||
| 2026-02-13 | 13F | Venture Visionary Partners LLC | 9.595 | 0,60 | 744 | 0,27 | ||||
| 2026-02-13 | 13F | Integrated Wealth Concepts LLC | 6.475 | -32,94 | 502 | -33,20 | ||||
| 2026-03-04 | 13F | SHP Wealth Management | 326 | 25 | ||||||
| 2026-02-13 | 13F/A | Newport Capital Group, LLC | 4.444 | 0,00 | 344 | -0,29 | ||||
| 2026-01-26 | 13F | Mirae Asset Global Investments Co., Ltd. | 139.175 | -7,52 | 10.786 | -7,85 | ||||
| 2026-02-10 | 13F | Savant Capital, LLC | 12.873 | 13,61 | 998 | 13,17 | ||||
| 2026-04-14 | 13F | Clean Yield Group | 26 | 0,00 | 2 | -50,00 | ||||
| 2026-04-15 | 13F | Sage Capital Management, LLC | 3.007 | 0,64 | 220 | -5,19 | ||||
| 2026-02-11 | 13F | Buckingham Strategic Partners | 0 | -100,00 | 0 | |||||
| 2025-11-06 | 13F | Westover Capital Advisors, LLC | 0 | -100,00 | 0 | |||||
| 2026-01-26 | 13F | Reyes Financial Architecture, Inc. | 47 | 0,00 | 4 | 0,00 | ||||
| 2026-04-03 | 13F | Coastline Trust Co | 4.470 | 0,00 | 326 | -5,78 | ||||
| 2026-02-05 | 13F | Cambridge Investment Research Advisors, Inc. | 28.152 | 4,36 | 2 | 0,00 | ||||
| 2026-02-13 | 13F | Kilter Group LLC | 13 | 1 | ||||||
| 2026-02-17 | 13F | Creative Planning | 104.213 | 15,99 | 8.077 | 15,57 | ||||
| 2026-04-20 | 13F | State of Alaska, Department of Revenue | 67.213 | -0,27 | 5 | -20,00 | ||||
| 2025-11-14 | 13F | AXA Investment Managers S.A. | 110.346 | 8.583 | ||||||
| 2026-02-17 | 13F | Tower Research Capital LLC (TRC) | 8.387 | 7,18 | 650 | 6,74 | ||||
| 2026-02-17 | 13F | Strive Financial Group ,LLC | 20 | 2 | ||||||
| 2025-11-06 | 13F | Abich Financial Wealth Management LLC | 0 | -100,00 | 0 | |||||
| 2026-04-13 | 13F | IFP Advisors, Inc | 3.357 | -44,92 | 245 | -48,09 | ||||
| 2026-02-09 | 13F | AIA Group Ltd | 0 | -100,00 | 0 | |||||
| 2026-02-23 | 13F | Kera Capital Partners, Inc. | 6.094 | 463 | ||||||
| 2026-02-06 | 13F | Pathway Financial Advisers, LLC | 0 | -100,00 | 0 | |||||
| 2026-02-17 | 13F | Interval Partners, LP | 153.056 | 113,84 | 11.862 | 113,06 | ||||
| 2026-01-21 | 13F | Newbridge Financial Services Group, Inc. | 86 | 0,00 | 7 | 0,00 | ||||
| 2026-01-30 | 13F | State of New Jersey Common Pension Fund D | 46.530 | -8,79 | 3.606 | -9,12 | ||||
| 2026-02-11 | 13F | O'shaughnessy Asset Management, Llc | 127.546 | -32,15 | 9.885 | -32,40 | ||||
| 2026-02-10 | 13F/A | Algebris (uk) Ltd | 699.806 | 79,68 | 54.260 | 79,26 | ||||
| 2025-11-12 | 13F | Park Square Financial Group, LLC | 0 | -100,00 | 0 | |||||
| 2026-02-13 | 13F | SRS Capital Advisors, Inc. | 8.279 | -27,47 | 642 | -27,73 | ||||
| 2026-02-05 | 13F | New York Life Investment Management Llc | 13.917 | -13,74 | 1.079 | -14,04 | ||||
| 2026-02-10 | 13F | KERR FINANCIAL PLANNING Corp | 278 | 0,00 | 21 | 0,00 | ||||
| 2026-01-30 | 13F | CBOE Vest Financial, LLC | 519.374 | -20,53 | 40.251 | -20,81 | ||||
| 2026-02-05 | 13F | Elyxium Wealth, LLC | 3.332 | 1,49 | 258 | 1,18 | ||||
| 2026-04-01 | 13F | Beacon Financial Group | 2.706 | -16,74 | 210 | -17,06 | ||||
| 2026-01-30 | 13F | Sage Rhino Capital Llc | 3.479 | 1,46 | 270 | 1,13 | ||||
| 2026-02-11 | 13F | Syon Capital Llc | 8.076 | 626 | ||||||
| 2026-02-17 | 13F | Laird Norton Trust Company, Llc | 21.277 | 1.649 | ||||||
| 2025-11-10 | 13F | Bridgewater Advisors Inc. | 0 | -100,00 | 0 | |||||
| 2025-11-14 | 13F | Challenger Wealth Management | 0 | -100,00 | 0 | -100,00 | ||||
| 2025-11-13 | 13F | VSM Wealth Advisory, LLC | 0 | -100,00 | 0 | |||||
| 2026-02-11 | 13F | SOUTH STATE Corp | 30 | 0,00 | 2 | 0,00 | ||||
| 2026-02-13 | 13F | Jacobi Capital Management LLC | 3.553 | 18,00 | 275 | 17,52 | ||||
| 2026-01-30 | 13F | NJ State Employees Deferred Compensation Plan | 0 | -100,00 | 0 | |||||
| 2025-11-14 | 13F | Strategic Global Advisors, LLC | 0 | -100,00 | 0 | -100,00 | ||||
| 2026-02-10 | 13F | Bruce G. Allen Investments, LLC | 64 | 68,42 | 5 | 100,00 | ||||
| 2026-02-11 | 13F | Franklin Resources Inc | 346.790 | -6,88 | 26.876 | -7,22 | ||||
| 2026-02-17 | 13F | Moore Capital Management, Lp | 0 | -100,00 | 0 | |||||
| 2026-02-17 | 13F | Jain Global LLC | 4.371 | 339 | ||||||
| 2026-04-06 | 13F | CX Institutional | 163 | 0 | ||||||
| 2026-02-11 | 13F | Erste Asset Management GmbH | 6.500 | 511 | ||||||
| 2026-02-17 | 13F | Redwood Investment Management, Llc | 14.142 | -8,61 | 1 | 0,00 | ||||
| 2026-02-13 | 13F | L2 Asset Management, LLC | 10.343 | 1,63 | 802 | 1,26 | ||||
| 2026-02-17 | 13F | Algert Global Llc | 121.251 | 241,35 | 9 | 350,00 | ||||
| 2026-02-11 | 13F | Donald Smith & Co., Inc. | 1.315.212 | 101.929 | ||||||
| 2026-02-10 | 13F | Natixis Advisors, L.p. | 28.253 | -0,47 | 2 | 0,00 | ||||
| 2026-04-09 | 13F | Wedmont Private Capital | 11.713 | 3,49 | 908 | 2,37 | ||||
| 2026-01-23 | 13F | Rsm Us Wealth Management Llc | 7.940 | 3,13 | 622 | 3,85 | ||||
| 2026-02-13 | 13F | Weaver C. Barksdale & Associates, Inc. | 21.431 | -11,13 | 1.661 | -11,42 | ||||
| 2026-02-09 | 13F | Harbour Investments, Inc. | 875 | -0,79 | 68 | -1,47 | ||||
| 2026-01-27 | 13F | Proffitt & Goodson Inc | 1.154 | 0,00 | 89 | 0,00 | ||||
| 2026-02-17 | 13F | Cinctive Capital Management LP | 0 | -100,00 | 0 | |||||
| 2026-02-10 | 13F | Envestnet Asset Management Inc | 7.459 | -45,40 | 578 | -45,57 | ||||
| 2026-02-12 | 13F | Barnett & Company, Inc. | 125.017 | -2,20 | 9.689 | -2,55 | ||||
| 2026-02-12 | 13F | Callan Family Office, LLC | 6.812 | 6,60 | 528 | 6,04 | ||||
| 2026-02-17 | 13F | Worldquant Millennium Advisors Llc | 3.991 | 309 | ||||||
| 2026-04-21 | 13F | Claro Advisors LLC | 2.996 | 219 | ||||||
| 2025-10-24 | 13F | Vicus Capital | 0 | -100,00 | 0 | |||||
| 2026-02-04 | 13F | Bailard, Inc. | 18.808 | 11,93 | 1.458 | 11,56 | ||||
| 2026-02-02 | 13F | Mutual Advisors, LLC | 8.553 | 1,14 | 663 | 2,48 | ||||
| 2026-02-05 | 13F | Atria Investments Llc | 5.518 | -4,85 | 428 | -5,32 | ||||
| 2026-04-07 | 13F | Park Avenue Securities Llc | 9.993 | -10,95 | 1 | |||||
| 2026-02-06 | 13F | Aviance Capital Partners, LLC | 30.028 | -0,76 | 2.327 | -1,10 | ||||
| 2026-01-28 | 13F | Hoey Investments, Inc | 1.050 | 0,00 | 81 | 0,00 | ||||
| 2026-01-29 | 13F | Comerica Bank | 81.939 | -4,50 | 6.350 | -4,84 | ||||
| 2026-02-17 | 13F | Hancock Whitney Corp | 42.139 | 0,91 | 3.266 | 0,52 | ||||
| 2026-02-11 | 13F | Livforsakringsbolaget Skandia, Omsesidigt | 84.200 | 0,00 | 6.524 | -0,38 | ||||
| 2026-02-13 | 13F | Baird Financial Group, Inc. | 7.241 | 0,63 | 561 | 0,36 | ||||
| 2026-04-21 | 13F | Old National Bancorp /in/ | 9.692 | 3,07 | 708 | -2,88 | ||||
| 2025-11-06 | 13F | Stratos Wealth Partners, LTD. | 0 | -100,00 | 0 | |||||
| 2026-02-09 | 13F | Kingsview Wealth Management, LLC | 5.393 | 6,25 | 418 | 5,84 | ||||
| 2026-02-12 | 13F | Triumph Capital Management | 400 | 0,00 | 31 | 0,00 | ||||
| 2026-02-17 | 13F | Scientech Research LLC | 4.604 | 357 | ||||||
| 2025-11-04 | 13F/A | Lingohr & Partner Asset Management GmbH | 0 | -100,00 | 0 | |||||
| 2026-02-04 | 13F | Midwest Trust Co | 3.258 | 2,84 | 252 | 2,44 | ||||
| 2026-02-12 | 13F | Principal Securities, Inc. | 0 | -100,00 | 0 | |||||
| 2026-02-12 | 13F | Aviva Plc | 0 | -100,00 | 0 | |||||
| 2026-02-13 | 13F | National Bank Of Canada /fi/ | 0 | -100,00 | 0 | |||||
| 2026-01-26 | 13F | Whittier Trust Co Of Nevada Inc | 1.172 | 0,00 | 92 | -1,08 | ||||
| 2026-01-28 | 13F | Geneos Wealth Management Inc. | 832 | 0,36 | 64 | 0,00 | ||||
| 2026-02-17 | 13F | Royal Bank Of Canada | 1.129.842 | 5,19 | 87.560 | 4,80 | ||||
| 2026-02-13 | 13F | Advisory Research Inc | 17.325 | 5,58 | 1.343 | 5,17 | ||||
| 2025-12-16 | 13F | Garde Capital, Inc. | 0 | -100,00 | 0 | |||||
| 2026-02-17 | 13F | Family Management Corp | 0 | -100,00 | 0 | |||||
| 2026-01-27 | 13F | Seeds Investor Llc | 4.070 | 6,04 | 315 | 5,70 | ||||
| 2026-02-10 | 13F | Measured Wealth Private Client Group, LLC | 2.066 | -61,27 | 160 | -61,35 | ||||
| 2026-04-13 | 13F | Bank & Trust Co | 3.202 | 0,00 | 234 | -6,05 | ||||
| 2026-01-29 | 13F | IMC-Chicago, LLC | Put | 16.200 | 1.256 | |||||
| 2026-01-21 | 13F | SJS Investment Consulting Inc. | 608 | 3,40 | 47 | 4,44 | ||||
| 2026-01-29 | 13F | IMC-Chicago, LLC | Call | 20.100 | -20,55 | 1.558 | -20,84 | |||
| 2026-02-11 | 13F | Longfellow Investment Management Co Llc | 5.576 | 0,00 | 432 | -0,23 | ||||
| 2026-01-29 | 13F | Dunhill Financial, LLC | 4 | 0 | ||||||
| 2026-02-10 | 13F | Foundations Investment Advisors, LLC | 0 | -100,00 | 0 | |||||
| 2026-02-11 | 13F | Janney Montgomery Scott LLC | 42.985 | -4,85 | 3 | 0,00 |