Grundlæggende statistik
| Institutionelle aktier (lange) | 201.411.271 - 104,47% (ex 13D/G) - change of -42,77MM shares -17,51% MRQ |
| Institutionel værdi (lang) | $ 15.482.567 USD ($1000) |
Institutionelt ejerskab og aktionærer
TransUnion (US:TRU) har 577 institutionelle ejere og aktionærer, der har indsendt 13D/G- eller 13F-formularer til Securities Exchange Commission (SEC). Disse institutioner har i alt 201,411,271 aktier. Største aktionærer omfatter Vanguard Group Inc, BlackRock, Inc., Massachusetts Financial Services Co /ma/, Wellington Management Group Llp, Dodge & Cox, Independent Franchise Partners LLP, Morgan Stanley, State Street Corp, Meritage Group LP, and Van Eck Associates Corp .
TransUnion (NYSE:TRU) institutionel ejerskabsstruktur viser aktuelle positioner i virksomheden efter institutioner og fonde, samt seneste ændringer i positionsstørrelse. Større aktionærer kan omfatte individuelle investorer, investeringsforeninger, hedgefonde eller institutioner. Skema 13D angiver, at investoren besidder (eller besidder) mere end 5 % af virksomheden og har til hensigt (eller har til hensigt at) aktivt at forfølge en ændring i forretningsstrategi. Skema 13G indikerer en passiv investering på over 5%.
The share price as of April 30, 2026 is 71,00 / share. Previously, on May 2, 2025, the share price was 85,00 / share. This represents a decline of 16,47% over that period.

Fondens stemningsscore
Fund Sentiment Score (fka Ownership Accumulation Score) finder de aktier, der bliver mest købt af fonde. Det er resultatet af en sofistikeret, multi-faktor kvantitativ model, der identificerer virksomheder med de højeste niveauer af institutionel akkumulering. Scoringsmodellen bruger en kombination af den samlede stigning i oplyste ejere, ændringerne i porteføljeallokeringer i disse ejere og andre målinger. Tallet går fra 0 til 100, hvor højere tal indikerer et højere niveau af akkumulering for sine jævnaldrende, og 50 er gennemsnittet.
Opdateringsfrekvens: Dagligt
Se Ownership Explorer, som giver en liste over højest rangerende virksomheder.
AI+ Ask Fintel’s AI assistant about TransUnion.
Select a question to share a public post with an AI-crafted answer.
Thinking of good questions…
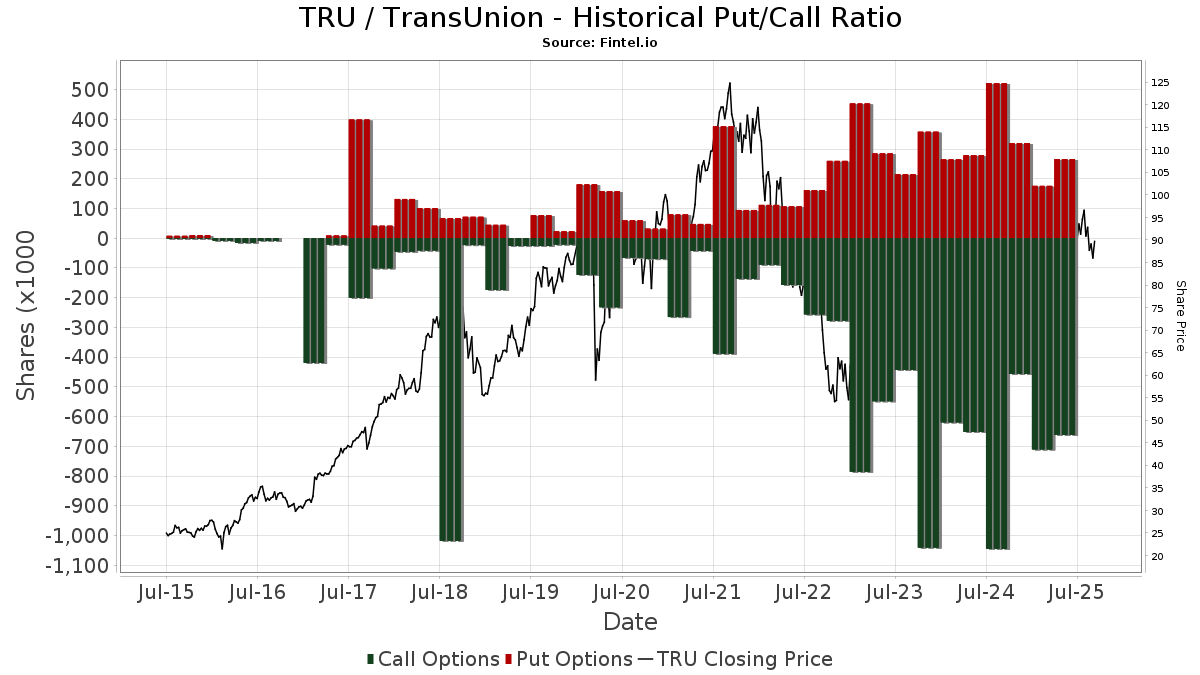
Institutionel Put/Call-forhold
Ud over at indberette standardaktie- og gældsudstedelser skal institutter med mere end 100 mill. aktiver under forvaltning også oplyse deres put- og call-optionsbeholdninger. Da salgsoptioner generelt indikerer negativ stemning, og købsoptioner indikerer positiv stemning, kan vi få en fornemmelse af den overordnede institutionelle stemning ved at plotte forholdet mellem put og kald. Diagrammet til højre viser det historiske put/call-forhold for dette instrument.
Brug af Put/Call Ratio som en indikator for investorernes stemning overvinder en af de vigtigste mangler ved at bruge totalt institutionelt ejerskab, som er, at en betydelig mængde af aktiver under forvaltning investeres passivt for at spore indekser. Passivt forvaltede fonde køber typisk ikke optioner, så indikatoren for put/call-forholdet følger mere nøje følelsen af aktivt forvaltede fonde.
13D/G-arkivering
Vi præsenterer 13D/G ansøgninger separat fra 13F ansøgninger på grund af den forskellige behandling af SEC. 13D/G-ansøgninger kan indgives af grupper af investorer (med én ledende), hvorimod 13F-ansøgninger ikke kan. Dette resulterer i situationer, hvor en investor kan indsende en 13D/G, der rapporterer én værdi for de samlede aktier (der repræsenterer alle de aktier, der ejes af investorgruppen), men derefter indsender en 13F, der rapporterer en anden værdi for de samlede aktier (der udelukkende repræsenterer deres egne) ejendomsret). Det betyder, at aktieejerskab af 13D/G-arkiver og 13F-arkiveringer ofte ikke er direkte sammenlignelige, så vi præsenterer dem separat.
Bemærk: Fra den 16. maj 2021 viser vi ikke længere ejere, der ikke har indsendt en 13D/G inden for det seneste år. Tidligere viste vi den fulde historie af 13D/G-arkiver. Generelt skal enheder, der er forpligtet til at indgive 13D/G-ansøgninger, indgive mindst årligt, før de indsender en afsluttende ansøgning. Dog forlader fonde nogle gange positioner uden at indsende en afsluttende ansøgning (dvs. de afvikler), så visning af den fulde historie resulterede nogle gange i forvirring om det nuværende ejerskab. For at undgå forvirring viser vi nu kun 'aktuelle' ejere - det vil sige - ejere, der har anmeldt inden for det seneste år.
Upgrade to unlock premium data.
| Fil dato | Form | Investor | Forrige Aktier |
Seneste Aktier |
Δ Aktier (Procent) |
Ejendomsret (Procent) |
Δ Ejerskab (Procent) |
|
|---|---|---|---|---|---|---|---|---|
| 2026-04-30 | VANGUARD CAPITAL MANAGEMENT LLC | 10,332,724 | 5.35 | |||||
| 2026-03-27 | VANGUARD GROUP INC | 17,909,990 | 0 | -100.00 | 0.00 | -100.00 | ||
| 2026-02-13 | DODGE & COX | 9,842,006 | 5.10 | |||||
| 2026-01-28 | MASSACHUSETTS FINANCIAL SERVICES CO /MA/ | 18,275,380 | 15,540,471 | -14.96 | 8.00 | -14.89 | ||
| 2025-10-17 | BlackRock, Inc. | 10,643,963 | 18,630,274 | 75.03 | 9.60 | 74.55 | ||
| 2025-05-12 | WELLINGTON MANAGEMENT GROUP LLP | 7,304,746 | 10,878,092 | 48.92 | 5.60 | 47.76 |
13F og NPORT arkivering
Detaljer om 13F-arkivering er gratis. Detaljer om NP-ansøgninger kræver et premium-medlemskab. Grønne rækker angiver nye positioner. Røde rækker angiver lukkede positioner. Klik på linket ikon for at se den fulde transaktionshistorik.
Opgrader
for at låse premium-data op og eksportere til Excel ![]() .
.
| Fil dato | Kilde | Investor | Type | Gennemsnitlig pris (Øst) |
Aktier | Δ Aktier (%) |
Rapporteret Værdi ($1000) |
Δ Værdi (%) |
Port Alloc (%) |
|
|---|---|---|---|---|---|---|---|---|---|---|
| 2026-02-14 | 13F | Rockefeller Capital Management L.P. | 81.447 | -4,01 | 6.984 | -1,74 | ||||
| 2026-02-13 | 13F | SYM FINANCIAL Corp | 4.464 | -5,44 | 383 | -3,29 | ||||
| 2026-02-17 | 13F | Tower Research Capital LLC (TRC) | 7.292 | 76,22 | 625 | 80,64 | ||||
| 2026-02-17 | 13F | Shelton Capital Management | 6.592 | 96,78 | 565 | 101,79 | ||||
| 2026-01-23 | 13F | Assetmark, Inc | 286.180 | 4,07 | 24.540 | 6,52 | ||||
| 2026-04-16 | 13F | SG Americas Securities, LLC | 0 | -100,00 | 0 | |||||
| 2026-02-17 | 13F | Credit Agricole S A | 19.331 | 16,94 | 1.658 | 19,73 | ||||
| 2026-01-29 | 13F | Copeland Capital Management, LLC | 367.393 | 32,63 | 31.504 | 35,75 | ||||
| 2025-11-20 | 13F | Asset Dedication, LLC | 0 | -100,00 | 0 | |||||
| 2025-11-07 | 13F | Atticus Wealth Management, Llc | 0 | -100,00 | 0 | -100,00 | ||||
| 2026-02-18 | 13F | Vident Advisory, LLC | 6.443 | -5,58 | 552 | -3,33 | ||||
| 2025-11-14 | 13F | Point72 Europe (London) LLP | 116.079 | -50,87 | 9.725 | -53,22 | ||||
| 2026-02-10 | 13F | Sivia Capital Partners, LLC | 5.453 | 468 | ||||||
| 2026-02-18 | 13F/A | Fuller & Thaler Asset Management, Inc. | 110.389 | -4,56 | 9.466 | -2,32 | ||||
| 2026-04-17 | 13F | Murphy & Mullick Capital Management Corp | 0 | -100,00 | 0 | |||||
| 2026-02-06 | 13F | Tredje AP-fonden | 26.226 | 2.249 | ||||||
| 2026-04-06 | 13F | CX Institutional | 184 | 820,00 | 0 | |||||
| 2026-02-13 | 13F | Cornerstone Financial Management LLC | 24 | 2 | ||||||
| 2026-02-13 | 13F | Dockside LLC | 7.207 | 618 | ||||||
| 2026-02-17 | 13F | Aqr Capital Management Llc | 383.169 | 138,34 | 32.857 | 143,96 | ||||
| 2026-02-13 | 13F | Alyeska Investment Group, L.P. | 0 | -100,00 | 0 | -100,00 | ||||
| 2025-11-13 | 13F | Riggs Asset Managment Co. Inc. | 0 | -100,00 | 0 | |||||
| 2026-04-30 | 13F | Equitable Trust Co | 57.591 | 3.985 | ||||||
| 2025-11-14 | 13F | Corton Capital Inc. | 0 | -100,00 | 0 | |||||
| 2026-04-15 | 13F | Merit Financial Group, LLC | 9.898 | 203,71 | 685 | 145,16 | ||||
| 2026-02-13 | 13F | MYDA Advisors LLC | 13.000 | 1.115 | ||||||
| 2026-04-13 | 13F | IFP Advisors, Inc | 700 | 153,62 | 48 | 108,70 | ||||
| 2026-02-12 | 13F | Cibc World Markets Corp | 6.759 | -16,82 | 580 | -19,02 | ||||
| 2026-02-13 | 13F | Arkadios Wealth Advisors | 8.493 | 17,65 | 728 | 20,53 | ||||
| 2025-11-14 | 13F | Mount Yale Investment Advisors, LLC | 0 | -100,00 | 0 | -100,00 | ||||
| 2025-11-14 | 13F | Point72 (DIFC) Ltd | 159.521 | 13.365 | ||||||
| 2026-04-08 | 13F | Cadent Capital Advisors, LLC | 2.893 | 8,60 | 200 | -12,28 | ||||
| 2026-02-11 | 13F | O'shaughnessy Asset Management, Llc | 4.543 | -41,47 | 390 | -40,15 | ||||
| 2026-02-13 | 13F | Centerpoint Advisors, LLC | 259 | 37,77 | 0 | |||||
| 2026-02-12 | 13F | Alps Advisors Inc | 9.893 | 6,18 | 848 | 8,72 | ||||
| 2026-02-13 | 13F | Treasurer of the State of North Carolina | 81.670 | -6,81 | 7 | 0,00 | ||||
| 2026-02-10 | 13F | Goldman Sachs Group Inc | 663.475 | -33,68 | 56.893 | -32,13 | ||||
| 2026-02-17 | 13F | Osterweis Capital Management Inc | 0 | -100,00 | 0 | |||||
| 2026-04-23 | 13F | Oppenheimer Asset Management Inc. | 19.026 | -5,11 | 1.316 | -23,44 | ||||
| 2026-02-17 | 13F | United Capital Financial Advisers, Llc | 2.562 | 220 | ||||||
| 2025-11-14 | 13F | Adage Capital Partners Gp, L.l.c. | 0 | -100,00 | 0 | |||||
| 2026-02-11 | 13F | Franklin Resources Inc | 296.557 | -71,57 | 25.430 | -70,90 | ||||
| 2026-04-29 | 13F | Police & Firemen's Retirement System of New Jersey | 29.531 | 0,00 | 2.043 | -19,31 | ||||
| 2026-02-17 | 13F | Independent Franchise Partners LLP | 9.136.903 | 99,70 | 783.489 | 104,40 | ||||
| 2025-11-14 | 13F | Nomura Holdings Inc | 0 | -100,00 | 0 | |||||
| 2026-04-24 | 13F | Eagle Bay Advisors LLC | 0 | -100,00 | 0 | |||||
| 2026-04-29 | 13F | KERR FINANCIAL PLANNING Corp | 146 | 0,69 | 10 | 0,00 | ||||
| 2026-01-30 | 13F | State of New Jersey Common Pension Fund D | 67.172 | -4,68 | 5.760 | -2,46 | ||||
| 2026-02-13 | 13F | Walleye Capital LLC | 0 | -100,00 | 0 | -100,00 | ||||
| 2025-11-14 | 13F | Nomura Holdings Inc | Put | 0 | -100,00 | 0 | ||||
| 2026-02-17 | 13F | Parallax Volatility Advisers, L.P. | Call | 0 | -100,00 | 0 | ||||
| 2026-02-17 | 13F | Crow's Nest Holdings LP | 0 | -100,00 | 0 | |||||
| 2026-04-28 | 13F | BW Gestao de Investimentos Ltda. | 0 | -100,00 | 0 | |||||
| 2026-02-09 | 13F | Allstate Corp | 12.928 | 83,90 | 1.109 | 88,44 | ||||
| 2026-01-08 | 13F | Nordea Investment Management Ab | 20.141 | 4,21 | 1.742 | 9,43 | ||||
| 2026-02-10 | 13F | Kentucky Retirement Systems Insurance Trust Fund | 5.130 | 0,00 | 440 | 2,33 | ||||
| 2026-02-12 | 13F | DRW Securities, LLC | 2.755 | 236 | ||||||
| 2026-02-13 | 13F | Heron Bay Capital Management | 177.431 | -0,07 | 15.215 | 2,27 | ||||
| 2025-11-10 | 13F | Resources Investment Advisors, LLC. | 0 | -100,00 | 0 | |||||
| 2026-02-10 | 13F | NS Partners Ltd | 171.071 | 0,09 | 14.669 | 2,44 | ||||
| 2026-02-17 | 13F | Sciencast Management LP | 0 | -100,00 | 0 | |||||
| 2026-02-13 | 13F | Marshall Wace, Llp | 0 | -100,00 | 0 | |||||
| 2026-02-09 | 13F | Bleakley Financial Group, LLC | 21.967 | 33,45 | 1.884 | 36,55 | ||||
| 2026-02-10 | 13F | Bearing Point Capital, Llc | 0 | -100,00 | 0 | |||||
| 2025-11-14 | 13F | Wolverine Trading, Llc | Call | 68.500 | 87,16 | 5.838 | 82,84 | |||
| 2026-01-26 | 13F | AE Wealth Management LLC | 2.521 | 216 | ||||||
| 2025-11-14 | 13F | Wolverine Trading, Llc | Put | 9.000 | 291,30 | 767 | 283,50 | |||
| 2026-02-10 | 13F | Bank of New York Mellon Corp | 1.506.026 | 1,46 | 129.142 | 3,85 | ||||
| 2026-02-13 | 13F | Commerce Bank | 7.966 | 4,58 | 683 | 7,05 | ||||
| 2026-04-22 | 13F | Sterling Capital Management LLC | 6.584 | -43,03 | 456 | -54,04 | ||||
| 2026-02-13 | 13F | Van Eck Associates Corp | 4.932.203 | 7,01 | 423 | 9,33 | ||||
| 2026-04-07 | 13F | Central Pacific Bank - Trust Division | 4.200 | 61,54 | 291 | 30,63 | ||||
| 2026-02-12 | 13F | ROSS\JOHNSON & Associates LLC | 1 | 0 | ||||||
| 2026-02-13 | 13F | Korea Investment CORP | 40.561 | 9,15 | 3.478 | 11,73 | ||||
| 2026-02-17 | 13F | Utah Retirement Systems | 32.080 | 0,00 | 2.751 | 2,34 | ||||
| 2025-11-14 | 13F | AXA Investment Managers S.A. | 932 | 78 | ||||||
| 2026-02-17 | 13F | FIL Ltd | 11.765 | -91,80 | 1.009 | -91,61 | ||||
| 2026-04-22 | 13F | Spire Wealth Management | 938 | -0,11 | 65 | -20,00 | ||||
| 2026-02-13 | 13F | Ossiam | 5.187 | 15,68 | 445 | 18,40 | ||||
| 2026-02-11 | 13F | Manchester Capital Management LLC | 42 | 4 | ||||||
| 2025-11-14 | 13F | Wolverine Trading, Llc | 10.785 | 919 | ||||||
| 2026-02-10 | 13F | Marshall & Sterling Wealth Advisors Inc. | 0 | -100,00 | 0 | |||||
| 2026-01-16 | 13F | Crewe Advisors LLC | 37 | 0,00 | 3 | 0,00 | ||||
| 2026-02-02 | 13F | Danica Pension, Livsforsikringsaktieselskab | 1.367.883 | 4,99 | 117.296 | 7,46 | ||||
| 2026-02-13 | 13F | Umb Bank N A/mo | 1.439 | -3,87 | 123 | -1,60 | ||||
| 2026-02-17 | 13F | Amundi | 921.814 | -24,00 | 79.046 | -14,95 | ||||
| 2026-05-01 | 13F | Royal London Asset Management Ltd | 87.826 | 0,00 | 6.077 | -19,32 | ||||
| 2026-04-30 | 13F | Private Trust Co Na | 515 | -28,77 | 36 | -42,62 | ||||
| 2026-02-17 | 13F | Sender Co & Partners, Inc. | Call | 0 | -100,00 | 0 | ||||
| 2026-04-24 | 13F | TT International Asset Management LTD | 19.405 | 482,73 | 1.343 | |||||
| 2026-02-13 | 13F | Verition Fund Management LLC | 23.480 | -72,18 | 2.013 | -71,53 | ||||
| 2025-11-14 | 13F | Northern Right Capital Management, L.P. | 0 | -100,00 | 0 | |||||
| 2026-01-28 | 13F | Universal- Beteiligungs- und Servicegesellschaft mbH | 102.166 | 13,25 | 8.812 | 16,58 | ||||
| 2026-01-29 | 13F | Sanctuary Advisors, LLC | 11.284 | 14,22 | 968 | 16,93 | ||||
| 2026-02-17 | 13F | Tudor Investment Corp Et Al | Call | 7.900 | 182,14 | 677 | 189,32 | |||
| 2026-04-13 | 13F | Trust Co | 4 | 0,00 | 0 | |||||
| 2025-11-14 | 13F | Capstone Investment Advisors, Llc | 0 | -100,00 | 0 | -100,00 | ||||
| 2026-04-15 | 13F | DAVENPORT & Co LLC | 35.284 | -1,83 | 2.441 | -20,77 | ||||
| 2026-04-27 | 13F | HB Wealth Management, LLC | 7.503 | 14,13 | 519 | -7,82 | ||||
| 2026-02-13 | 13F | Public Employees Retirement Association Of Colorado | 19.030 | 0,00 | 2 | 0,00 | ||||
| 2026-04-30 | 13F | Manning & Napier Advisors Llc | 1.257.357 | -5,48 | 86.997 | -24,82 | ||||
| 2026-02-10 | 13F | Bruce G. Allen Investments, LLC | 47 | 0,00 | 4 | 33,33 | ||||
| 2026-02-11 | 13F | Dorsey & Whitney Trust CO LLC | 3.208 | -1,90 | 275 | 0,73 | ||||
| 2025-11-12 | 13F | Andra AP-fonden | 0 | -100,00 | 0 | |||||
| 2026-02-17 | 13F | Mercer Global Advisors Inc /adv | 17.719 | 157,99 | 1.519 | 164,17 | ||||
| 2026-02-17 | 13F | Advisory Services Network, LLC | 0 | -100,00 | 0 | -100,00 | ||||
| 2026-04-30 | 13F | Cromwell Holdings LLC | 37 | 15,62 | 3 | 0,00 | ||||
| 2026-01-29 | 13F | Coronation Fund Managers Ltd. | 38.898 | 18,45 | 3.336 | 21,23 | ||||
| 2026-02-02 | 13F | Danske Bank A/s | 59.687 | 8,55 | 5.118 | 11,12 | ||||
| 2026-02-04 | 13F | Pandora Wealth, Inc. | 1.500 | 0,00 | 129 | 2,40 | ||||
| 2026-04-16 | 13F | Davis Capital Management | 0 | -100,00 | 0 | |||||
| 2026-01-28 | 13F | CAPROCK Group, Inc. | 16.791 | 202,81 | 1.440 | 193,67 | ||||
| 2026-02-17 | 13F | T. Rowe Price Investment Management, Inc. | 4.674.351 | -33,75 | 401 | -32,32 | ||||
| 2026-04-29 | 13F | Montag A & Associates Inc | 10 | -44,44 | 1 | -100,00 | ||||
| 2026-02-06 | 13F | Larson Financial Group LLC | 7.547 | -5,33 | 647 | -3,00 | ||||
| 2026-02-13 | 13F | JustInvest LLC | 19.892 | 28,66 | 1.706 | 31,66 | ||||
| 2026-02-11 | 13F | Zions Bancorporation, National Association /ut/ | 180 | 15 | ||||||
| 2026-02-12 | 13F | BlackRock, Inc. | 18.234.068 | -4,53 | 1.563.571 | -2,29 | ||||
| 2026-04-24 | 13F | Yousif Capital Management, Llc | 58.834 | -5,34 | 4.071 | -20,38 | ||||
| 2026-04-24 | 13F | Marathon Asset Mgmt Ltd | 569.292 | 7,87 | 39.390 | -12,96 | ||||
| 2026-03-02 | 13F | Reflection Asset Management | 187 | 16 | ||||||
| 2026-04-21 | 13F | Maseco Llp | 24 | 0,00 | 2 | -50,00 | ||||
| 2026-02-10 | 13F | Bnp Paribas Arbitrage, Sa | 269.550 | 280,59 | 23.114 | 289,57 | ||||
| 2025-11-06 | 13F | New York Life Investment Management Llc | 0 | -100,00 | 0 | |||||
| 2026-02-13 | 13F | Evelyn Partners Investment Management LLP | 98 | 0,00 | 8 | 0,00 | ||||
| 2026-02-17 | 13F | Silvercrest Asset Management Group Llc | 7.320 | 0,00 | 628 | 2,28 | ||||
| 2026-02-13 | 13F | Aviso Financial Inc. | 0 | -100,00 | 0 | |||||
| 2026-02-09 | 13F | Atlantic Trust, LLC | 117 | 368,00 | 10 | 400,00 | ||||
| 2026-01-30 | 13F | Catalytic Wealth RIA, LLC | 0 | -100,00 | 0 | |||||
| 2026-01-26 | 13F | Cwm, Llc | 6.449 | 81,56 | 1 | |||||
| 2026-02-13 | 13F | Walleye Trading LLC | Put | 12.200 | -37,44 | 1.046 | -35,95 | |||
| 2026-04-15 | 13F | Activest Wealth Management | 185 | 1.750,00 | 13 | |||||
| 2026-04-29 | 13F | Standard Life Aberdeen plc | 139.056 | 2,59 | 9.621 | -17,22 | ||||
| 2026-02-02 | 13F | Principal Financial Group Inc | 417.878 | -3,47 | 35.833 | -1,19 | ||||
| 2025-11-14 | 13F | Junto Capital Management LP | 0 | -100,00 | 0 | |||||
| 2026-02-11 | 13F | Jpmorgan Chase & Co | 1.637.178 | 18,24 | 140.388 | 21,02 | ||||
| 2026-04-30 | 13F | Hsbc Holdings Plc | 105.959 | 5,21 | 7.318 | -15,40 | ||||
| 2026-02-13 | 13F | Walleye Trading LLC | Call | 11.300 | -30,25 | 969 | -28,67 | |||
| 2026-02-11 | 13F | Picton Mahoney Asset Management | 0 | -100,00 | 0 | |||||
| 2026-02-13 | 13F | Walleye Trading LLC | 1.456 | -84,57 | 125 | -84,30 | ||||
| 2026-02-12 | 13F | Ensign Peak Advisors, Inc | 92.925 | -37,56 | 7.968 | -36,09 | ||||
| 2026-02-13 | 13F | Caitong International Asset Management Co., Ltd | 0 | -100,00 | 0 | |||||
| 2026-02-13 | 13F | MAI Capital Management | 431 | 13,72 | 37 | 16,13 | ||||
| 2026-04-30 | 13F | Sumitomo Mitsui Trust Holdings, Inc. | 393.818 | -6,56 | 27.248 | -24,60 | ||||
| 2026-01-23 | 13F | Avion Wealth | 12 | 9,09 | 0 | |||||
| 2026-04-22 | 13F | RMR Wealth Builders | 5.928 | 0,00 | 410 | -19,29 | ||||
| 2026-01-21 | 13F | Center For Asset Management LLC | 0 | -100,00 | 0 | |||||
| 2025-11-13 | 13F | Twin Tree Management, LP | 0 | -100,00 | 0 | |||||
| 2026-02-10 | 13F | Rothschild Investment Llc | 124 | 327,59 | 11 | 400,00 | ||||
| 2026-02-12 | 13F | Voya Investment Management Llc | 54.892 | -3,11 | 4.707 | -0,84 | ||||
| 2026-02-17 | 13F | Captrust Financial Advisors | 7.266 | 5,24 | 623 | 7,79 | ||||
| 2026-02-13 | 13F | Citigroup Inc | Call | 190.000 | 16.292 | |||||
| 2026-02-13 | 13F | Citigroup Inc | 447.453 | 310,21 | 38.369 | 319,88 | ||||
| 2026-02-13 | 13F | Bridgewater Associates, LP | 74.654 | 82,07 | 6.402 | 86,35 | ||||
| 2026-02-17 | 13F/A | RBF Capital, LLC | 25.000 | 0,00 | 2.144 | 2,34 | ||||
| 2026-04-24 | 13F | Profund Advisors Llc | 4.182 | 0,87 | 289 | -18,59 | ||||
| 2026-04-23 | 13F | North Star Investment Management Corp. | 15 | 150,00 | 1 | |||||
| 2026-04-13 | 13F | True Wealth Design, LLC | 171 | -53,41 | 12 | -64,52 | ||||
| 2026-02-13 | 13F | Great West Life Assurance Co /can/ | 135.980 | -57,65 | 12 | -59,26 | ||||
| 2026-02-17 | 13F | Janus Henderson Group Plc | 3.447.235 | 1,89 | 295.600 | 4,28 | ||||
| 2026-02-12 | 13F | State Board Of Administration Of Florida Retirement System | 169.803 | -4,90 | 14.561 | -2,67 | ||||
| 2026-02-13 | 13F | Schroder Investment Management Group | 17.504 | -22,36 | 1.523 | -20,77 | ||||
| 2026-02-17 | 13F | Price T Rowe Associates Inc /md/ | 768.111 | -43,47 | 66 | -42,48 | ||||
| 2026-02-17 | 13F | Soros Capital Management Llc | 21.510 | 14,66 | 1.844 | 17,38 | ||||
| 2026-02-03 | 13F | Mitsubishi UFJ Kokusai Asset Management Co., Ltd. | 184.555 | 0,00 | 15.379 | -0,54 | ||||
| 2025-11-04 | 13F | Guerra Advisors Inc | 10 | 1 | ||||||
| 2026-04-29 | 13F | Envestnet Portfolio Solutions, Inc. | 3.791 | -18,79 | 262 | -34,50 | ||||
| 2026-02-10 | 13F | New Mexico Educational Retirement Board | 39.700 | 0,00 | 3 | 0,00 | ||||
| 2026-01-14 | 13F | ORG Partners LLC | 67 | 2.133,33 | 6 | |||||
| 2026-02-11 | 13F | Capital Group Investment Management Pte. Ltd. | 0 | -100,00 | 0 | |||||
| 2026-02-12 | 13F | Cloud Capital Management, LLC | 0 | -100,00 | 0 | |||||
| 2026-02-18 | 13F | State of Tennessee, Treasury Department | 75.207 | -4,11 | 5.943 | -9,56 | ||||
| 2026-02-09 | 13F | Huntington National Bank | 174 | -6,95 | 15 | -6,67 | ||||
| 2026-04-08 | 13F | DiNuzzo Private Wealth, Inc. | 22 | -24,14 | 2 | -50,00 | ||||
| 2026-02-06 | 13F | Global Retirement Partners, LLC | 690 | 26,14 | 59 | 31,11 | ||||
| 2026-02-13 | 13F | Vega Investment Solutions | 291 | 0,00 | 25 | -4,00 | ||||
| 2026-05-01 | 13F | Arizona State Retirement System | 52.755 | -1,35 | 3.650 | -20,39 | ||||
| 2026-02-18 | 13F | GWM Advisors LLC | 587 | -9,55 | 50 | -7,41 | ||||
| 2025-11-14 | 13F | Twinbeech Capital Lp | 0 | -100,00 | 0 | |||||
| 2026-02-12 | 13F | Counterpoint Mutual Funds LLC | 4.029 | 334 | ||||||
| 2026-04-16 | 13F | Rockland Trust Co | 6.400 | 0,00 | 443 | -19,34 | ||||
| 2026-04-23 | 13F | Interchange Capital Partners, LLC | 0 | -100,00 | 0 | |||||
| 2026-02-13 | 13F | Macquarie Group Ltd | 20.598 | -79,22 | 1.766 | -78,73 | ||||
| 2026-04-30 | 13F | Kestra Advisory Services, LLC | 0 | -100,00 | 0 | |||||
| 2026-01-21 | 13F | Albion Financial Group /ut | 0 | -100,00 | 0 | |||||
| 2026-02-17 | 13F | Oddo Bhf Asset Management Sas | 0 | -100,00 | 0 | |||||
| 2026-01-29 | 13F | Cornerstone Investment Partners, LLC | 7.466 | -27,27 | 640 | -25,58 | ||||
| 2026-04-23 | 13F | Forum Financial Management, LP | 0 | -100,00 | 0 | |||||
| 2026-02-11 | 13F | Financiere des Professionnels - Fonds d,investissement inc. | 292.452 | 18,59 | 25.078 | 21,37 | ||||
| 2026-04-23 | 13F | Farmers & Merchants Investments Inc | 167 | 15,17 | 12 | -8,33 | ||||
| 2026-04-28 | 13F | Nbt Bank N A /ny | 2 | 0 | ||||||
| 2025-11-13 | 13F | FORA Capital, LLC | 0 | -100,00 | 0 | -100,00 | ||||
| 2026-02-17 | 13F | Ameriprise Financial Inc | 922.110 | -10,89 | 79.071 | -8,79 | ||||
| 2026-02-11 | 13F | Parallel Advisors, LLC | 829 | 29,53 | 71 | 33,96 | ||||
| 2025-11-21 | 13F/A | CIBC Bancorp USA Inc. | 6.997 | 586 | ||||||
| 2026-04-30 | 13F | Resona Asset Management Co.,Ltd. | 58.378 | 4,69 | 4.017 | -16,26 | ||||
| 2026-02-13 | 13F | Walleye Capital LLC | Call | 3.900 | -65,18 | 334 | -64,39 | |||
| 2026-02-13 | 13F | Manufacturers Life Insurance Company, The | 0 | -100,00 | 0 | |||||
| 2026-04-17 | 13F | Vermillion Wealth Management, Inc. | 10 | 1 | ||||||
| 2026-02-13 | 13F | Wells Fargo & Company/mn | 183.032 | -16,84 | 15.695 | -14,88 | ||||
| 2026-02-17 | 13F | Cresset Asset Management, LLC | 0 | -100,00 | 0 | -100,00 | ||||
| 2026-02-05 | 13F | Cambridge Investment Research Advisors, Inc. | 0 | -100,00 | 0 | |||||
| 2026-02-12 | 13F | MetLife Investment Management, LLC | 94.903 | -5,22 | 8.138 | -2,99 | ||||
| 2026-02-06 | 13F | EverSource Wealth Advisors, LLC | 1.262 | 44,72 | 108 | 47,95 | ||||
| 2026-02-13 | 13F | Walleye Capital LLC | Put | 4.400 | -50,00 | 377 | -48,85 | |||
| 2026-02-12 | 13F | ICICI Prudential Asset Management Co Ltd | 92.791 | 10,74 | 7.957 | 13,33 | ||||
| 2025-11-14 | 13F | Point72 Asia (Singapore) Pte. Ltd. | 0 | -100,00 | 0 | |||||
| 2026-02-10 | 13F | Mutual Of America Capital Management Llc | 84.289 | -16,11 | 7.228 | -14,15 | ||||
| 2026-02-17 | 13F | Royal Bank Of Canada | 15.013 | -92,28 | 1.287 | -92,11 | ||||
| 2026-02-13 | 13F | Knollwood Investment Advisory, LLC | 13.700 | 0,00 | 1.175 | 2,35 | ||||
| 2026-04-21 | 13F | Aaron Wealth Advisors LLC | 0 | -100,00 | 0 | |||||
| 2025-11-14 | 13F | Thematics Asset Management | 144.722 | 6,32 | 12.125 | 1,22 | ||||
| 2026-02-11 | 13F | Westfield Capital Management Co Lp | 933.553 | -20,90 | 80.052 | -19,04 | ||||
| 2026-02-24 | 13F/A | Pacer Advisors, Inc. | 23.229 | -10,31 | 1.992 | -8,21 | ||||
| 2026-02-05 | 13F | Qsemble Capital Management, LP | 4.056 | 348 | ||||||
| 2026-02-11 | 13F | Ameritas Investment Partners, Inc. | 35.591 | 3.052 | ||||||
| 2026-02-12 | 13F | Dimensional Fund Advisors Lp | 2.075.287 | -2,99 | 177.973 | -0,71 | ||||
| 2026-04-08 | 13F | Wealth Enhancement Advisory Services, Llc | 30.989 | 79,69 | 2.148 | 50,63 | ||||
| 2026-02-13 | 13F | Battery Global Advisors, LLC | 29 | 2 | ||||||
| 2026-02-06 | 13F | Tortoise Investment Management, LLC | 0 | -100,00 | 0 | |||||
| 2026-02-17 | 13F | Northern Trust Corp | 1.810.097 | 3,99 | 155.216 | 6,44 | ||||
| 2026-02-17 | 13F | D. E. Shaw & Co., Inc. | 2.385 | 205 | ||||||
| 2026-02-17 | 13F | Rakuten Investment Management, Inc. | 8.907 | -71,46 | 780 | -81,42 | ||||
| 2026-02-12 | 13F | California Public Employees Retirement System | 274.511 | 1,91 | 23.539 | 4,30 | ||||
| 2026-04-27 | 13F | New York State Teachers Retirement System | 71.120 | -8,13 | 5 | -33,33 | ||||
| 2026-04-27 | 13F | Leonteq Securities AG | 2.843 | 176,29 | 197 | 122,73 | ||||
| 2026-04-24 | 13F | Ninety One North America, Inc. | 52.702 | 0,67 | 3.646 | -18,78 | ||||
| 2026-02-17 | 13F | Xn Lp | 1.748.965 | -28,52 | 149.974 | -26,84 | ||||
| 2026-02-09 | 13F | Hartland & Co., LLC | 1.015 | 102,59 | 87 | 112,20 | ||||
| 2026-02-13 | 13F | Dai-Ichi Life Insurance Company, Ltd | 6.563 | 0,00 | 563 | 2,37 | ||||
| 2026-02-17 | 13F | IHT Wealth Management, LLC | 2.659 | 7,91 | 228 | 10,68 | ||||
| 2026-01-30 | 13F | Us Bancorp \de\ | 6.243 | -7,91 | 535 | -5,64 | ||||
| 2026-04-30 | 13F | Elevated Capital Advisors, LLC | 0 | -100,00 | 0 | |||||
| 2026-02-12 | 13F | Skandinaviska Enskilda Banken AB (publ) | 36.873 | -1,79 | 3.162 | 0,51 | ||||
| 2025-11-13 | 13F | GeoWealth Management, LLC | 0 | -100,00 | 0 | |||||
| 2026-04-17 | 13F | AdvisorNet Financial, Inc | 14 | -58,82 | 1 | -100,00 | ||||
| 2026-04-07 | 13F | CoreCap Advisors, LLC | 5 | 0,00 | 0 | |||||
| 2026-04-30 | 13F | First Horizon Corp | 68 | 5 | ||||||
| 2026-02-13 | 13F | Centiva Capital, LP | 5.054 | 433 | ||||||
| 2026-02-17 | 13F | Gillson Capital LP | 124.200 | 11 | ||||||
| 2026-02-10 | 13F | Ilmarinen Mutual Pension Insurance Co | 32.500 | 0,00 | 3 | 0,00 | ||||
| 2026-02-13 | 13F | Victory Capital Management Inc | 78.291 | -97,60 | 6.713 | -97,55 | ||||
| 2026-01-28 | 13F | DekaBank Deutsche Girozentrale | 64.891 | 0,00 | 5 | 0,00 | ||||
| 2026-02-17 | 13F | Vinva Investment Management Ltd | 20.255 | 12,91 | 1.762 | 15,25 | ||||
| 2026-01-27 | 13F | Proffitt & Goodson Inc | 0 | -100,00 | 0 | |||||
| 2026-02-10 | 13F | Heritage Trust Co | 3.100 | 0,00 | 266 | 2,32 | ||||
| 2026-04-27 | 13F | Exencial Wealth Advisors, Llc | 41.618 | -2,61 | 2.880 | -21,42 | ||||
| 2026-01-22 | 13F | Ofi Invest Asset Management | 5.776 | 495 | ||||||
| 2026-02-17 | 13F | Untitled Investments Lp | 523.528 | -3,67 | 44.893 | -1,40 | ||||
| 2026-04-13 | 13F | Mather Group, Llc. | 45 | 3 | ||||||
| 2026-01-29 | 13F | IMC-Chicago, LLC | Put | 15.900 | 1.363 | |||||
| 2026-01-29 | 13F | IMC-Chicago, LLC | Call | 102.500 | 108,33 | 8.789 | 113,27 | |||
| 2026-02-10 | 13F | Re Advisers Corp | 354.213 | -12,28 | 30.374 | -10,22 | ||||
| 2026-02-13 | 13F | Parkside Financial Bank & Trust | 215 | 313,46 | 18 | 350,00 | ||||
| 2026-02-17 | 13F | Sone Capital Management, LLC | 128.500 | -24,56 | 11.019 | -22,79 | ||||
| 2026-02-17 | 13F | Quantinno Capital Management LP | 555.573 | 153,50 | 47.640 | 159,46 | ||||
| 2026-04-24 | 13F | Optas, LLC | 0 | -100,00 | 0 | |||||
| 2026-02-13 | 13F | Ubs Asset Management Americas Inc | 1.169.901 | -5,08 | 100.319 | -2,84 | ||||
| 2026-04-30 | 13F | Sompo Japan Nipponkoa Asset Management Co.,ltd. | 5.650 | -1,74 | 391 | -20,89 | ||||
| 2025-11-06 | 13F | D.B. Root & Company, LLC | 0 | -100,00 | 0 | -100,00 | ||||
| 2026-02-10 | 13F | Tidemark, LLC | 43 | 0,00 | 4 | 0,00 | ||||
| 2026-02-17 | 13F | Occudo Quantitative Strategies Lp | 0 | -100,00 | 0 | |||||
| 2026-04-21 | 13F | Worthington Financial Partners, LLC | 12.322 | 54,10 | 853 | 24,38 | ||||
| 2026-02-13 | 13F | Toroso Investments, LLC | 7.699 | 96,60 | 660 | 101,22 | ||||
| 2026-02-06 | 13F | Markel Corp | 2.000 | -98,02 | 172 | -97,98 | ||||
| 2026-04-29 | 13F | Swedbank AB | 207.166 | 0,00 | 14.334 | -19,31 | ||||
| 2026-02-12 | 13F | Xponance, Inc. | 31.985 | -10,45 | 2.743 | -8,36 | ||||
| 2025-11-14 | 13F | Natixis | 0 | -100,00 | 0 | |||||
| 2026-02-10 | 13F | Ellevest, Inc. | 2.385 | -6,10 | 205 | -3,77 | ||||
| 2026-02-10 | 13F | Westpac Banking Corp | 4.911 | -5,72 | 421 | -3,44 | ||||
| 2026-02-17 | 13F | Alliancebernstein L.p. | 253.003 | 0,77 | 21.695 | 3,14 | ||||
| 2026-04-28 | 13F | SBI Securities Co., Ltd. | 13 | 0,00 | 1 | -100,00 | ||||
| 2026-02-17 | 13F | Frontier Capital Management Co Llc | 324.954 | -50,25 | 27.865 | -49,08 | ||||
| 2026-02-06 | 13F | Diamond Hill Capital Management Inc | 392.270 | 14,72 | 33.637 | 17,42 | ||||
| 2026-02-12 | 13F | Loomis Sayles & Co L P | 165.893 | 4,27 | 14.225 | 6,73 | ||||
| 2026-04-06 | 13F | GAMMA Investing LLC | 4.881 | 25,93 | 338 | 1,51 | ||||
| 2026-02-17 | 13F | Point72 Asset Management, L.P. | 0 | -100,00 | 0 | -100,00 | ||||
| 2026-02-09 | 13F | William Blair Investment Management, Llc | 3.965.495 | -15,25 | 340.041 | -13,25 | ||||
| 2026-02-17 | 13F | Hilltop Holdings Inc. | 5.956 | -6,85 | 511 | -4,67 | ||||
| 2026-02-17 | 13F | Sora Investors Llc | 0 | -100,00 | 0 | |||||
| 2026-02-18 | 13F/A | Empowered Funds, LLC | 4.618 | -58,67 | 396 | -57,80 | ||||
| 2025-11-07 | 13F | Shell Asset Management Co | 6.808 | -34,75 | 1 | |||||
| 2025-11-13 | 13F | Fernbridge Capital Management Lp | 0 | -100,00 | 0 | -100,00 | ||||
| 2026-02-05 | 13F | Allworth Financial LP | 2.056 | 10,96 | 176 | 13,55 | ||||
| 2026-02-11 | 13F | Allianz Asset Management GmbH | 16.137 | -90,16 | 1.384 | -89,93 | ||||
| 2026-02-17 | 13F | Man Group plc | 112.025 | 9.606 | ||||||
| 2026-02-02 | 13F | Sachetta, LLC | 44 | 0,00 | 4 | 0,00 | ||||
| 2026-02-17 | 13F | Scopia Capital Management Lp | 236.284 | -9,90 | 20.261 | -7,78 | ||||
| 2026-01-27 | 13F | Asset Management One Co., Ltd. | 81.943 | 8,67 | 7.169 | 13,47 | ||||
| 2026-01-28 | 13F | Chicago Partners Investment Group LLC | 6.459 | 48,52 | 542 | 50,56 | ||||
| 2026-02-17 | 13F | GCM Grosvenor Holdings, LLC | 0 | -100,00 | 0 | |||||
| 2026-02-17 | 13F | Lighthouse Investment Partners, LLC | 98.182 | 75,43 | 8.419 | 79,59 | ||||
| 2026-04-28 | 13F | Bogart Wealth, LLC | 16 | 1 | ||||||
| 2026-02-09 | 13F | Legal & General Group Plc | 835.329 | -30,50 | 71.629 | -28,87 | ||||
| 2026-04-15 | 13F | AlphaStar Capital Management, LLC | 0 | -100,00 | 0 | |||||
| 2026-02-11 | 13F | Capital International Investors | 0 | -100,00 | 0 | -100,00 | ||||
| 2026-04-17 | 13F | Bell Investment Advisors, Inc | 37 | -64,08 | 3 | -75,00 | ||||
| 2026-02-11 | 13F | Meeder Asset Management Inc | 127 | 217,50 | 11 | 233,33 | ||||
| 2026-04-10 | 13F | Quaker Wealth Management, LLC | 2 | -33,33 | 0 | |||||
| 2026-02-12 | 13F | South Dakota Investment Council | 29.820 | 3,90 | 3 | 0,00 | ||||
| 2026-04-20 | 13F | Threadgill Financial, Llc | 61.261 | -3,27 | 4.239 | -21,95 | ||||
| 2026-02-17 | 13F | Cape Investment Advisory, Inc. | 84 | 50,00 | 7 | 75,00 | ||||
| 2026-02-03 | 13F | Wilson Asset Management (international) Pty Ltd | 229.879 | 0,00 | 19.712 | 2,35 | ||||
| 2026-02-17 | 13F | Public Employees Retirement System Of Ohio | 117.240 | -1,45 | 10.053 | 0,87 | ||||
| 2026-02-10 | 13F | Amica Mutual Insurance Co | 15.726 | 21,90 | 1 | 0,00 | ||||
| 2026-02-10 | 13F | Baker Avenue Asset Management, LP | 3.509 | 301 | ||||||
| 2026-02-19 | 13F | CI Private Wealth, LLC | 32.927 | 522,56 | 1.640 | 269,98 | ||||
| 2026-01-07 | 13F | Aventura Private Wealth, LLC | 10 | 0,00 | 1 | |||||
| 2026-01-22 | 13F | Massachusetts Financial Services Co /ma/ | 15.540.471 | -14,96 | 1.332.595 | -12,97 | ||||
| 2026-02-17 | 13F | Canada Pension Plan Investment Board | 11.200 | 960 | ||||||
| 2026-02-17 | 13F | Theleme Partners LLP | 2.230.882 | 0,00 | 191.298 | 2,35 | ||||
| 2026-01-29 | 13F | Vanguard Group Inc | 18.628.070 | -2,25 | 1.597.357 | 0,05 | ||||
| 2026-02-05 | 13F | Elyxium Wealth, LLC | 42 | 4 | ||||||
| 2026-04-29 | 13F | American Capital Advisory, LLC | 10 | 100,00 | 1 | |||||
| 2026-02-03 | 13F | Generali Asset Management SPA SGR | 0 | -100,00 | 0 | |||||
| 2026-02-13 | 13F | Nfj Investment Group, Llc | 275 | 0,00 | 24 | 0,00 | ||||
| 2025-11-13 | 13F | Magnetar Financial LLC | 0 | -100,00 | 0 | |||||
| 2026-04-15 | 13F | Trust Co Of Toledo Na /oh/ | 129 | 9 | ||||||
| 2026-02-13 | 13F | USS Investment Management Ltd | 0 | -100,00 | 0 | |||||
| 2026-02-17 | 13F | MIRAE ASSET GLOBAL ETFS HOLDINGS Ltd. | 2.434 | -74,59 | 210 | -73,97 | ||||
| 2026-04-27 | 13F | Ethic Inc. | 7.573 | -40,87 | 524 | -52,28 | ||||
| 2026-02-13 | 13F | Neuberger Berman Group LLC | 1.749.832 | 12,39 | 150.048 | 15,03 | ||||
| 2026-02-05 | 13F | North Dakota State Investment Board | 6.865 | 589 | ||||||
| 2026-02-17 | 13F | Interval Partners, LP | 210.562 | 317,93 | 18.056 | 327,74 | ||||
| 2026-01-12 | 13F | Rialto Wealth Management, LLC | 11 | 10,00 | 1 | |||||
| 2026-02-13 | 13F | NLB Skladi, upravljanje premozenja, d.o.o. | 2.408 | 206 | ||||||
| 2026-02-04 | 13F | Securian Asset Management, Inc | 14.152 | -3,00 | 1.214 | -0,74 | ||||
| 2026-02-17 | 13F | Farringdon Capital, Ltd. | 0 | -100,00 | 0 | |||||
| 2026-01-30 | 13F | Urban Wealth Management, LLC | 0 | -100,00 | 0 | -100,00 | ||||
| 2026-02-12 | 13F | Zevin Asset Management Llc | 107.903 | 4,84 | 9.253 | 115.550,00 | ||||
| 2026-01-30 | 13F | Wealth High Governance Capital Ltda | 122.052 | 10.466 | ||||||
| 2026-02-17 | 13F | Guggenheim Capital Llc | 0 | -100,00 | 0 | |||||
| 2026-04-30 | 13F | Candriam Luxembourg S.C.A. | 16.923 | 7,29 | 1.171 | -13,46 | ||||
| 2026-04-21 | 13F | One Wealth Advisors, LLC | 2.906 | 7,07 | 201 | -13,36 | ||||
| 2026-03-12 | 13F/A | Peak6 Llc | Call | 0 | -100,00 | 0 | -100,00 | |||
| 2026-01-29 | 13F | UBS Group AG | 658.539 | -49,75 | 56.470 | -48,57 | ||||
| 2026-01-21 | 13F | Signature Resources Capital Management, LLC | 29 | 2 | ||||||
| 2026-02-12 | 13F | Triple Frond Partners LLC | 551.153 | 28,04 | 47 | 30,56 | ||||
| 2025-11-05 | 13F | Machina Capital S.a.s. | 0 | -100,00 | 0 | |||||
| 2026-01-30 | 13F | Camden Capital, LLC | 3.940 | 338 | ||||||
| 2026-02-09 | 13F | Roundview Capital LLC | 2.639 | 0,00 | 226 | 2,26 | ||||
| 2026-02-13 | 13F | Kilter Group LLC | 23 | 2 | ||||||
| 2026-02-13 | 13F | Sei Investments Co | 102.049 | 55,37 | 8.751 | 59,03 | ||||
| 2026-02-17 | 13F | Creative Planning | 29.169 | 66,24 | 2.501 | 70,14 | ||||
| 2025-11-14 | 13F | Jain Global LLC | 0 | -100,00 | 0 | |||||
| 2026-02-17 | 13F | Moore Capital Management, Lp | 0 | -100,00 | 0 | |||||
| 2025-11-14 | 13F | Peak6 Llc | 0 | -100,00 | 0 | -100,00 | ||||
| 2026-02-10 | 13F | Daiwa Securities Group Inc. | 100.045 | 15,80 | 9 | 14,29 | ||||
| 2026-04-29 | 13F | Oregon Public Employees Retirement Fund | 39.440 | 2,07 | 2.729 | -17,66 | ||||
| 2026-02-11 | 13F | Egerton Capital (UK) LLP | 0 | -100,00 | 0 | |||||
| 2026-02-13 | 13F | Diametric Capital, LP | 2.342 | 201 | ||||||
| 2026-02-23 | 13F | Kera Capital Partners, Inc. | 7.124 | 166,42 | 563 | 150,89 | ||||
| 2026-04-24 | 13F | Root Financial Partners, LLC | 1.104 | 286,01 | 76 | 216,67 | ||||
| 2026-02-17 | 13F | Bank Of America Corp /de/ | 1.323.620 | -2,07 | 113.500 | 0,24 | ||||
| 2026-04-15 | 13F | Addenda Capital Inc. | 131.113 | 6,00 | 9.072 | -14,47 | ||||
| 2026-02-13 | 13F | Platinum Investment Management Ltd | 44.595 | -92,74 | 3.824 | -92,57 | ||||
| 2026-02-12 | 13F | Brinker Capital Investments, LLC | 14.125 | -9,97 | 1.211 | -7,84 | ||||
| 2026-02-10 | 13F | National Pension Service | 9.207 | 62,12 | 790 | 66,11 | ||||
| 2026-02-11 | 13F | Erste Asset Management GmbH | 0 | 0 | ||||||
| 2026-02-11 | 13F | Simplex Trading, Llc | Put | 1.200 | -82,86 | 103 | ||||
| 2026-04-22 | 13F | Caldwell Trust Co | 2.000 | 0,00 | 138 | -19,30 | ||||
| 2026-04-24 | 13F | Sumitomo Mitsui DS Asset Management Company, Ltd | 19.301 | 0,03 | 1.335 | -19,29 | ||||
| 2026-04-16 | 13F | E. Ohman J:or Asset Management AB | 6.900 | 0,00 | 477 | -19,29 | ||||
| 2026-02-11 | 13F | Simplex Trading, Llc | 450 | -82,66 | 39 | |||||
| 2026-02-11 | 13F | Simplex Trading, Llc | Call | 5.300 | 1,92 | 454 | ||||
| 2026-02-09 | 13F | Jefferies Financial Group Inc. | 13.175 | -41,44 | 1.130 | -40,11 | ||||
| 2026-02-09 | 13F | Geode Capital Management, Llc | 3.520.417 | 0,69 | 301.012 | 3,08 | ||||
| 2026-02-13 | 13F | Mml Investors Services, Llc | 10.101 | -0,58 | 866 | 1,76 | ||||
| 2026-02-17 | 13F | Summit Trail Advisors, Llc | 25.220 | 103,88 | 2.163 | 108,69 | ||||
| 2026-02-12 | 13F | Commonwealth Equity Services, Llc | 103.190 | -2,17 | 8.849 | 110.500,00 | ||||
| 2026-04-20 | 13F | Kestra Private Wealth Services, Llc | 0 | -100,00 | 0 | |||||
| 2026-04-30 | 13F | ASR Vermogensbeheer N.V. | 24.938 | 1,69 | 1.726 | -17,94 | ||||
| 2026-02-17 | 13F | Bayesian Capital Management, LP | 0 | -100,00 | 0 | |||||
| 2026-04-27 | 13F | Fjarde Ap-fonden /fourth Swedish National Pension Fund | 71.517 | 88,86 | 4.948 | 52,39 | ||||
| 2026-02-04 | 13F | Empire Life Investments Inc. | 122.101 | -32,11 | 10.470 | -30,51 | ||||
| 2025-12-01 | 13F/A | Polar Asset Management Partners Inc. | 0 | -100,00 | 0 | -100,00 | ||||
| 2026-02-17 | 13F | Ancora Advisors, LLC | 365 | 31 | ||||||
| 2026-01-26 | 13F | Mirae Asset Global Investments Co., Ltd. | 1.425 | 8,45 | 122 | 10,91 | ||||
| 2026-02-11 | 13F | Fox Run Management, L.l.c. | 0 | -100,00 | 0 | |||||
| 2026-02-13 | 13F | First Trust Advisors Lp | 37.226 | -49,40 | 3.192 | -48,21 | ||||
| 2026-02-09 | 13F | CBIZ Investment Advisory Services, LLC | 53 | -25,35 | 5 | -20,00 | ||||
| 2026-04-20 | 13F | State of Alaska, Department of Revenue | 19.015 | -0,78 | 1 | 0,00 | ||||
| 2026-02-12 | 13F | Federation des caisses Desjardins du Quebec | 6.769 | -79,07 | 580 | -78,59 | ||||
| 2026-02-13 | 13F | Taproot Management LP | 110.320 | 9.460 | ||||||
| 2026-02-13 | 13F | Vontobel Holding Ltd. | 13.979 | 16,81 | 1.199 | 19,56 | ||||
| 2026-01-28 | 13F | Salomon & Ludwin, LLC | 0 | -100,00 | 0 | |||||
| 2026-04-23 | 13F | iA Global Asset Management Inc. | 4.885 | -2,36 | 0 | |||||
| 2026-02-17 | 13F | Raymond James Financial Inc | 187.600 | 9,41 | 16.087 | 11,98 | ||||
| 2026-04-15 | 13F | Fortitude Family Office, LLC | 66 | 135,71 | 5 | 100,00 | ||||
| 2026-02-17 | 13F | Citadel Advisors Llc | 156.084 | -76,53 | 13.384 | -75,98 | ||||
| 2026-04-22 | 13F | Larry Mathis Financial Planning, LLC | 5.199 | 5,37 | 360 | -15,13 | ||||
| 2026-02-10 | 13F | Nomura Asset Management Co Ltd | 61.869 | 0,69 | 5.305 | 3,07 | ||||
| 2026-02-10 | 13F | Gulf International Bank (UK) Ltd | 9.294 | 0,00 | 1 | |||||
| 2026-02-17 | 13F | Citadel Advisors Llc | Put | 18.500 | -27,45 | 1.586 | -25,75 | |||
| 2026-02-17 | 13F | Citadel Advisors Llc | Call | 264.700 | 13,61 | 22.698 | 16,28 | |||
| 2026-02-12 | 13F | Steward Partners Investment Advisory, Llc | 55 | -22,54 | 5 | -20,00 | ||||
| 2026-04-24 | 13F | IFM Investors Pty Ltd | 44.022 | 5,76 | 3.046 | 101.400,00 | ||||
| 2026-04-29 | 13F | Klp Kapitalforvaltning As | 69.700 | 0,00 | 4.823 | -19,31 | ||||
| 2026-02-04 | 13F | Plato Investment Management Ltd | 54 | 0,00 | 5 | 0,00 | ||||
| 2026-02-03 | 13F | Bokf, Na | 14.679 | -27,43 | 1.259 | -25,74 | ||||
| 2026-04-28 | 13F | Whittier Trust Co | 0 | -100,00 | 0 | |||||
| 2026-04-09 | 13F | Nelson, Van Denburg & Campbell Wealth Management Group, LLC | 0 | -100,00 | 0 | |||||
| 2026-02-20 | 13F | Sunbelt Securities, Inc. | 31 | 3 | ||||||
| 2026-02-17 | 13F | Susquehanna Fundamental Investments, Llc | 179.077 | 1.559,81 | 15.356 | 1.600,44 | ||||
| 2026-04-27 | 13F | Truist Financial Corp | 16.279 | -4,90 | 1.126 | -23,24 | ||||
| 2026-04-23 | 13F | Lansforsakringar Fondforvaltning AB (publ) | 57.628 | -7,33 | 3.987 | -25,23 | ||||
| 2026-02-04 | 13F | Swiss Life Asset Management Ltd | 37.418 | 1,26 | 3.209 | 3,65 | ||||
| 2026-02-04 | 13F | Clark Wealth Partners | 0 | -100,00 | 0 | -100,00 | ||||
| 2026-02-09 | 13F | Vulcan Value Partners, LLC | 1.062.584 | 91 | ||||||
| 2026-04-21 | 13F | Venturi Wealth Management, LLC | 0 | -100,00 | 0 | |||||
| 2025-11-14 | 13F | Balyasny Asset Management Llc | 0 | -100,00 | 0 | |||||
| 2026-01-16 | 13F | FNY Investment Advisers, LLC | 0 | -100,00 | 0 | |||||
| 2025-11-14 | 13F | Balyasny Asset Management Llc | Call | 0 | -100,00 | 0 | ||||
| 2026-01-15 | 13F | Allspring Global Investments Holdings, LLC | 294.107 | -35,27 | 24.508 | -34,43 | ||||
| 2026-02-05 | 13F | DnB Asset Management AS | 41.616 | -12,69 | 3.569 | -10,64 | ||||
| 2026-02-12 | 13F | Penserra Capital Management LLC | 1.057 | -0,94 | 0 | |||||
| 2026-04-29 | 13F | R Squared Ltd | 3.026 | 209 | ||||||
| 2026-01-16 | 13F | FNY Investment Advisers, LLC | Call | 0 | -100,00 | 0 | ||||
| 2026-04-17 | 13F | Brown, Lisle/cummings, Inc. | 27 | 2 | ||||||
| 2026-02-17 | 13F | Freestone Grove Partners LP | 20.423 | 1.751 | ||||||
| 2026-02-17 | 13F | Russell Investments Group, Ltd. | 647.499 | 9,01 | 55.563 | 11,63 | ||||
| 2026-04-28 | 13F | Everence Capital Management Inc | 5.781 | 34,13 | 0 | |||||
| 2026-02-12 | 13F | Johnson Financial Group, Inc. | 32 | 0,00 | 3 | 0,00 | ||||
| 2026-02-05 | 13F | Northwestern Mutual Investment Management Company, Llc | 43.449 | 0,06 | 3.726 | 2,42 | ||||
| 2026-02-17 | 13F | Farallon Capital Management Llc | 675.000 | -85,74 | 57.881 | -85,40 | ||||
| 2026-04-16 | 13F | Evolve Private Wealth, Llc | 5.689 | 64,37 | 394 | 32,77 | ||||
| 2026-05-01 | 13F | Thrivent Financial For Lutherans | 55.185 | -63,17 | 4 | -75,00 | ||||
| 2026-01-15 | 13F | J. Safra Sarasin Holding AG | 6.554 | 4,88 | 562 | 7,46 | ||||
| 2026-02-12 | 13F | Bradley Foster & Sargent Inc/ct | 0 | -100,00 | 0 | |||||
| 2026-04-30 | 13F | Mv Capital Management, Inc. | 21 | 110,00 | 1 | |||||
| 2026-02-11 | 13F | Deutsche Bank Ag\ | 622.745 | -1,21 | 53.400 | 1,12 | ||||
| 2026-04-03 | 13F | Adirondack Trust Co | 0 | -100,00 | 0 | |||||
| 2026-02-12 | 13F | Callan Family Office, LLC | 10.731 | 174,66 | 920 | 181,35 | ||||
| 2026-02-17 | 13F | Signature Equity Partners, LLC | 15 | 1 | ||||||
| 2026-04-20 | 13F | Louisiana State Employees Retirement System | 55.800 | 3,91 | 3.861 | -16,16 | ||||
| 2026-02-17 | 13F | Jump Financial, LLC | 0 | -100,00 | 0 | |||||
| 2026-04-27 | 13F | Td Private Client Wealth Llc | 172 | -25,54 | 12 | -42,11 | ||||
| 2026-01-22 | 13F | CCLA Investment Management Ltd | 1.548.239 | -8,30 | 133 | -6,38 | ||||
| 2026-04-24 | 13F | UMA Financial Services, Inc. | 449 | -11,26 | 31 | -27,91 | ||||
| 2026-02-03 | 13F/A | Bank Of America Corp /de/ | Put | 0 | -100,00 | 0 | -100,00 | |||
| 2026-04-16 | 13F | Brookstone Capital Management | 137.087 | 5,46 | 9.485 | -14,90 | ||||
| 2026-02-17 | 13F | Two Sigma Securities, Llc | 0 | -100,00 | 0 | |||||
| 2026-02-09 | 13F | Quest Partners LLC | 1.091 | 0,00 | 94 | 2,20 | ||||
| 2026-04-17 | 13F | Western Pacific Wealth Management, LP | 1.035 | -25,38 | 72 | -39,83 | ||||
| 2026-02-17 | 13F | Lansing Management LP | 219.993 | 6,40 | 18.864 | 8,90 | ||||
| 2026-02-17 | 13F | Wellington Management Group Llp | 11.718.762 | -1,99 | 1.004.884 | 0,31 | ||||
| 2026-02-12 | 13F | Dundas Partners LLP | 4.122 | 0,00 | 353 | 2,32 | ||||
| 2026-04-10 | 13F | Oak Thistle LLC | 2.911 | 201 | ||||||
| 2026-02-13 | 13F | Osmosis Investment Management UK Ltd | 8.588 | 736 | ||||||
| 2026-02-11 | 13F | Vestcor Inc | 28.765 | 664,01 | 2 | |||||
| 2026-02-09 | 13F | Harbour Investments, Inc. | 314 | 28,16 | 27 | 30,00 | ||||
| 2025-11-14 | 13F | Lombard Odier Asset Management (Europe) Ltd | 0 | -100,00 | 0 | |||||
| 2026-02-09 | 13F | Keating Financial Advisory Services, Inc. | 126 | 11 | ||||||
| 2026-02-11 | 13F | Winnow Wealth Llc | 0 | -100,00 | 0 | |||||
| 2026-02-17 | 13F | ExodusPoint Capital Management, LP | 0 | -100,00 | 0 | -100,00 | ||||
| 2026-02-09 | 13F | Financial Advisory Corp /ut/ /adv | 7.156 | 11,57 | 1 | |||||
| 2026-02-13 | 13F | Hudson Bay Capital Management LP | 0 | -100,00 | 0 | |||||
| 2026-04-06 | 13F | Versant Capital Management, Inc | 2.729 | -35,73 | 189 | -48,35 | ||||
| 2026-02-05 | 13F | Atria Investments Llc | 6.483 | 1,90 | 556 | 4,13 | ||||
| 2026-02-17 | 13F | Dark Forest Capital Management Lp | 0 | -100,00 | 0 | -100,00 | ||||
| 2026-02-10 | 13F | Forsta Ap-fonden | 43.500 | -3,12 | 3.730 | -0,82 | ||||
| 2026-01-07 | 13F | Permanent Capital Management, LP | 3.946 | 6,88 | 338 | 9,39 | ||||
| 2026-02-09 | 13F | Catalyst Funds Management Pty Ltd | 26.320 | -29,09 | 2.257 | -27,44 | ||||
| 2026-02-10 | 13F | Natixis Advisors, L.p. | 25.968 | 11,01 | 2 | 100,00 | ||||
| 2026-04-16 | 13F | Triad Wealth Partners, LLC | 0 | -100,00 | 0 | |||||
| 2026-02-11 | 13F | Havemeyer Place LP | 16.419 | 1.408 | ||||||
| 2026-01-23 | 13F | Rsm Us Wealth Management Llc | 6.689 | 582 | ||||||
| 2026-02-12 | 13F | Ci Investments Inc. | 0 | -100,00 | 0 | |||||
| 2026-02-03 | 13F | S-Bank Fund Management Ltd | 412 | 3,00 | 35 | 6,06 | ||||
| 2026-02-17 | 13F | DZ BANK AG Deutsche Zentral Genossenschafts Bank, Frankfurt am Main | 69.798 | -54,26 | 5.985 | -53,18 | ||||
| 2025-11-14 | 13F | Prana Capital Management, LP | 0 | -100,00 | 0 | |||||
| 2026-02-10 | 13F | Principia Wealth Advisory, LLC | 14 | 133,33 | 1 | |||||
| 2026-02-12 | 13F | JPL Wealth Management, LLC | 0 | -100,00 | 0 | |||||
| 2026-04-29 | 13F | WPG Advisers, LLC | 158 | -16,84 | 11 | -37,50 | ||||
| 2026-02-02 | 13F | Benjamin Edwards Inc | 9.925 | -4,09 | 851 | -1,73 | ||||
| 2026-02-12 | 13F | Brown Brothers Harriman & Co | 184 | -72,70 | 16 | -73,21 | ||||
| 2026-04-23 | 13F | Marquette Asset Management, LLC | 23 | 283,33 | 2 | |||||
| 2026-01-28 | 13F | B. Metzler seel. Sohn & Co. AG | 9.160 | -56,51 | 785 | -55,50 | ||||
| 2026-02-10 | 13F | Envestnet Asset Management Inc | 399.950 | -3,53 | 34.296 | -1,27 | ||||
| 2026-02-06 | 13F | HighTower Advisors, LLC | 8.472 | 128,66 | 726 | 134,19 | ||||
| 2026-02-10 | 13F | Measured Wealth Private Client Group, LLC | 358 | -17,70 | 31 | -16,67 | ||||
| 2026-04-16 | 13F | Capital Advisors, Ltd. LLC | 28 | 0,00 | 0 | |||||
| 2026-02-13 | 13F | Quarry LP | 0 | -100,00 | 0 | |||||
| 2026-02-14 | 13F | Taikang Asset Management (Hong Kong) Co Ltd | 4.223 | -68,83 | 362 | -68,11 | ||||
| 2026-04-28 | 13F | Alberta Investment Management Corp | 0 | -100,00 | 0 | |||||
| 2026-02-10 | 13F | Kentucky Retirement Systems | 12.238 | 0,00 | 1.049 | 2,34 | ||||
| 2026-02-13 | 13F | Bank Of Nova Scotia | 5.942 | 510 | ||||||
| 2026-04-27 | 13F | Board of the Pension Protection Fund | 0 | -100,00 | 0 | |||||
| 2026-02-11 | 13F | SOUTH STATE Corp | 0 | -100,00 | 0 | |||||
| 2026-02-13 | 13F | State Street Corp | 6.832.003 | 0,74 | 585.844 | 3,11 | ||||
| 2025-11-14 | 13F | Qube Research & Technologies Ltd | 0 | -100,00 | 0 | -100,00 | ||||
| 2025-11-14 | 13F | LTS One Management LP | 0 | -100,00 | 0 | |||||
| 2026-04-30 | 13F | Mn Services Vermogensbeheer B.V. | 74.800 | 0,00 | 5 | -16,67 | ||||
| 2026-02-10 | 13F | Fideuram Asset Management (Ireland) dac | 170 | 15 | ||||||
| 2026-01-29 | 13F | Comerica Bank | 52.975 | -87,64 | 4.543 | -87,36 | ||||
| 2026-04-23 | 13F | SJS Investment Consulting Inc. | 393 | -56,43 | 27 | -64,94 | ||||
| 2026-02-10 | 13F | Private Wealth Asset Management, LLC | 2 | 0,00 | 0 | |||||
| 2026-02-17 | 13F | Two Sigma Investments, Lp | 21.110 | 83,41 | 1.810 | 87,76 | ||||
| 2026-02-05 | 13F | Applied Finance Capital Management, LLC | 4.372 | 375 | ||||||
| 2026-01-29 | 13F | State Of Michigan Retirement System | 45.900 | -1,08 | 3.936 | 1,23 | ||||
| 2026-02-11 | 13F | Capital International Sarl | 0 | -100,00 | 0 | |||||
| 2026-04-28 | 13F | Quent Capital, LLC | 160 | 433,33 | 11 | 450,00 | ||||
| 2026-04-24 | 13F | Ninety One SA (PTY) Ltd | 5.278 | -9,93 | 354 | -29,68 | ||||
| 2026-02-11 | 13F | Metis Global Partners, LLC | 2.526 | -65,21 | 217 | -64,47 | ||||
| 2026-02-11 | 13F | Livforsakringsbolaget Skandia, Omsesidigt | 1.400 | 0,00 | 120 | 2,56 | ||||
| 2026-02-12 | 13F | BRYN MAWR TRUST Co | 0 | -100,00 | 0 | -100,00 | ||||
| 2026-04-28 | 13F | Handelsbanken Fonder AB | 66.300 | 28,49 | 5 | 0,00 | ||||
| 2026-02-17 | 13F | Investment Management Corp of Ontario | 13.146 | 43,77 | 1.127 | 47,13 | ||||
| 2026-02-12 | 13F | Principal Securities, Inc. | 0 | -100,00 | 0 | -100,00 | ||||
| 2026-02-11 | 13F | Capital International Ltd /ca/ | 0 | -100,00 | 0 | |||||
| 2026-04-10 | 13F/A | OP Asset Management Ltd | 20.102 | -9,67 | 1.391 | -27,15 | ||||
| 2026-04-08 | 13F | Legacy Wealth Asset Management, LLC | 8.848 | 1,10 | 612 | -18,40 | ||||
| 2026-02-12 | 13F | CIBC Private Wealth Group, LLC | 341.669 | -7,21 | 29.298 | -5,03 | ||||
| 2026-04-07 | 13F | Signaturefd, Llc | 857 | 8,89 | 59 | -11,94 | ||||
| 2026-02-11 | 13F | Prudential Plc | 16.460 | 0,00 | 1.411 | 2,32 | ||||
| 2026-02-17 | 13F | Point72 Asset Management, L.P. | Call | 508.400 | 127,57 | 43.595 | 132,93 | |||
| 2026-04-24 | 13F | Strs Ohio | 4.662 | -0,15 | 323 | -19,50 | ||||
| 2026-02-11 | 13F | Meeder Advisory Services, Inc. | 3.421 | 293 | ||||||
| 2026-04-06 | 13F | Highline Wealth Partners Llc | 8 | 1 | ||||||
| 2026-02-11 | 13F | Advocacy Wealth Management Services, LLC | 12.491 | -7,04 | 1.071 | -4,80 | ||||
| 2026-01-06 | 13F | Tucker Asset Management Llc | 0 | -100,00 | 0 | |||||
| 2026-02-13 | 13F | Charles Schwab Investment Management Inc | 750.759 | 2,86 | 64.378 | 5,27 | ||||
| 2026-04-27 | 13F | Qrg Capital Management, Inc. | 3.491 | -27,36 | 242 | -41,50 | ||||
| 2026-02-13 | 13F | Ieq Capital, Llc | 10.551 | -55,03 | 905 | -53,99 | ||||
| 2026-04-15 | 13F | NorthAvenue LLC | 0 | -100,00 | 0 | |||||
| 2026-04-30 | 13F | Teacher Retirement System Of Texas | 2.902 | -55,04 | 201 | -63,83 | ||||
| 2026-02-13 | 13F | Thornburg Investment Management Inc | 198.186 | -1,37 | 16.994 | 0,95 | ||||
| 2026-02-04 | 13F | C WorldWide Group Holding A/S | 126.639 | -1,44 | 11 | 0,00 | ||||
| 2025-11-06 | 13F | Costello Asset Management, INC | 0 | -100,00 | 0 | |||||
| 2026-02-13 | 13F | Oakum Bay Capital LLC | 42.004 | 3.602 | ||||||
| 2026-04-29 | 13F | CVA Family Office, LLC | 245 | 222,37 | 17 | 166,67 | ||||
| 2026-04-29 | 13F | Cary Street Partner Investment Advisory Llc | 3.770 | 15,93 | 261 | -6,47 | ||||
| 2026-04-14 | 13F | Zrc Wealth Management, Llc | 43 | -38,57 | 3 | -66,67 | ||||
| 2026-02-06 | 13F | Abn Amro Investment Solutions | 12.668 | 150,06 | 1.086 | 156,13 | ||||
| 2026-04-22 | 13F | Pictet Asset Management Holding SA | 1.444.947 | -28,59 | 99.892 | -42,45 | ||||
| 2026-02-10 | 13F | Eurizon Capital SGR S.p.A. | 25.872 | 2.220 | ||||||
| 2026-02-17 | 13F | Advisor Group Holdings, Inc. | 13.669 | -55,50 | 1.172 | -54,54 | ||||
| 2026-04-29 | 13F | Hughes Financial Services, LLC | 4 | 0 | ||||||
| 2026-02-17 | 13F | Hunting Hill Global Capital, LLC | 5.040 | 0,00 | 432 | 2,37 | ||||
| 2026-02-17 | 13F | SummitTX Capital, L.P. | 11.046 | 947 | ||||||
| 2026-02-10 | 13F | Commonwealth Of Pennsylvania Public School Empls Retrmt Sys | 48.597 | -2,80 | 4.167 | -0,50 | ||||
| 2026-04-17 | 13F | Fifth Third Wealth Advisors LLC | 5.737 | 7,35 | 397 | -13,54 | ||||
| 2026-02-13 | 13F | Kayne Anderson Rudnick Investment Management Llc | 482.080 | -2,46 | 41.338 | -0,17 | ||||
| 2026-02-10 | 13F | Td Asset Management Inc | 522.845 | 0,26 | 44.834 | 2,62 | ||||
| 2026-02-12 | 13F | Adviser Investments LLC | 2.827 | 242 | ||||||
| 2026-02-17 | 13F | Delaware Management Holdings, Inc. | 89.922 | 7.711 | ||||||
| 2026-02-13 | 13F | Integrated Wealth Concepts LLC | 0 | -100,00 | 0 | |||||
| 2026-02-05 | 13F | Canada Post Corp Registered Pension Plan | 61.377 | 11,20 | 5.263 | 11,88 | ||||
| 2026-02-17 | 13F | California State Teachers Retirement System | 347.699 | 0,91 | 29.815 | 3,28 | ||||
| 2026-02-13 | 13F | Smartleaf Asset Management LLC | 748 | 14,90 | 65 | 18,18 | ||||
| 2025-11-13 | 13F | EntryPoint Capital, LLC | 0 | -100,00 | 0 | |||||
| 2026-02-12 | 13F | Aviva Plc | 163.674 | 5,43 | 14.035 | 7,91 | ||||
| 2026-02-13 | 13F | Mariner, LLC | 26.649 | 7,35 | 2.286 | 9,91 | ||||
| 2026-02-17 | 13F | Jones Financial Companies Lllp | 5.603 | 3,80 | 480 | 4,80 | ||||
| 2026-02-05 | 13F | Spear Holdings RSC Ltd | 607.934 | -57,92 | 52.130 | -56,93 | ||||
| 2026-02-12 | 13F | Bank Of Montreal /can/ | 24.531 | 5,86 | 2.104 | 8,35 | ||||
| 2026-04-27 | 13F | Greenleaf Trust | 7.126 | -14,15 | 493 | -30,66 | ||||
| 2026-02-13 | 13F | Transamerica Financial Advisors, Inc. | 10 | 1 | ||||||
| 2026-02-17 | 13F | Boothbay Fund Management, Llc | 19.329 | -8,93 | 1.657 | -6,81 | ||||
| 2026-02-17 | 13F | Tcw Group Inc | 4.903 | 420 | ||||||
| 2026-04-15 | 13F | Avanza Fonder AB | 14.366 | 0,00 | 994 | -19,33 | ||||
| 2026-04-30 | 13F | Nuveen, LLC | 439.722 | -26,81 | 30.424 | -40,95 | ||||
| 2026-01-29 | 13F | Teachers Retirement System Of The State Of Kentucky | 60.000 | 0,00 | 5 | 0,00 | ||||
| 2026-04-21 | 13F | Red Tortoise LLC | 102 | 0,00 | 7 | -12,50 | ||||
| 2026-04-29 | 13F | Cary Street Partners Financial Llc | 809 | -26,72 | 56 | -41,49 | ||||
| 2026-02-11 | 13F | Cerity Partners LLC | 33.775 | 45,71 | 2.896 | 49,20 | ||||
| 2026-02-13 | 13F | Squarepoint Ops LLC | Call | 4.600 | -56,19 | 394 | -55,18 | |||
| 2026-04-20 | 13F | Inscription Capital, LLC | 0 | -100,00 | 0 | |||||
| 2026-02-13 | 13F | Squarepoint Ops LLC | 610.868 | 52.382 | ||||||
| 2026-01-23 | 13F | Optima Capital Llc | 1 | 0 | ||||||
| 2026-02-17 | 13F | Engineers Gate Manager LP | 0 | -100,00 | 0 | |||||
| 2026-02-13 | 13F | Colony Group, LLC | 23.382 | 2.005 | ||||||
| 2026-02-13 | 13F | Morgan Stanley | 7.976.665 | -3,99 | 683.999 | -1,73 | ||||
| 2026-04-07 | 13F | Farther Finance Advisors, LLC | 1.132 | 8,43 | 78 | -13,48 | ||||
| 2026-05-01 | 13F | Rakuten Securities, Inc. | 0 | -100,00 | 0 | |||||
| 2026-02-13 | 13F | BRITISH COLUMBIA INVESTMENT MANAGEMENT Corp | 34.573 | 23,28 | 2.965 | 26,18 | ||||
| 2026-02-13 | 13F | Dodge & Cox | 9.842.006 | 843.952 | ||||||
| 2025-11-07 | 13F | Amica Retiree Medical Trust | 1.234 | 0,00 | 0 | |||||
| 2026-04-21 | 13F | Pallas Capital Advisors LLC | 3.590 | 248 | ||||||
| 2026-05-01 | 13F | Hantz Financial Services, Inc. | 5.676 | -18,90 | 0 | |||||
| 2026-04-20 | 13F | Jfs Wealth Advisors, Llc | 108 | 6,93 | 7 | -12,50 | ||||
| 2026-01-30 | 13F | AMG National Trust Bank | 0 | -100,00 | 0 | |||||
| 2026-02-06 | 13F | Kingdom Financial Group LLC. | 31 | 3 | ||||||
| 2026-02-06 | 13F | Meiji Yasuda Asset Management Co Ltd. | 4.908 | -1,21 | 421 | 0,96 | ||||
| 2026-02-18 | 13F | Mackenzie Financial Corp | 38.979 | -68,64 | 3.384 | -67,50 | ||||
| 2026-04-24 | 13F | Retirement Systems of Alabama | 350.672 | 0,80 | 24.263 | -18,67 | ||||
| 2026-02-17 | 13F | Bamco Inc /ny/ | 813.353 | -1,11 | 69.745 | 1,22 | ||||
| 2026-02-04 | 13F | Mirabaud Asset Management Ltd | 76.844 | 49,32 | 7.221 | 64,64 | ||||
| 2026-02-11 | 13F | Syon Capital Llc | 6.758 | 579 | ||||||
| 2026-04-28 | 13F | Harbor Capital Advisors, Inc. | 10.127 | 44,20 | 1 | |||||
| 2026-04-08 | 13F | Eagle Rock Investment Company, Llc | 0 | -100,00 | 0 | |||||
| 2026-04-15 | 13F | Financial Management Professionals, Inc. | 0 | -100,00 | 0 | |||||
| 2026-02-13 | 13F | Rhumbline Advisers | 528.387 | -1,61 | 45.309 | 0,71 | ||||
| 2026-02-17 | 13F | Ilex Capital Partners (UK) LLP | 803.217 | 64,43 | 68.876 | 68,30 | ||||
| 2026-02-05 | 13F | High Note Wealth, LLC | 76 | 7 | ||||||
| 2026-02-17 | 13F | Perbak Capital Partners LLP | 3.562 | 305 | ||||||
| 2026-02-05 | 13F | Bessemer Group Inc | 3.768.902 | 5,77 | 323 | 8,39 | ||||
| 2026-02-11 | 13F | LPL Financial LLC | 48.745 | -8,51 | 4.180 | -6,36 | ||||
| 2026-01-30 | 13F/A | M&t Bank Corp | 36.066 | 61,32 | 3.092 | 65,08 | ||||
| 2026-02-13 | 13F | Meritage Group LP | 5.334.488 | -2,44 | 457.432 | -0,15 | ||||
| 2026-04-14 | 13F | Bay Harbor Wealth Management, LLC | 28 | 47,37 | 2 | 0,00 | ||||
| 2026-02-10 | 13F | Norges Bank | 1.038.710 | 89.069 | ||||||
| 2025-11-10 | 13F | Asahi Life Asset Management Co., Ltd. | 0 | -100,00 | 0 | |||||
| 2026-02-12 | 13F | Rossby Financial, LCC | 25 | 2 | ||||||
| 2026-02-10 | 13F/A | Northwestern Mutual Wealth Management Co | 1.484 | -2,18 | 127 | 0,00 | ||||
| 2026-02-10 | 13F | Savant Capital, LLC | 0 | -100,00 | 0 | |||||
| 2026-02-13 | 13F | Milford Funds Ltd | 469.107 | 40.226 | ||||||
| 2026-02-13 | 13F | Seneschal Advisors, LLC | 4 | 0,00 | 0 | |||||
| 2025-11-14 | 13F | Sofos Investments, Inc. | 0 | -100,00 | 0 | |||||
| 2026-04-14 | 13F | Opal Wealth Advisors, LLC | 391 | 27 | ||||||
| 2025-11-12 | 13F | Aptus Capital Advisors, LLC | 0 | -100,00 | 0 | |||||
| 2026-02-17 | 13F | Incline Global Management LLC | 0 | -100,00 | 0 | |||||
| 2026-02-17 | 13F | Holocene Advisors, LP | 153.910 | 266,13 | 13.198 | 274,81 | ||||
| 2026-04-28 | 13F | Westfuller Advisors, LLC | 0 | -100,00 | 0 | |||||
| 2026-02-17 | 13F | Maryland State Retirement & Pension System | 9.537 | 0,00 | 818 | 2,25 | ||||
| 2025-11-12 | 13F | Headlands Technologies LLC | 0 | -100,00 | 0 | |||||
| 2026-02-12 | 13F | Federated Hermes, Inc. | 15.690 | -10,21 | 1.345 | -8,07 | ||||
| 2026-02-17 | 13F | State Of Wisconsin Investment Board | 98.019 | -4,65 | 8.405 | -2,40 | ||||
| 2026-04-23 | 13F | TFC Financial Management | 1 | 0,00 | 0 | |||||
| 2026-02-05 | 13F | Amalgamated Bank | 86.623 | -3,19 | 7 | 0,00 | ||||
| 2026-02-12 | 13F | New York State Common Retirement Fund | 116.712 | -52,09 | 10.008 | -50,96 | ||||
| 2026-02-12 | 13F | Wealthspire Advisors, LLC | 0 | -100,00 | 0 | |||||
| 2026-02-17 | 13F | XTX Topco Ltd | 0 | -100,00 | 0 | |||||
| 2026-02-11 | 13F | CenterBook Partners LP | 87.701 | 7.520 | ||||||
| 2026-02-12 | 13F | Sepio Capital, LP | 9.163 | 3,72 | 786 | 6,08 | ||||
| 2026-02-17 | 13F | Susquehanna Portfolio Strategies, LLC | 0 | -100,00 | 0 | |||||
| 2026-02-24 | 13F | MidFirst Bank | 2.727 | 3 | ||||||
| 2026-04-13 | 13F | Gateway Investment Advisers Llc | 0 | -100,00 | 0 | |||||
| 2026-02-17 | 13F | Susquehanna International Group, Llp | Put | 58.700 | 42,82 | 5.034 | 46,18 | |||
| 2026-01-16 | 13F | Empirical Financial Services, LLC d.b.a. Empirical Wealth Management | 2.722 | 233 | ||||||
| 2026-02-17 | 13F | PDT Partners, LLC | 97.514 | 8.362 | ||||||
| 2026-02-17 | 13F | Susquehanna International Group, Llp | Call | 177.800 | 69,17 | 15.246 | 73,15 | |||
| 2026-02-12 | 13F | Jane Street Group, Llc | Call | 136.900 | 64,94 | 11.739 | 68,83 | |||
| 2026-02-12 | 13F | Jane Street Group, Llc | 8.125 | -89,58 | 697 | -89,34 | ||||
| 2026-02-13 | 13F | Pinnacle Wealth Planning Services, Inc. | 89 | 8 | ||||||
| 2026-02-17 | 13F | Brevan Howard Capital Management LP | 17.754 | 67,47 | 1.522 | 71,40 | ||||
| 2026-02-12 | 13F | Jane Street Group, Llc | Put | 10.500 | -20,45 | 900 | -18,55 | |||
| 2026-02-13 | 13F | OMERS ADMINISTRATION Corp | 140.519 | 16,40 | 12.050 | 19,14 | ||||
| 2026-05-01 | 13F | HFM Investment Advisors, LLC | 6 | -40,00 | 0 | |||||
| 2026-02-17 | 13F | Mirabella Financial Services Llp | 5.463 | 468 | ||||||
| 2026-02-12 | 13F | APG Asset Management N.V. | 114.819 | -96,72 | 8.383 | -96,65 | ||||
| 2026-02-12 | 13F | Qtron Investments LLC | 0 | -100,00 | 0 | |||||
| 2026-02-13 | 13F | Pathstone Holdings, LLC | 12.223 | 2,62 | 1.048 | 5,12 | ||||
| 2026-02-17 | 13F | Susquehanna International Group, Llp | 3.910 | -15,26 | 335 | -13,21 | ||||
| 2026-04-09 | 13F | Arlington Partners LLC | 3.616 | 250 | ||||||
| 2026-04-16 | 13F | BI Asset Management Fondsmaeglerselskab A/S | 8.049 | -11,19 | 1 | |||||
| 2026-02-13 | 13F | Fieldview Capital Management, LLC | 0 | -100,00 | 0 | |||||
| 2026-02-17 | 13F | Blair William & Co/il | 258.976 | -26,95 | 22.207 | -25,23 | ||||
| 2025-11-13 | 13F | Clear Street Markets Llc | 0 | -100,00 | 0 | -100,00 | ||||
| 2026-02-09 | 13F | Morningstar Investment Management LLC | 33.995 | 0,00 | 3 | 0,00 | ||||
| 2026-02-13 | 13F | Ostrum Asset Management | 1.155 | -24,95 | 99 | -22,66 | ||||
| 2026-04-20 | 13F | Banque Cantonale Vaudoise | 12.381 | -24,53 | 856 | -39,16 | ||||
| 2026-04-13 | 13F | Reinhart Partners, Inc. | 98.061 | -7,70 | 6.785 | -25,53 | ||||
| 2026-02-10 | 13F | Basepoint Wealth LLC | 277 | 24 | ||||||
| 2026-02-12 | 13F | Logan Capital Management Inc | 6.709 | -13,16 | 575 | -11,13 | ||||
| 2026-02-05 | 13F | PBCay One RSC Ltd | 607.938 | 52.131 | ||||||
| 2026-01-27 | 13F | Tokio Marine Asset Management Co Ltd | 8.618 | 1,40 | 739 | 3,65 | ||||
| 2026-02-17 | 13F | Cetera Investment Advisers | 27.721 | -2,98 | 2.377 | -0,67 | ||||
| 2026-02-19 | 13F | Invesco Ltd. | 2.789.658 | 5,76 | 239.213 | 8,25 | ||||
| 2026-04-02 | 13F | Ares Financial Consulting, LLC | 23 | 0,00 | 2 | 0,00 | ||||
| 2026-04-23 | 13F | Private Wealth Management Group, LLC | 10 | -9,09 | 1 | |||||
| 2026-04-30 | 13F | Nisa Investment Advisors, Llc | 10.043 | 19,87 | 695 | -3,34 | ||||
| 2026-02-06 | 13F | Covestor Ltd | 1.042 | 41,77 | 0 | |||||
| 2026-04-02 | 13F | Aspect Partners, LLC | 18 | 0,00 | 1 | 0,00 | ||||
| 2026-02-13 | 13F | National Bank Of Canada /fi/ | 3.069 | 108,63 | 263 | 113,01 | ||||
| 2026-03-03 | 13F/A | Integrated Investment Consultants, LLC | 8.659 | -0,87 | 743 | 1,50 | ||||
| 2026-02-06 | 13F | Gables Capital Management Inc. | 116 | 0,00 | 10 | 0,00 | ||||
| 2026-02-13 | 13F | Sunriver Management LLC | 517.921 | 44.412 | ||||||
| 2026-02-13 | 13F | Segall Bryant & Hamill, Llc | 139.866 | -16,09 | 11.993 | -14,11 | ||||
| 2026-04-24 | 13F | ProShare Advisors LLC | 7.716 | -0,92 | 534 | -20,09 | ||||
| 2026-04-24 | 13F | Raiffeisen Bank International AG | 9.281 | 3.553,94 | 617 | 2.704,55 | ||||
| 2026-04-20 | 13F | Assenagon Asset Management S.A. | 8.329 | -2,44 | 576 | -21,31 | ||||
| 2026-02-11 | 13F | Capital International Inc /ca/ | 0 | -100,00 | 0 | |||||
| 2026-02-13 | 13F | Stifel Financial Corp | 47.115 | -3,44 | 4.040 | -1,17 | ||||
| 2026-01-26 | 13F | KBC Group NV | 67.737 | 3,18 | 6 | 0,00 | ||||
| 2026-04-15 | 13F | Hengehold Capital Management Llc | 0 | -100,00 | 0 | |||||
| 2026-02-13 | 13F | SRS Capital Advisors, Inc. | 2.085 | -83,35 | 179 | -83,03 | ||||
| 2026-04-21 | 13F | Robeco Institutional Asset Management B.V. | 0 | -100,00 | 0 | |||||
| 2026-02-11 | 13F | Winton Capital Group Ltd | 0 | -100,00 | 0 | |||||
| 2026-02-12 | 13F | Parnassus Investments /ca | 892.724 | -7,81 | 76.551 | -5,64 | ||||
| 2026-02-09 | 13F | Annis Gardner Whiting Capital Advisors, LLC | 1.036 | -23,37 | 89 | -22,12 | ||||
| 2026-01-27 | 13F | Zurcher Kantonalbank (Zurich Cantonalbank) | 101.987 | 5,19 | 8.745 | 7,66 | ||||
| 2026-02-11 | 13F | Los Angeles Capital Management Llc | 882 | -96,66 | 70 | -96,83 | ||||
| 2026-01-27 | 13F | Evergreen Capital Management Llc | 5.117 | 439 | ||||||
| 2026-02-17 | 13F | Polar Asset Management Partners Inc. | Put | 0 | -100,00 | 0 | -100,00 | |||
| 2026-04-27 | 13F | V-Square Quantitative Management LLC | 3.778 | 9,73 | 261 | -11,53 | ||||
| 2026-02-11 | 13F | Harvest Fund Management Co., Ltd | 10 | 0,00 | 0 | |||||
| 2026-04-16 | 13F | XML Financial, LLC | 14.566 | 1.008 | ||||||
| 2026-02-12 | 13F | Swiss National Bank | 533.800 | -5,09 | 45.773 | -2,85 | ||||
| 2026-02-13 | 13F | Rafferty Asset Management, LLC | 3.264 | -3,03 | 280 | -1,06 | ||||
| 2026-04-10 | 13F | Bdf-gestion | 22.811 | 0,00 | 1.578 | -19,33 | ||||
| 2026-02-17 | 13F | Wiley Bros.-aintree Capital, Llc | 6.887 | 0,76 | 591 | 3,15 | ||||
| 2026-01-30 | 13F | Wealthfront Advisers Llc | 12.053 | 60,51 | 1.034 | 64,23 | ||||
| 2026-02-12 | 13F | UniSuper Management Pty Ltd | 3.300 | -97,23 | 283 | -97,17 | ||||
| 2026-04-07 | 13F | Park Avenue Securities Llc | 6.880 | 0,25 | 0 | |||||
| 2026-02-11 | 13F | Wellspring Financial Advisors, LLC | 9.270 | 795 | ||||||
| 2026-02-17 | 13F | Main Street Financial Solutions, LLC | 11.562 | 16,92 | 991 | 19,69 | ||||
| 2026-02-17 | 13F | Millennium Management Llc | Call | 9.600 | 823 | |||||
| 2026-02-17 | 13F | Millennium Management Llc | 264.649 | -46,78 | 22.694 | -45,53 | ||||
| 2026-02-17 | 13F | Siemens Fonds Invest GmbH | 2.737 | 0,00 | 238 | 3,93 | ||||
| 2026-02-17 | 13F | Nissay Asset Management Corp /japan/ /adv | 24.921 | 1,18 | 2.137 | 3,54 | ||||
| 2026-04-24 | 13F | Ninety One UK Ltd | 3.547.743 | -1,51 | 245.468 | -20,53 | ||||
| 2026-04-16 | 13F | Toth Financial Advisory Corp | 89.226 | -10,47 | 6.174 | -27,76 | ||||
| 2026-01-29 | 13F | Quest 10 Wealth Builders, Inc. | 0 | -100,00 | 0 | |||||
| 2025-11-14 | 13F | Virtu Financial LLC | 0 | -100,00 | 0 | |||||
| 2026-04-13 | 13F | Global X Japan Co., Ltd. | 252 | 6,33 | 17 | -15,00 | ||||
| 2026-01-27 | 13F | Lecap Asset Management Ltd | 0 | -100,00 | 0 | |||||
| 2026-02-10 | 13F | CIBC Asset Management Inc | 8.560 | 2,17 | 734 | 4,71 | ||||
| 2026-02-11 | 13F | Group One Trading, L.p. | Put | 33.800 | 225,00 | 2.898 | 232,72 | |||
| 2026-02-03 | 13F | International Assets Investment Management, Llc | 13 | 1 | ||||||
| 2026-02-06 | 13F | Pnc Financial Services Group, Inc. | 7.330 | 38,41 | 629 | 41,76 | ||||
| 2026-02-11 | 13F | Group One Trading, L.p. | 3.547 | 29,45 | 304 | 32,75 | ||||
| 2026-02-13 | 13F | BNP Paribas Asset Management Holding S.A. | 40.415 | -41,57 | 3 | -40,00 | ||||
| 2026-02-11 | 13F | Group One Trading, L.p. | Call | 85.500 | 152,96 | 7.332 | 158,95 | |||
| 2026-04-30 | 13F | Sequoia Financial Advisors, LLC | 5.896 | -2,64 | 408 | -21,58 | ||||
| 2026-02-10 | 13F | Koss-Olinger Consulting, LLC | 3.046 | -2,99 | 261 | -5,43 | ||||
| 2026-04-13 | 13F | Massmutual Trust Co Fsb/adv | 143 | -62,47 | 10 | -71,87 | ||||
| 2026-02-02 | 13F | Fifth Third Bancorp | 1.780 | 48,83 | 153 | 52,00 | ||||
| 2026-04-08 | 13F | Holos Integrated Wealth LLC | 102 | 0,00 | 7 | -12,50 | ||||
| 2026-02-13 | 13F | Barclays Plc | 257.449 | -22,92 | 22.076 | -21,11 | ||||
| 2025-11-06 | 13F | Johnson Investment Counsel Inc | 0 | -100,00 | 0 | |||||
| 2026-02-04 | 13F | Ameritas Advisory Services, LLC | 0 | -100,00 | 0 | |||||
| 2026-02-13 | 13F | Barclays Plc | Put | 70.000 | 0,00 | 6.002 | 2,35 | |||
| 2026-04-20 | 13F | Ronald Blue Trust, Inc. | 1.314 | -24,96 | 91 | -40,00 | ||||
| 2026-02-09 | 13F | Coldstream Capital Management Inc | 2.489 | 213 | ||||||
| 2025-11-10 | 13F | Sigma Planning Corp | 0 | -100,00 | 0 | |||||
| 2026-02-03 | 13F | Crossmark Global Holdings, Inc. | 6.868 | 6,33 | 589 | 8,69 | ||||
| 2026-02-02 | 13F | Cornerstone Planning Group LLC | 389 | 130,18 | 32 | -31,11 | ||||
| 2026-02-17 | 13F | Concentric Capital Strategies, LP | 0 | -100,00 | 0 | |||||
| 2026-02-17 | 13F | Gotham Asset Management, LLC | 72.093 | 26,49 | 6.182 | 29,45 | ||||
| 2026-04-29 | 13F | Skopos Labs, Inc. | 6.783 | -15,17 | 469 | -32,90 | ||||
| 2026-02-17 | 13F | Quantitative Investment Management, LLC | 24.090 | 2 | ||||||
| 2026-02-03 | 13F | Crestwood Advisors Group LLC | 2.567 | 220 | ||||||
| 2025-11-13 | 13F | Meridiem Capital Partners LP | 0 | -100,00 | 0 | |||||
| 2026-01-28 | 13F | N.E.W. Advisory Services LLC | 65 | 0,00 | 6 | 0,00 | ||||
| 2025-11-17 | 13F | LGT Financial Advisors LLC | 0 | -100,00 | 0 | |||||
| 2026-02-17 | 13F | Schonfeld Strategic Advisors LLC | 632.286 | 1.885,01 | 54.219 | 1.932,16 | ||||
| 2025-11-14 | 13F | Evelyn Partners Investment Management Services Ltd | 0 | -100,00 | 0 | -100,00 | ||||
| 2026-04-21 | 13F | Financial Consulate, Inc | 11 | 1 | ||||||
| 2025-11-07 | 13F | Sierra Ocean, Llc | 0 | -100,00 | 0 | |||||
| 2026-02-17 | 13F | Lazard Asset Management Llc | 0 | -100,00 | 0 | |||||
| 2025-11-04 | 13F | Bridges Investment Management Inc | 0 | -100,00 | 0 | |||||
| 2026-02-17 | 13F | Steadfast Capital Management Lp | 0 | -100,00 | 0 | |||||
| 2026-02-17 | 13F | Toronto Dominion Bank | 31.213 | -1,71 | 2.677 | 0,60 | ||||
| 2026-02-17 | 13F | Woodline Partners LP | 3.590 | 308 | ||||||
| 2025-11-14 | 13F | Teza Capital Management LLC | 0 | -100,00 | 0 | |||||
| 2026-02-17 | 13F | Sherbrooke Park Advisers Llc | 0 | -100,00 | 0 | |||||
| 2026-04-16 | 13F | Aegon Asset Management Uk Plc | 0 | -100,00 | 0 | |||||
| 2026-04-30 | 13F | Kornitzer Capital Management Inc /ks | 129.285 | -14,69 | 8.945 | -31,17 | ||||
| 2026-02-10 | 13F | Intech Investment Management Llc | 0 | -100,00 | 0 | |||||
| 2026-02-17 | 13F | Graham Capital Management, L.P. | 7.033 | 43,38 | 603 | 47,07 | ||||
| 2026-02-17 | 13F | Southpoint Capital Advisors LP | 0 | -100,00 | 0 | -100,00 | ||||
| 2026-01-23 | 13F | Diversify Advisory Services, LLC | 5.428 | -2,72 | 468 | 2,86 | ||||
| 2026-02-04 | 13F | Nicholas Company, Inc. | 255.088 | -0,03 | 21.874 | 2,32 | ||||
| 2026-04-30 | 13F | Verdence Capital Advisors LLC | 0 | -100,00 | 0 | |||||
| 2026-02-12 | 13F | Quadrant Capital Group Llc | 15.544 | 338,97 | 1.333 | 350,00 | ||||
| 2026-01-30 | 13F | Mitsubishi UFJ Trust & Banking Corp | 80.133 | -2,35 | 6.871 | -0,04 | ||||
| 2026-02-13 | 13F | Prudential Financial Inc | 12.931 | -37,67 | 1.109 | -36,25 | ||||
| 2026-02-17 | 13F | Fmr Llc | 4.470.371 | 166,40 | 383.334 | 172,67 | ||||
| 2026-01-07 | 13F | Procyon Private Wealth Partners, LLC | 4.002 | 0,15 | 343 | 2,69 |